3rd Quarter 2026 Financial Review CENTRAL BANCOMPANY October | 2026 Exhibit 99.2
Legal Disclaimer This presentation may contain forward-looking statements within the meaning of, and intended to be covered by, the safe harbor provisions of the Private Securities Litigation Reform Act of 1995. You should not place undue reliance on forward-looking statements because they are subject to numerous uncertainties and factors relating to our operations and business, all of which are difficult to predict and many of which are beyond our control. Forward- looking statements include information concerning our possible or assumed future results of operations, including descriptions of our business strategy. These forward-looking statements are generally identified by the use of forward-looking terminology, including the terms “anticipate,” “believe,” “could,” “estimate,” “expect,” “intend,” “may,” “plan,” “potential,” “predict,” “project,” “should,” “target,” “will,” “would” and, in each case, their negative or other variations or comparable terminology and expressions. All statements other than statements of historical facts contained in this presentation are forward-looking statements. We have based the forward-looking statements contained herein on our current expectations and projections about future events and trends that we believe may affect our business, financial condition, results of operations and prospects. The outcome of the events described in these forward-looking statements is subject to risks, uncertainties and other factors described in “Cautionary Note Regarding Forward-Looking Statements,” Part I Item 1A - "Risk Factors" and Part II Item 7 - "Management's Discussion and Analysis of Financial Condition and Results of Operations" in the Company's 2025 Annual Report on Form 10-K. Moreover, we operate in a very competitive and rapidly changing environment. New risks and uncertainties emerge from time to time, and it is not possible for us to predict all risks and uncertainties that could have an impact on the forward-looking statements. The forward-looking statements relate only to events as of the date on which the statements are made. Our statements should not be read to indicate that we have conducted an exhaustive inquiry into, or review of, all potentially available relevant information. These forward-looking statements are not guarantees of future performance and involve certain risks, uncertainties, and assumptions which are difficult to predict with regard to timing, extent, likelihood and degree of occurrence. Therefore, actual results and outcomes may materially differ from what is expected, implied or forecasted in such forward-looking statements. These forward-looking statements are inherently uncertain and you are cautioned not to unduly rely upon these statements. We undertake no obligation to update any forward-looking statements made in this presentation to reflect events or circumstances after the date of this presentation or to reflect new information or the occurrence of unanticipated events, except as required by law. This presentation includes certain non-GAAP financial measures. This information supplements the results that are reported according to generally accepted accounting principles in the United States (“GAAP”) and should not be viewed in isolation from, or as a substitute for, GAAP results. The differences between the non-GAAP financial measures and the nearest comparable GAAP financial measures are reconciled later in this presentation. We are presenting these non-GAAP financial measures because we believe, when taken collectively, they may be helpful to investors because they provide consistency and comparability with past financial performance by excluding certain items that may not be indicative of our business, results of operations or outlook. Please see Appendix for a reconciliation of the non-GAAP measures to the comparable GAAP measures. Within this presentation, we reference certain industry and sector information and statistics. We have obtained this information and these statistics from various independent, third-party sources. Nothing in the data used or derived from third-party sources should be construed as advice. Some data and other information are also based on our good faith estimates, which are derived from our review of internal surveys and independent sources. We believe that these external sources and estimates are reliable, but we have not independently verified them. Statements as to our market position are based on market data currently available to us. Although we are not aware of any misstatements regarding the demographic, economic, employment, industry and trade association data presented herein, these estimates involve inherent risks and uncertainties and are based on assumptions that are subject to change. 2
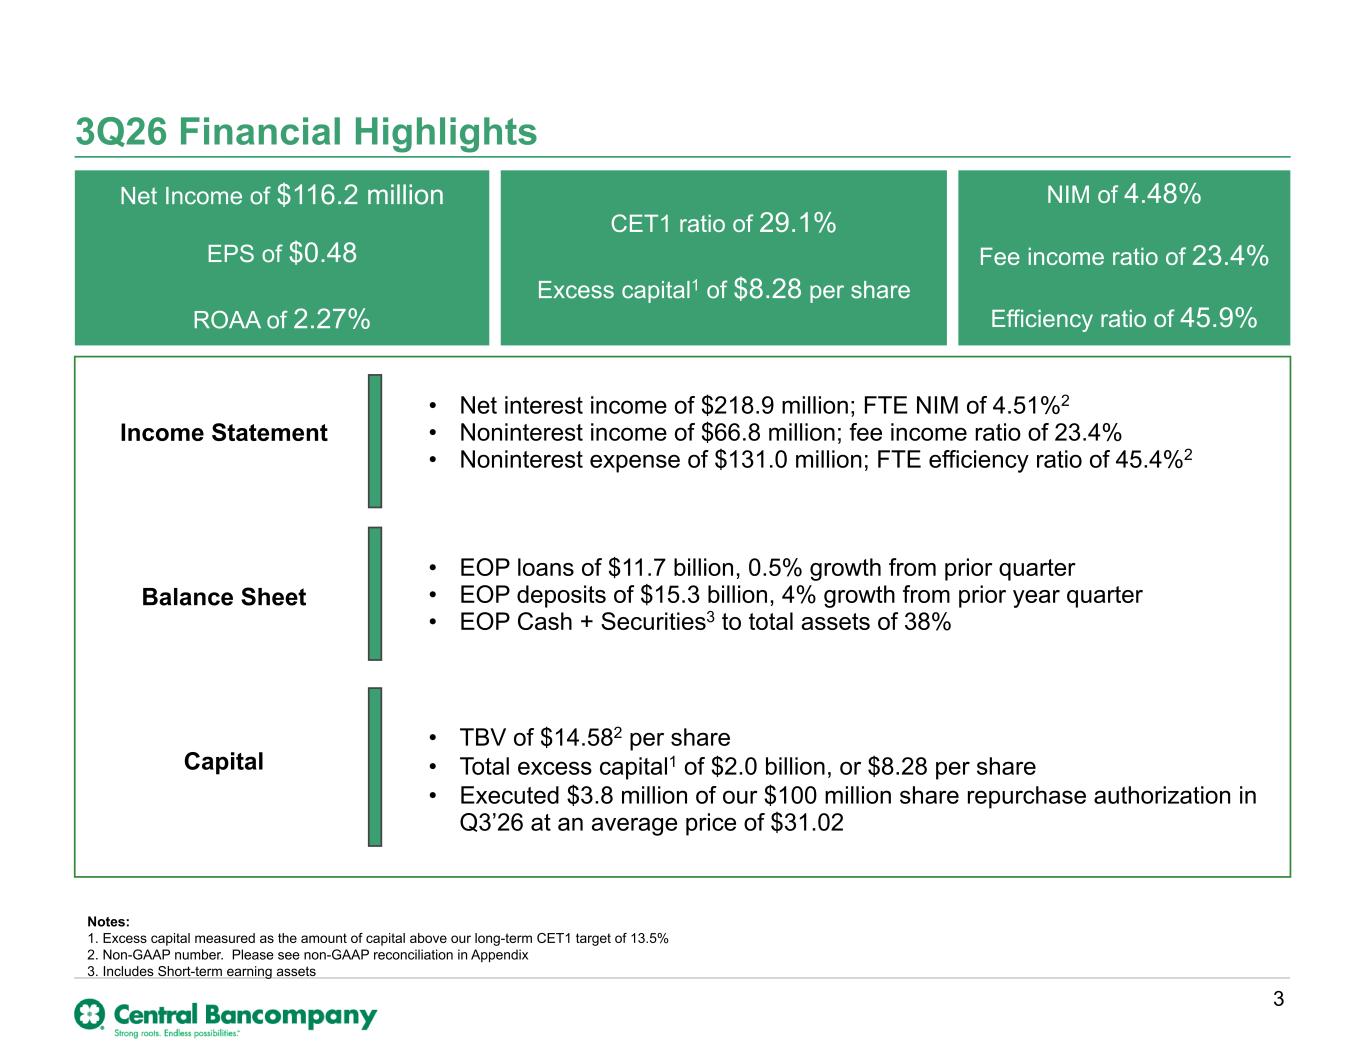
3Q26 Financial Highlights Net Income of $116.2 million EPS of $0.48 ROAA of 2.27% CET1 ratio of 29.1% Excess capital1 of $8.28 per share NIM of 4.48% Fee income ratio of 23.4% Efficiency ratio of 45.9% Income Statement Balance Sheet Capital 3 Notes: 1. Excess capital measured as the amount of capital above our long-term CET1 target of 13.5% 2. Non-GAAP number. Please see non-GAAP reconciliation in Appendix 3. Includes Short-term earning assets • Net interest income of $218.9 million; FTE NIM of 4.51%2 • Noninterest income of $66.8 million; fee income ratio of 23.4% • Noninterest expense of $131.0 million; FTE efficiency ratio of 45.4%2 • EOP loans of $11.7 billion, 0.5% growth from prior quarter • EOP deposits of $15.3 billion, 4% growth from prior year quarter • EOP Cash + Securities3 to total assets of 38% • TBV of $14.582 per share • Total excess capital1 of $2.0 billion, or $8.28 per share • Executed $3.8 million of our $100 million share repurchase authorization in Q3’26 at an average price of $31.02
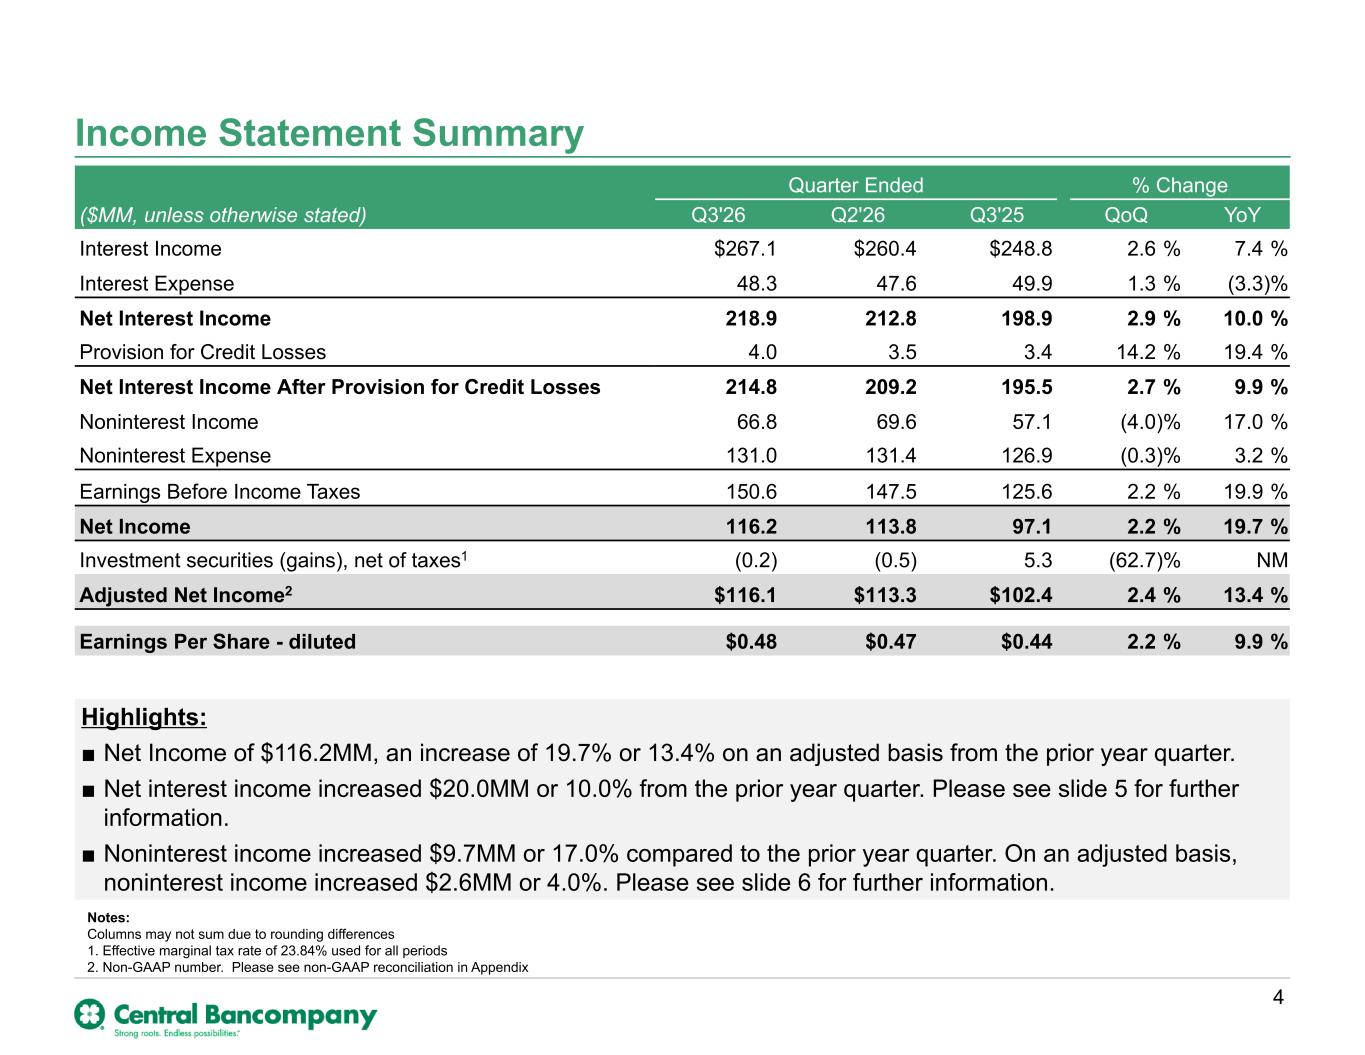
Highlights: ■ Net Income of $116.2MM, an increase of 19.7% or 13.4% on an adjusted basis from the prior year quarter. ■ Net interest income increased $20.0MM or 10.0% from the prior year quarter. Please see slide 5 for further information. ■ Noninterest income increased $9.7MM or 17.0% compared to the prior year quarter. On an adjusted basis, noninterest income increased $2.6MM or 4.0%. Please see slide 6 for further information. Quarter Ended % Change ($MM, unless otherwise stated) Q3'26 Q2'26 Q3'25 QoQ YoY Interest Income $267.1 $260.4 $248.8 2.6 % 7.4 % Interest Expense 48.3 47.6 49.9 1.3 % (3.3) % Net Interest Income 218.9 212.8 198.9 2.9 % 10.0 % Provision for Credit Losses 4.0 3.5 3.4 14.2 % 19.4 % Net Interest Income After Provision for Credit Losses 214.8 209.2 195.5 2.7 % 9.9 % Noninterest Income 66.8 69.6 57.1 (4.0) % 17.0 % Noninterest Expense 131.0 131.4 126.9 (0.3) % 3.2 % Earnings Before Income Taxes 150.6 147.5 125.6 2.2 % 19.9 % Net Income 116.2 113.8 97.1 2.2 % 19.7 % Investment securities (gains), net of taxes1 (0.2) (0.5) 5.3 (62.7) % NM Adjusted Net Income2 $116.1 $113.3 $102.4 2.4 % 13.4 % Earnings Per Share - diluted $0.48 $0.47 $0.44 2.2 % 9.9 % 4 Notes: Columns may not sum due to rounding differences 1. Effective marginal tax rate of 23.84% used for all periods 2. Non-GAAP number. Please see non-GAAP reconciliation in Appendix Income Statement Summary
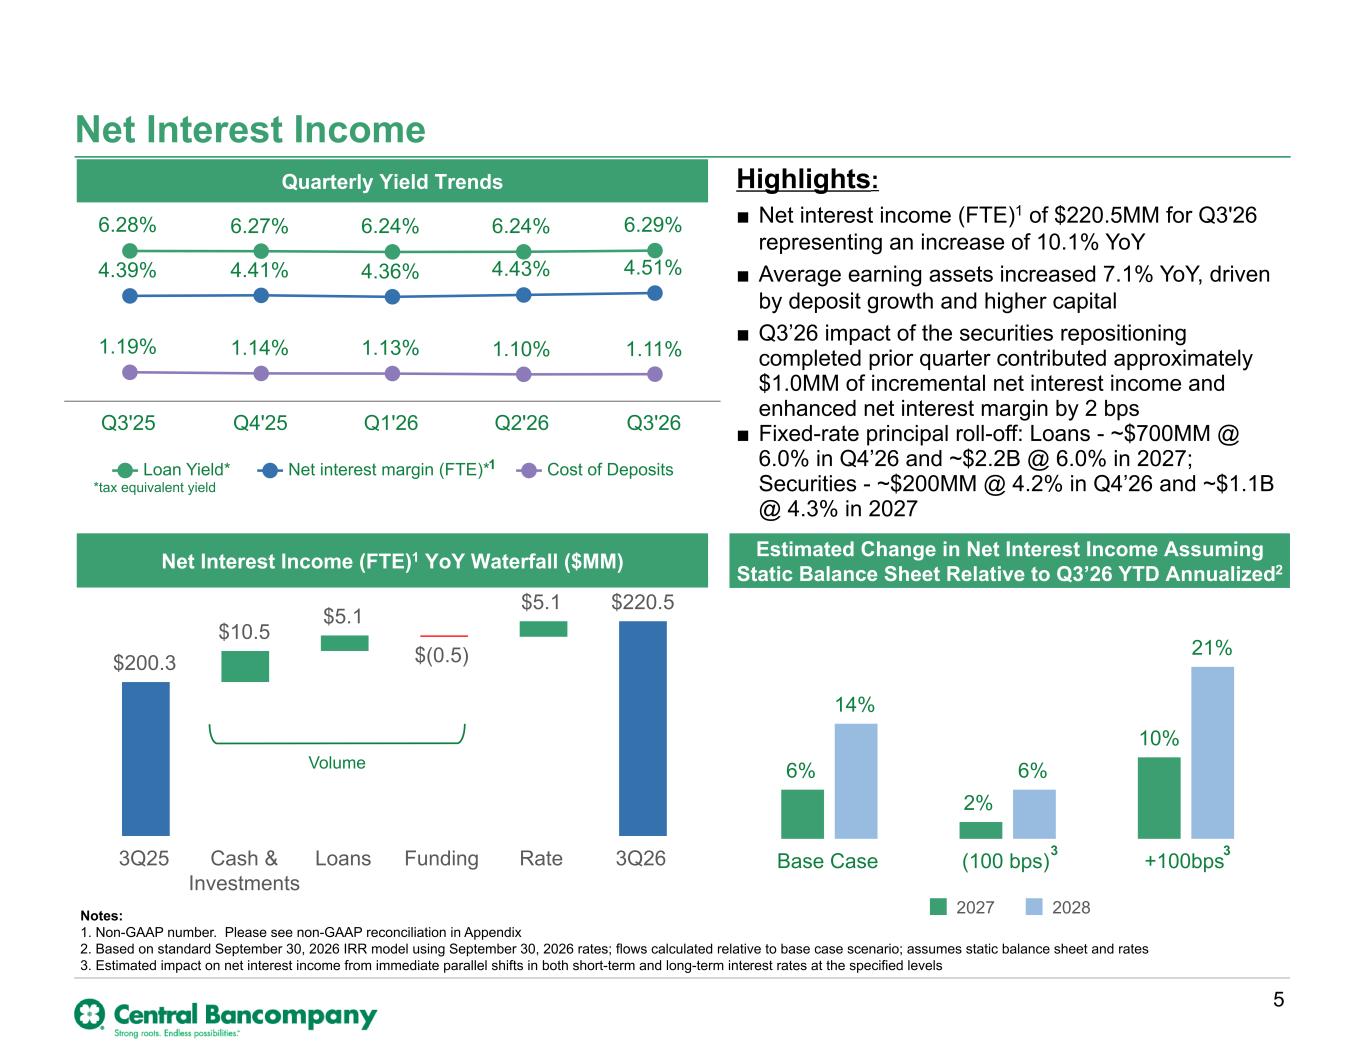
Notes: 1. Non-GAAP number. Please see non-GAAP reconciliation in Appendix 2. Based on standard September 30, 2026 IRR model using September 30, 2026 rates; flows calculated relative to base case scenario; assumes static balance sheet and rates 3. Estimated impact on net interest income from immediate parallel shifts in both short-term and long-term interest rates at the specified levels Highlights: ■ Net interest income (FTE)1 of $220.5MM for Q3'26 representing an increase of 10.1% YoY ■ Average earning assets increased 7.1% YoY, driven by deposit growth and higher capital ■ Q3’26 impact of the securities repositioning completed prior quarter contributed approximately $1.0MM of incremental net interest income and enhanced net interest margin by 2 bps ■ Fixed-rate principal roll-off: Loans - ~$700MM @ 6.0% in Q4’26 and ~$2.2B @ 6.0% in 2027; Securities - ~$200MM @ 4.2% in Q4’26 and ~$1.1B @ 4.3% in 2027 Net Interest Income *tax equivalent yield 6.28% 6.27% 6.24% 6.24% 6.29% 4.39% 4.41% 4.36% 4.43% 4.51% 1.19% 1.14% 1.13% 1.10% 1.11% Loan Yield* Net interest margin (FTE)* Cost of Deposits Q3'25 Q4'25 Q1'26 Q2'26 Q3'26 Volume 5 6% 2% 10% 14% 6% 21% 2027 2028 Base Case (100 bps) +100bps Quarterly Yield Trends Net Interest Income (FTE)1 YoY Waterfall ($MM) Estimated Change in Net Interest Income Assuming Static Balance Sheet Relative to Q3’26 YTD Annualized2 3 3 $200.3 $10.5 $5.1 $(0.5) $5.1 $220.5 3Q25 Cash & Investments Loans Funding Rate 3Q26 1
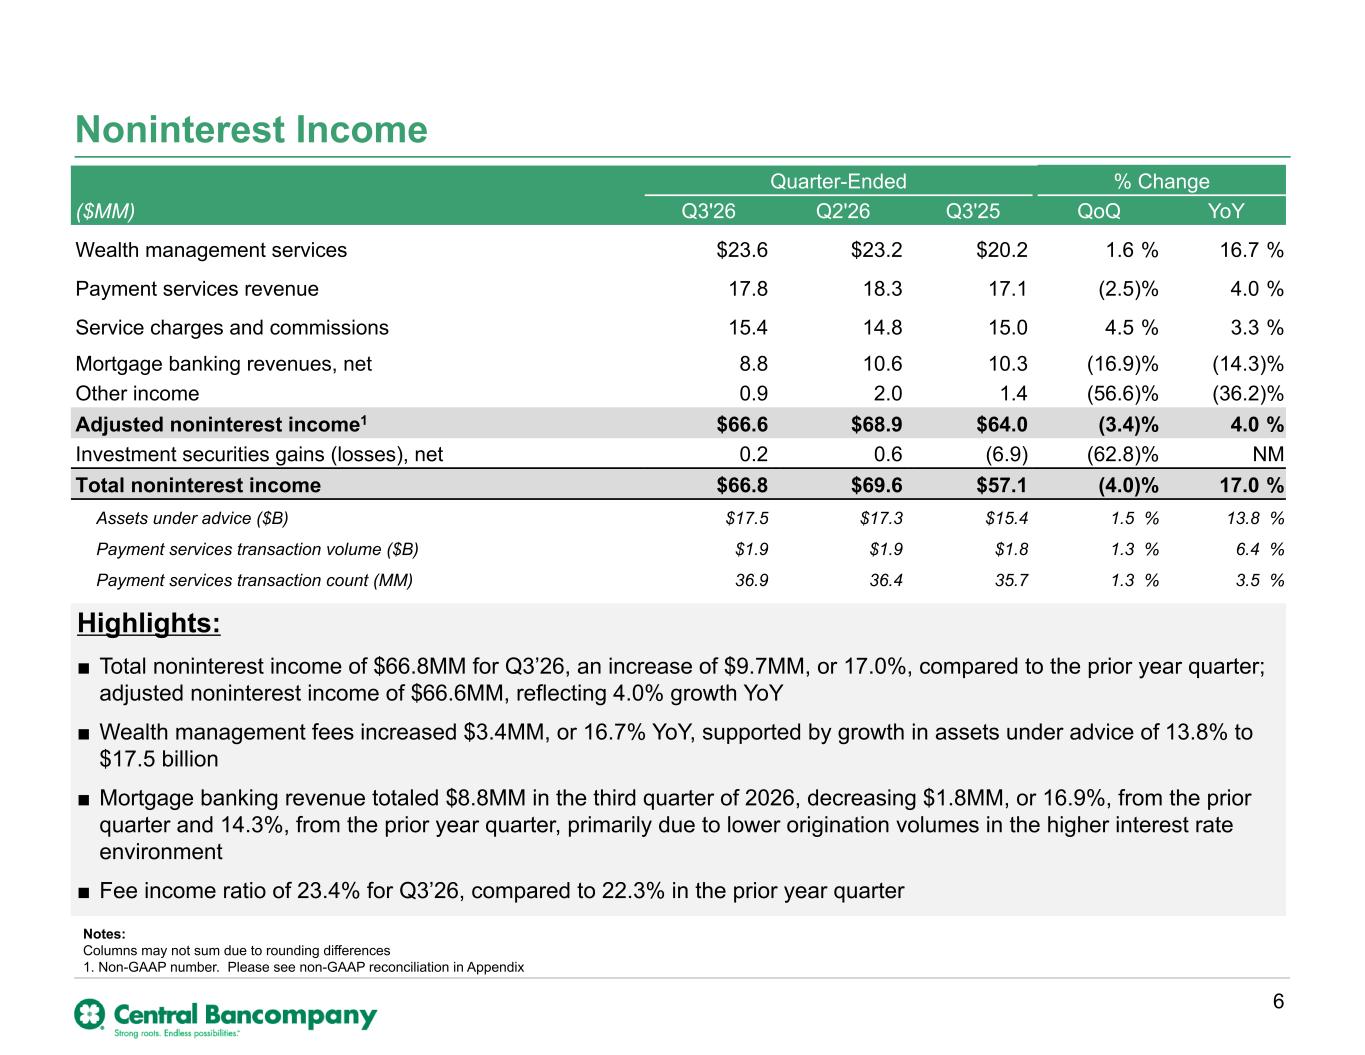
Highlights: ■ Total noninterest income of $66.8MM for Q3’26, an increase of $9.7MM, or 17.0%, compared to the prior year quarter; adjusted noninterest income of $66.6MM, reflecting 4.0% growth YoY ■ Wealth management fees increased $3.4MM, or 16.7% YoY, supported by growth in assets under advice of 13.8% to $17.5 billion ■ Mortgage banking revenue totaled $8.8MM in the third quarter of 2026, decreasing $1.8MM, or 16.9%, from the prior quarter and 14.3%, from the prior year quarter, primarily due to lower origination volumes in the higher interest rate environment ■ Fee income ratio of 23.4% for Q3’26, compared to 22.3% in the prior year quarter Noninterest Income Quarter-Ended % Change ($MM) Q3'26 Q2'26 Q3'25 QoQ YoY Wealth management services $23.6 $23.2 $20.2 1.6 % 16.7 % Payment services revenue 17.8 18.3 17.1 (2.5) % 4.0 % Service charges and commissions 15.4 14.8 15.0 4.5 % 3.3 % Mortgage banking revenues, net 8.8 10.6 10.3 (16.9) % (14.3) % Other income 0.9 2.0 1.4 (56.6) % (36.2) % Adjusted noninterest income1 $66.6 $68.9 $64.0 (3.4) % 4.0 % Investment securities gains (losses), net 0.2 0.6 (6.9) (62.8) % NM Total noninterest income $66.8 $69.6 $57.1 (4.0) % 17.0 % Assets under advice ($B) $17.5 $17.3 $15.4 1.5 % 13.8 % Payment services transaction volume ($B) $1.9 $1.9 $1.8 1.3 % 6.4 % Payment services transaction count (MM) 36.9 36.4 35.7 1.3 % 3.5 % 6 Notes: Columns may not sum due to rounding differences 1. Non-GAAP number. Please see non-GAAP reconciliation in Appendix
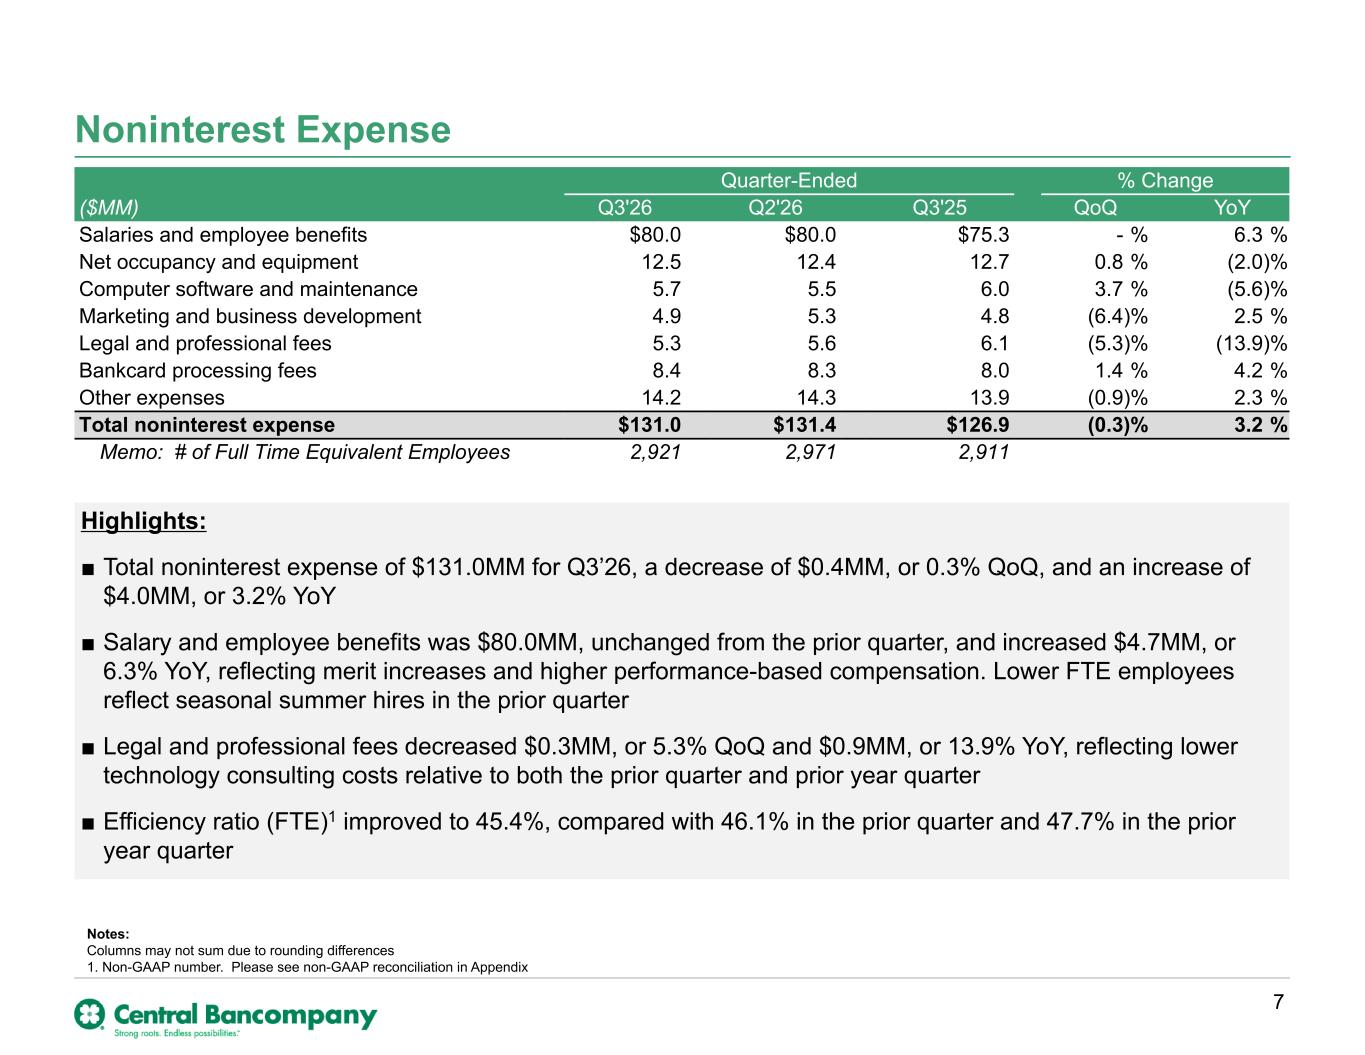
Highlights: ■ Total noninterest expense of $131.0MM for Q3’26, a decrease of $0.4MM, or 0.3% QoQ, and an increase of $4.0MM, or 3.2% YoY ■ Salary and employee benefits was $80.0MM, unchanged from the prior quarter, and increased $4.7MM, or 6.3% YoY, reflecting merit increases and higher performance-based compensation. Lower FTE employees reflect seasonal summer hires in the prior quarter ■ Legal and professional fees decreased $0.3MM, or 5.3% QoQ and $0.9MM, or 13.9% YoY, reflecting lower technology consulting costs relative to both the prior quarter and prior year quarter ■ Efficiency ratio (FTE)1 improved to 45.4%, compared with 46.1% in the prior quarter and 47.7% in the prior year quarter Noninterest Expense Quarter-Ended % Change ($MM) Q3'26 Q2'26 Q3'25 QoQ YoY Salaries and employee benefits $80.0 $80.0 $75.3 - % 6.3 % Net occupancy and equipment 12.5 12.4 12.7 0.8 % (2.0) % Computer software and maintenance 5.7 5.5 6.0 3.7 % (5.6) % Marketing and business development 4.9 5.3 4.8 (6.4) % 2.5 % Legal and professional fees 5.3 5.6 6.1 (5.3) % (13.9) % Bankcard processing fees 8.4 8.3 8.0 1.4 % 4.2 % Other expenses 14.2 14.3 13.9 (0.9) % 2.3 % Total noninterest expense $131.0 $131.4 $126.9 (0.3) % 3.2 % Memo: # of Full Time Equivalent Employees 2,921 2,971 2,911 7 Notes: Columns may not sum due to rounding differences 1. Non-GAAP number. Please see non-GAAP reconciliation in Appendix
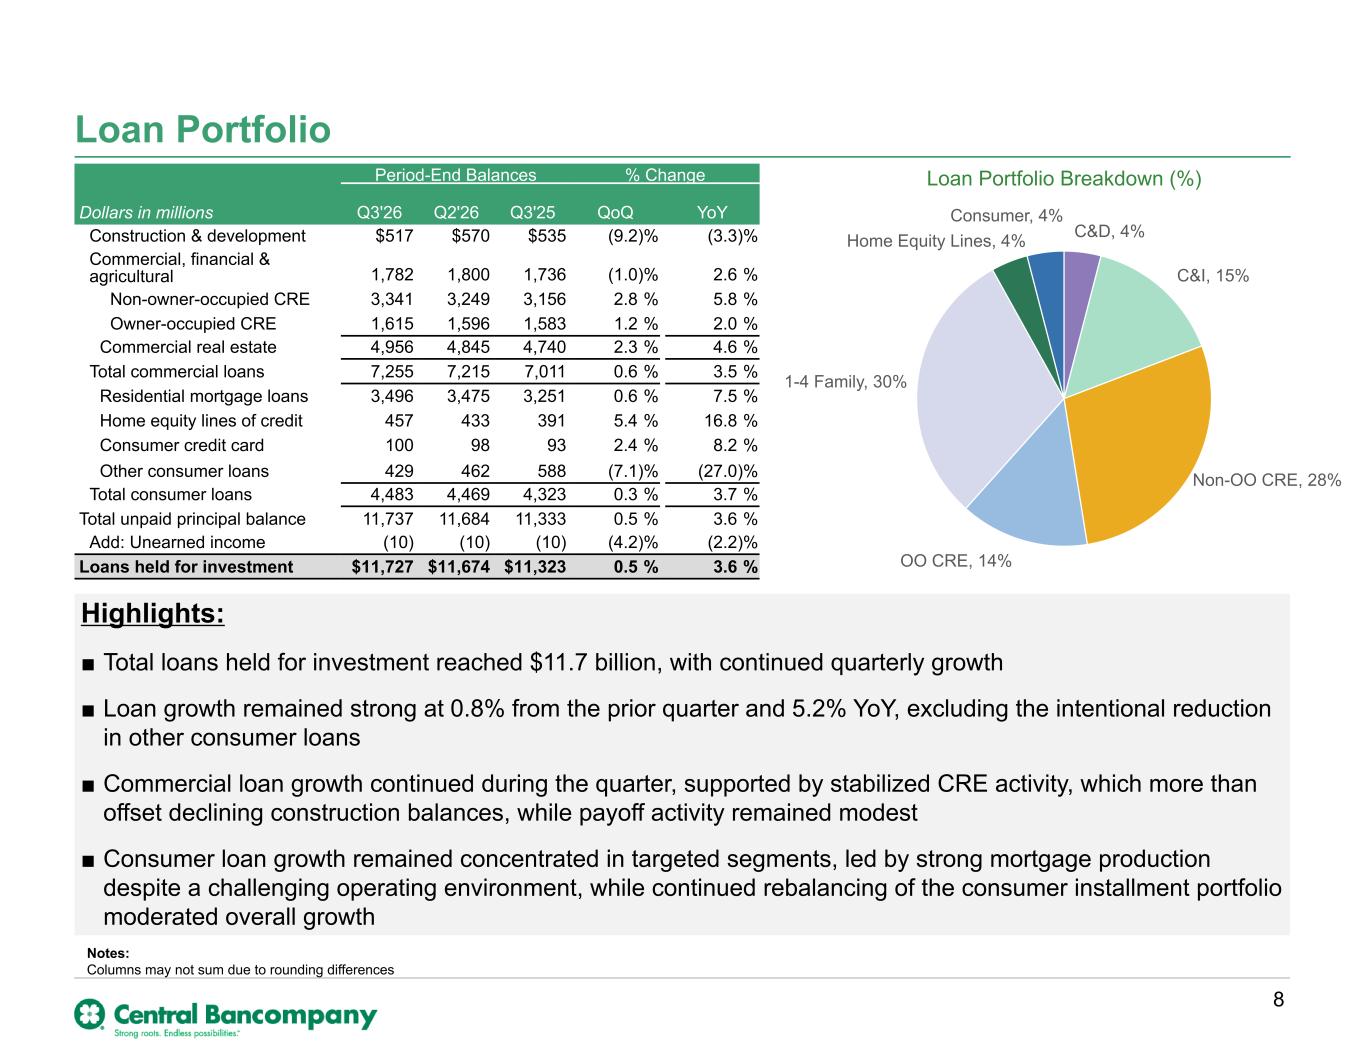
Highlights: ■ Total loans held for investment reached $11.7 billion, with continued quarterly growth ■ Loan growth remained strong at 0.8% from the prior quarter and 5.2% YoY, excluding the intentional reduction in other consumer loans ■ Commercial loan growth continued during the quarter, supported by stabilized CRE activity, which more than offset declining construction balances, while payoff activity remained modest ■ Consumer loan growth remained concentrated in targeted segments, led by strong mortgage production despite a challenging operating environment, while continued rebalancing of the consumer installment portfolio moderated overall growth Loan Portfolio Loan Portfolio Breakdown (%) C&D, 4% C&I, 15% Non-OO CRE, 28% OO CRE, 14% 1-4 Family, 30% Home Equity Lines, 4% Consumer, 4% Period-End Balances % Change Dollars in millions Q3'26 Q2'26 Q3'25 QoQ YoY Construction & development $517 $570 $535 (9.2) % (3.3) % Commercial, financial & agricultural 1,782 1,800 1,736 (1.0) % 2.6 % Non-owner-occupied CRE 3,341 3,249 3,156 2.8 % 5.8 % Owner-occupied CRE 1,615 1,596 1,583 1.2 % 2.0 % Commercial real estate 4,956 4,845 4,740 2.3 % 4.6 % Total commercial loans 7,255 7,215 7,011 0.6 % 3.5 % Residential mortgage loans 3,496 3,475 3,251 0.6 % 7.5 % Home equity lines of credit 457 433 391 5.4 % 16.8 % Consumer credit card 100 98 93 2.4 % 8.2 % Other consumer loans 429 462 588 (7.1) % (27.0) % Total consumer loans 4,483 4,469 4,323 0.3 % 3.7 % Total unpaid principal balance 11,737 11,684 11,333 0.5 % 3.6 % Add: Unearned income (10) (10) (10) (4.2) % (2.2) % Loans held for investment $11,727 $11,674 $11,323 0.5 % 3.6 % 8 Notes: Columns may not sum due to rounding differences
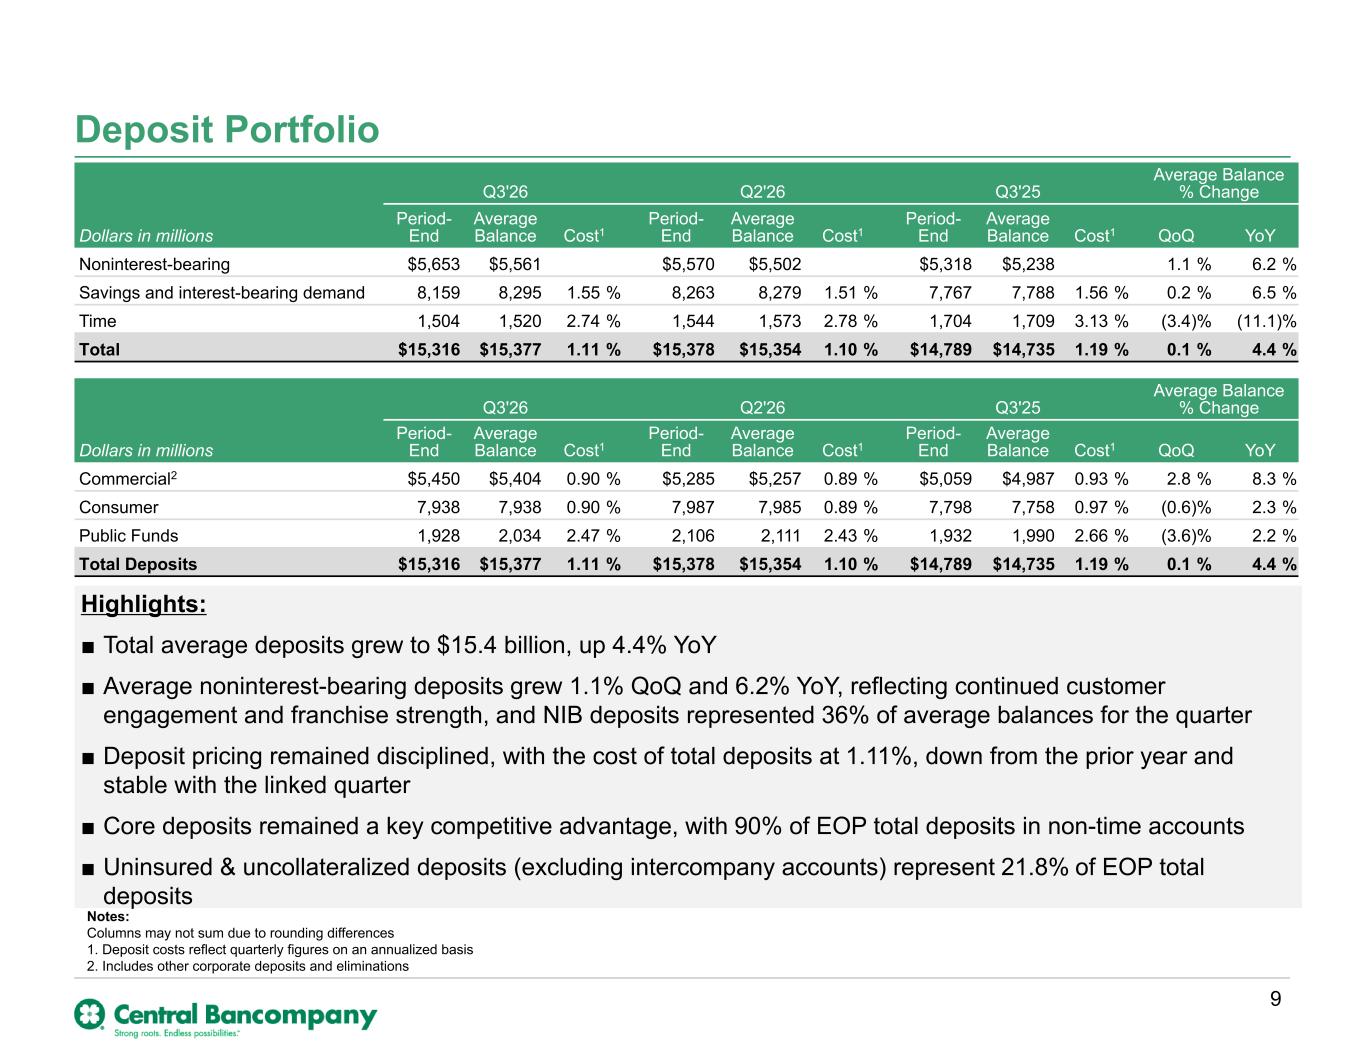
Deposit Portfolio 54% 36% 10% 9 Notes: Columns may not sum due to rounding differences 1. Deposit costs reflect quarterly figures on an annualized basis 2. Includes other corporate deposits and eliminations Q3'26 Q2'26 Q3'25 Average Balance % Change Dollars in millions Period- End Average Balance Cost1 Period- End Average Balance Cost1 Period- End Average Balance Cost1 QoQ YoY Noninterest-bearing $5,653 $5,561 $5,570 $5,502 $5,318 $5,238 1.1 % 6.2 % Savings and interest-bearing demand 8,159 8,295 1.55 % 8,263 8,279 1.51 % 7,767 7,788 1.56 % 0.2 % 6.5 % Time 1,504 1,520 2.74 % 1,544 1,573 2.78 % 1,704 1,709 3.13 % (3.4) % (11.1) % Total $15,316 $15,377 1.11 % $15,378 $15,354 1.10 % $14,789 $14,735 1.19 % 0.1 % 4.4 % Q3'26 Q2'26 Q3'25 Average Balance % Change Dollars in millions Period- End Average Balance Cost1 Period- End Average Balance Cost1 Period- End Average Balance Cost1 QoQ YoY Commercial2 $5,450 $5,404 0.90 % $5,285 $5,257 0.89 % $5,059 $4,987 0.93 % 2.8 % 8.3 % Consumer 7,938 7,938 0.90 % 7,987 7,985 0.89 % 7,798 7,758 0.97 % (0.6) % 2.3 % Public Funds 1,928 2,034 2.47 % 2,106 2,111 2.43 % 1,932 1,990 2.66 % (3.6) % 2.2 % Total Deposits $15,316 $15,377 1.11 % $15,378 $15,354 1.10 % $14,789 $14,735 1.19 % 0.1 % 4.4 % Highlights: ■ Total average deposits grew to $15.4 billion, up 4.4% YoY ■ Average noninterest-bearing deposits grew 1.1% QoQ and 6.2% YoY, reflecting continued customer engagement and franchise strength, and NIB deposits represented 36% of average balances for the quarter ■ Deposit pricing remained disciplined, with the cost of total deposits at 1.11%, down from the prior year and stable with the linked quarter ■ Core deposits remained a key competitive advantage, with 90% of EOP total deposits in non-time accounts ■ Uninsured & uncollateralized deposits (excluding intercompany accounts) represent 21.8% of EOP total deposits
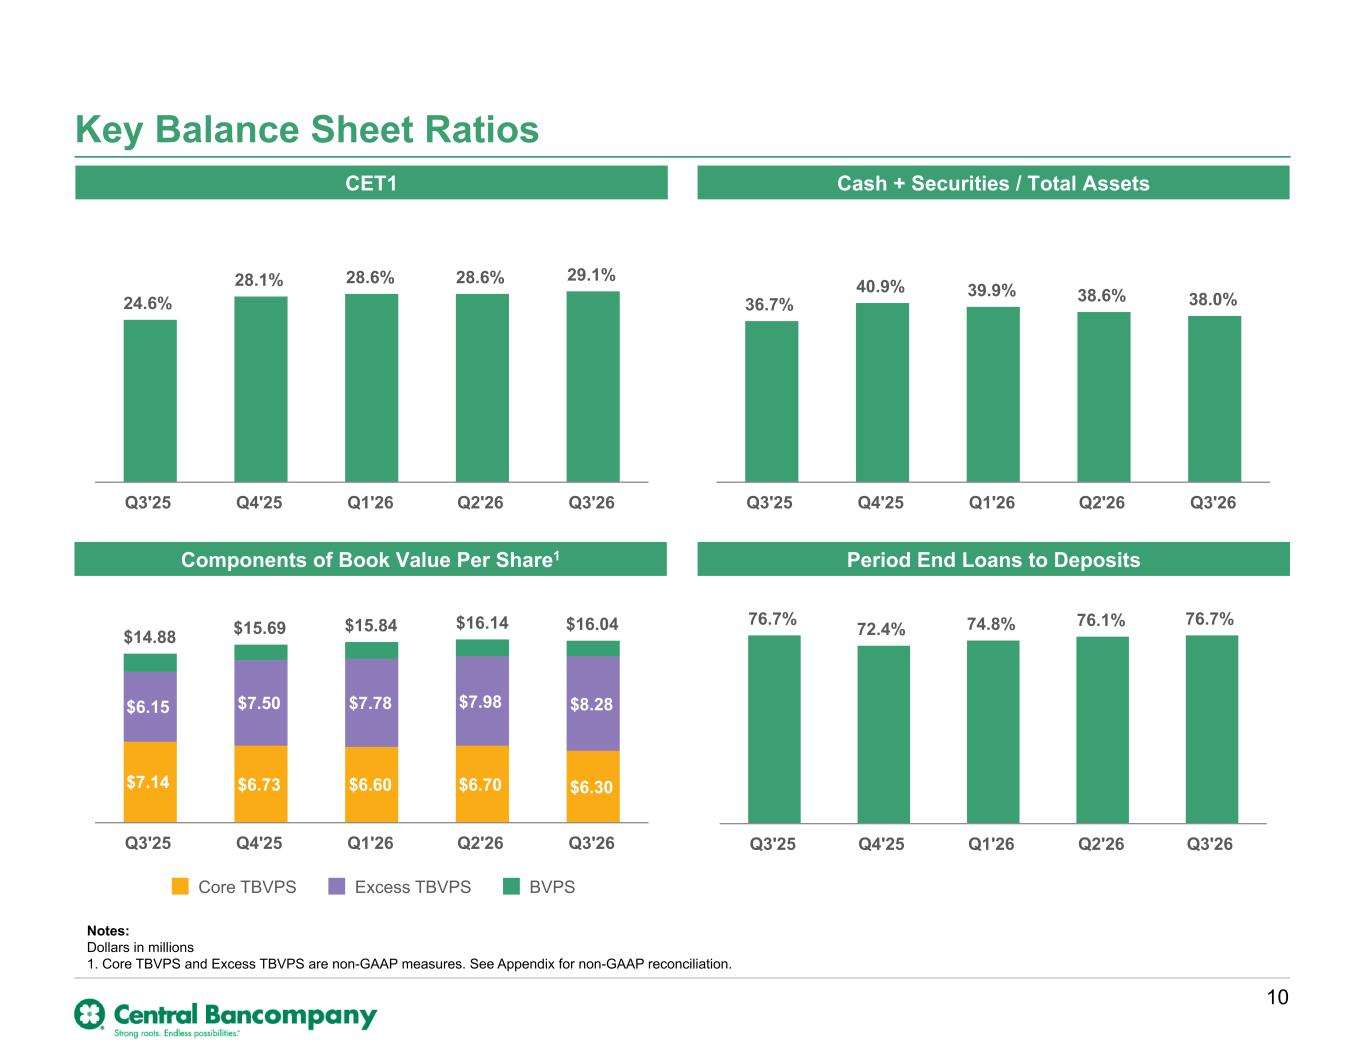
Key Balance Sheet Ratios CET1 Cash + Securities / Total Assets 24.6% 28.1% 28.6% 28.6% 29.1% Q3'25 Q4'25 Q1'26 Q2'26 Q3'26 36.7% 40.9% 39.9% 38.6% 38.0% Q3'25 Q4'25 Q1'26 Q2'26 Q3'26 Components of Book Value Per Share1 Period End Loans to Deposits 76.7% 72.4% 74.8% 76.1% 76.7% Q3'25 Q4'25 Q1'26 Q2'26 Q3'26 10 Notes: Dollars in millions 1. Core TBVPS and Excess TBVPS are non-GAAP measures. See Appendix for non-GAAP reconciliation. $14.88 $15.69 $15.84 $16.14 $16.04 $7.14 $6.73 $6.60 $6.70 $6.30 $6.15 $7.50 $7.78 $7.98 $8.28 Core TBVPS Excess TBVPS BVPS Q3'25 Q4'25 Q1'26 Q2'26 Q3'26
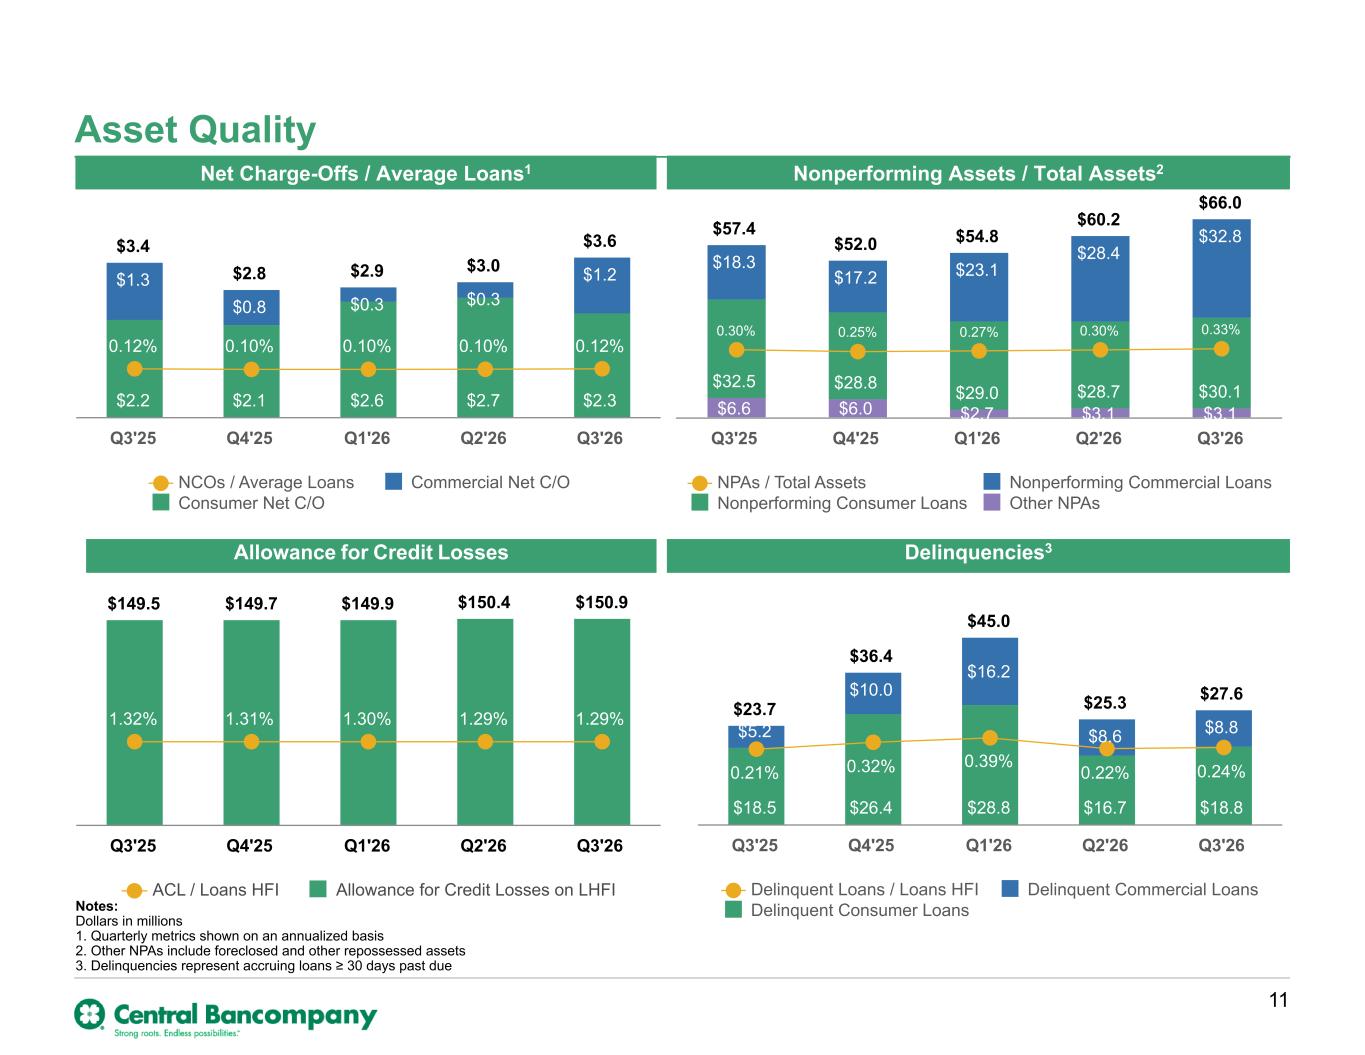
Asset Quality Allowance for Credit Losses Nonperforming Assets / Total Assets2Net Charge-Offs / Average Loans1 Delinquencies3 Notes: Dollars in millions 1. Quarterly metrics shown on an annualized basis 2. Other NPAs include foreclosed and other repossessed assets 3. Delinquencies represent accruing loans ≥ 30 days past due $149.5 $149.7 $149.9 $150.4 $150.9 1.32% 1.31% 1.30% 1.29% 1.29% ACL / Loans HFI Allowance for Credit Losses on LHFI Q3'25 Q4'25 Q1'26 Q2'26 Q3'26 11 $57.4 $52.0 $54.8 $60.2 $66.0 $6.6 $6.0 $2.7 $3.1 $3.1 $32.5 $28.8 $29.0 $28.7 $30.1 $18.3 $17.2 $23.1 $28.4 $32.8 0.30% 0.25% 0.27% 0.30% 0.33% NPAs / Total Assets Nonperforming Commercial Loans Nonperforming Consumer Loans Other NPAs Q3'25 Q4'25 Q1'26 Q2'26 Q3'26 $3.4 $2.8 $2.9 $3.0 $3.6 $2.2 $2.1 $2.6 $2.7 $2.3 $1.3 $0.8 $0.3 $0.3 $1.2 0.12% 0.10% 0.10% 0.10% 0.12% NCOs / Average Loans Commercial Net C/O Consumer Net C/O Q3'25 Q4'25 Q1'26 Q2'26 Q3'26 $23.7 $36.4 $45.0 $25.3 $27.6 $18.5 $26.4 $28.8 $16.7 $18.8 $5.2 $10.0 $16.2 $8.6 $8.8 0.21% 0.32% 0.39% 0.22% 0.24% Delinquent Loans / Loans HFI Delinquent Commercial Loans Delinquent Consumer Loans Q3'25 Q4'25 Q1'26 Q2'26 Q3'26
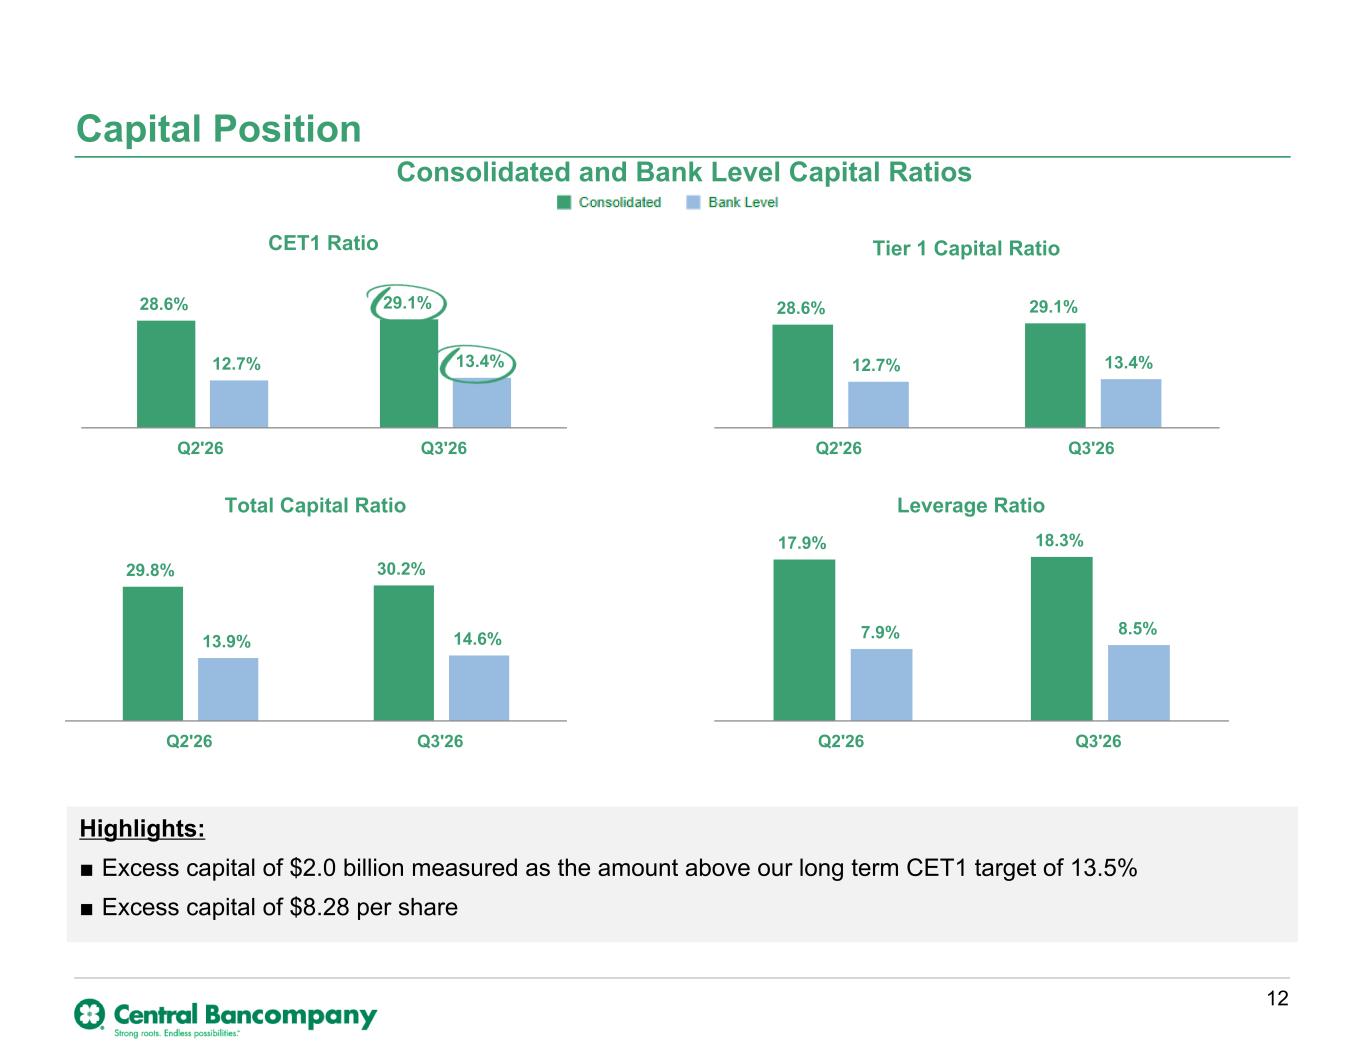
Consolidated and Bank Level Capital Ratios Capital Position CET1 Ratio 28.6% 29.1% 12.7% 13.4% Q2'26 Q3'26 Tier 1 Capital Ratio 28.6% 29.1% 12.7% 13.4% Q2'26 Q3'26 Total Capital Ratio 29.8% 30.2% 13.9% 14.6% Q2'26 Q3'26 Leverage Ratio 17.9% 18.3% 7.9% 8.5% Q2'26 Q3'26 Highlights: ■ Excess capital of $2.0 billion measured as the amount above our long term CET1 target of 13.5% ■ Excess capital of $8.28 per share 12
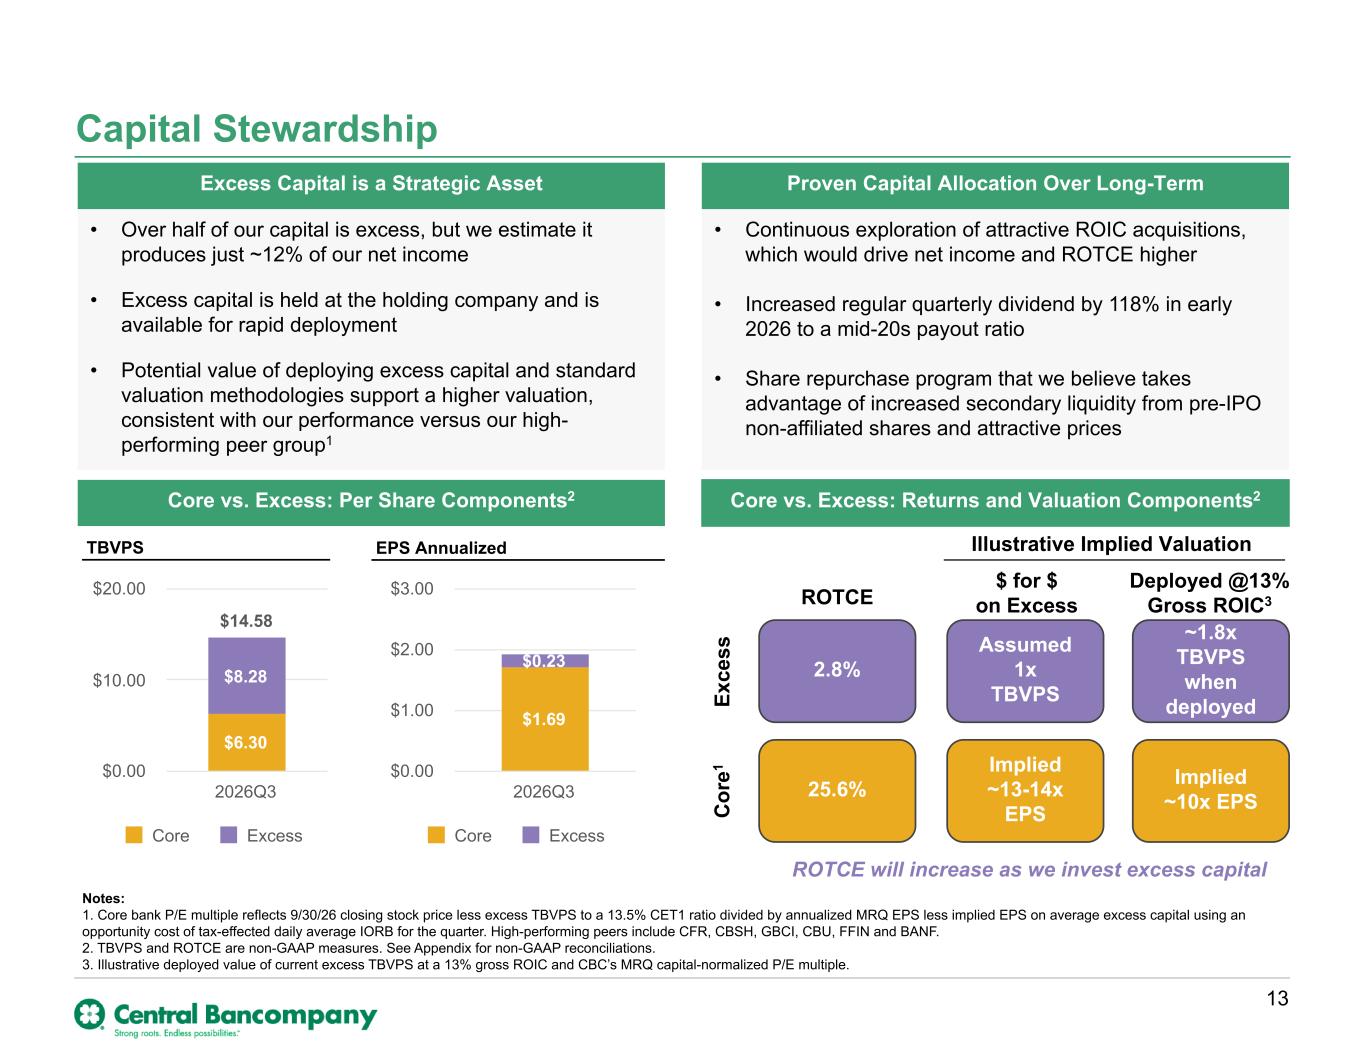
Notes: 1. Core bank P/E multiple reflects 9/30/26 closing stock price less excess TBVPS to a 13.5% CET1 ratio divided by annualized MRQ EPS less implied EPS on average excess capital using an opportunity cost of tax-effected daily average IORB for the quarter. High-performing peers include CFR, CBSH, GBCI, CBU, FFIN and BANF. 2. TBVPS and ROTCE are non-GAAP measures. See Appendix for non-GAAP reconciliations. 3. Illustrative deployed value of current excess TBVPS at a 13% gross ROIC and CBC’s MRQ capital-normalized P/E multiple. Deployed @13% Gross ROIC3 ROTCE will increase as we invest excess capital $ for $ on Excess • Over half of our capital is excess, but we estimate it produces just ~12% of our net income • Excess capital is held at the holding company and is available for rapid deployment • Potential value of deploying excess capital and standard valuation methodologies support a higher valuation, consistent with our performance versus our high- performing peer group1 Illustrative Implied Valuation Capital Stewardship 13 Excess Capital is a Strategic Asset Proven Capital Allocation Over Long-Term Core vs. Excess: Per Share Components2 Core vs. Excess: Returns and Valuation Components2 $14.58 $6.30 $8.28 Core Excess 2026Q3 $0.00 $10.00 $20.00 $1.69 $0.23 Core Excess 2026Q3 $0.00 $1.00 $2.00 $3.00 TBVPS EPS Annualized 2.8% Assumed 1x TBVPS 25.6% Implied ~13-14x EPS ROTCE Ex ce ss C or e1 ~1.8x TBVPS when deployed • Continuous exploration of attractive ROIC acquisitions, which would drive net income and ROTCE higher • Increased regular quarterly dividend by 118% in early 2026 to a mid-20s payout ratio • Share repurchase program that we believe takes advantage of increased secondary liquidity from pre-IPO non-affiliated shares and attractive prices Implied ~10x EPS
Appendix
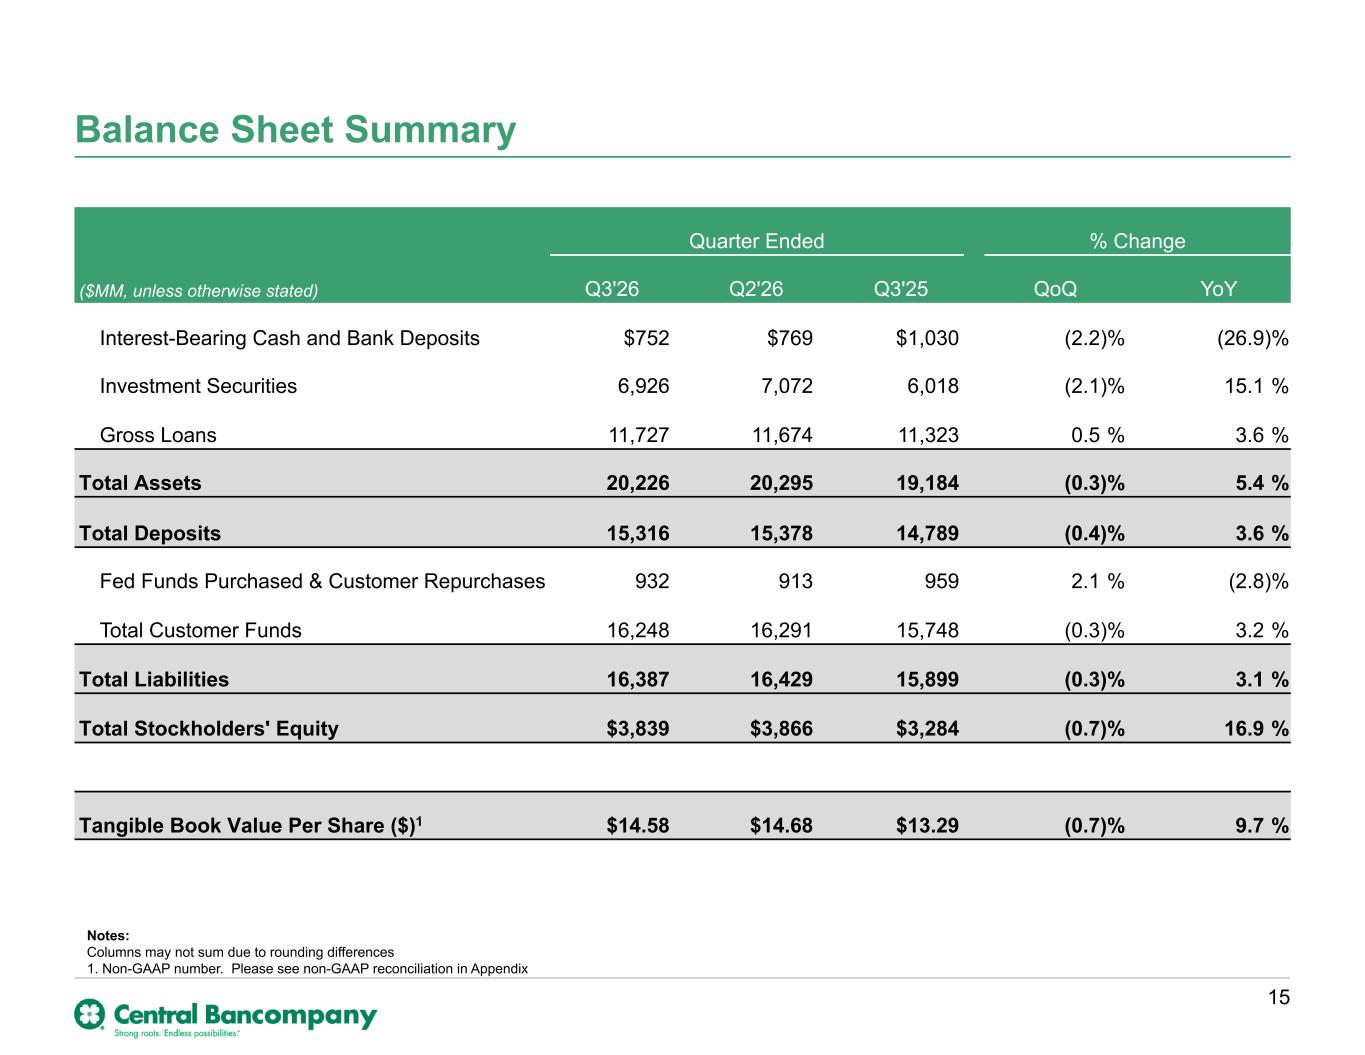
Balance Sheet Summary Quarter Ended % Change ($MM, unless otherwise stated) Q3'26 Q2'26 Q3'25 QoQ YoY Interest-Bearing Cash and Bank Deposits $752 $769 $1,030 (2.2) % (26.9) % Investment Securities 6,926 7,072 6,018 (2.1) % 15.1 % Gross Loans 11,727 11,674 11,323 0.5 % 3.6 % Total Assets 20,226 20,295 19,184 (0.3) % 5.4 % Total Deposits 15,316 15,378 14,789 (0.4) % 3.6 % Fed Funds Purchased & Customer Repurchases 932 913 959 2.1 % (2.8) % Total Customer Funds 16,248 16,291 15,748 (0.3) % 3.2 % Total Liabilities 16,387 16,429 15,899 (0.3) % 3.1 % Total Stockholders' Equity $3,839 $3,866 $3,284 (0.7) % 16.9 % Tangible Book Value Per Share ($)1 $14.58 $14.68 $13.29 (0.7) % 9.7 % 15 Notes: Columns may not sum due to rounding differences 1. Non-GAAP number. Please see non-GAAP reconciliation in Appendix
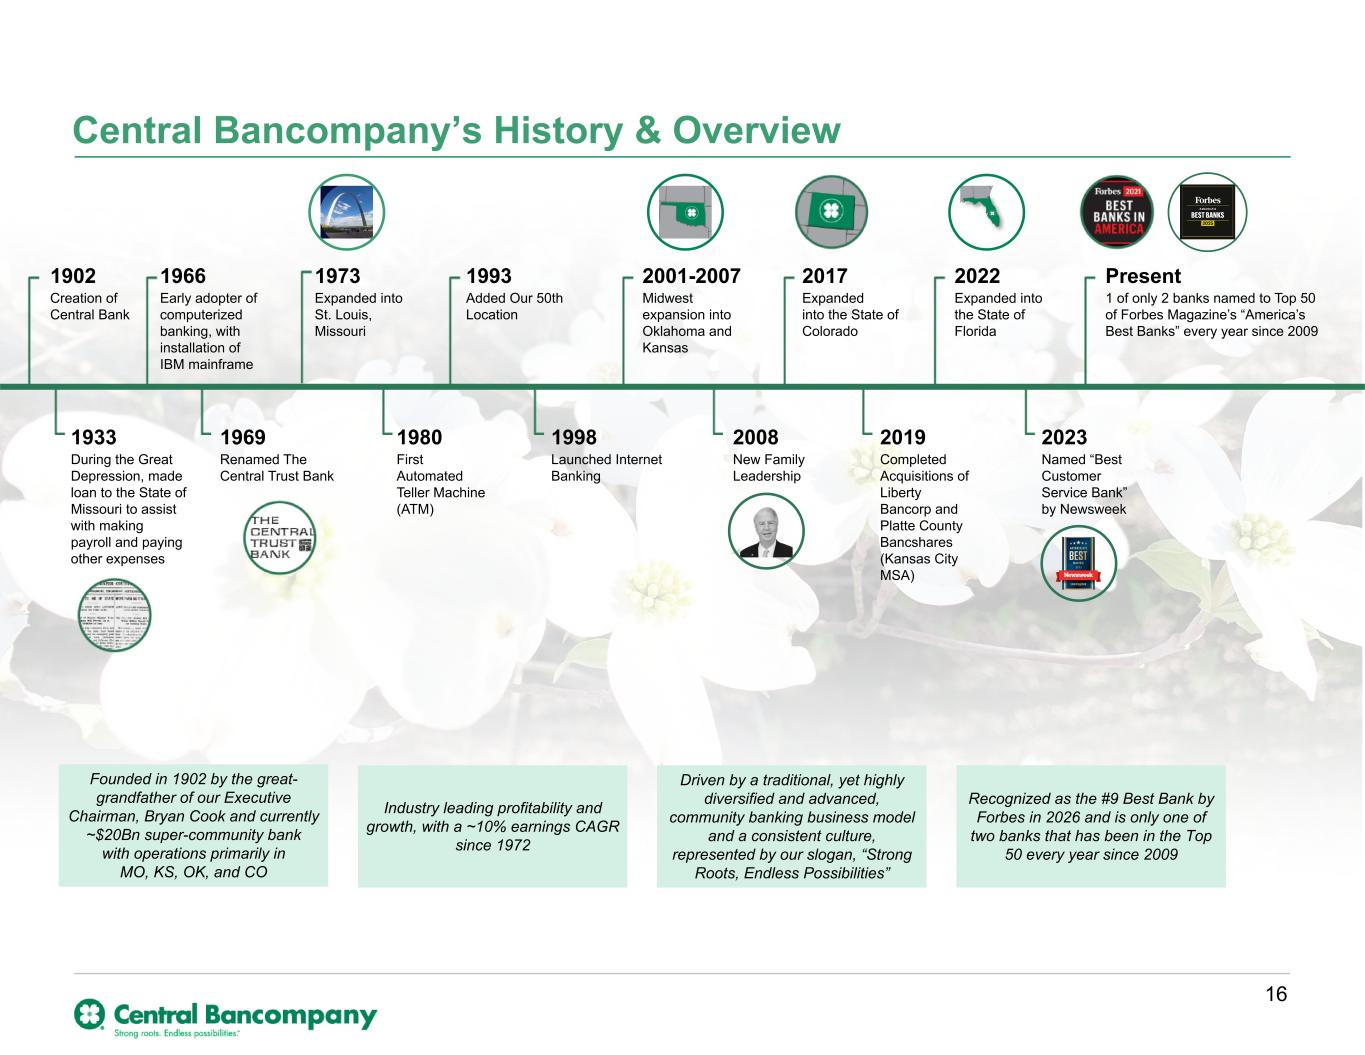
Central Bancompany’s History & Overview 1902 Creation of Central Bank 1973 Expanded into St. Louis, Missouri 1993 Added Our 50th Location 2001-2007 Midwest expansion into Oklahoma and Kansas 2022 Expanded into the State of Florida 1980 First Automated Teller Machine (ATM) 1998 Launched Internet Banking 2008 New Family Leadership 2019 Completed Acquisitions of Liberty Bancorp and Platte County Bancshares (Kansas City MSA) 2023 Named “Best Customer Service Bank” by Newsweek 1969 Renamed The Central Trust Bank 2017 Expanded into the State of Colorado Present 1 of only 2 banks named to Top 50 of Forbes Magazine’s “America’s Best Banks” every year since 2009 1966 Early adopter of computerized banking, with installation of IBM mainframe 1933 During the Great Depression, made loan to the State of Missouri to assist with making payroll and paying other expenses Founded in 1902 by the great- grandfather of our Executive Chairman, Bryan Cook and currently ~$20Bn super-community bank with operations primarily in MO, KS, OK, and CO Industry leading profitability and growth, with a ~10% earnings CAGR since 1972 Driven by a traditional, yet highly diversified and advanced, community banking business model and a consistent culture, represented by our slogan, “Strong Roots, Endless Possibilities” Recognized as the #9 Best Bank by Forbes in 2026 and is only one of two banks that has been in the Top 50 every year since 2009 16
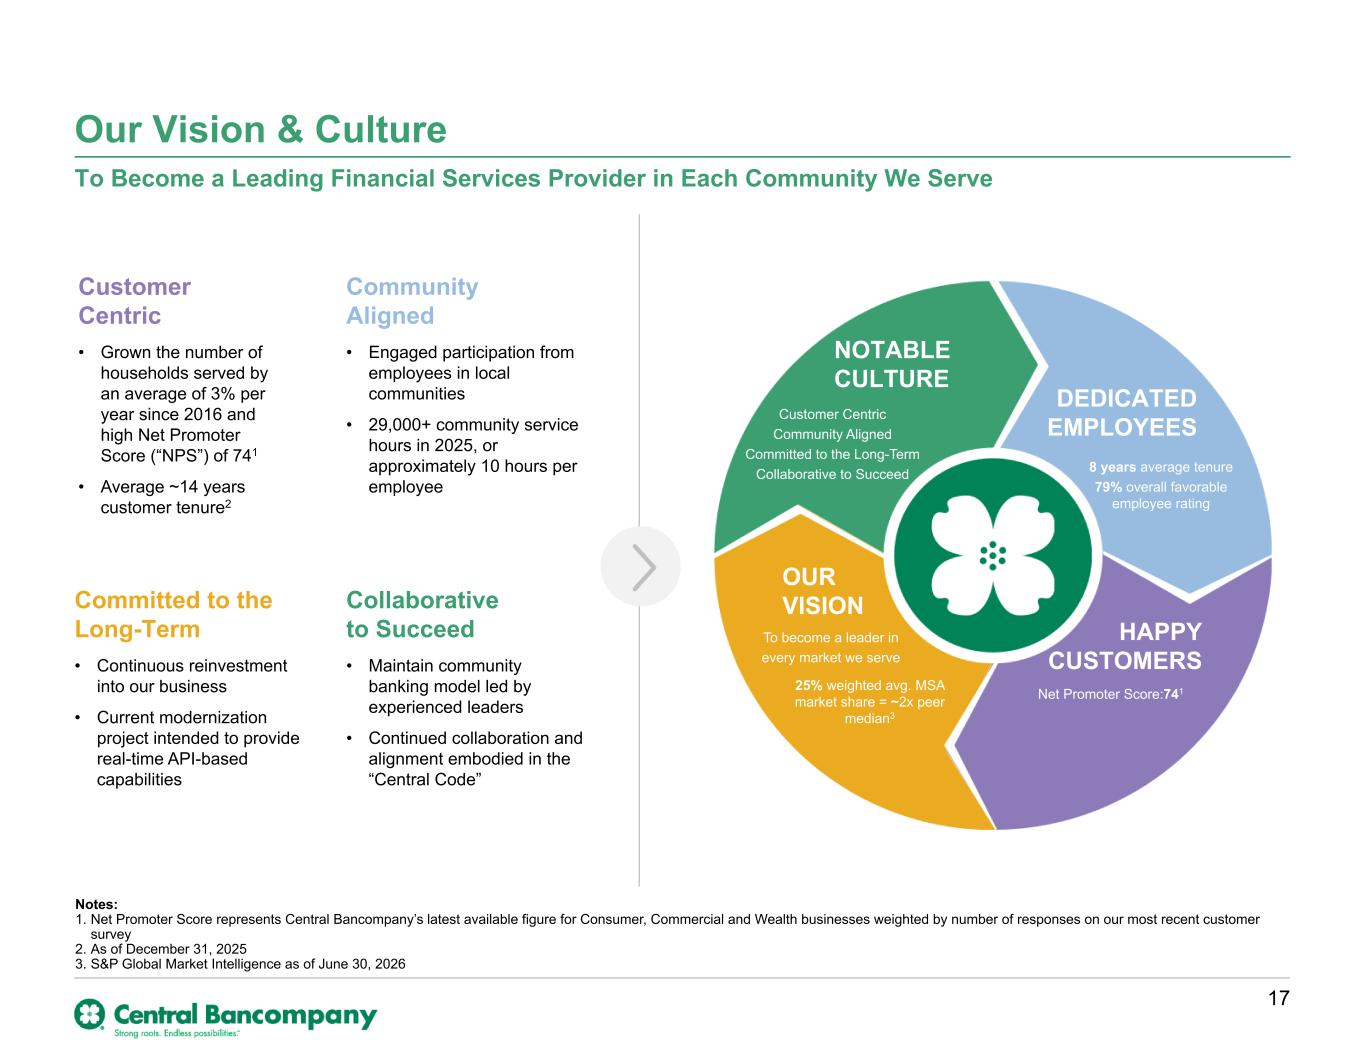
Our Vision & Culture To Become a Leading Financial Services Provider in Each Community We Serve Notes: 1. Net Promoter Score represents Central Bancompany’s latest available figure for Consumer, Commercial and Wealth businesses weighted by number of responses on our most recent customer survey 2. As of December 31, 2025 3. S&P Global Market Intelligence as of June 30, 2026 NOTABLE CULTURE DEDICATED EMPLOYEES HAPPY CUSTOMERS OUR VISION To become a leader in every market we serve Customer Centric Community Aligned Committed to the Long-Term Collaborative to Succeed 8 years average tenure 79% overall favorable employee rating Net Promoter Score:741 Collaborative to Succeed • Maintain community banking model led by experienced leaders • Continued collaboration and alignment embodied in the “Central Code” Community Aligned • Engaged participation from employees in local communities • 29,000+ community service hours in 2025, or approximately 10 hours per employee Committed to the Long-Term • Continuous reinvestment into our business • Current modernization project intended to provide real-time API-based capabilities Customer Centric • Grown the number of households served by an average of 3% per year since 2016 and high Net Promoter Score (“NPS”) of 741 • Average ~14 years customer tenure2 25% weighted avg. MSA market share = ~2x peer median3 17
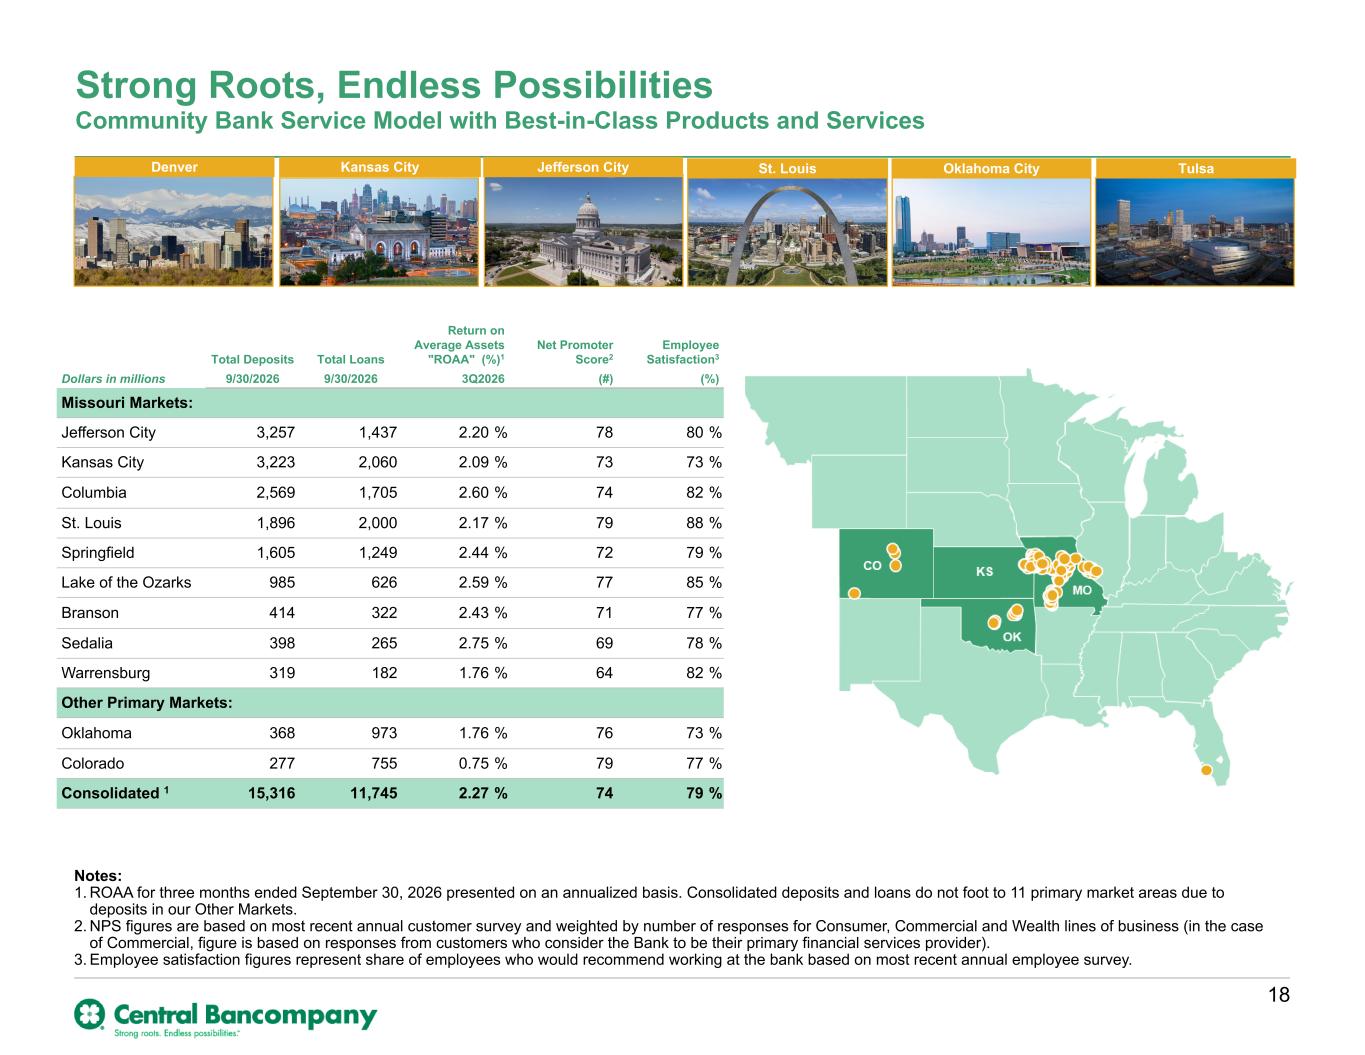
Community Bank Service Model with Best-in-Class Products and Services Strong Roots, Endless Possibilities Notes: 1. ROAA for three months ended September 30, 2026 presented on an annualized basis. Consolidated deposits and loans do not foot to 11 primary market areas due to deposits in our Other Markets. 2. NPS figures are based on most recent annual customer survey and weighted by number of responses for Consumer, Commercial and Wealth lines of business (in the case of Commercial, figure is based on responses from customers who consider the Bank to be their primary financial services provider). 3. Employee satisfaction figures represent share of employees who would recommend working at the bank based on most recent annual employee survey. FL Jefferson CityKansas CityDenver TulsaOklahoma CitySt. Louis Total Deposits Total Loans Return on Average Assets "ROAA" (%)1 Net Promoter Score2 Employee Satisfaction3 Dollars in millions 9/30/2026 9/30/2026 3Q2026 (#) (%) Missouri Markets: Jefferson City 3,257 1,437 2.20 % 78 80 % Kansas City 3,223 2,060 2.09 % 73 73 % Columbia 2,569 1,705 2.60 % 74 82 % St. Louis 1,896 2,000 2.17 % 79 88 % Springfield 1,605 1,249 2.44 % 72 79 % Lake of the Ozarks 985 626 2.59 % 77 85 % Branson 414 322 2.43 % 71 77 % Sedalia 398 265 2.75 % 69 78 % Warrensburg 319 182 1.76 % 64 82 % Other Primary Markets: Oklahoma 368 973 1.76 % 76 73 % Colorado 277 755 0.75 % 79 77 % Consolidated 1 15,316 11,745 2.27 % 74 79 % 18
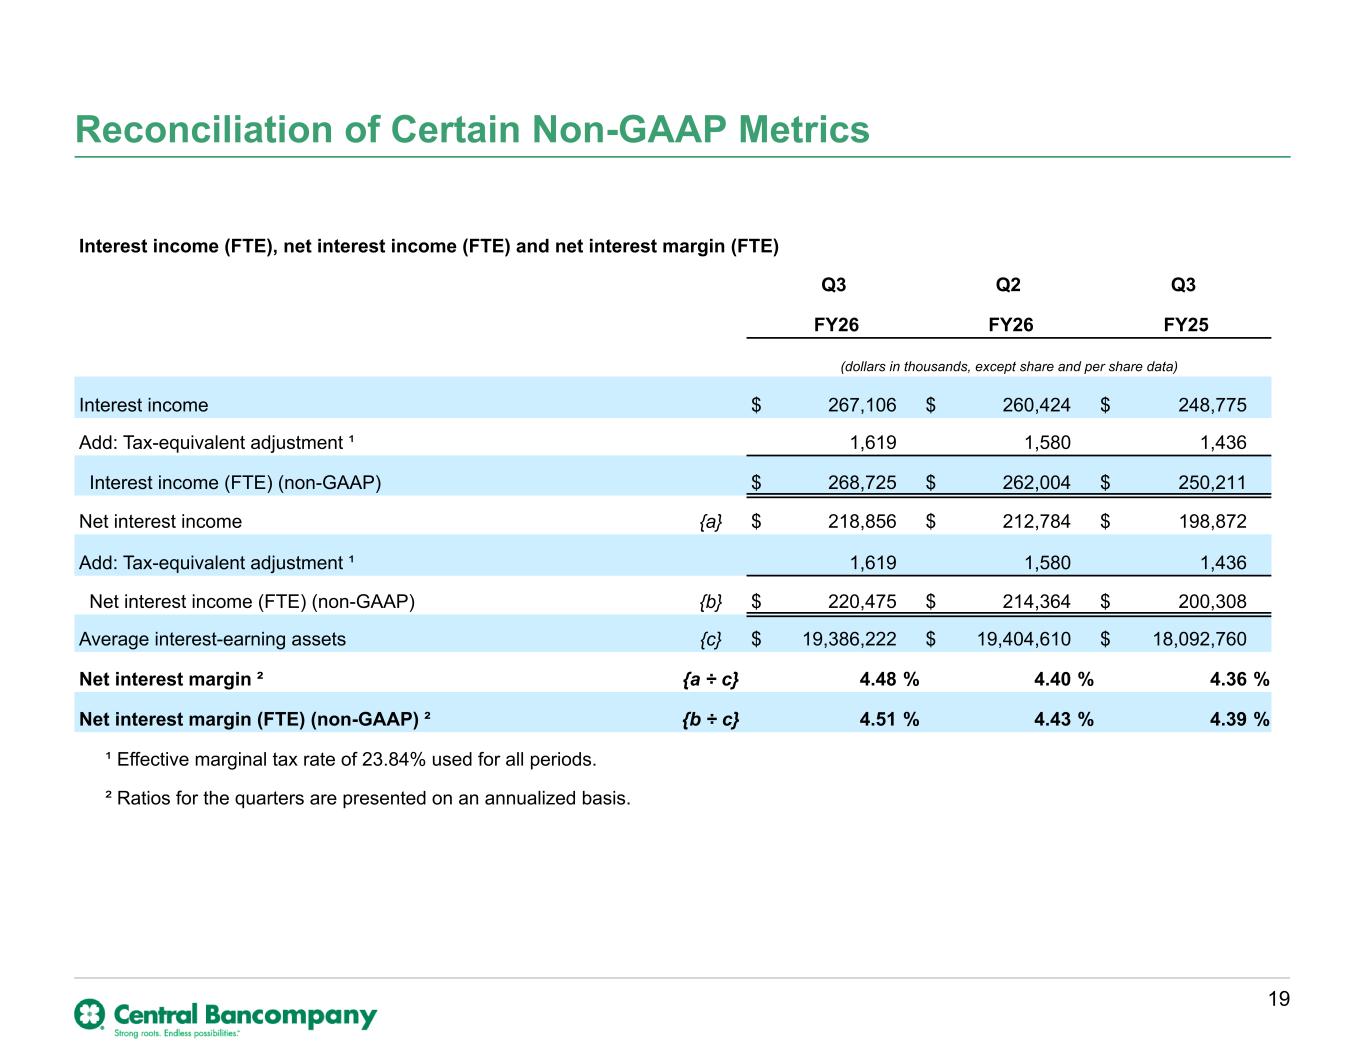
Reconciliation of Certain Non-GAAP Metrics 19 Interest income (FTE), net interest income (FTE) and net interest margin (FTE) Q3 Q2 Q3 FY26 FY26 FY25 (dollars in thousands, except share and per share data) Interest income $ 267,106 $ 260,424 $ 248,775 Add: Tax-equivalent adjustment ¹ 1,619 1,580 1,436 Interest income (FTE) (non-GAAP) $ 268,725 $ 262,004 $ 250,211 Net interest income {a} $ 218,856 $ 212,784 $ 198,872 Add: Tax-equivalent adjustment ¹ 1,619 1,580 1,436 Net interest income (FTE) (non-GAAP) {b} $ 220,475 $ 214,364 $ 200,308 Average interest-earning assets {c} $ 19,386,222 $ 19,404,610 $ 18,092,760 Net interest margin ² {a ÷ c} 4.48 % 4.40 % 4.36 % Net interest margin (FTE) (non-GAAP) ² {b ÷ c} 4.51 % 4.43 % 4.39 % ¹ Effective marginal tax rate of 23.84% used for all periods. ² Ratios for the quarters are presented on an annualized basis.
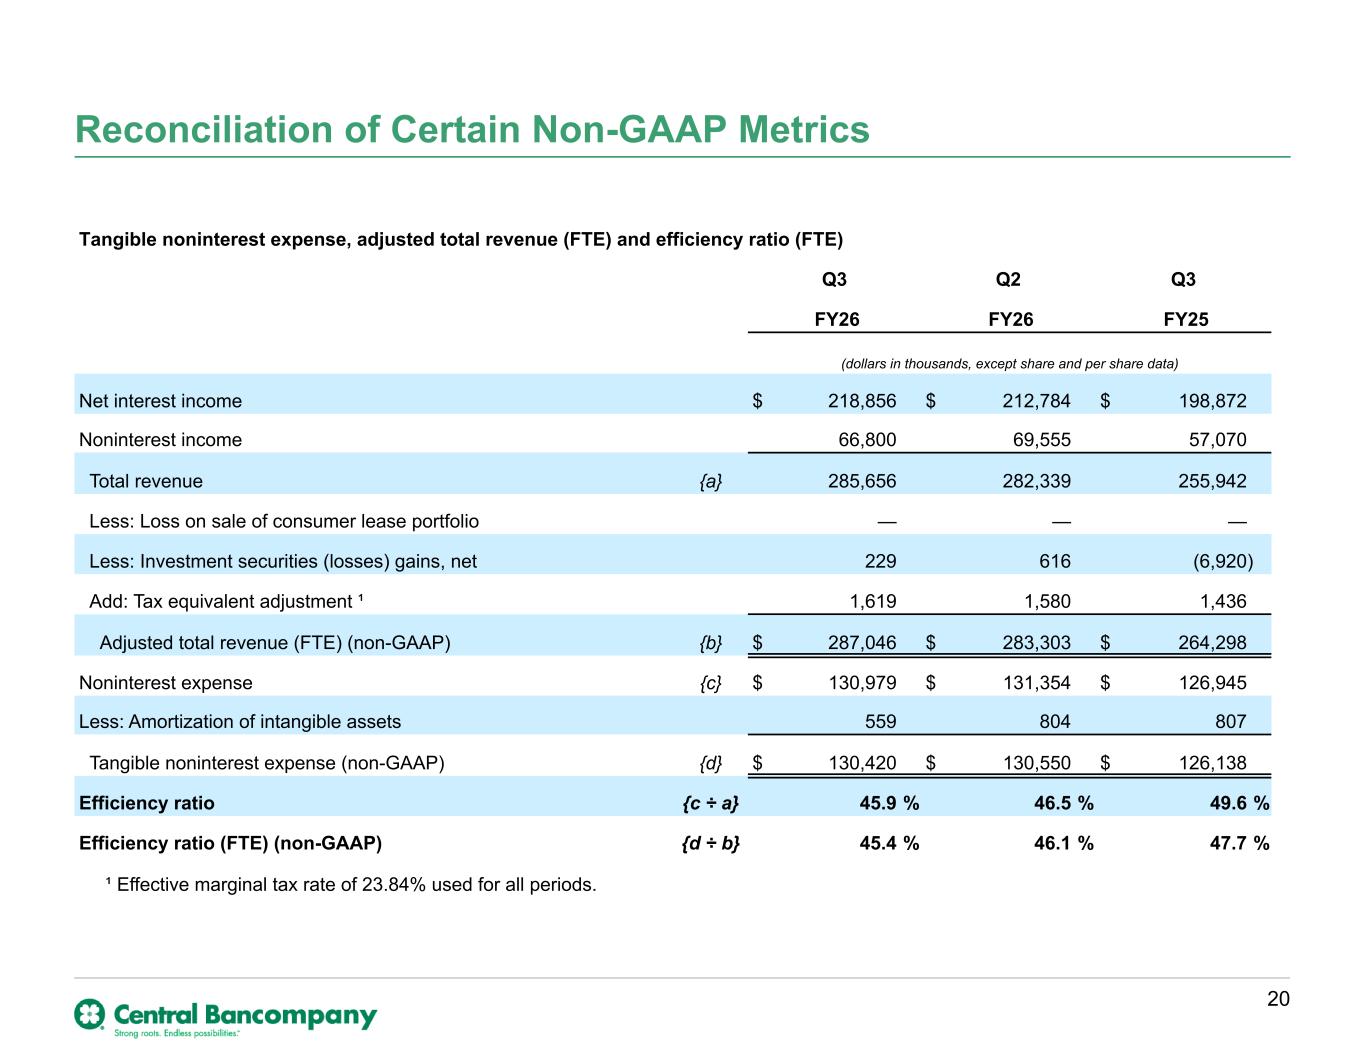
Reconciliation of Certain Non-GAAP Metrics 20 Tangible noninterest expense, adjusted total revenue (FTE) and efficiency ratio (FTE) Q3 Q2 Q3 FY26 FY26 FY25 (dollars in thousands, except share and per share data) Net interest income $ 218,856 $ 212,784 $ 198,872 Noninterest income 66,800 69,555 57,070 Total revenue {a} 285,656 282,339 255,942 Less: Loss on sale of consumer lease portfolio — — — Less: Investment securities (losses) gains, net 229 616 (6,920) Add: Tax equivalent adjustment ¹ 1,619 1,580 1,436 Adjusted total revenue (FTE) (non-GAAP) {b} $ 287,046 $ 283,303 $ 264,298 Noninterest expense {c} $ 130,979 $ 131,354 $ 126,945 Less: Amortization of intangible assets 559 804 807 Tangible noninterest expense (non-GAAP) {d} $ 130,420 $ 130,550 $ 126,138 Efficiency ratio {c ÷ a} 45.9 % 46.5 % 49.6 % Efficiency ratio (FTE) (non-GAAP) {d ÷ b} 45.4 % 46.1 % 47.7 % ¹ Effective marginal tax rate of 23.84% used for all periods.
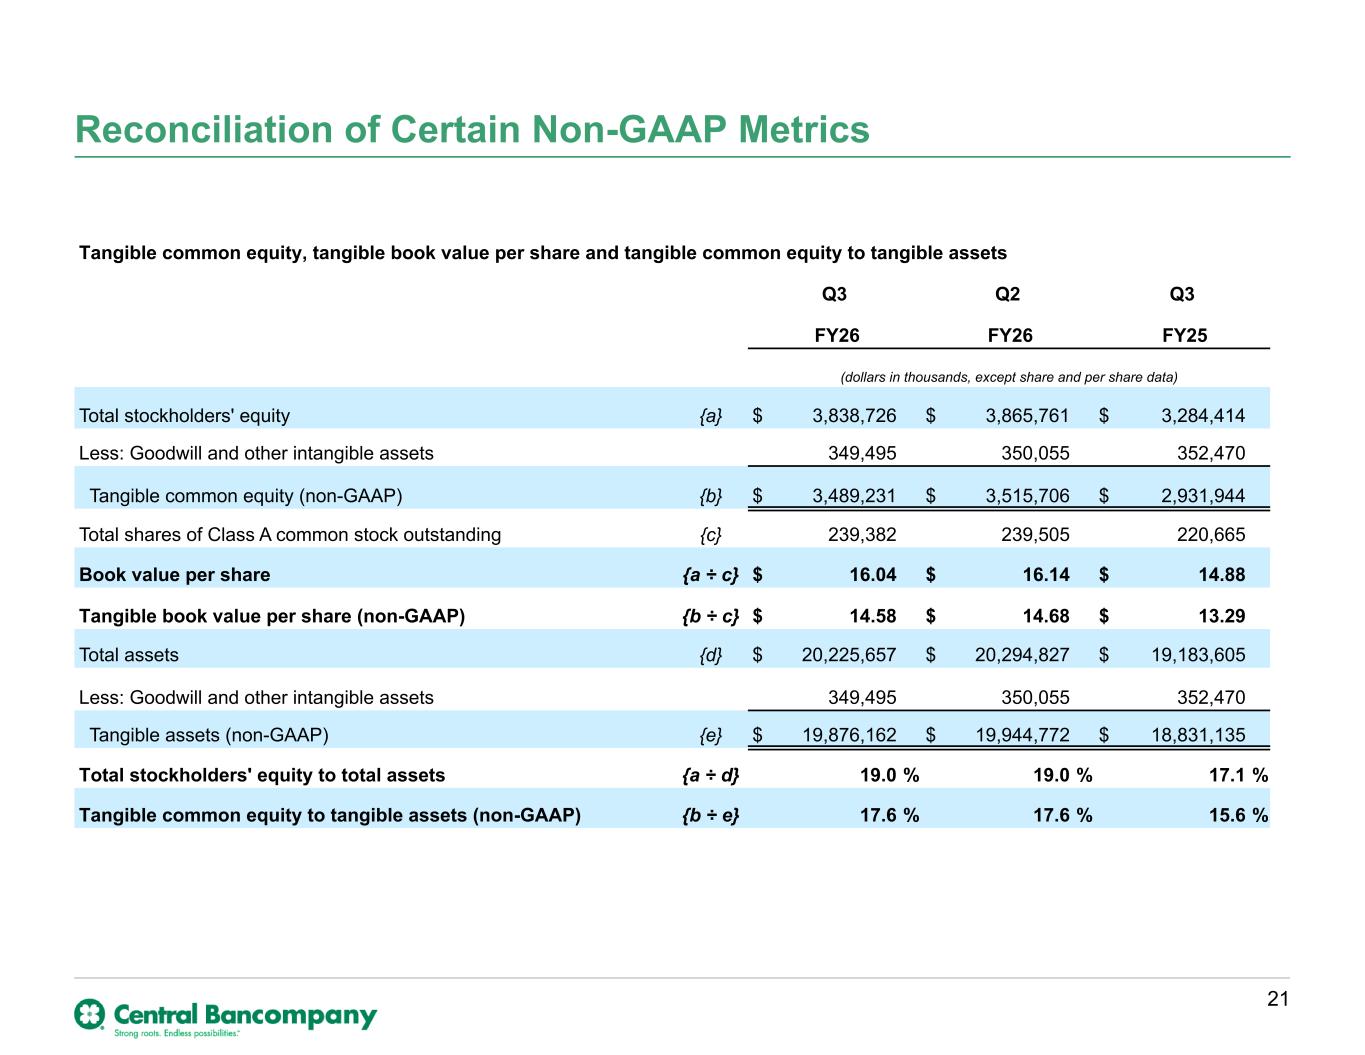
Reconciliation of Certain Non-GAAP Metrics 21 Tangible common equity, tangible book value per share and tangible common equity to tangible assets Q3 Q2 Q3 FY26 FY26 FY25 (dollars in thousands, except share and per share data) Total stockholders' equity {a} $ 3,838,726 $ 3,865,761 $ 3,284,414 Less: Goodwill and other intangible assets 349,495 350,055 352,470 Tangible common equity (non-GAAP) {b} $ 3,489,231 $ 3,515,706 $ 2,931,944 Total shares of Class A common stock outstanding {c} 239,382 239,505 220,665 Book value per share {a ÷ c} $ 16.04 $ 16.14 $ 14.88 Tangible book value per share (non-GAAP) {b ÷ c} $ 14.58 $ 14.68 $ 13.29 Total assets {d} $ 20,225,657 $ 20,294,827 $ 19,183,605 Less: Goodwill and other intangible assets 349,495 350,055 352,470 Tangible assets (non-GAAP) {e} $ 19,876,162 $ 19,944,772 $ 18,831,135 Total stockholders' equity to total assets {a ÷ d} 19.0 % 19.0 % 17.1 % Tangible common equity to tangible assets (non-GAAP) {b ÷ e} 17.6 % 17.6 % 15.6 %
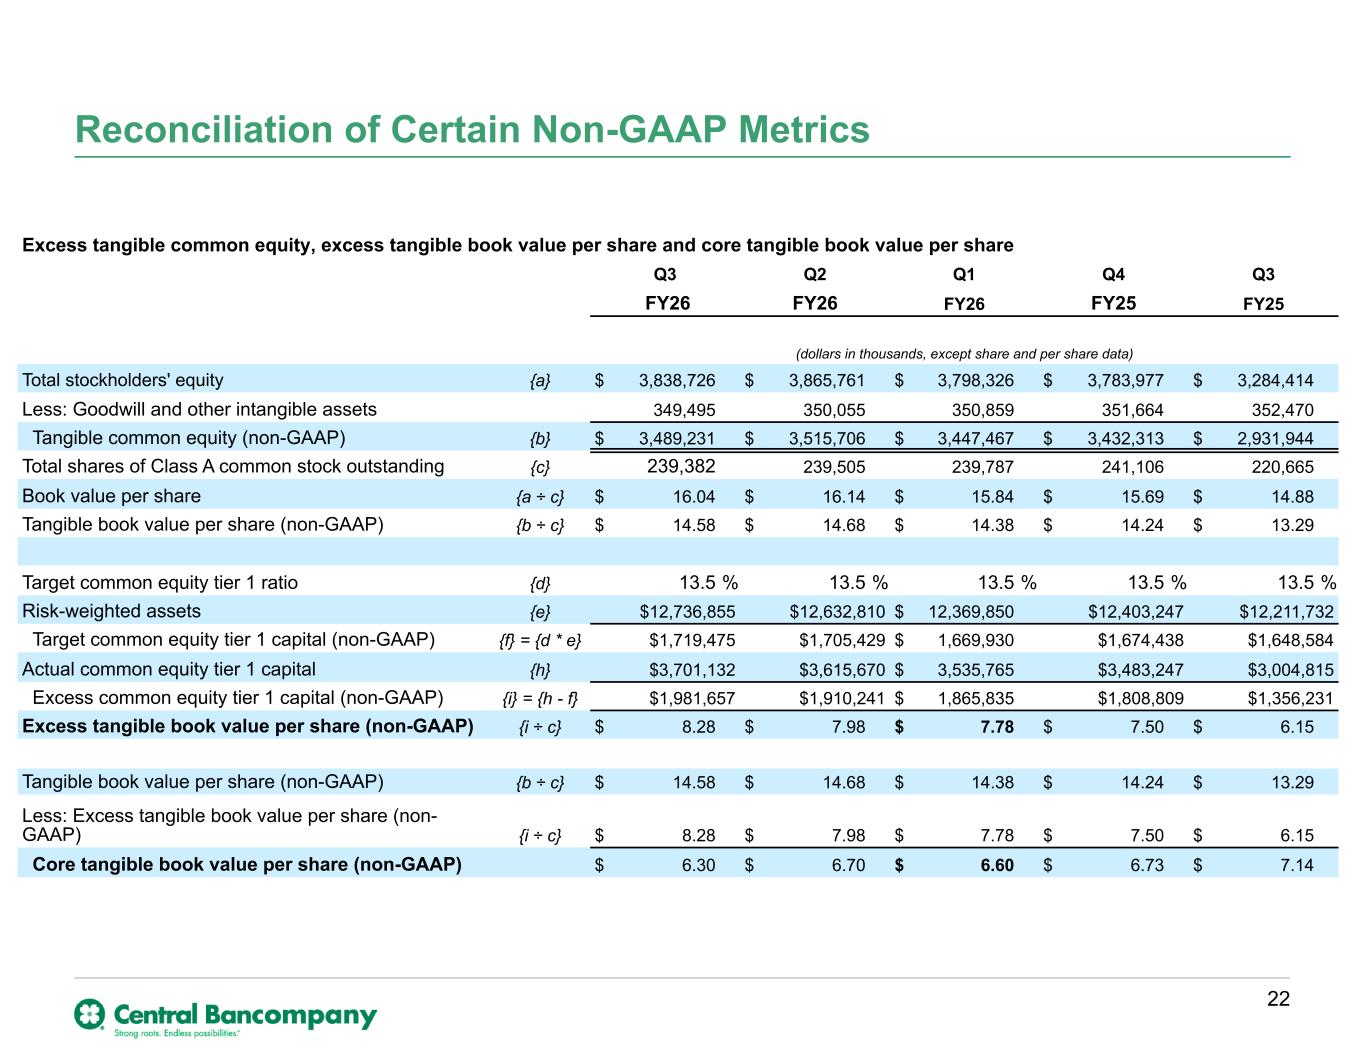
Reconciliation of Certain Non-GAAP Metrics 22 Excess tangible common equity, excess tangible book value per share and core tangible book value per share Q3 Q2 Q1 Q4 Q3 FY26 FY26 FY26 FY25 FY25 (dollars in thousands, except share and per share data) Total stockholders' equity {a} $ 3,838,726 $ 3,865,761 $ 3,798,326 $ 3,783,977 $ 3,284,414 Less: Goodwill and other intangible assets 349,495 350,055 350,859 351,664 352,470 Tangible common equity (non-GAAP) {b} $ 3,489,231 $ 3,515,706 $ 3,447,467 $ 3,432,313 $ 2,931,944 Total shares of Class A common stock outstanding {c} 239,382 239,505 239,787 241,106 220,665 Book value per share {a ÷ c} $ 16.04 $ 16.14 $ 15.84 $ 15.69 $ 14.88 Tangible book value per share (non-GAAP) {b ÷ c} $ 14.58 $ 14.68 $ 14.38 $ 14.24 $ 13.29 Target common equity tier 1 ratio {d} 13.5 % 13.5 % 13.5 % 13.5 % 13.5 % Risk-weighted assets {e} $12,736,855 $12,632,810 $ 12,369,850 $12,403,247 $12,211,732 Target common equity tier 1 capital (non-GAAP) {f} = {d * e} $1,719,475 $1,705,429 $ 1,669,930 $1,674,438 $1,648,584 Actual common equity tier 1 capital {h} $3,701,132 $3,615,670 $ 3,535,765 $3,483,247 $3,004,815 Excess common equity tier 1 capital (non-GAAP) {i} = {h - f} $1,981,657 $1,910,241 $ 1,865,835 $1,808,809 $1,356,231 Excess tangible book value per share (non-GAAP) {i ÷ c} $ 8.28 $ 7.98 $ 7.78 $ 7.50 $ 6.15 Tangible book value per share (non-GAAP) {b ÷ c} $ 14.58 $ 14.68 $ 14.38 $ 14.24 $ 13.29 Less: Excess tangible book value per share (non- GAAP) {i ÷ c} $ 8.28 $ 7.98 $ 7.78 $ 7.50 $ 6.15 Core tangible book value per share (non-GAAP) $ 6.30 $ 6.70 $ 6.60 $ 6.73 $ 7.14
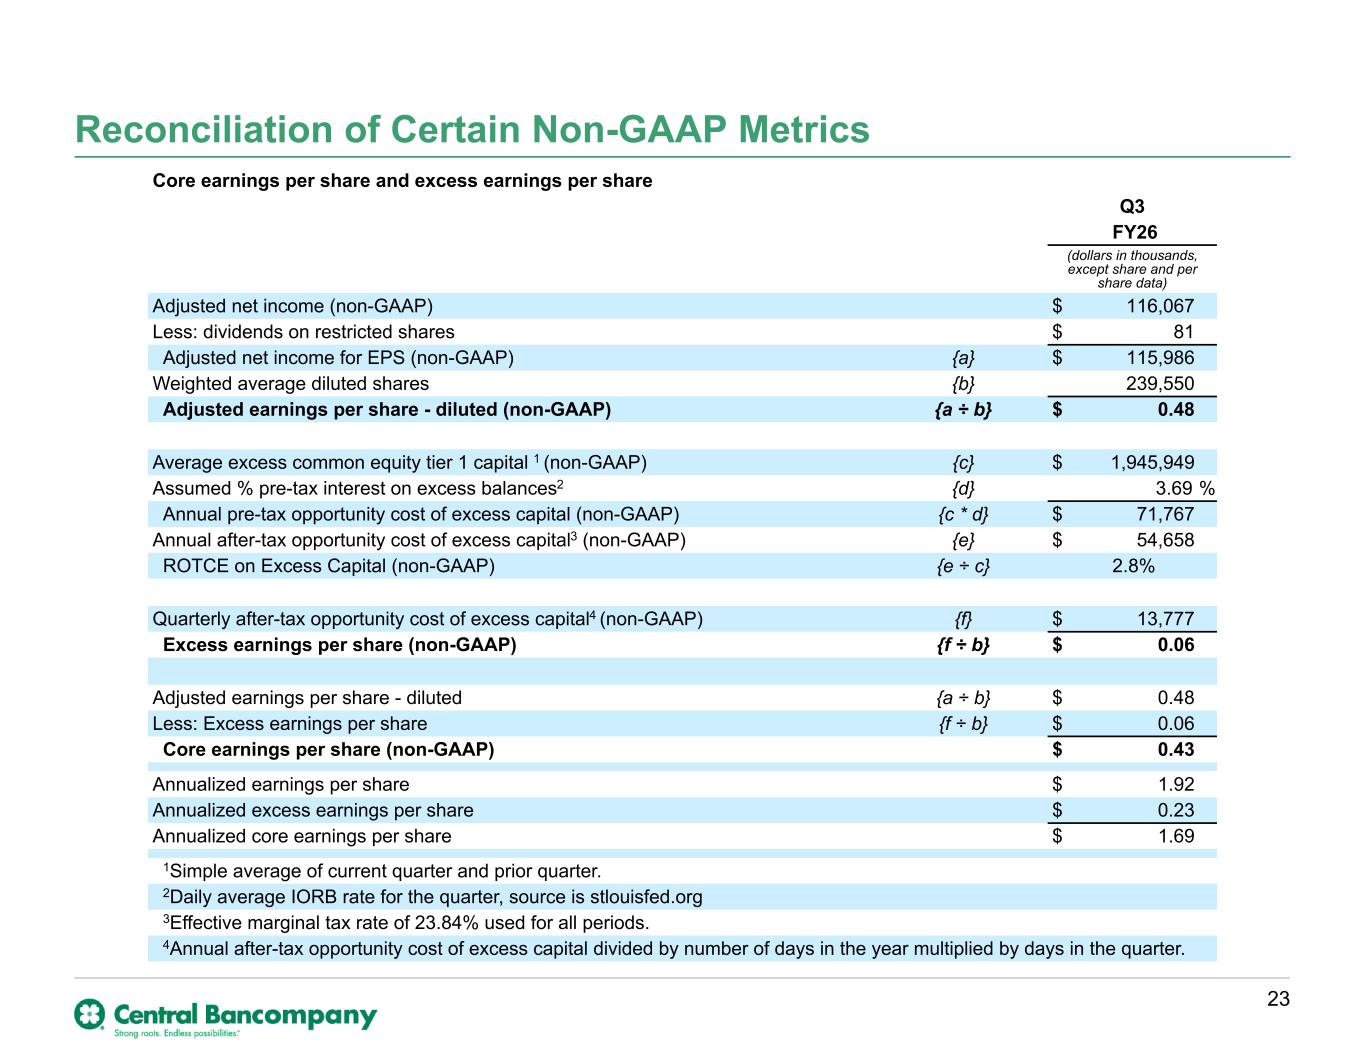
Reconciliation of Certain Non-GAAP Metrics 23 Core earnings per share and excess earnings per share Q3 FY26 (dollars in thousands, except share and per share data) Adjusted net income (non-GAAP) $ 116,067 Less: dividends on restricted shares $ 81 Adjusted net income for EPS (non-GAAP) {a} $ 115,986 Weighted average diluted shares {b} 239,550 Adjusted earnings per share - diluted (non-GAAP) {a ÷ b} $ 0.48 Average excess common equity tier 1 capital 1 (non-GAAP) {c} $ 1,945,949 Assumed % pre-tax interest on excess balances2 {d} 3.69 % Annual pre-tax opportunity cost of excess capital (non-GAAP) {c * d} $ 71,767 Annual after-tax opportunity cost of excess capital3 (non-GAAP) {e} $ 54,658 ROTCE on Excess Capital (non-GAAP) {e ÷ c} 2.8% Quarterly after-tax opportunity cost of excess capital4 (non-GAAP) {f} $ 13,777 Excess earnings per share (non-GAAP) {f ÷ b} $ 0.06 Adjusted earnings per share - diluted {a ÷ b} $ 0.48 Less: Excess earnings per share {f ÷ b} $ 0.06 Core earnings per share (non-GAAP) $ 0.43 Annualized earnings per share $ 1.92 Annualized excess earnings per share $ 0.23 Annualized core earnings per share $ 1.69 1Simple average of current quarter and prior quarter. 2Daily average IORB rate for the quarter, source is stlouisfed.org 3Effective marginal tax rate of 23.84% used for all periods. 4Annual after-tax opportunity cost of excess capital divided by number of days in the year multiplied by days in the quarter.
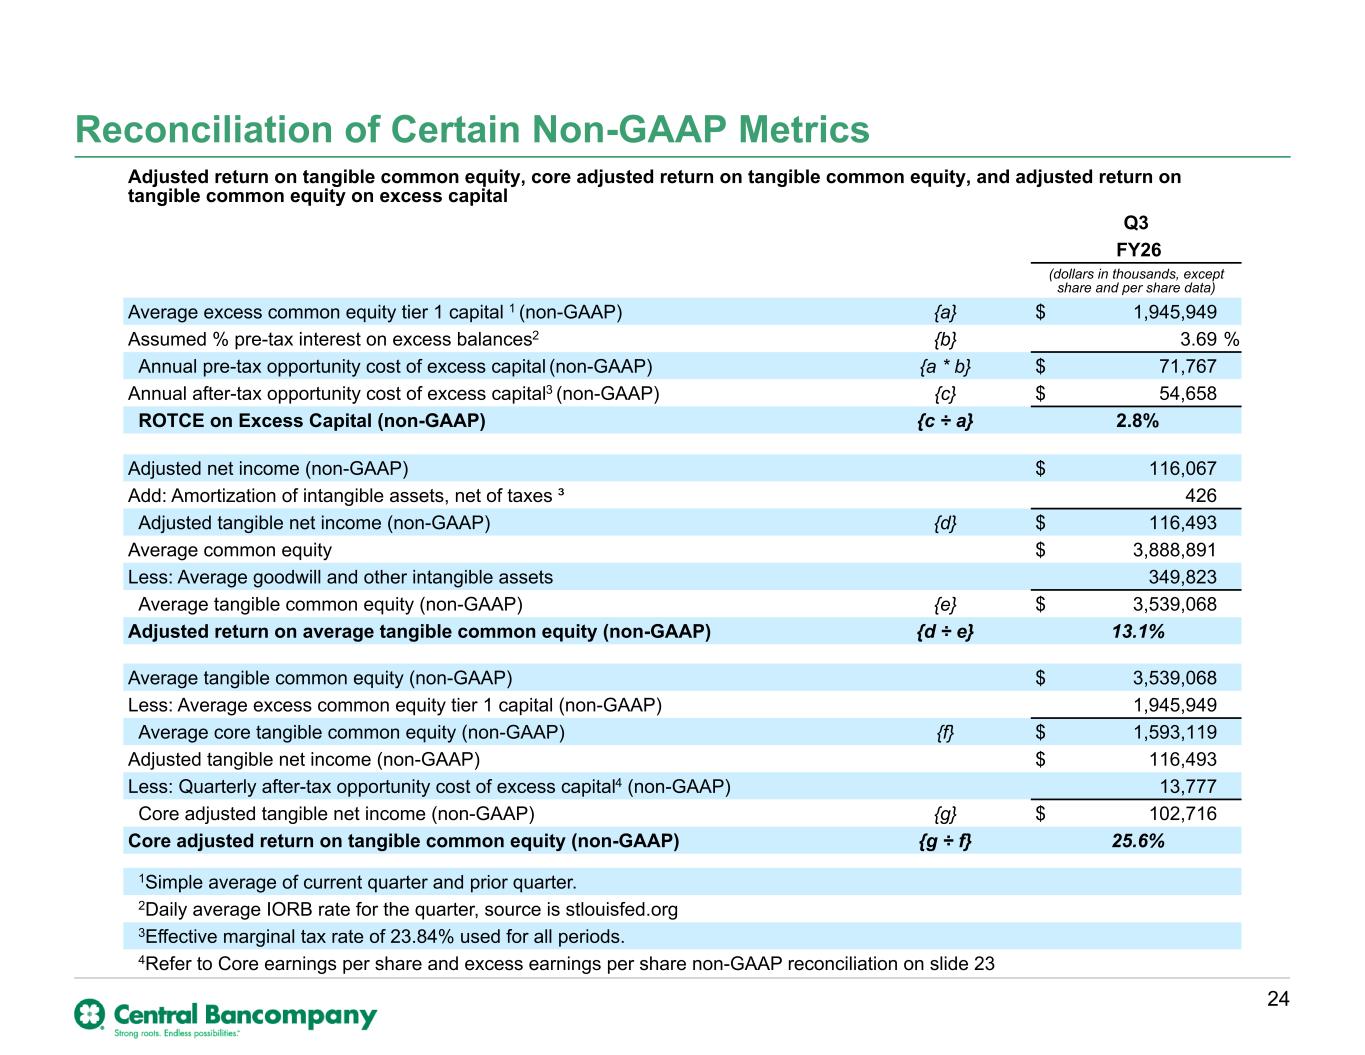
Reconciliation of Certain Non-GAAP Metrics 24 Adjusted return on tangible common equity, core adjusted return on tangible common equity, and adjusted return on tangible common equity on excess capital Q3 FY26 (dollars in thousands, except share and per share data) Average excess common equity tier 1 capital 1 (non-GAAP) {a} $ 1,945,949 Assumed % pre-tax interest on excess balances2 {b} 3.69 % Annual pre-tax opportunity cost of excess capital (non-GAAP) {a * b} $ 71,767 Annual after-tax opportunity cost of excess capital3 (non-GAAP) {c} $ 54,658 ROTCE on Excess Capital (non-GAAP) {c ÷ a} 2.8% Adjusted net income (non-GAAP) $ 116,067 Add: Amortization of intangible assets, net of taxes ³ 426 Adjusted tangible net income (non-GAAP) {d} $ 116,493 Average common equity $ 3,888,891 Less: Average goodwill and other intangible assets 349,823 Average tangible common equity (non-GAAP) {e} $ 3,539,068 Adjusted return on average tangible common equity (non-GAAP) {d ÷ e} 13.1% Average tangible common equity (non-GAAP) $ 3,539,068 Less: Average excess common equity tier 1 capital (non-GAAP) 1,945,949 Average core tangible common equity (non-GAAP) {f} $ 1,593,119 Adjusted tangible net income (non-GAAP) $ 116,493 Less: Quarterly after-tax opportunity cost of excess capital4 (non-GAAP) 13,777 Core adjusted tangible net income (non-GAAP) {g} $ 102,716 Core adjusted return on tangible common equity (non-GAAP) {g ÷ f} 25.6% 1Simple average of current quarter and prior quarter. 2Daily average IORB rate for the quarter, source is stlouisfed.org 3Effective marginal tax rate of 23.84% used for all periods. 4Refer to Core earnings per share and excess earnings per share non-GAAP reconciliation on slide 23
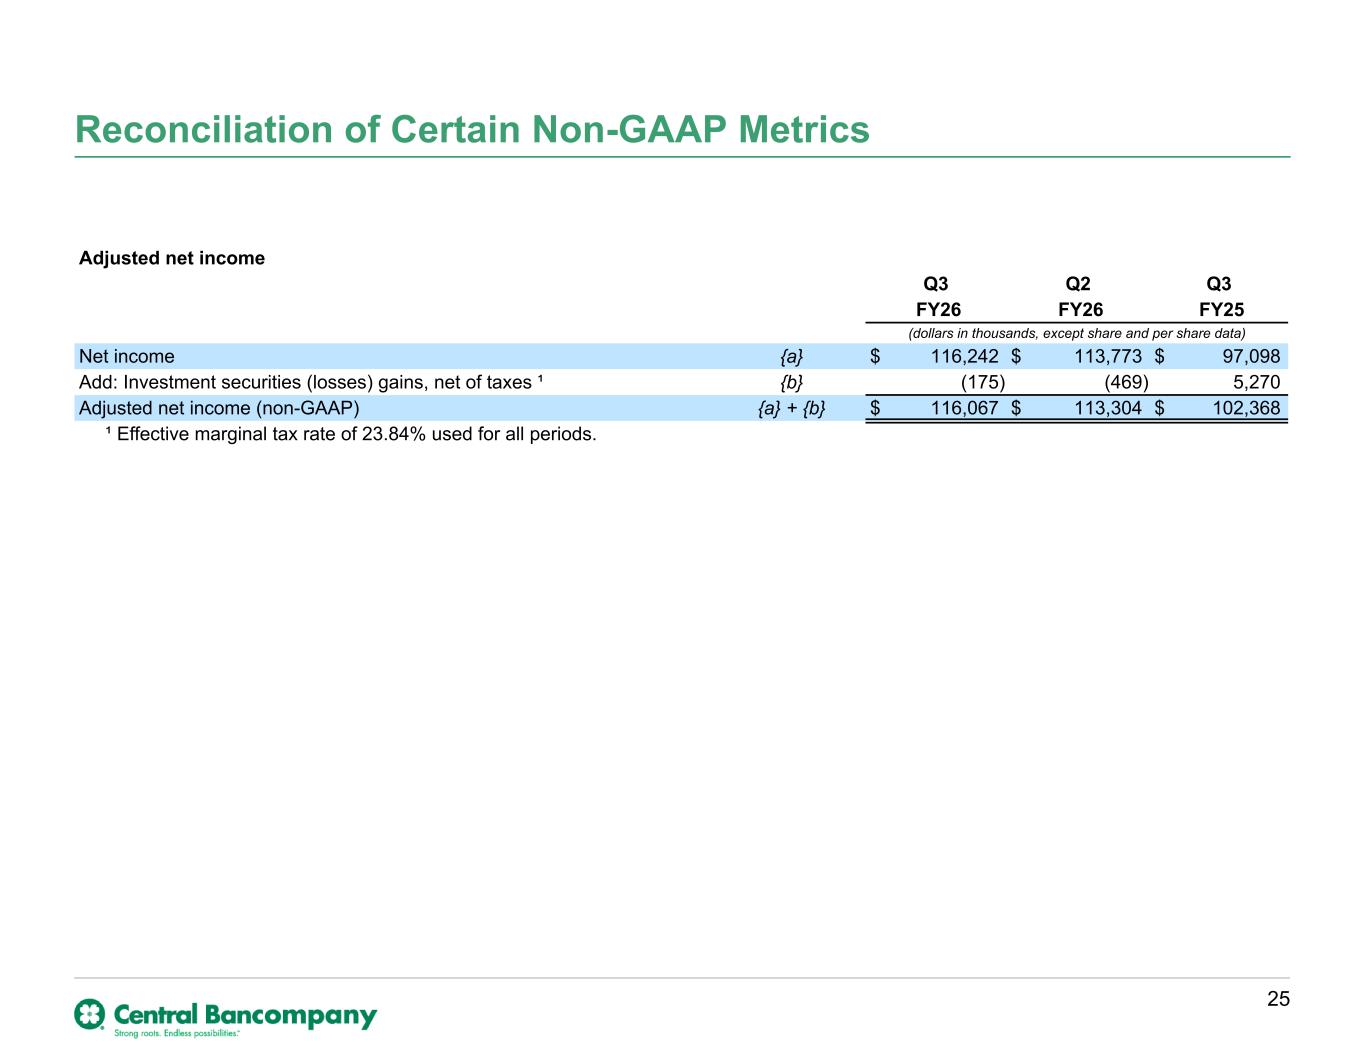
Reconciliation of Certain Non-GAAP Metrics 25 Adjusted net income Q3 Q2 Q3 FY26 FY26 FY25 (dollars in thousands, except share and per share data) Net income {a} $ 116,242 $ 113,773 $ 97,098 Add: Investment securities (losses) gains, net of taxes ¹ {b} (175) (469) 5,270 Adjusted net income (non-GAAP) {a} + {b} $ 116,067 $ 113,304 $ 102,368 ¹ Effective marginal tax rate of 23.84% used for all periods.
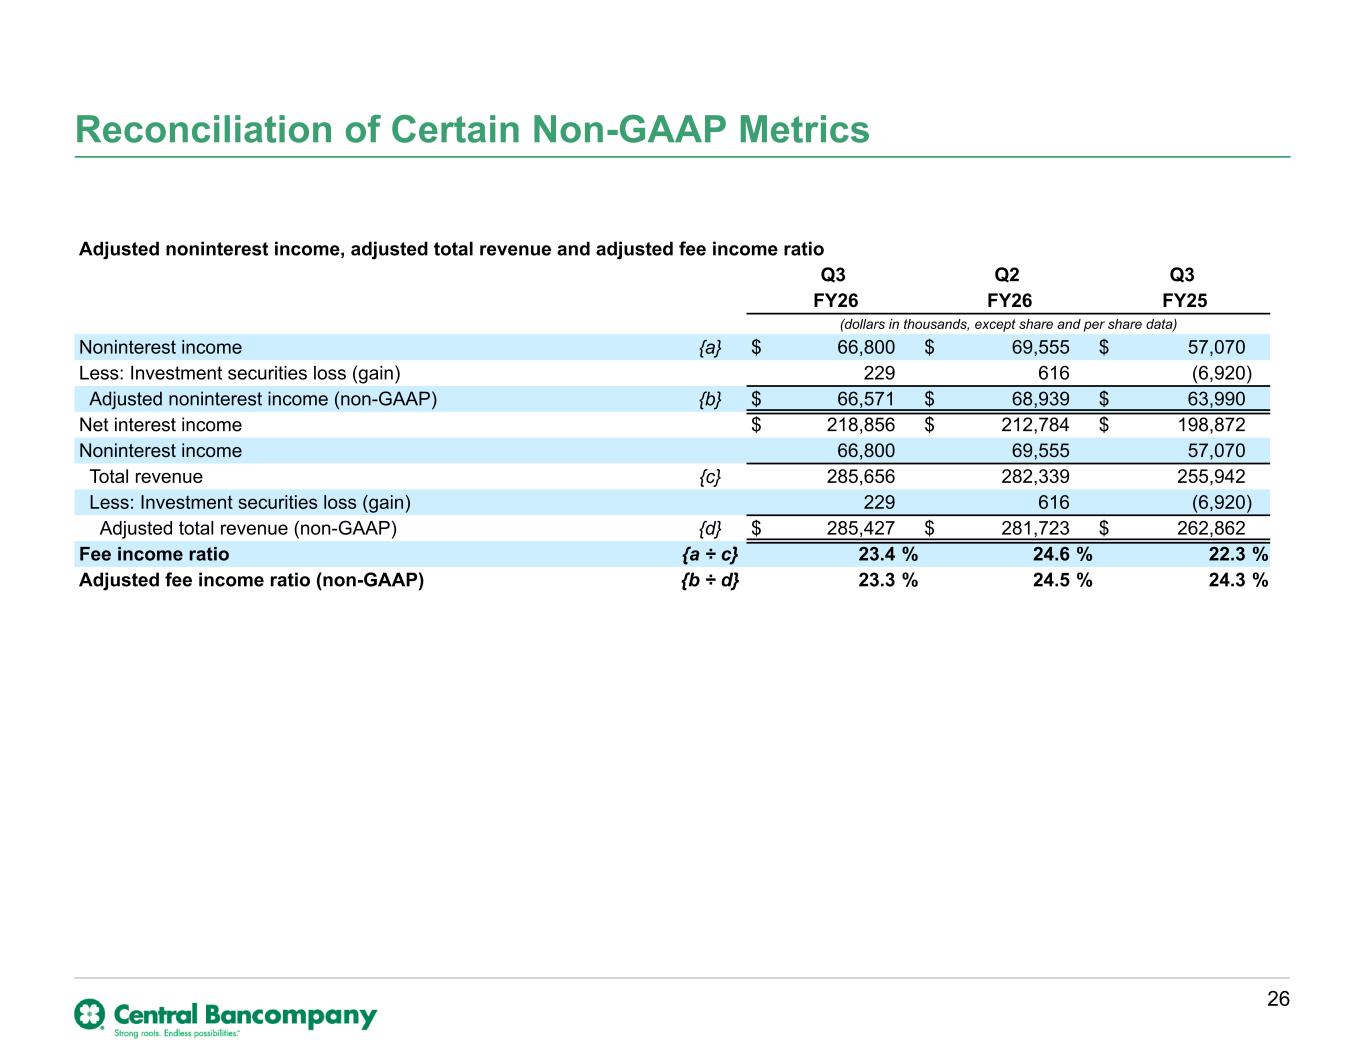
Reconciliation of Certain Non-GAAP Metrics 26 Adjusted noninterest income, adjusted total revenue and adjusted fee income ratio Q3 Q2 Q3 FY26 FY26 FY25 (dollars in thousands, except share and per share data) Noninterest income {a} $ 66,800 $ 69,555 $ 57,070 Less: Investment securities loss (gain) 229 616 (6,920) Adjusted noninterest income (non-GAAP) {b} $ 66,571 $ 68,939 $ 63,990 Net interest income $ 218,856 $ 212,784 $ 198,872 Noninterest income 66,800 69,555 57,070 Total revenue {c} 285,656 282,339 255,942 Less: Investment securities loss (gain) 229 616 (6,920) Adjusted total revenue (non-GAAP) {d} $ 285,427 $ 281,723 $ 262,862 Fee income ratio {a ÷ c} 23.4 % 24.6 % 22.3 % Adjusted fee income ratio (non-GAAP) {b ÷ d} 23.3 % 24.5 % 24.3 %