Pay vs Performance Disclosure - USD ($)
|
12 Months Ended |
Jul. 31, 2026 |
Jul. 31, 2025 |
Jul. 31, 2024 |
Jul. 31, 2023 |
Jul. 31, 2022 |
| Pay vs Performance Disclosure |
|
|
|
|
|
| Pay vs Performance Disclosure, Table |
Pay vs. Performance As required by Section 953(a) of the Dodd-Frank Wall Street Reform and Consumer Protection Act and Item 402(v) of Regulation S-K, we are providing the following information about the relationship between executive compensation and certain financial performance measures of the Company. For further information concerning the Company’s pay-for-performance philosophy and how executive compensation aligns with the Company’s performance, please see the “Executive Compensation—Compensation Discussion and Analysis” section of this Proxy Statement. Pay vs. Performance Table | | | | | | | | | | | | | | | | | | | | | | | | | | | | | | | | | | | | | | | | | | | | | | | | | | | | Summary Comp Table Total for PEO(2) | Compensation Actually Paid to PEO(3) | Average Summary Comp Table Total for Non- PEO NEOs(2) | Average Compensation Actually Paid to Non- PEO NEOs(4) | | Value of initial fixed $100
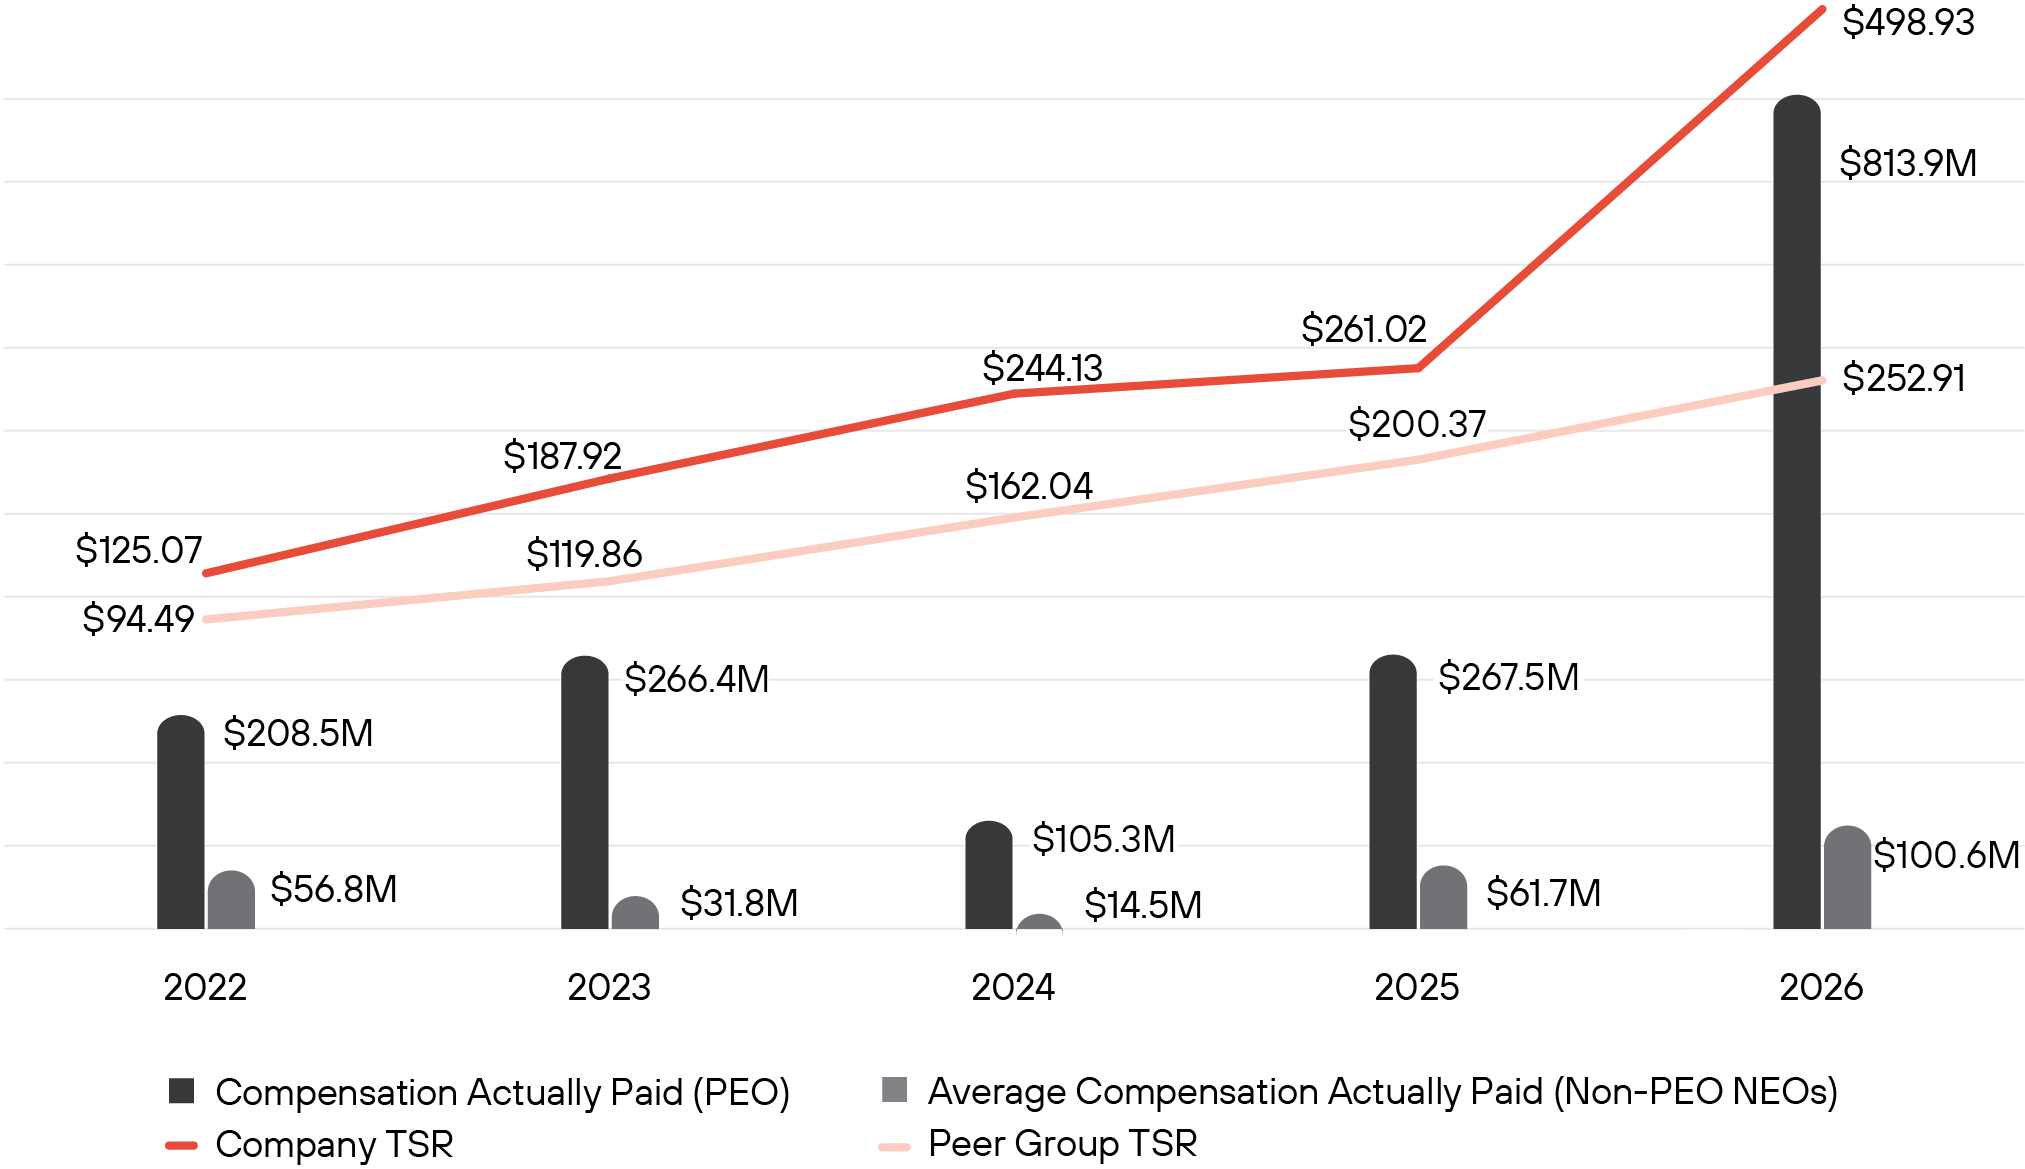
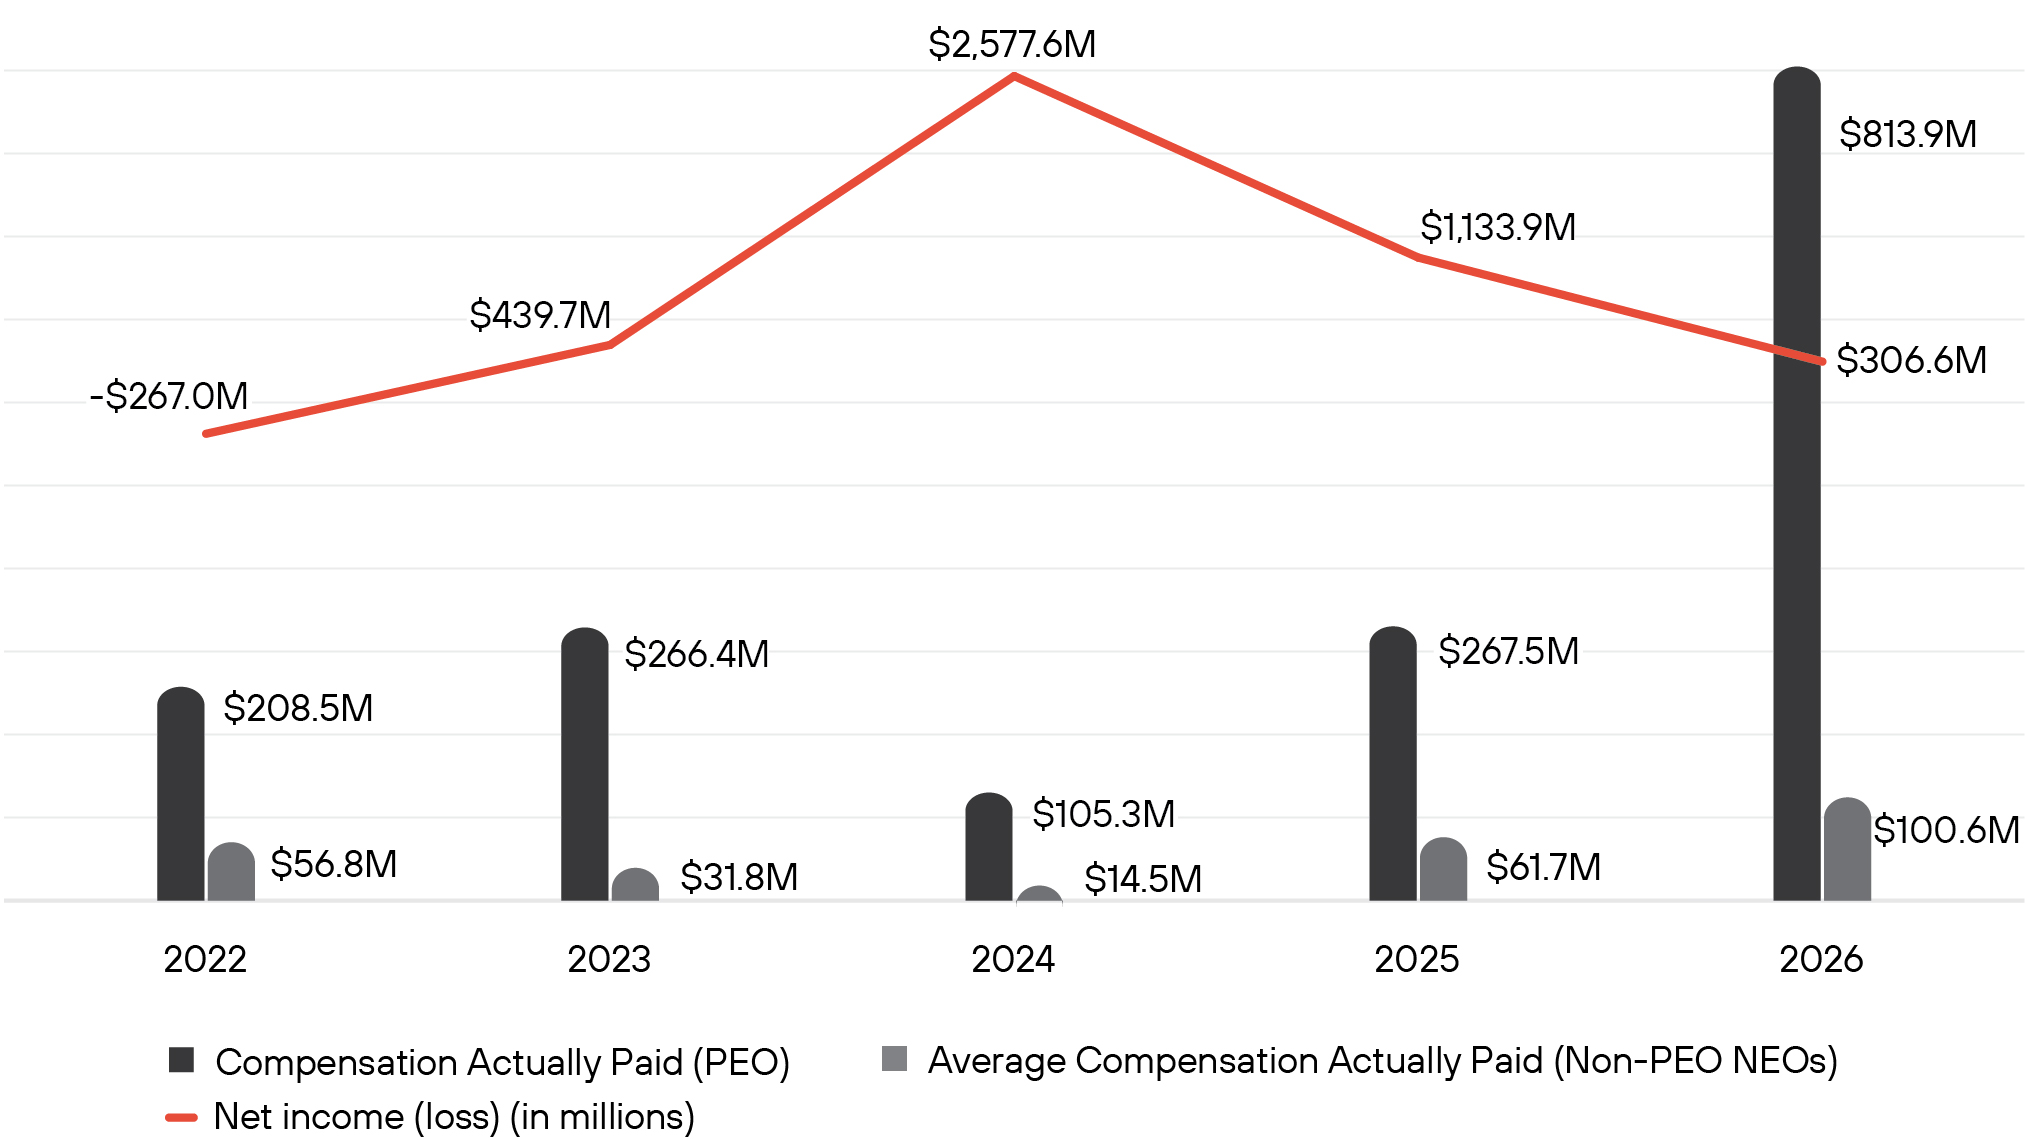
investment based on | Net Income (Loss) (in millions)(7) | Company Selected Measure: Annual NGS ARR (in billions)(8) | Year(1) | | Company TSR(5) | Peer Group TSR(6) | | 2026 | | $ | 80,270,519 | | | $ | 813,879,588 | | | $ | 16,053,492 | | | $ | 100,647,684 | | | | $ | 498.93 | | | $ | 252.91 | | | $ | 306.6 | | 9.1 | | | 2025 | | $ | 99,736,336 | | | $ | 267,474,290 | | | $ | 23,541,480 | | | $ | 61,685,286 | | | | $ | 261.02 | | | $ | 200.37 | | | $ | 1,133.9 | | 5.6 | | | 2024 | | $ | 58,036,875 | | | $ | 105,275,811 | | | $ | 16,323,792 | | | $ | 14,485,907 | | | | $ | 244.13 | | | $ | 162.04 | | | $ | 2,577.6 | | 4.2 | | | 2023 | | $ | 151,425,203 | | | $ | 266,368,755 | | | $ | 12,145,914 | | | $ | 31,768,696 | | | | $ | 187.92 | | | $ | 119.86 | | | $ | 439.7 | | 3.0 | | | 2022 | | $ | 10,410,477 | | | $ | 208,514,831 | | | $ | 8,058,186 | | | $ | 56,805,285 | | | | $ | 125.07 | | | $ | 94.49 | | | $ | -267.0 | | 1.9 | |
|
|
|
|
|
| Company Selected Measure Name |
NGS ARR
|
|
|
|
|
| Named Executive Officers, Footnote |
During each of the years presented, our PEO was Nikesh Arora. During each of the years presented, our non-PEO NEOs were Dipak Golechha, William “BJ” Jenkins, Lee Klarich, and Nir Zuk.
|
|
|
|
|
| Peer Group Issuers, Footnote |
Pursuant to Item 402(v) of Regulation S-K, assumes $100 was invested on July 31, 2021 in the stocks represented by the peer group and reinvestment of dividends. The peer group consists of the S&P 500 Information Technology Index, an independently prepared index, which is the peer group we used for the stock performance graph required by Item 201(e) of Regulation S-K included in our Annual Report for the year ended July 31, 2026.
|
|
|
|
|
| PEO Total Compensation Amount |
$ 80,270,519
|
$ 99,736,336
|
$ 58,036,875
|
$ 151,425,203
|
$ 10,410,477
|
| PEO Actually Paid Compensation Amount |
$ 813,879,588
|
267,474,290
|
105,275,811
|
266,368,755
|
208,514,831
|
| Adjustment To PEO Compensation, Footnote |
“Compensation actually paid” is calculated in accordance with Item 402(v) of Regulation S-K. The table below sets forth the adjustments made during our fiscal 2026 presented in the table to calculate the “Compensation Actually Paid” to our PEO, Mr. Arora, for fiscal 2026. PEO | | | | | | | | | | 2026 | | Total Reported in SCT for the covered fiscal year | | $ | 80,270,519 | | | Less, grant date fair value of equity awards reported in SCT for the covered fiscal year | | (75,937,806) | | | Plus, fair value (as of the end of the covered fiscal year) of equity awards granted in the covered fiscal year that are unvested and outstanding as of the end of the covered fiscal year, computed in accordance with ASC Topic 718 | | 325,831,336 | | | Plus, change in fair value (from the end of the prior fiscal year to the end of the covered fiscal year) of equity awards granted in any prior fiscal year that are outstanding and unvested as of the end of the covered fiscal year, computed in accordance with ASC Topic 718 | | 428,091,764 | | | Plus, fair value (as of the vesting date) of equity awards that are granted and vested in the covered fiscal year, computed in accordance with ASC Topic 718 | | - | | | Plus, change in fair value (from the end of the prior fiscal year to the vesting date) of equity awards granted in any prior fiscal year that vested in the covered fiscal year, computed in accordance with ASC Topic 718 | | 55,623,775 | | | Less, fair value (as of the end of the prior fiscal year) of equity awards granted in any prior fiscal year that failed to meet the applicable vesting conditions in the covered fiscal year, computed in accordance with ASC Topic 718 | | - | | | Total Adjustments | | 733,609,069 | | | Compensation Actually Paid | | $ | 813,879,588 | |
|
|
|
|
|
| Non-PEO NEO Average Total Compensation Amount |
$ 16,053,492
|
23,541,480
|
16,323,792
|
12,145,914
|
8,058,186
|
| Non-PEO NEO Average Compensation Actually Paid Amount |
$ 100,647,684
|
61,685,286
|
14,485,907
|
31,768,696
|
56,805,285
|
| Adjustment to Non-PEO NEO Compensation Footnote |
“Compensation actually paid” is calculated in accordance with Item 402(v) of Regulation S-K. The table below sets forth the adjustments made during our fiscal 2026 presented in the table to calculate the “Average Compensation Actually Paid” to our non-PEO NEOs for fiscal 2026. Non-PEO NEOs | | | | | | | | | | 2026 | | Average Total Reported in SCT for the covered fiscal year | | $ | 16,053,492 | | | Less, average grant date fair value of equity awards reported in SCT for the covered fiscal year | | (14,993,067) | | | Plus, average fair value (as of the end of the covered fiscal year) of equity awards granted in the covered fiscal year that are unvested and outstanding as of the end of the covered fiscal year, computed in accordance with ASC Topic 718 | | 57,113,283 | | | Plus, average change in fair value (from the end of the prior fiscal year to the end of the covered fiscal year) of equity awards granted in any prior fiscal year that are outstanding and unvested as of the end of the covered fiscal year, computed in accordance with ASC Topic 718 | | 30,163,503 | | | Plus, average fair value (as of the vesting date) of equity awards that are granted and vested in the covered fiscal year, computed in accordance with ASC Topic 718 | | - | | | Plus, average change in fair value (from the end of the prior fiscal year to the vesting date) of equity awards granted in any prior fiscal year that vested in the covered fiscal year, computed in accordance with ASC Topic 718 | | 15,379,793 | | | Less, average fair value (as of the end of the prior fiscal year) of equity awards granted in any prior fiscal year that failed to meet the applicable vesting conditions in the covered fiscal year, computed in accordance with ASC Topic 718 | | (3,069,320) | | | Total Adjustments | | 84,594,192 | | | Average Compensation Actually Paid | | $ | 100,647,684 | |
|
|
|
|
|
| Compensation Actually Paid vs. Total Shareholder Return |
CAP vs. TSR
|
|
|
|
|
| Compensation Actually Paid vs. Net Income |
CAP vs. Net Income (Loss)
|
|
|
|
|
| Compensation Actually Paid vs. Company Selected Measure |
CAP vs NGS ARR
|
|
|
|
|
| Tabular List, Table |
•Relative TSR Percentile Rank, which is how the Company’s TSR compares to the TSRs of the companies that are a component of the S&P 500 Index on the last day of the applicable performance period •NGS ARR •Annual Non-GAAP EPS •Organic Revenue •Organic Operating Margin
|
|
|
|
|
| Total Shareholder Return Amount |
$ 498.93
|
261.02
|
244.13
|
187.92
|
125.07
|
| Peer Group Total Shareholder Return Amount |
252.91
|
200.37
|
162.04
|
119.86
|
94.49
|
| Net Income (Loss) |
$ 306,600,000
|
$ 1,133,900,000
|
$ 2,577,600,000
|
$ 439,700,000
|
$ (267,000,000.0)
|
| Company Selected Measure Amount |
9,100,000,000
|
5,600,000,000
|
4,200,000,000
|
3,000,000,000.0
|
1,900,000,000
|
| PEO Name |
Nikesh Arora
|
Nikesh Arora
|
Nikesh Arora
|
Nikesh Arora
|
Nikesh Arora
|
| Measure:: 1 |
|
|
|
|
|
| Pay vs Performance Disclosure |
|
|
|
|
|
| Name |
NGS ARR
|
|
|
|
|
| Non-GAAP Measure Description |
We have selected NGS ARR as the Company-Selected Measure because NGS ARR is an operating metric that we use to assess the strength and trajectory of our business. Given this, NGS ARR was utilized as a financial performance measure in the PSUs granted in fiscal 2026. NGS ARR represents the annualized allocated revenue of all active contracts as of the final day of the reporting period related to all product, subscription and support offerings, excluding revenue from hardware products, and legacy attached subscriptions, support offerings and professional services. The scope of products, subscriptions, and support offerings that contribute to NGS ARR will generally increase over time as we introduce or acquire new next-generation products, subscriptions, and support offerings.
|
|
|
|
|
| Measure:: 2 |
|
|
|
|
|
| Pay vs Performance Disclosure |
|
|
|
|
|
| Name |
Relative TSR Percentile Rank, which is how the Company’s TSR compares to the TSRs of the companies that are a component of the S&P 500 Index on the last day of the applicable performance period
|
|
|
|
|
| Measure:: 3 |
|
|
|
|
|
| Pay vs Performance Disclosure |
|
|
|
|
|
| Name |
Annual Non-GAAP EPS
|
|
|
|
|
| Measure:: 4 |
|
|
|
|
|
| Pay vs Performance Disclosure |
|
|
|
|
|
| Name |
Organic Revenue
|
|
|
|
|
| Measure:: 5 |
|
|
|
|
|
| Pay vs Performance Disclosure |
|
|
|
|
|
| Name |
Organic Operating Margin
|
|
|
|
|
| PEO |
|
|
|
|
|
| Pay vs Performance Disclosure |
|
|
|
|
|
| Adjustment to Compensation, Amount |
$ 733,609,069
|
|
|
|
|
| PEO | Less, grant date fair value of equity awards reported in SCT for the covered fiscal year [Member] |
|
|
|
|
|
| Pay vs Performance Disclosure |
|
|
|
|
|
| Adjustment to Compensation, Amount |
(75,937,806)
|
|
|
|
|
| PEO | Plus, fair value of equity awards granted in the covered fiscal year that are unvested and outstanding as of the end of the covered fiscal year [Member] |
|
|
|
|
|
| Pay vs Performance Disclosure |
|
|
|
|
|
| Adjustment to Compensation, Amount |
325,831,336
|
|
|
|
|
| PEO | Plus, change in fair value of equity awards granted in any prior fiscal year that are outstanding and unvested as of the end of the covered fiscal year [Member] |
|
|
|
|
|
| Pay vs Performance Disclosure |
|
|
|
|
|
| Adjustment to Compensation, Amount |
428,091,764
|
|
|
|
|
| PEO | Plus, fair value (as of the vesting date) of equity awards that are granted and vested in the covered fiscal year, computed in accordance with ASC Topic 718 [Member] |
|
|
|
|
|
| Pay vs Performance Disclosure |
|
|
|
|
|
| Adjustment to Compensation, Amount |
0
|
|
|
|
|
| PEO | Plus, change in fair value of equity awards granted in any prior fiscal year that vested in the covered fiscal year, computed in accordance with ASC Topic 718 [Member] |
|
|
|
|
|
| Pay vs Performance Disclosure |
|
|
|
|
|
| Adjustment to Compensation, Amount |
55,623,775
|
|
|
|
|
| PEO | Less, fair value of equity awards granted in any prior fiscal year that failed to meet the applicable vesting conditions in the covered fiscal year, computed in accordance with ASC Topic 718 [Member] |
|
|
|
|
|
| Pay vs Performance Disclosure |
|
|
|
|
|
| Adjustment to Compensation, Amount |
0
|
|
|
|
|
| Non-PEO NEO |
|
|
|
|
|
| Pay vs Performance Disclosure |
|
|
|
|
|
| Adjustment to Compensation, Amount |
84,594,192
|
|
|
|
|
| Non-PEO NEO | Less, grant date fair value of equity awards reported in SCT for the covered fiscal year [Member] |
|
|
|
|
|
| Pay vs Performance Disclosure |
|
|
|
|
|
| Adjustment to Compensation, Amount |
(14,993,067)
|
|
|
|
|
| Non-PEO NEO | Plus, fair value of equity awards granted in the covered fiscal year that are unvested and outstanding as of the end of the covered fiscal year [Member] |
|
|
|
|
|
| Pay vs Performance Disclosure |
|
|
|
|
|
| Adjustment to Compensation, Amount |
57,113,283
|
|
|
|
|
| Non-PEO NEO | Plus, change in fair value of equity awards granted in any prior fiscal year that are outstanding and unvested as of the end of the covered fiscal year [Member] |
|
|
|
|
|
| Pay vs Performance Disclosure |
|
|
|
|
|
| Adjustment to Compensation, Amount |
30,163,503
|
|
|
|
|
| Non-PEO NEO | Plus, fair value (as of the vesting date) of equity awards that are granted and vested in the covered fiscal year, computed in accordance with ASC Topic 718 [Member] |
|
|
|
|
|
| Pay vs Performance Disclosure |
|
|
|
|
|
| Adjustment to Compensation, Amount |
0
|
|
|
|
|
| Non-PEO NEO | Plus, change in fair value of equity awards granted in any prior fiscal year that vested in the covered fiscal year, computed in accordance with ASC Topic 718 [Member] |
|
|
|
|
|
| Pay vs Performance Disclosure |
|
|
|
|
|
| Adjustment to Compensation, Amount |
15,379,793
|
|
|
|
|
| Non-PEO NEO | Less, fair value of equity awards granted in any prior fiscal year that failed to meet the applicable vesting conditions in the covered fiscal year, computed in accordance with ASC Topic 718 [Member] |
|
|
|
|
|
| Pay vs Performance Disclosure |
|
|
|
|
|
| Adjustment to Compensation, Amount |
$ (3,069,320)
|
|
|
|
|