Pay vs Performance Disclosure - USD ($)
Jun. 30, 2026
Jun. 30, 2025
Jun. 30, 2024
Jun. 30, 2023
Jun. 30, 2022
Pay-Versus-Performance Disclosure
The Compensation Committee approves and administers our executive compensation program, which it designs to attract, incentivize, reward and retain our executive officers. Our program aligns executive pay with our stockholders’ interests and links pay to performance through a blend of short-term and long-term performance measures.
As required by Item 402(v) of Regulation S-K, we are providing the following information about the relationship between the Compensation Actually Paid to our NEOs and certain aspects of our financial performance. For further information concerning our pay for performance philosophy and how executive compensation aligns with our performance, please refer to “Executive Compensation - Compensation Discussion and Analysis.”
Pay-Versus-Performance Table
Fiscal Year | Summary Compensation Table Total for PEO1 | Compensation Actually Paid to PEO2 | Average Summary Compensation Table Total for Non-PEO Named Executive Officers3 | Average Compensation Actually Paid to Non-PEO Named Executive Officers4 | Value of Initial Fixed $100 Investment Based On: | Net Income7 | Company- Selected Measure: Revenue8 | |||||||||||||||||||
Total Stockholder Return5 | Peer Group Total Stockholder Return6 | |||||||||||||||||||||||||
(a) | (b) | (c) | (d) | (e) | (f) | (g) | (h) | (i) | ||||||||||||||||||
2026 | $22,466,332 | $(36,585,065) | $2,934,623 | $(3,433,229) | $254 | $181 | $338,192,000 | $2,518,081,000 | ||||||||||||||||||
2025 | $21,496,095 | $110,458,035 | $2,912,493 | $8,310,634 | $274 | $186 | $287,941,000 | $2,405,317,000 | ||||||||||||||||||
2024 | $15,623,124 | $44,420,248 | $3,248,911 | $5,737,256 | $194 | $141 | $204,183,000 | $2,040,069,000 | ||||||||||||||||||
2023 | $9,737,733 | $9,252,934 | $2,213,728 | $1,834,039 | $124 | $96 | $126,867,000 | $1,837,358,000 | ||||||||||||||||||
2022 | $7,691,994 | $10,589,204 | $2,268,304 | $4,323,405 | $126 | $80 | $107,130,000 | $1,686,666,000 | ||||||||||||||||||
(1) | The dollar amounts reported in column (b) represents the amount of total compensation reported for James J. Rhyu (our “PEO”) for each covered fiscal year in the “Total” column of the Summary Compensation Table. |
(2) | The Compensation Actually Paid to our PEO reflects the following adjustments required by applicable SEC rules from total compensation reported in the Summary Compensation Table: |
PEO | Fiscal 2022 | Fiscal 2023 | Fiscal 2024 | Fiscal 2025 | Fiscal 2026 | ||||||||||||||||||
Summary Compensation Table - Total Compensation | (a) | $7,691,994 | $9,737,733 | $15,623,124 | $21,496,095 | $22,466,332 | |||||||||||||||||
− | Grant Date Fair Value of Stock Awards and Option Awards Granted in Fiscal Year | (b) | $5,056,893 | $7,146,186 | $12,011,113 | $16,860,903 | $20,178,768 | ||||||||||||||||
+ | Fair Value at Fiscal Year End of Outstanding and Unvested Stock Awards and Option Awards Granted in Fiscal Year | (c) | $5,496,289 | $6,956,947 | $30,363,497 | $44,255,673 | $6,029,816 | ||||||||||||||||
+ | Change in Fair Value of Outstanding and Unvested Stock Awards and Option Awards Granted in Prior Fiscal Years | (d) | $761,586 | -$536,307 | $8,615,400 | $55,423,988 | -$41,112,710 | ||||||||||||||||
+ | Fair Value at Vesting of Stock Awards and Option Awards Granted in Fiscal Year That Vested During Fiscal Year | (e) | $189,978 | $323,898 | $673,144 | $1,179,928 | $352,637 | ||||||||||||||||
+ | Change in Fair Value as of Vesting Date of Stock Awards and Option Awards Granted in Prior Fiscal Years For Which Applicable Vesting Conditions Were Satisfied During Fiscal Year | (f) | $1,506,250 | -$83,151 | $1,156,196 | $4,963,254 | -$4,142,372 | ||||||||||||||||
− | Fair Value as of Prior Fiscal Year End of Stock Awards and Option Awards Granted in Prior Fiscal Years That Failed to Meet Applicable Vesting Conditions During Fiscal Year | (g) | $0 | $0 | $0 | $0 | $0 | ||||||||||||||||
= | Compensation Actually Paid | $10,589,204 | $9,252,934 | $44,420,248 | $110,458,035 | -$36,585,065 | |||||||||||||||||
For purposes of the adjustments to determine “Compensation Actually Paid,” we computed the fair value of equity awards in accordance with FASB ASC Topic 718 at the vesting date (for awards that vested at the end of or during each covered fiscal year) and at the end of the fiscal year (for awards that were outstanding and unvested as of the end of the covered fiscal year). The assumptions made in the calculation of the fair value of these equity awards did not differ materially from those disclosed as of the grant date of such equity awards.
(3) | The dollar amounts reported in column (d) represent the average of the amounts of total compensation reported for our NEOs as a group (excluding our PEOs) for each covered fiscal year in the “Total” column of the Summary Compensation Table for each applicable fiscal year. The names of each NEO included for purposes of calculating the average amounts of total compensation in each covered fiscal year are as follows: |
Fiscal 2026 | Fiscal 2025 | Fiscal 2024 | Fiscal 2023 | Fiscal 2022 | |||||||||||||||||||||||||
• | Donna Blackman | • | Donna Blackman | • | Donna Blackman | • | Nathaniel A. Davis | • | Nathaniel A. Davis | ||||||||||||||||||||
• | Todd Goldthwaite | • | Todd Goldthwaite | • | Todd Goldthwaite | • | Donna Blackman | • | Timothy J. Medina | ||||||||||||||||||||
• | Greerson G. McMullen, Sr. | • | Greerson G. McMullen, Sr. | • | Vincent W. Mathis | • | Vincent W. Mathis | • | Vincent W. Mathis | ||||||||||||||||||||
• | Vincent W. Mathis | • | Les Ottolenghi | • | Les Ottolenghi | • | Les Ottolenghi | ||||||||||||||||||||||
(4) | The Compensation Actually Paid to our NEOs (excluding our PEO) on average reflects the following adjustments required by applicable SEC rules from total compensation reported in the Summary Compensation Table: |
NEO Average | Fiscal 2022 | Fiscal 2023 | Fiscal 2024 | Fiscal 2025 | Fiscal 2026 | ||||||||||||||||||
Summary Compensation Table - Total Compensation | (a) | $2,268,304 | $2,213,728 | $3,248,911 | $2,912,493 | $2,934,623 | |||||||||||||||||
− | Grant Date Fair Value of Stock Awards and Option Awards Granted in Fiscal Year | (b) | $1,109,502 | $1,339,659 | $2,082,203 | $2,059,602 | $2,097,674 | ||||||||||||||||
+ | Fair Value at Fiscal Year End of Outstanding and Unvested Stock Awards and Option Awards Granted in Fiscal Year | (c) | $835,736 | $1,304,186 | $3,793,112 | $3,626,912 | $737,149 | ||||||||||||||||
+ | Change in Fair Value of Outstanding and Unvested Stock Awards and Option Awards Granted in Prior Fiscal Years | (d) | $795,599 | -$64,247 | $1,035,978 | $5,069,498 | -$4,520,563 | ||||||||||||||||
+ | Fair Value at Vesting of Stock Awards and Option Awards Granted in Fiscal Year That Vested During Fiscal Year | (e) | $417,023 | $60,715 | $78,514 | $69,362 | $49,009 | ||||||||||||||||
+ | Change in Fair Value as of Vesting Date of Stock Awards and Option Awards Granted in Prior Fiscal Years For Which Applicable Vesting Conditions Were Satisfied During Fiscal Year | (f) | $1,116,245 | -$340,684 | $135,915 | $470,461 | -$535,773 | ||||||||||||||||
− | Fair Value as of Prior Fiscal Year End of Stock Awards and Option Awards Granted in Prior Fiscal Years That Failed to Meet Applicable Vesting Conditions During Fiscal Year | (g) | $0 | $0 | $472,970 | $1,778,488 | $0 | ||||||||||||||||
= | Compensation Actually Paid | $4,323,405 | $1,834,039 | $5,737,256 | $8,310,634 | -$3,433,229 | |||||||||||||||||
For purposes of the adjustments to determine “Compensation Actually Paid,” we computed the fair value of equity awards in accordance with FASB ASC Topic 718 at the vesting date (for awards that vested at the end of or during each covered fiscal year), at the end of the fiscal year (for awards that were outstanding and unvested as of the end of the covered fiscal year, including equity awards granted by newly-formed indirect subsidiaries of the Company (and direct subsidiaries of K12 Management Inc.) that were outstanding and unvested as of the end of the covered fiscal year). The assumptions made in the calculation of the fair value of these equity awards did not differ materially from those disclosed as of the grant date of such equity awards.
(5) | Total stockholder return is calculated by assuming that a $100 investment was made on the close of trading on June 30, 2021 and reinvesting all dividends until the last day of each reported fiscal year. |
(6) | The peer group used is a select group of comparator companies, as used in the stock performance graph shown in our Annual Report on Form 10-K for the covered fiscal year. For the fiscal year ended June 30, 2026, such group was comprised of Covista Inc., Bright Horizons Family Solutions Inc., Coursera, Inc., Duolingo, Inc., Lincoln Educational Services Corporation, Grand Canyon Education Inc., Perdoceo Education Corporation, Pearson plc, Strategic Education Inc., and Universal Technical Institute, Inc., as presented in our Annual Report on Form 10-K for the fiscal year ended June 30, 2026. Total stockholder return is calculated by assuming that a $100 investment was made on the close of trading on June 30, 2021 and reinvesting all dividends until the last day of each reported fiscal year. |
(7) | The dollar amounts reported represent the amount of net income (loss) reflected in our audited financial statements for each covered fiscal year. |
(8) | Total revenue has been chosen as our Company Selected Measure. |
(1) | The dollar amounts reported in column (b) represents the amount of total compensation reported for James J. Rhyu (our “PEO”) for each covered fiscal year in the “Total” column of the Summary Compensation Table. |
(3) | The dollar amounts reported in column (d) represent the average of the amounts of total compensation reported for our NEOs as a group (excluding our PEOs) for each covered fiscal year in the “Total” column of the Summary Compensation Table for each applicable fiscal year. The names of each NEO included for purposes of calculating the average amounts of total compensation in each covered fiscal year are as follows: |
Fiscal 2026 | Fiscal 2025 | Fiscal 2024 | Fiscal 2023 | Fiscal 2022 | |||||||||||||||||||||||||
• | Donna Blackman | • | Donna Blackman | • | Donna Blackman | • | Nathaniel A. Davis | • | Nathaniel A. Davis | ||||||||||||||||||||
• | Todd Goldthwaite | • | Todd Goldthwaite | • | Todd Goldthwaite | • | Donna Blackman | • | Timothy J. Medina | ||||||||||||||||||||
• | Greerson G. McMullen, Sr. | • | Greerson G. McMullen, Sr. | • | Vincent W. Mathis | • | Vincent W. Mathis | • | Vincent W. Mathis | ||||||||||||||||||||
• | Vincent W. Mathis | • | Les Ottolenghi | • | Les Ottolenghi | • | Les Ottolenghi | ||||||||||||||||||||||
(6) | The peer group used is a select group of comparator companies, as used in the stock performance graph shown in our Annual Report on Form 10-K for the covered fiscal year. For the fiscal year ended June 30, 2026, such group was comprised of Covista Inc., Bright Horizons Family Solutions Inc., Coursera, Inc., Duolingo, Inc., Lincoln Educational Services Corporation, Grand Canyon Education Inc., Perdoceo Education Corporation, Pearson plc, Strategic Education Inc., and Universal Technical Institute, Inc., as presented in our Annual Report on Form 10-K for the fiscal year ended June 30, 2026. Total stockholder return is calculated by assuming that a $100 investment was made on the close of trading on June 30, 2021 and reinvesting all dividends until the last day of each reported fiscal year. |
(2) | The Compensation Actually Paid to our PEO reflects the following adjustments required by applicable SEC rules from total compensation reported in the Summary Compensation Table: |
PEO | Fiscal 2022 | Fiscal 2023 | Fiscal 2024 | Fiscal 2025 | Fiscal 2026 | ||||||||||||||||||
Summary Compensation Table - Total Compensation | (a) | $7,691,994 | $9,737,733 | $15,623,124 | $21,496,095 | $22,466,332 | |||||||||||||||||
− | Grant Date Fair Value of Stock Awards and Option Awards Granted in Fiscal Year | (b) | $5,056,893 | $7,146,186 | $12,011,113 | $16,860,903 | $20,178,768 | ||||||||||||||||
+ | Fair Value at Fiscal Year End of Outstanding and Unvested Stock Awards and Option Awards Granted in Fiscal Year | (c) | $5,496,289 | $6,956,947 | $30,363,497 | $44,255,673 | $6,029,816 | ||||||||||||||||
+ | Change in Fair Value of Outstanding and Unvested Stock Awards and Option Awards Granted in Prior Fiscal Years | (d) | $761,586 | -$536,307 | $8,615,400 | $55,423,988 | -$41,112,710 | ||||||||||||||||
+ | Fair Value at Vesting of Stock Awards and Option Awards Granted in Fiscal Year That Vested During Fiscal Year | (e) | $189,978 | $323,898 | $673,144 | $1,179,928 | $352,637 | ||||||||||||||||
+ | Change in Fair Value as of Vesting Date of Stock Awards and Option Awards Granted in Prior Fiscal Years For Which Applicable Vesting Conditions Were Satisfied During Fiscal Year | (f) | $1,506,250 | -$83,151 | $1,156,196 | $4,963,254 | -$4,142,372 | ||||||||||||||||
− | Fair Value as of Prior Fiscal Year End of Stock Awards and Option Awards Granted in Prior Fiscal Years That Failed to Meet Applicable Vesting Conditions During Fiscal Year | (g) | $0 | $0 | $0 | $0 | $0 | ||||||||||||||||
= | Compensation Actually Paid | $10,589,204 | $9,252,934 | $44,420,248 | $110,458,035 | -$36,585,065 | |||||||||||||||||
For purposes of the adjustments to determine “Compensation Actually Paid,” we computed the fair value of equity awards in accordance with FASB ASC Topic 718 at the vesting date (for awards that vested at the end of or during each covered fiscal year) and at the end of the fiscal year (for awards that were outstanding and unvested as of the end of the covered fiscal year). The assumptions made in the calculation of the fair value of these equity awards did not differ materially from those disclosed as of the grant date of such equity awards.
(4) | The Compensation Actually Paid to our NEOs (excluding our PEO) on average reflects the following adjustments required by applicable SEC rules from total compensation reported in the Summary Compensation Table: |
NEO Average | Fiscal 2022 | Fiscal 2023 | Fiscal 2024 | Fiscal 2025 | Fiscal 2026 | ||||||||||||||||||
Summary Compensation Table - Total Compensation | (a) | $2,268,304 | $2,213,728 | $3,248,911 | $2,912,493 | $2,934,623 | |||||||||||||||||
− | Grant Date Fair Value of Stock Awards and Option Awards Granted in Fiscal Year | (b) | $1,109,502 | $1,339,659 | $2,082,203 | $2,059,602 | $2,097,674 | ||||||||||||||||
+ | Fair Value at Fiscal Year End of Outstanding and Unvested Stock Awards and Option Awards Granted in Fiscal Year | (c) | $835,736 | $1,304,186 | $3,793,112 | $3,626,912 | $737,149 | ||||||||||||||||
+ | Change in Fair Value of Outstanding and Unvested Stock Awards and Option Awards Granted in Prior Fiscal Years | (d) | $795,599 | -$64,247 | $1,035,978 | $5,069,498 | -$4,520,563 | ||||||||||||||||
+ | Fair Value at Vesting of Stock Awards and Option Awards Granted in Fiscal Year That Vested During Fiscal Year | (e) | $417,023 | $60,715 | $78,514 | $69,362 | $49,009 | ||||||||||||||||
+ | Change in Fair Value as of Vesting Date of Stock Awards and Option Awards Granted in Prior Fiscal Years For Which Applicable Vesting Conditions Were Satisfied During Fiscal Year | (f) | $1,116,245 | -$340,684 | $135,915 | $470,461 | -$535,773 | ||||||||||||||||
− | Fair Value as of Prior Fiscal Year End of Stock Awards and Option Awards Granted in Prior Fiscal Years That Failed to Meet Applicable Vesting Conditions During Fiscal Year | (g) | $0 | $0 | $472,970 | $1,778,488 | $0 | ||||||||||||||||
= | Compensation Actually Paid | $4,323,405 | $1,834,039 | $5,737,256 | $8,310,634 | -$3,433,229 | |||||||||||||||||
For purposes of the adjustments to determine “Compensation Actually Paid,” we computed the fair value of equity awards in accordance with FASB ASC Topic 718 at the vesting date (for awards that vested at the end of or during each covered fiscal year), at the end of the fiscal year (for awards that were outstanding and unvested as of the end of the covered fiscal year, including equity awards granted by newly-formed indirect subsidiaries of the Company (and direct subsidiaries of K12 Management Inc.) that were outstanding and unvested as of the end of the covered fiscal year). The assumptions made in the calculation of the fair value of these equity awards did not differ materially from those disclosed as of the grant date of such equity awards.
Compensation Actually Paid and Company TSR and Peer Group TSR
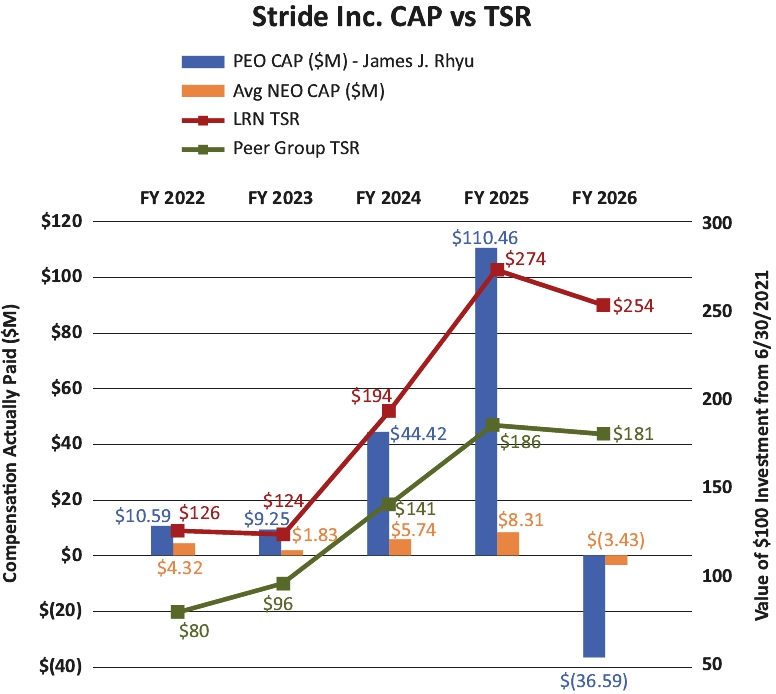
The following chart illustrates the relationship between our Compensation Actually Paid and TSR and the relationship between our TSR and peer group TSR.
Compensation Actually Paid and Net Income
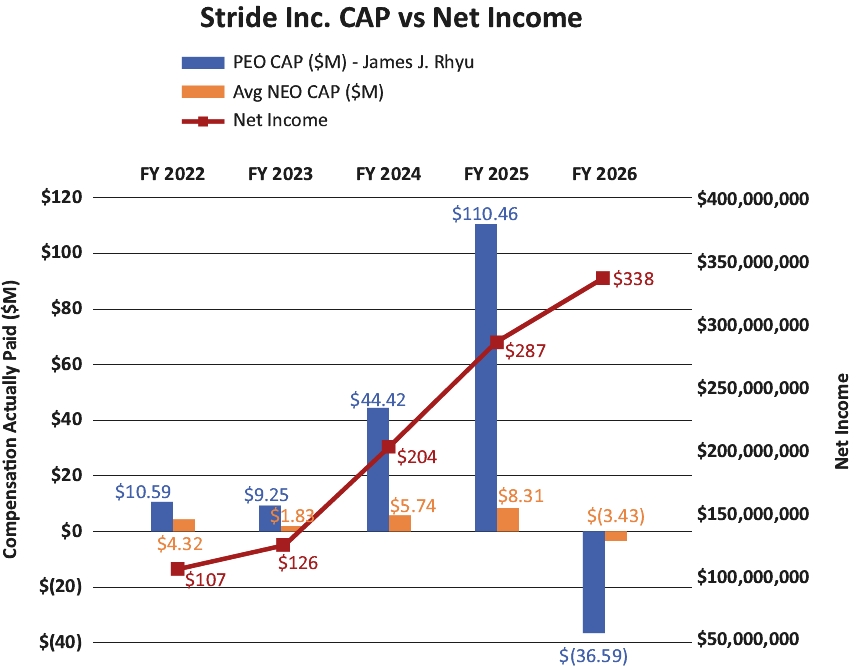
The following chart illustrates the relationship between our Compensation Actually Paid and Net Income.
Compensation Actually Paid and Revenue
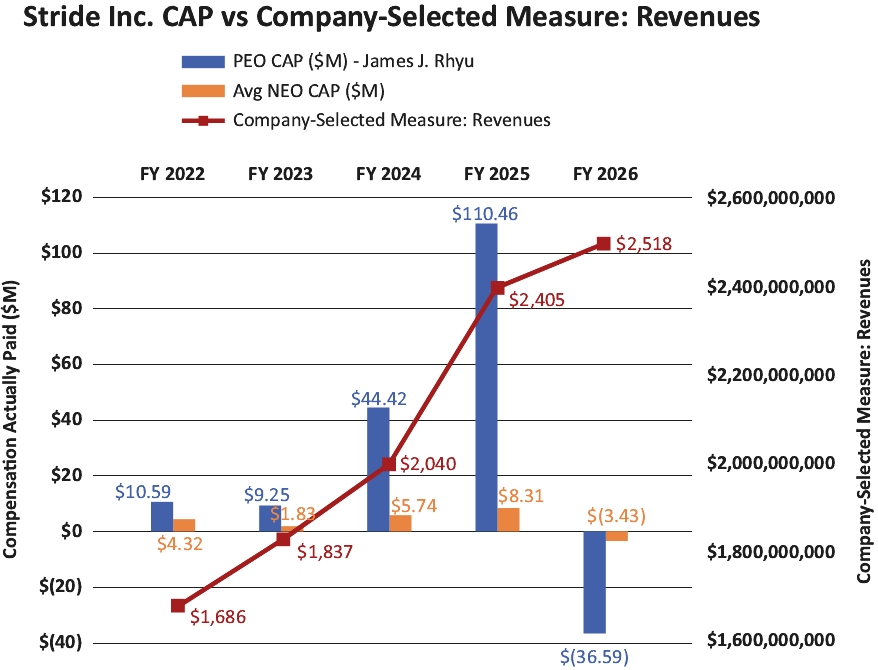
The following chart illustrates the relationship between our Compensation Actually Paid and Revenue.
Compensation Actually Paid and Company TSR and Peer Group TSR
The following chart illustrates the relationship between our Compensation Actually Paid and TSR and the relationship between our TSR and peer group TSR.
Financial Performance Measures
The financial performance measures listed below represent all of the financial performance measures that were used to determine the compensation actually paid to our NEOs in fiscal 2026:
• | Revenue |
• | Adjusted EBITDA |
• | Adjusted Operating Income |