
Investor Presentation Third Quarter 2026 Results
Forward-Looking Statements and Other Matters This presentation includes forward-looking statements within the meaning of the “Safe-Harbor” provisions of the Private Securities Litigation Reform Act of 1995. These statements include, but are not limited to, statements related to our expectations regarding the performance of our business, profitability, liquidity and capital ratios; the anticipated benefits of our strategic repositioning including, among others, a strengthened credit profile, possible net interest income and net interest margin expansion and an enhanced earnings profile; and other non-historical statements. Words or phrases such as “believe,” “will,” “should,” “will likely result,” “are expected to,” “will continue,” “is anticipated,” “estimate,” “project,” “plans,” “strategy,” or similar expressions are intended to identify these forward-looking statements. You are cautioned not to place undue reliance on any forward-looking statements. These statements are necessarily subject to risk and uncertainty and actual results could differ materially from those anticipated due to various factors, including those set forth from time to time in the documents filed or furnished by the Company with the Securities and Exchange Commission ("SEC"). The Company undertakes no obligation to revise or publicly release any revision or update to these forward-looking statements to reflect events or circumstances that occur after the date on which such statements were made, except as required by law. Factors that could cause actual results to differ materially from the results anticipated or projected include, but are not limited to: (i) changes in general economic conditions, either nationally or in our market areas, including the impact of tariffs and retaliatory tariffs, supply chain disruptions, and the risk of recession or an economic downturn; (ii) changes in the interest rate environment, including the recent and potential future changes in the FRB benchmark rate, which could adversely affect our revenue and expenses, the value of assets and obligations, the realization of deferred tax assets, the availability and cost of capital and liquidity, and the impacts of continuing or renewed inflation; (iii) the credit risks of lending activities, which may be affected by deterioration in real estate markets and the financial condition of borrowers, and the operational risk of lending activities, including the effectiveness of our underwriting practices and the risk of fraud, any of which may lead to increased loan delinquencies, losses, and non-performing assets, and may result in our allowance for credit losses not being adequate; (iv) fluctuations in the demand for loans, and fluctuations in commercial and residential real estate values in our market area; (v) the quality and composition of our securities portfolio; (vi) our ability to develop and maintain a strong core deposit base, including among our venture banking and private banking clients, or other low cost funding sources necessary to fund our activities particularly in a rising or high interest rate environment; (vii) the rapid withdrawal of a significant amount of demand deposits over a short period of time; (viii) our ability to achieve or maintain the anticipated benefits of our strategic repositioning due to one or more of the other factors described herein or otherwise; (ix) our ability to successfully implement new business initiatives, such as our private banking service, and to realize their anticipated benefits; (x) our ability to raise capital or incur debt on reasonable terms; (xi) the costs and effects of litigation; (xii) risks related to the Company’s acquisitions, including disruption to current plans and operations; difficulties in customer and employee retention; fees, expenses and charges related to these transactions being significantly higher than anticipated; and our inability to achieve expected revenues, cost savings, synergies, and other benefits; (xiii) the competitive and other impacts on our business of emerging technologies, including stablecoins and other digital currencies, tokenized deposits, blockchain, artificial intelligence, quantum computing, and related innovations affecting both the Company and the banking industry; (xiv) results of examinations by regulatory authorities of the Company and the possibility that any such regulatory authority may, among other things, limit our business activities, restrict our ability to invest in certain assets, refrain from issuing an approval or non- objection to certain capital or other actions, increase our allowance for credit losses, result in write-downs of asset values, restrict our ability or that of our bank subsidiary to pay dividends, or impose fines, penalties or sanctions; (xv) legislative or regulatory changes that adversely affect our business, including changes in tax laws and policies, accounting policies and practices, privacy laws, and regulatory capital or other rules; (xvi) the risk that our enterprise risk management framework may not be effective in mitigating risk and reducing the potential for losses; (xvii) errors in estimates of the fair values of certain of our assets and liabilities, as well as the value of collateral supporting our loans, which may result in significant changes in valuation or recoveries; (xviii) cybersecurity threats and failures or security breaches with respect to the network, applications, vendors and computer systems on which we depend; (xix) our ability to attract and retain key members of our senior management team; (xx) the effects of climate change, severe weather events, natural disasters such as earthquakes and wildfires, pandemics, epidemics and other public health crises, geopolitical conflicts and military activity (including the ongoing Iran war) or acts of terrorism, and other external events on our business; (xxi) the impact of bank failures or other adverse developments at other banks on general depositor and investor sentiment regarding the stability and liquidity of banks; (xxii) the possibility that our recorded goodwill could become impaired, which may have an adverse impact on our earnings and capital; (xxiii) our existing indebtedness, together with any future incurrence of additional indebtedness, could adversely affect our ability to raise additional capital and to meet our debt obligations; (xxiv) changes in market conditions or strategic balance sheet actions, which may result in realized losses on investment securities or other assets; (xxv) the effects of any damage to our reputation resulting from developments related to any of the items identified above; and (xxvi) other economic, competitive, governmental, regulatory, and technological factors affecting our operations, pricing, products and services and the other risks described in our Annual Report on Form 10-K for the fiscal year ended December 31, 2025 and from time to time in other documents that we file with or furnish to the SEC. Included in this presentation are certain non-GAAP financial measures, such as tangible common equity, tangible book value per common share, return on average tangible common equity, pre-tax pre-provision income, and efficiency ratio, designed to complement the financial information presented in accordance with U.S. GAAP because management believes such measures are useful to investors. These non-GAAP financial measures should be considered only as supplemental to, and not superior to, financial measures provided in accordance with GAAP. Please refer to the “Non-GAAP Measures” section of this presentation for additional detail including reconciliations of the non-GAAP financial measures included in this presentation to the most directly comparable financial measures prepared in accordance with GAAP. Third Quarter 2026 Earnings | 2
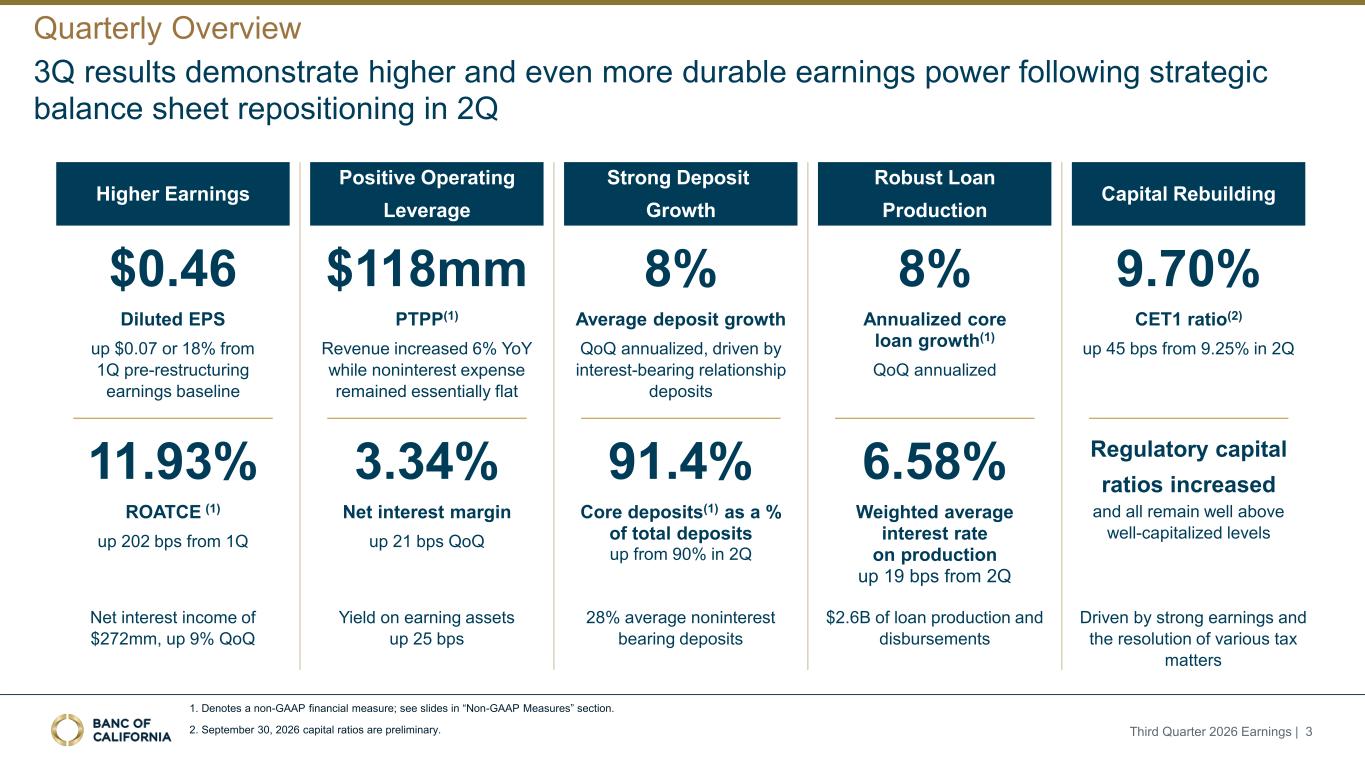
Quarterly Overview 3Q results demonstrate higher and even more durable earnings power following strategic balance sheet repositioning in 2Q Higher Earnings $0.46 Diluted EPS up $0.07 or 18% from 1Q pre-restructuring earnings baseline 11.93% ROATCE (1) up 202 bps from 1Q Net interest income of $272mm, up 9% QoQ Positive Operating Leverage $118mm PTPP(1) Revenue increased 6% YoY while noninterest expense remained essentially flat 3.34% Net interest margin up 21 bps QoQ Yield on earning assets up 25 bps Strong Deposit Growth 8% Average deposit growth QoQ annualized, driven by interest-bearing relationship deposits 91.4% Core deposits(1) as a % of total deposits up from 90% in 2Q Robust Loan Production 8% Annualized core loan growth(1) QoQ annualized 6.58% Weighted average interest rate on production up 19 bps from 2Q Capital Rebuilding 9.70% CET1 ratio(2) up 45 bps from 9.25% in 2Q Regulatory capital ratios increased and all remain well above well-capitalized levels 1. Denotes a non-GAAP financial measure; see slides in “Non-GAAP Measures” section. 2. September 30, 2026 capital ratios are preliminary. Third Quarter 2026 Earnings | 3 $2.6B of loan production and disbursements Driven by strong earnings and the resolution of various tax matters 28% average noninterest bearing deposits
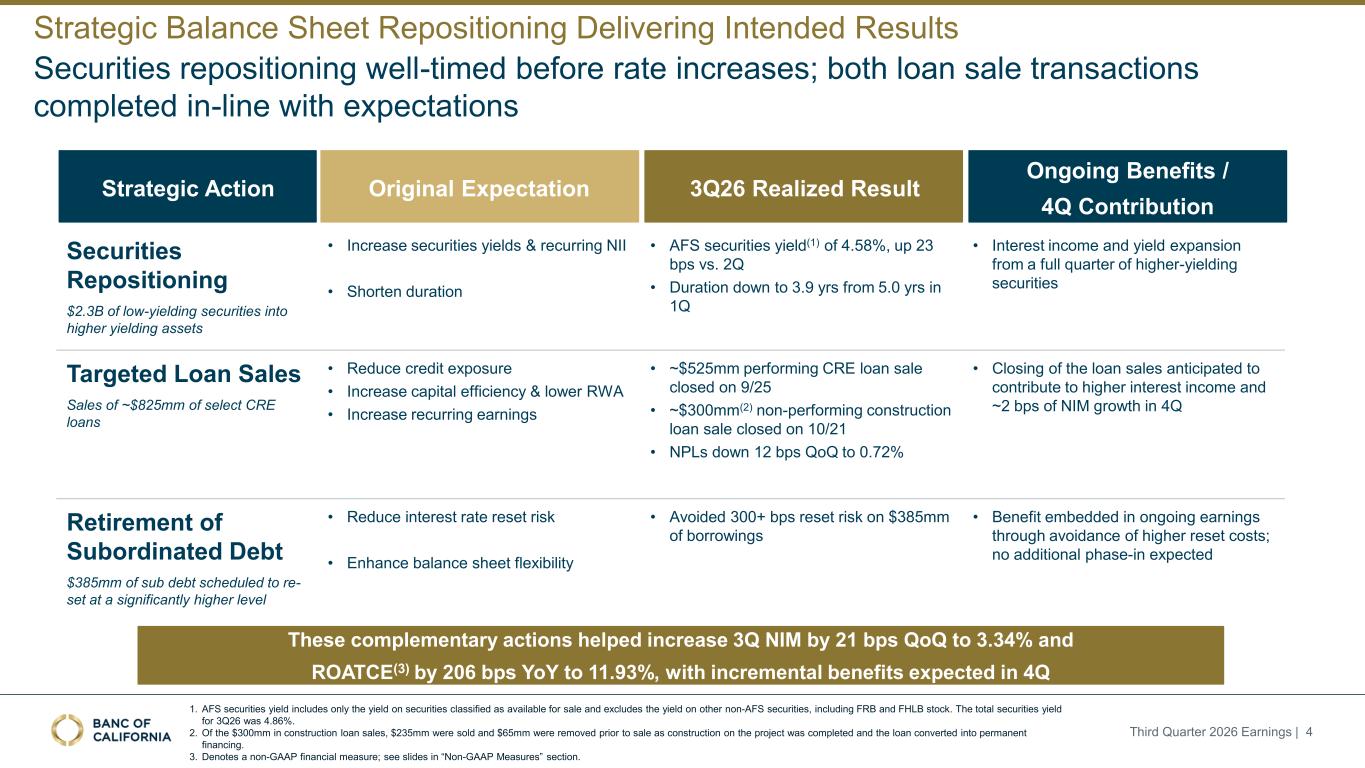
1. AFS securities yield includes only the yield on securities classified as available for sale and excludes the yield on other non-AFS securities, including FRB and FHLB stock. The total securities yield for 3Q26 was 4.86%. 2. Of the $300mm in construction loan sales, $235mm were sold and $65mm were removed prior to sale as construction on the project was completed and the loan converted into permanent financing. 3. Denotes a non-GAAP financial measure; see slides in “Non-GAAP Measures” section. Strategic Action Original Expectation 3Q26 Realized Result Ongoing Benefits / 4Q Contribution Securities Repositioning $2.3B of low-yielding securities into higher yielding assets • Increase securities yields & recurring NII • Shorten duration • AFS securities yield(1) of 4.58%, up 23 bps vs. 2Q • Duration down to 3.9 yrs from 5.0 yrs in 1Q • Interest income and yield expansion from a full quarter of higher-yielding securities Targeted Loan Sales Sales of ~$825mm of select CRE loans • Reduce credit exposure • Increase capital efficiency & lower RWA • Increase recurring earnings • ~$525mm performing CRE loan sale closed on 9/25 • ~$300mm(2) non-performing construction loan sale closed on 10/21 • NPLs down 12 bps QoQ to 0.72% • Closing of the loan sales anticipated to contribute to higher interest income and ~2 bps of NIM growth in 4Q Retirement of Subordinated Debt $385mm of sub debt scheduled to re- set at a significantly higher level • Reduce interest rate reset risk • Enhance balance sheet flexibility • Avoided 300+ bps reset risk on $385mm of borrowings • Benefit embedded in ongoing earnings through avoidance of higher reset costs; no additional phase-in expected These complementary actions helped increase 3Q NIM by 21 bps QoQ to 3.34% and ROATCE(3) by 206 bps YoY to 11.93%, with incremental benefits expected in 4Q Third Quarter 2026 Earnings | 4 Strategic Balance Sheet Repositioning Delivering Intended Results Securities repositioning well-timed before rate increases; both loan sale transactions completed in-line with expectations
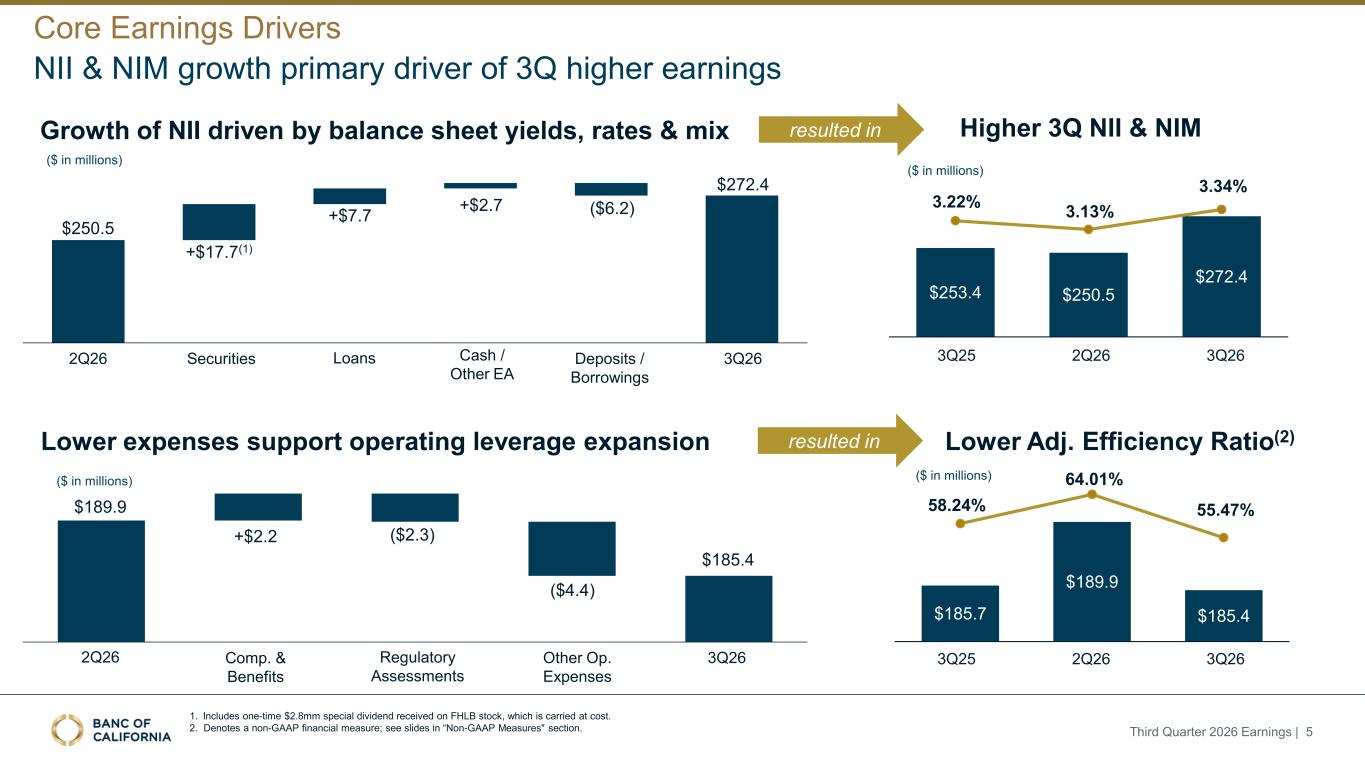
Core Earnings Drivers 1. Includes one-time $2.8mm special dividend received on FHLB stock, which is carried at cost. 2. Denotes a non-GAAP financial measure; see slides in “Non-GAAP Measures" section. Growth of NII driven by balance sheet yields, rates & mix Higher 3Q NII & NIM $253.4 $250.5 $272.4 3.22% 3.13% 3.34% Lower expenses support operating leverage expansion Lower Adj. Efficiency Ratio(2) $189.9 +$2.2 ($2.3) ($4.4) $185.4 2Q26 Regulatory Assessments Other Op. Expenses Comp. & Benefits 3Q26 $185.7 $189.9 $185.4 3Q25 2Q26 3Q26 58.24% 64.01% 55.47% 3Q25 2Q26 3Q26 resulted in resulted in Third Quarter 2026 Earnings | 5 ($ in millions) ($ in millions) ($ in millions) NII & NIM growth primary driver of 3Q higher earnings 2Q26 Loans Cash / Other EA Securities Deposits / Borrowings 3Q26 $250.5 $272.4 +$7.7 +$2.7 +$17.7(1) ($6.2) ($ in millions)
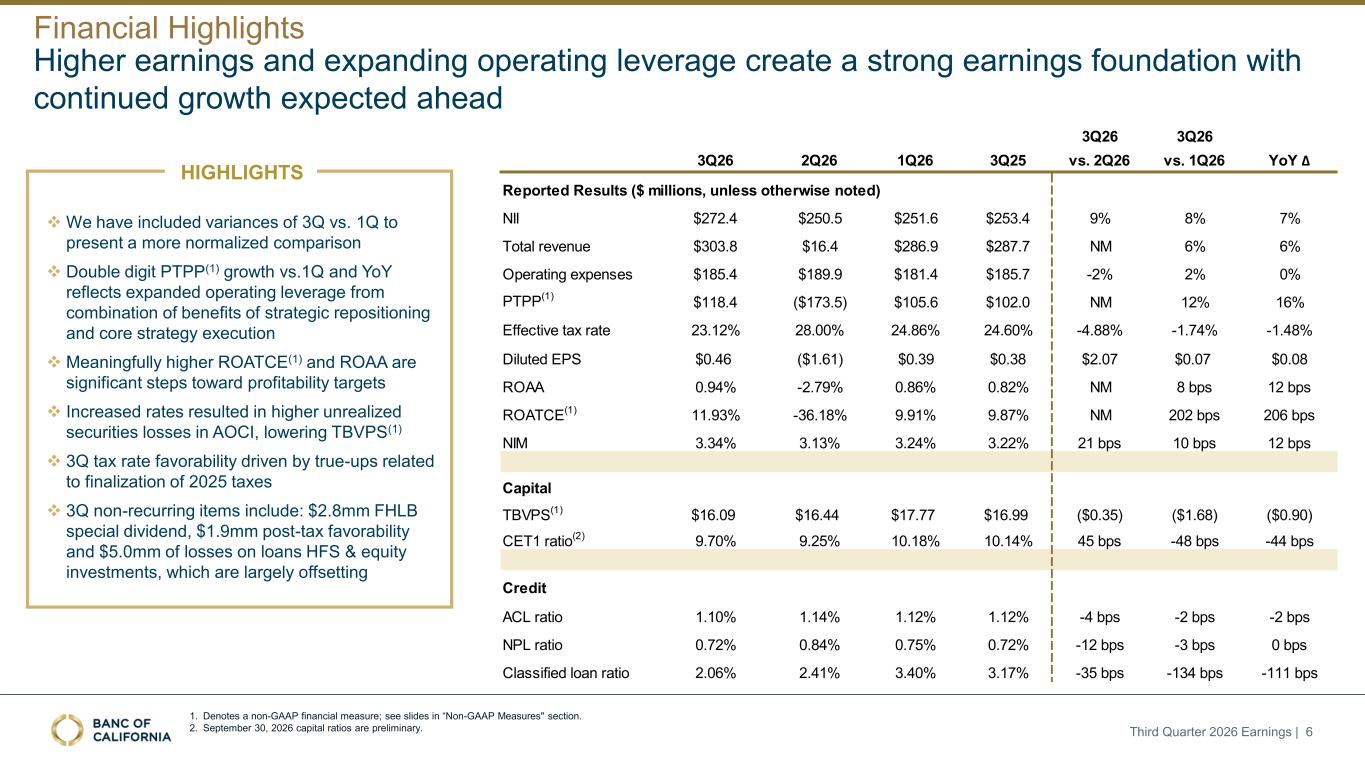
Higher earnings and expanding operating leverage create a strong earnings foundation with continued growth expected ahead Financial Highlights Third Quarter 2026 Earnings | 6 1. Denotes a non-GAAP financial measure; see slides in “Non-GAAP Measures" section. 2. September 30, 2026 capital ratios are preliminary. 3Q26 3Q26 3Q26 2Q26 1Q26 3Q25 vs. 2Q26 vs. 1Q26 YoY ∆ Reported Results ($ millions, unless otherwise noted) NII $272.4 $250.5 $251.6 $253.4 9% 8% 7% Total revenue $303.8 $16.4 $286.9 $287.7 NM 6% 6% Operating expenses $185.4 $189.9 $181.4 $185.7 -2% 2% 0% PTPP(1) $118.4 ($173.5) $105.6 $102.0 NM 12% 16% Effective tax rate 23.12% 28.00% 24.86% 24.60% -4.88% -1.74% -1.48% Diluted EPS $0.46 ($1.61) $0.39 $0.38 $2.07 $0.07 $0.08 ROAA 0.94% -2.79% 0.86% 0.82% NM 8 bps 12 bps ROATCE(1) 11.93% -36.18% 9.91% 9.87% NM 202 bps 206 bps NIM 3.34% 3.13% 3.24% 3.22% 21 bps 10 bps 12 bps Capital TBVPS(1) $16.09 $16.44 $17.77 $16.99 ($0.35) ($1.68) ($0.90) CET1 ratio(2) 9.70% 9.25% 10.18% 10.14% 45 bps -48 bps -44 bps Credit ACL ratio 1.10% 1.14% 1.12% 1.12% -4 bps -2 bps -2 bps NPL ratio 0.72% 0.84% 0.75% 0.72% -12 bps -3 bps 0 bps Classified loan ratio 2.06% 2.41% 3.40% 3.17% -35 bps -134 bps -111 bps HIGHLIGHTS ❖ We have included variances of 3Q vs. 1Q to present a more normalized comparison ❖ Double digit PTPP(1) growth vs.1Q and YoY reflects expanded operating leverage from combination of benefits of strategic repositioning and core strategy execution ❖ Meaningfully higher ROATCE(1) and ROAA are significant steps toward profitability targets ❖ Increased rates resulted in higher unrealized securities losses in AOCI, lowering TBVPS(1) ❖ 3Q tax rate favorability driven by true-ups related to finalization of 2025 taxes ❖ 3Q non-recurring items include: $2.8mm FHLB special dividend, $1.9mm post-tax favorability and $5.0mm of losses on loans HFS & equity investments, which are largely offsetting
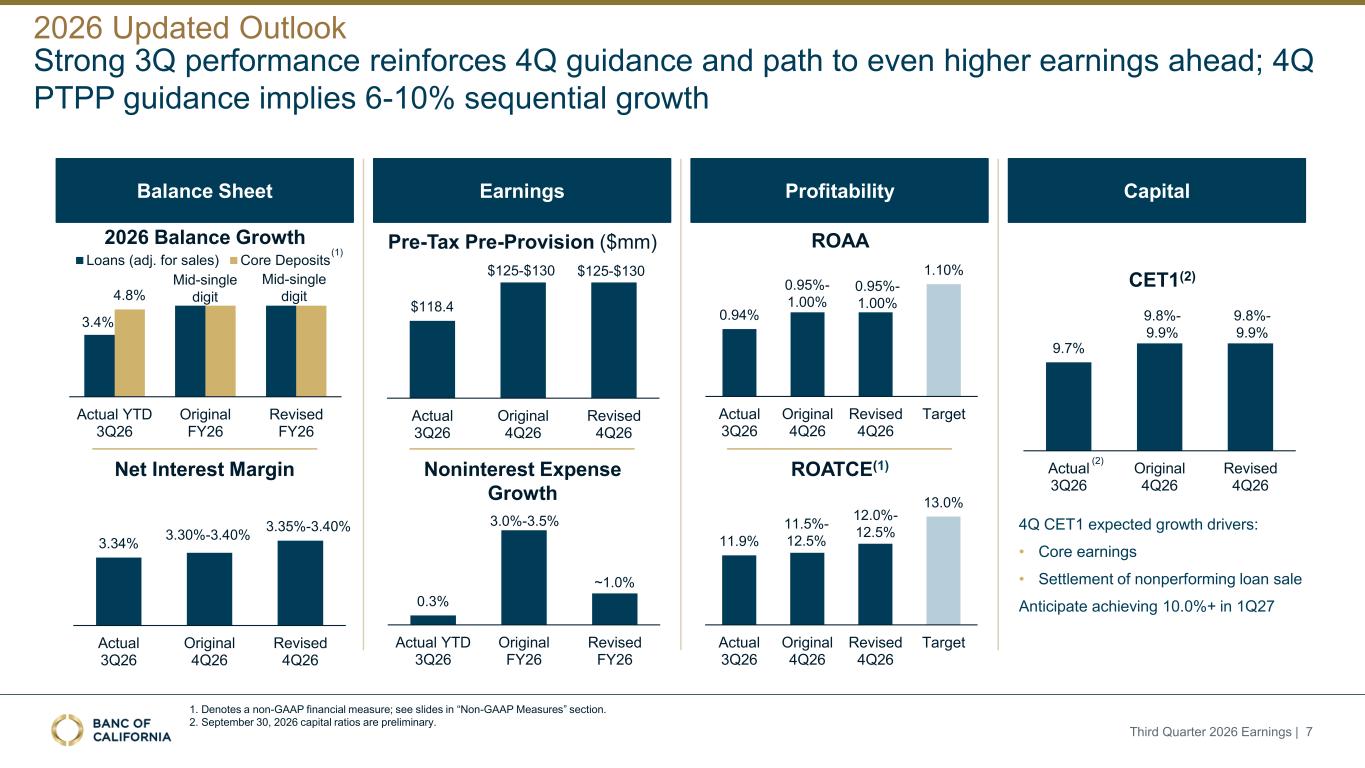
Balance Sheet Earnings Profitability Capital Third Quarter 2026 Earnings | 7 2026 Updated Outlook Strong 3Q performance reinforces 4Q guidance and path to even higher earnings ahead; 4Q PTPP guidance implies 6-10% sequential growth $118.4 Actual 3Q26 Original 4Q26 Revised 4Q26 $125-$130 $125-$130 Pre-Tax Pre-Provision ($mm) 3.34% Actual 3Q26 Original 4Q26 Revised 4Q26 3.30%-3.40% 3.35%-3.40% Net Interest Margin 0.3% Actual YTD 3Q26 Original FY26 Revised FY26 3.0%-3.5% ~1.0% Noninterest Expense Growth 11.9% 13.0% Actual 3Q26 Original 4Q26 Revised 4Q26 Target 11.5%- 12.5% 12.0%- 12.5% ROATCE(1) 0.94% 1.10% Actual 3Q26 Original 4Q26 Revised 4Q26 Target 0.95%- 1.00% 0.95%- 1.00% ROAA 4Q CET1 expected growth drivers: • Core earnings • Settlement of nonperforming loan sale Anticipate achieving 10.0%+ in 1Q27 1. Denotes a non-GAAP financial measure; see slides in “Non-GAAP Measures” section. 2. September 30, 2026 capital ratios are preliminary. 9.7% Actual 3Q26 Original 4Q26 Revised 4Q26 9.8%- 9.9% 9.8%- 9.9% CET1(2) (2) 3.4% 4.8% Actual YTD 3Q26 Original FY26 Revised FY26 Loans (adj. for sales) Core Deposits Mid-single digit Mid-single digit 2026 Balance Growth (1)
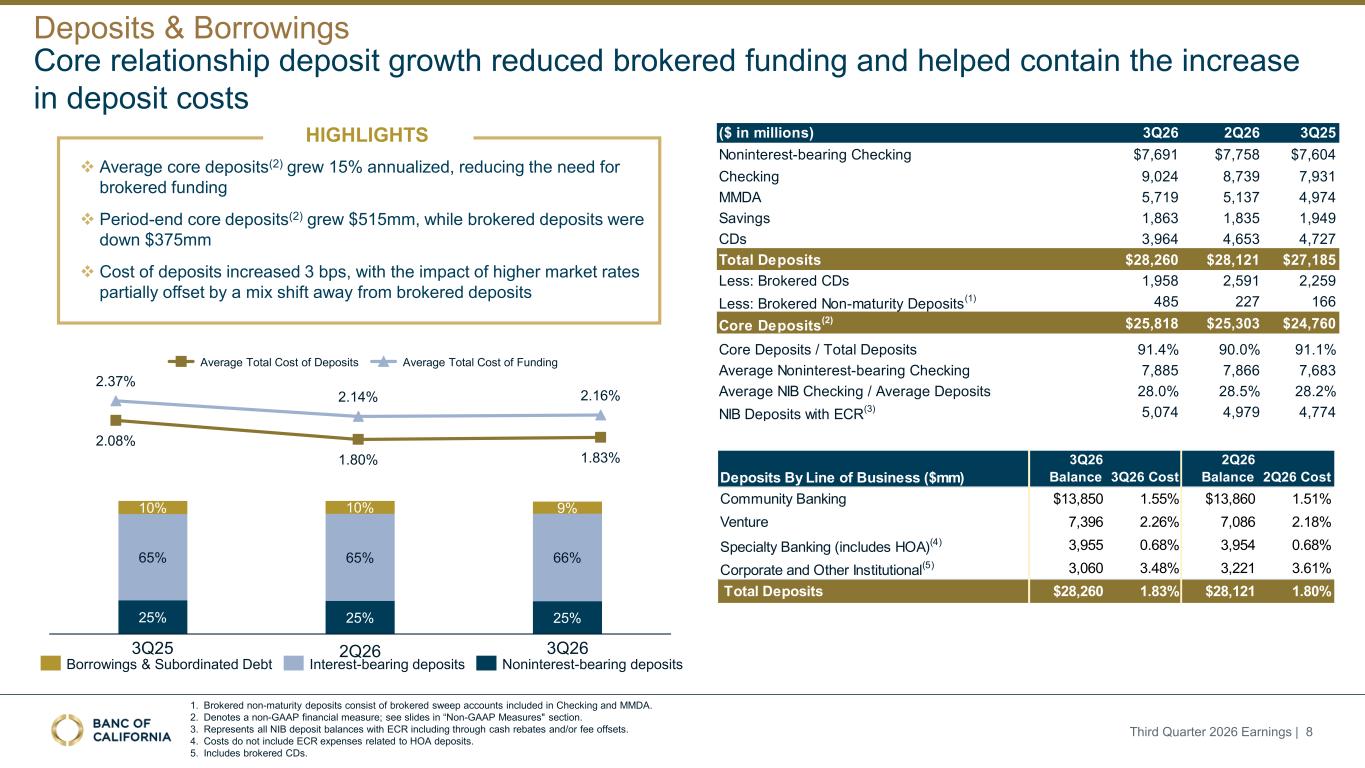
Core relationship deposit growth reduced brokered funding and helped contain the increase in deposit costs ($ in millions) 3Q26 2Q26 3Q25 Noninterest-bearing Checking $7,691 $7,758 $7,604 Checking 9,024 8,739 7,931 MMDA 5,719 5,137 4,974 Savings 1,863 1,835 1,949 CDs 3,964 4,653 4,727 Total Deposits $28,260 $28,121 $27,185 Less: Brokered CDs 1,958 2,591 2,259 Less: Brokered Non-maturity Deposits (1) 485 227 166 Core Deposits (2) $25,818 $25,303 $24,760 Core Deposits / Total Deposits 91.4% 90.0% 91.1% Average Noninterest-bearing Checking 7,885 7,866 7,683 Average NIB Checking / Average Deposits 28.0% 28.5% 28.2% NIB Deposits with ECR (3) 5,074 4,979 4,774 Deposits By Line of Business ($mm) 3Q26 Balance 3Q26 Cost 2Q26 Balance 2Q26 Cost Community Banking $13,850 1.55% $13,860 1.51% Venture 7,396 2.26% 7,086 2.18% Specialty Banking (includes HOA)(4) 3,955 0.68% 3,954 0.68% Corporate and Other Institutional(5) 3,060 3.48% 3,221 3.61% Total Deposits $28,260 1.83% $28,121 1.80% 2.08% 1.80% 1.83% 2.37% 2.14% 2.16% 25% 25% 25% 65% 65% 66% 10% 10% 9% 3Q25 2Q26 3Q26 Borrowings & Subordinated Debt Interest-bearing deposits Noninterest-bearing deposits 1. Brokered non-maturity deposits consist of brokered sweep accounts included in Checking and MMDA. 2. Denotes a non-GAAP financial measure; see slides in “Non-GAAP Measures" section. 3. Represents all NIB deposit balances with ECR including through cash rebates and/or fee offsets. 4. Costs do not include ECR expenses related to HOA deposits. 5. Includes brokered CDs. ❖ Average core deposits(2) grew 15% annualized, reducing the need for brokered funding ❖ Period-end core deposits(2) grew $515mm, while brokered deposits were down $375mm ❖ Cost of deposits increased 3 bps, with the impact of higher market rates partially offset by a mix shift away from brokered deposits HIGHLIGHTS Third Quarter 2026 Earnings | 8 Average Total Cost of Deposits Average Total Cost of Funding Deposits & Borrowings
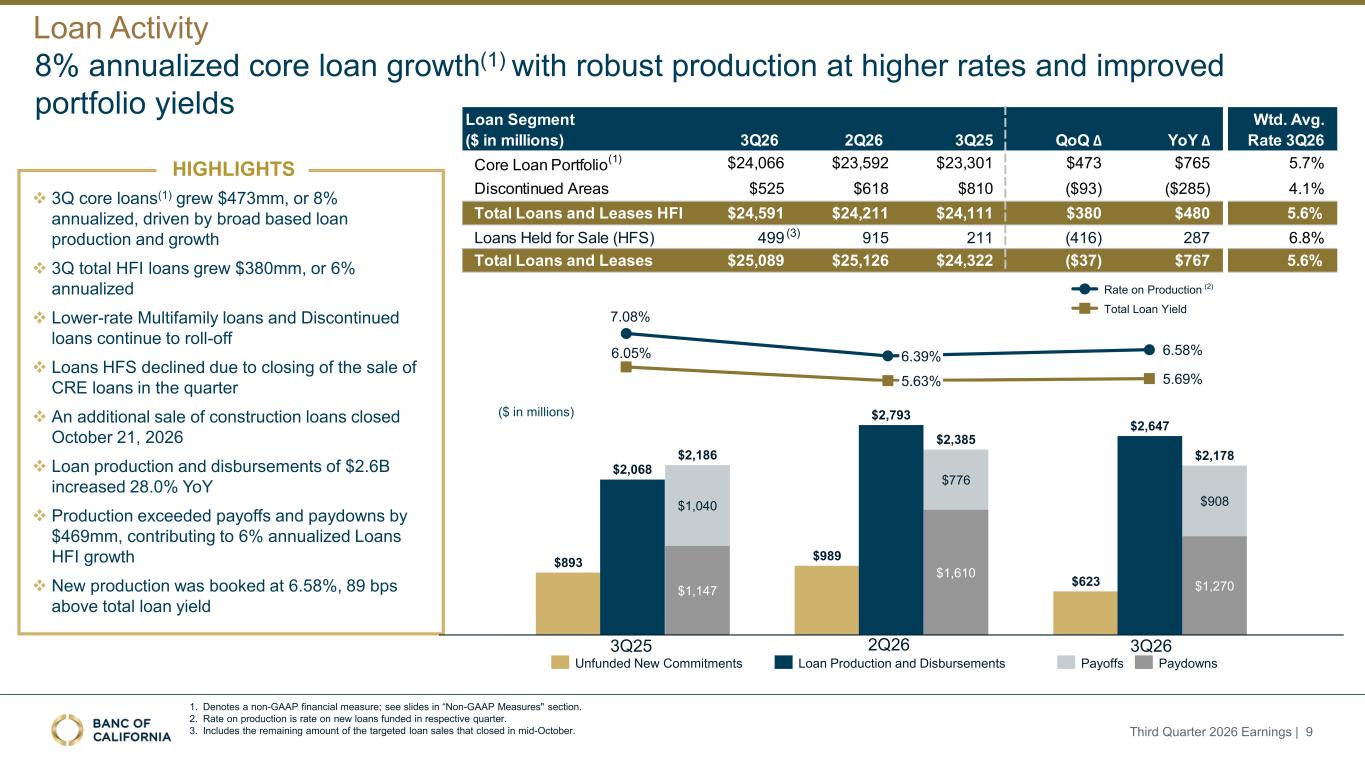
3Q26 2Q26 3Q25 QoQ Δ YoY Δ Wtd. Avg. Rate 3Q26 Core Loan Portfolio (1) $24,066 $23,592 $23,301 $473 $765 5.7%0 0 0 $ - 0% Discontinued Areas $525 $618 $810 ($93) ($285) 4.1%0 $ - Total Loans and Leases HFI $24,591 $24,211 $24,111 $380 $480 5.6% Loans Held for Sale (HFS) 499 915 211 (416) 287 6.8% Total Loans and Leases $25,089 $25,126 $24,322 ($37) $767 5.6% Loan Segment ($ in millions) 1. Denotes a non-GAAP financial measure; see slides in “Non-GAAP Measures" section. 2. Rate on production is rate on new loans funded in respective quarter. 3. Includes the remaining amount of the targeted loan sales that closed in mid-October. 8% annualized core loan growth(1) with robust production at higher rates and improved portfolio yields Loan Activity ❖ 3Q core loans(1) grew $473mm, or 8% annualized, driven by broad based loan production and growth ❖ 3Q total HFI loans grew $380mm, or 6% annualized ❖ Lower-rate Multifamily loans and Discontinued loans continue to roll-off ❖ Loans HFS declined due to closing of the sale of CRE loans in the quarter ❖ An additional sale of construction loans closed October 21, 2026 ❖ Loan production and disbursements of $2.6B increased 28.0% YoY ❖ Production exceeded payoffs and paydowns by $469mm, contributing to 6% annualized Loans HFI growth ❖ New production was booked at 6.58%, 89 bps above total loan yield Third Quarter 2026 Earnings | 9 HIGHLIGHTS $1,040 $1,147 $776 $1,610 $908 $1,270 $2,186 $2,385 $2,178 7.08% 6.58%6.05% 5.69% 6.39% 5.63% Rate on Production Total Loan Yield ($ in millions) $893 $989 $623 Payoffs PaydownsUnfunded New Commitments 3Q25 2Q26 3Q26 $2,068 $2,793 $2,647 (2) Loan Production and Disbursements (3)
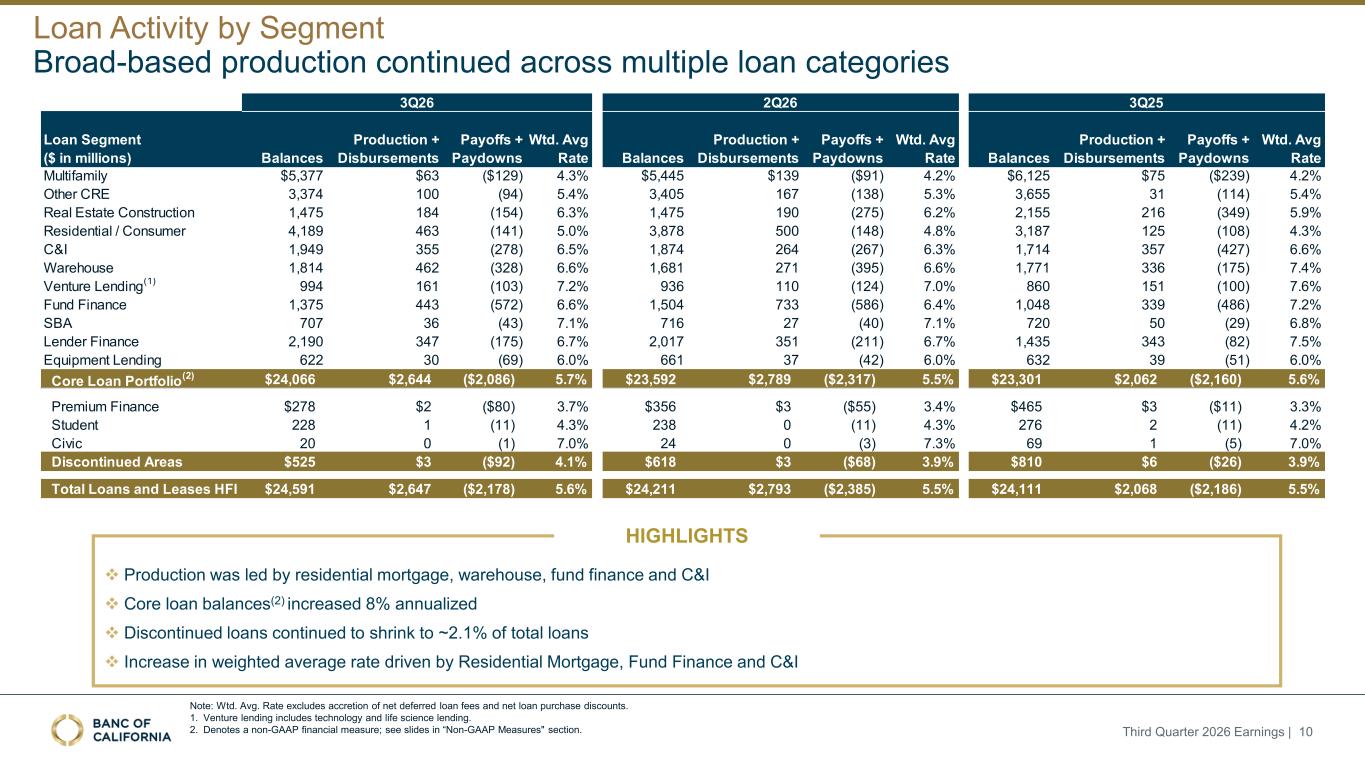
3Q26 2Q26 3Q25 Loan Segment ($ in millions) Balances Production + Disbursements Payoffs + Paydowns Wtd. Avg Rate Balances Production + Disbursements Payoffs + Paydowns Wtd. Avg Rate Balances Production + Disbursements Payoffs + Paydowns Wtd. Avg Rate Multifamily $5,377 $63 ($129) 4.3% $5,445 $139 ($91) 4.2% $6,125 $75 ($239) 4.2% Other CRE 3,374 100 (94) 5.4% 3,405 167 (138) 5.3% 3,655 31 (114) 5.4% Real Estate Construction 1,475 184 (154) 6.3% 1,475 190 (275) 6.2% 2,155 216 (349) 5.9% Residential / Consumer 4,189 463 (141) 5.0% 3,878 500 (148) 4.8% 3,187 125 (108) 4.3% C&I 1,949 355 (278) 6.5% 1,874 264 (267) 6.3% 1,714 357 (427) 6.6% Warehouse 1,814 462 (328) 6.6% 1,681 271 (395) 6.6% 1,771 336 (175) 7.4% Venture Lending (1) 994 161 (103) 7.2% 936 110 (124) 7.0% 860 151 (100) 7.6% Fund Finance 1,375 443 (572) 6.6% 1,504 733 (586) 6.4% 1,048 339 (486) 7.2% SBA 707 36 (43) 7.1% 716 27 (40) 7.1% 720 50 (29) 6.8% Lender Finance 2,190 347 (175) 6.7% 2,017 351 (211) 6.7% 1,435 343 (82) 7.5% Equipment Lending 622 30 (69) 6.0% 661 37 (42) 6.0% 632 39 (51) 6.0% Core Loan Portfolio (2) $24,066 $2,644 ($2,086) 5.7% $23,592 $2,789 ($2,317) 5.5% $23,301 $2,062 ($2,160) 5.6% Premium Finance $278 $2 ($80) 3.7% $356 $3 ($55) 3.4% $465 $3 ($11) 3.3% Student 228 1 (11) 4.3% 238 0 (11) 4.3% 276 2 (11) 4.2% Civic 20 0 (1) 7.0% 24 0 (3) 7.3% 69 1 (5) 7.0% Discontinued Areas $525 $3 ($92) 4.1% $618 $3 ($68) 3.9% $810 $6 ($26) 3.9% Total Loans and Leases HFI $24,591 $2,647 ($2,178) 5.6% $24,211 $2,793 ($2,385) 5.5% $24,111 $2,068 ($2,186) 5.5% Broad-based production continued across multiple loan categories Note: Wtd. Avg. Rate excludes accretion of net deferred loan fees and net loan purchase discounts. 1. Venture lending includes technology and life science lending. 2. Denotes a non-GAAP financial measure; see slides in “Non-GAAP Measures" section. Loan Activity by Segment Third Quarter 2026 Earnings | 10 ❖ Production was led by residential mortgage, warehouse, fund finance and C&I ❖ Core loan balances(2) increased 8% annualized ❖ Discontinued loans continued to shrink to ~2.1% of total loans ❖ Increase in weighted average rate driven by Residential Mortgage, Fund Finance and C&I HIGHLIGHTS
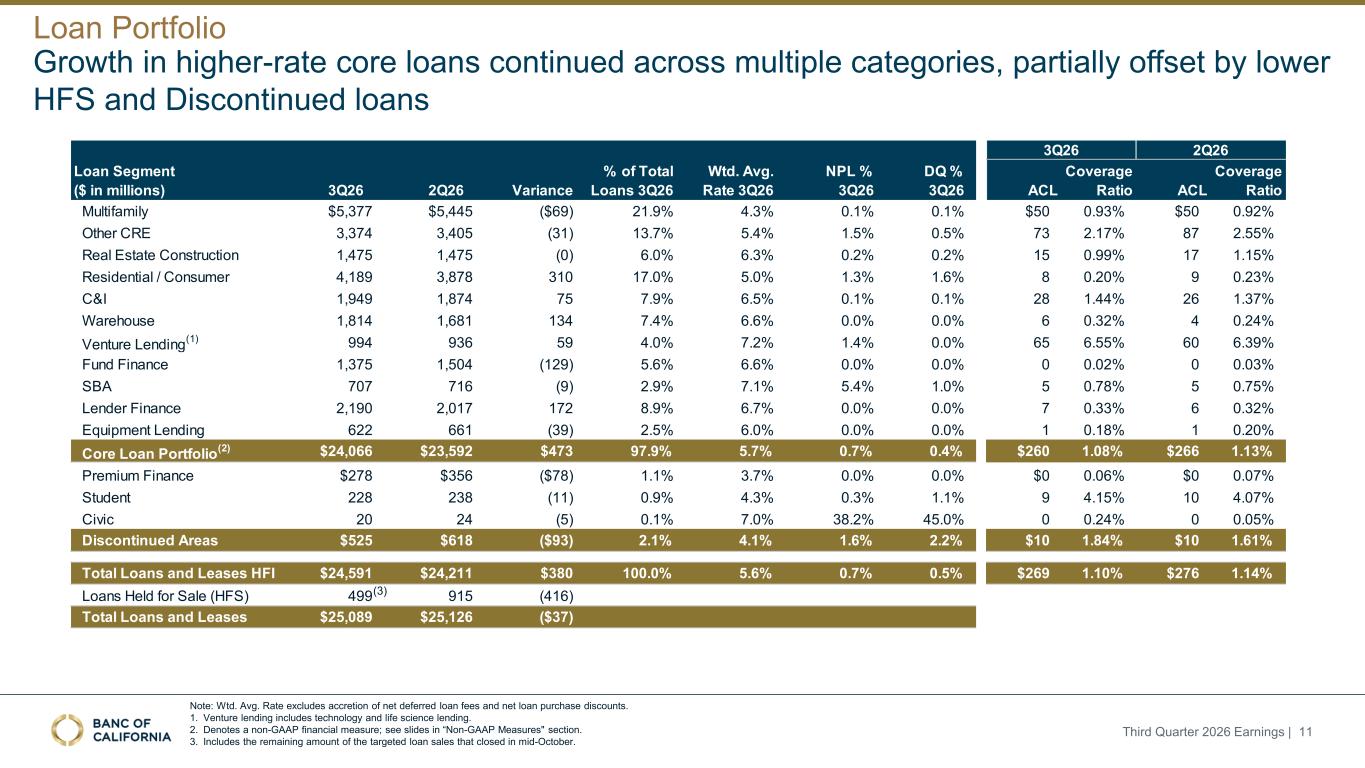
3Q26 2Q26 3Q26 2Q26 Variance % of Total Loans 3Q26 Wtd. Avg. Rate 3Q26 NPL % 3Q26 DQ % 3Q26 ACL Coverage Ratio ACL Coverage Ratio Multifamily $5,377 $5,445 ($69) 21.9% 4.3% 0.1% 0.1% $50 0.93% $50 0.92% Other CRE 3,374 3,405 (31) 13.7% 5.4% 1.5% 0.5% 73 2.17% 87 2.55% Real Estate Construction 1,475 1,475 (0) 6.0% 6.3% 0.2% 0.2% 15 0.99% 17 1.15% Residential / Consumer 4,189 3,878 310 17.0% 5.0% 1.3% 1.6% 8 0.20% 9 0.23% C&I 1,949 1,874 75 7.9% 6.5% 0.1% 0.1% 28 1.44% 26 1.37% Warehouse 1,814 1,681 134 7.4% 6.6% 0.0% 0.0% 6 0.32% 4 0.24% Venture Lending (1) 994 936 59 4.0% 7.2% 1.4% 0.0% 65 6.55% 60 6.39% Fund Finance 1,375 1,504 (129) 5.6% 6.6% 0.0% 0.0% 0 0.02% 0 0.03% SBA 707 716 (9) 2.9% 7.1% 5.4% 1.0% 5 0.78% 5 0.75% Lender Finance 2,190 2,017 172 8.9% 6.7% 0.0% 0.0% 7 0.33% 6 0.32% Equipment Lending 622 661 (39) 2.5% 6.0% 0.0% 0.0% 1 0.18% 1 0.20% Core Loan Portfolio (2) $24,066 $23,592 $473 97.9% 5.7% 0.7% 0.4% $260 1.08% $266 1.13%0 0 0% 0.0% 0.0% 0 Premium Finance $278 $356 ($78) 1.1% 3.7% 0.0% 0.0% $0 0.06% $0 0.07% Student 228 238 (11) 0.9% 4.3% 0.3% 1.1% 9 4.15% 10 4.07% Civic 20 24 (5) 0.1% 7.0% 38.2% 45.0% 0 0.24% 0 0.05% Discontinued Areas $525 $618 ($93) 2.1% 4.1% 1.6% 2.2% $10 1.84% $10 1.61% Total Loans and Leases HFI $24,591 $24,211 $380 100.0% 5.6% 0.7% 0.5% $269 1.10% $276 1.14% Loans Held for Sale (HFS) 499 915 (416) Total Loans and Leases $25,089 $25,126 ($37) Loan Segment ($ in millions) Growth in higher-rate core loans continued across multiple categories, partially offset by lower HFS and Discontinued loans Note: Wtd. Avg. Rate excludes accretion of net deferred loan fees and net loan purchase discounts. 1. Venture lending includes technology and life science lending. 2. Denotes a non-GAAP financial measure; see slides in “Non-GAAP Measures" section. 3. Includes the remaining amount of the targeted loan sales that closed in mid-October. Loan Portfolio Third Quarter 2026 Earnings | 11 (3)
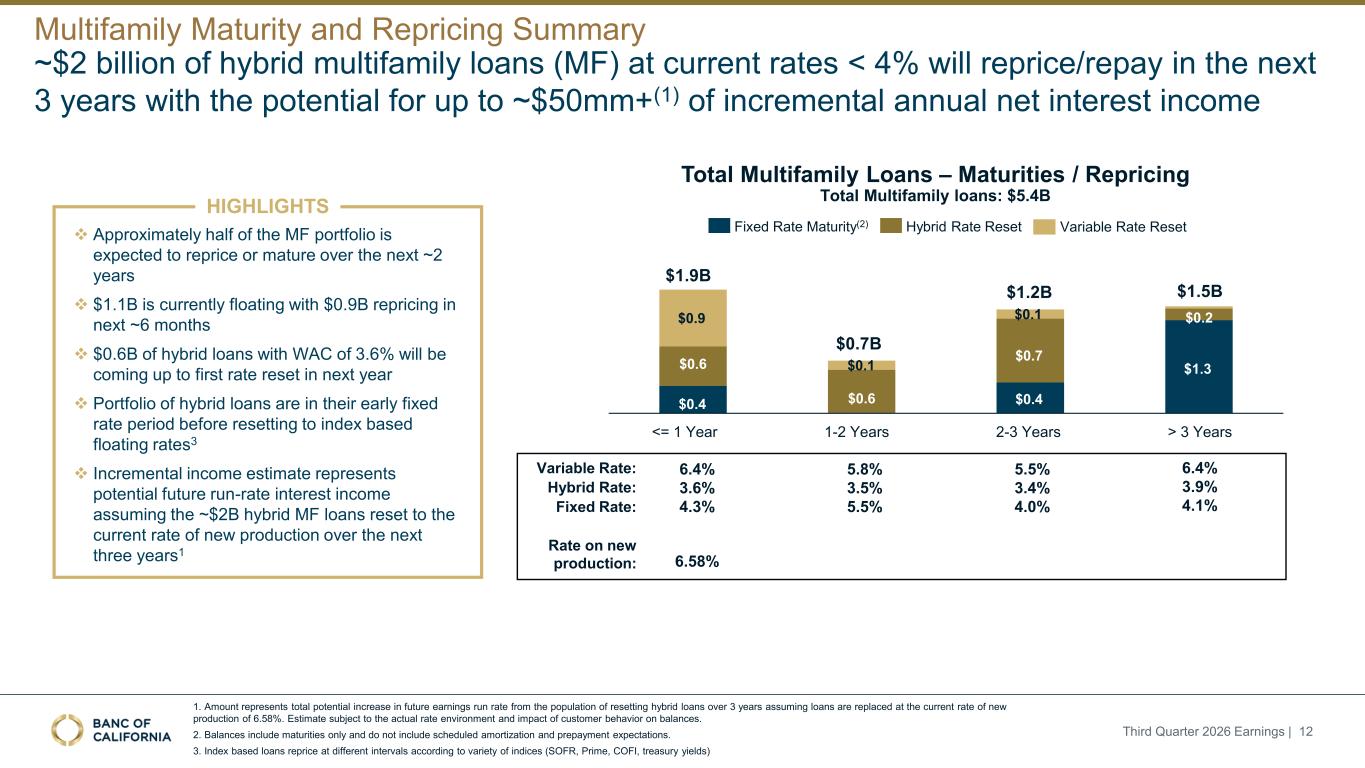
$0.4 $0.4 $1.3$0.6 $0.6 $0.7 $0.2$0.9 $0.1 $0.1 5.8% 3.5% 5.5% 5.5% 3.4% 4.0% 6.4% 3.9% 4.1% 6.4% 3.6% 4.3% 6.58% Total Multifamily Loans – Maturities / Repricing Variable Rate: Hybrid Rate: Fixed Rate: Rate on new production: Total Multifamily loans: $5.4B <= 1 Year 1-2 Years 2-3 Years > 3 Years $1.9B $0.7B $1.2B $1.5B Fixed Rate Maturity(2) Hybrid Rate Reset 1. Amount represents total potential increase in future earnings run rate from the population of resetting hybrid loans over 3 years assuming loans are replaced at the current rate of new production of 6.58%. Estimate subject to the actual rate environment and impact of customer behavior on balances. 2. Balances include maturities only and do not include scheduled amortization and prepayment expectations. 3. Index based loans reprice at different intervals according to variety of indices (SOFR, Prime, COFI, treasury yields) Third Quarter 2026 Earnings | 12 ❖ Approximately half of the MF portfolio is expected to reprice or mature over the next ~2 years ❖ $1.1B is currently floating with $0.9B repricing in next ~6 months ❖ $0.6B of hybrid loans with WAC of 3.6% will be coming up to first rate reset in next year ❖ Portfolio of hybrid loans are in their early fixed rate period before resetting to index based floating rates3 ❖ Incremental income estimate represents potential future run-rate interest income assuming the ~$2B hybrid MF loans reset to the current rate of new production over the next three years1 HIGHLIGHTS ~$2 billion of hybrid multifamily loans (MF) at current rates < 4% will reprice/repay in the next 3 years with the potential for up to ~$50mm+(1) of incremental annual net interest income Multifamily Maturity and Repricing Summary Variable Rate Reset
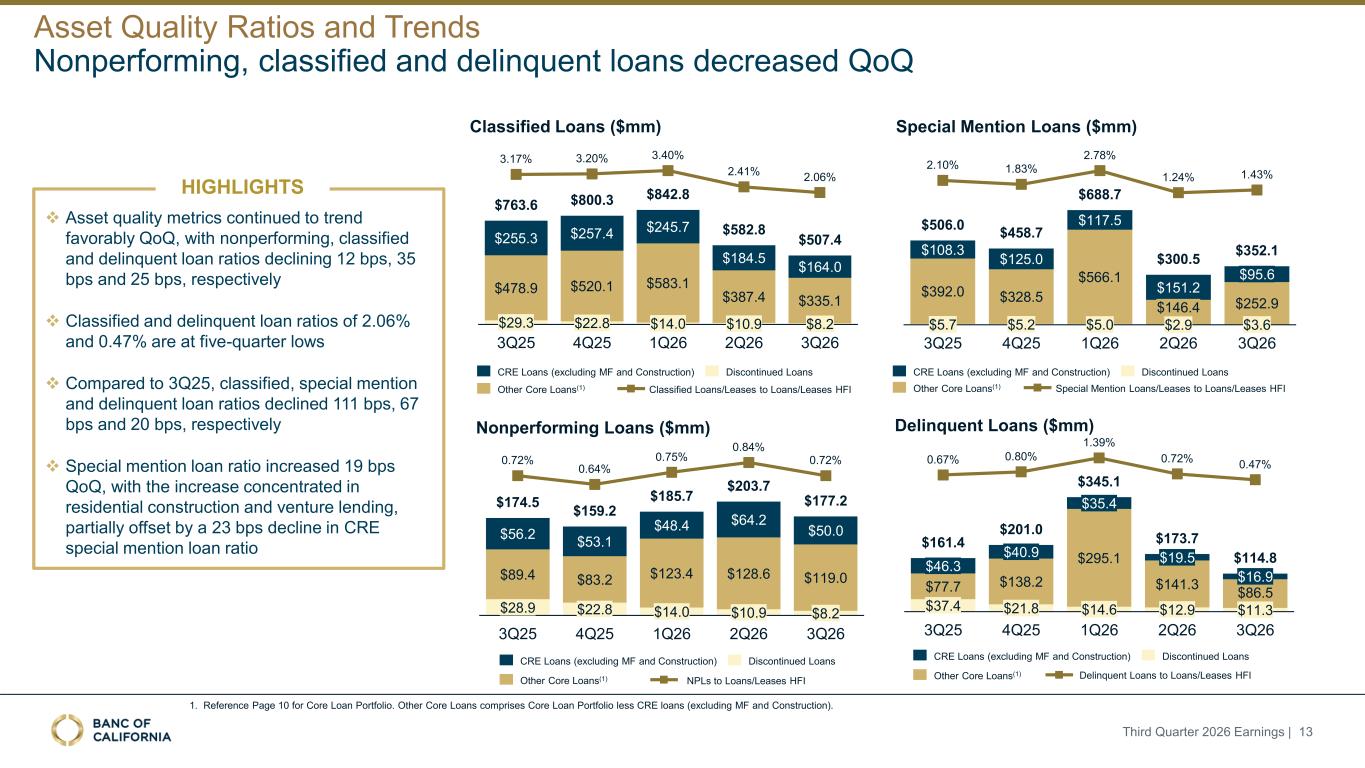
Asset Quality Ratios and Trends Nonperforming, classified and delinquent loans decreased QoQ HIGHLIGHTS ❖ Asset quality metrics continued to trend favorably QoQ, with nonperforming, classified and delinquent loan ratios declining 12 bps, 35 bps and 25 bps, respectively ❖ Classified and delinquent loan ratios of 2.06% and 0.47% are at five-quarter lows ❖ Compared to 3Q25, classified, special mention and delinquent loan ratios declined 111 bps, 67 bps and 20 bps, respectively ❖ Special mention loan ratio increased 19 bps QoQ, with the increase concentrated in residential construction and venture lending, partially offset by a 23 bps decline in CRE special mention loan ratio Classified Loans ($mm) $29.3 $22.8 $14.0 $10.9 $8.2 $478.9 $520.1 $583.1 $387.4 $335.1 $255.3 $257.4 $245.7 $184.5 $164.0 $763.6 $800.3 $842.8 $582.8 $507.4 3.17% 3.20% 3.40% 2.41% 2.06% 3Q25 4Q25 1Q26 2Q26 3Q26 CRE Loans (excluding MF and Construction) Other Core Loans(1) Discontinued Loans Classified Loans/Leases to Loans/Leases HFI Special Mention Loans ($mm) $5.7 $5.2 $5.0 $2.9 $3.6 $392.0 $328.5 $566.1 $146.4 $252.9 $108.3 $125.0 $117.5 $151.2 $95.6 $506.0 $458.7 $688.7 $300.5 $352.1 2.10% 1.83% 2.78% 1.24% 1.43% 3Q25 4Q25 1Q26 2Q26 3Q26 CRE Loans (excluding MF and Construction) Other Core Loans(1) Discontinued Loans Special Mention Loans/Leases to Loans/Leases HFI Delinquent Loans ($mm) $37.4 $21.8 $14.6 $12.9 $11.3 $77.7 $138.2 $295.1 $141.3 $86.5 $46.3 $40.9 $35.4 $19.5 $16.9 $161.4 $201.0 $345.1 $173.7 $114.8 0.67% 0.80% 1.39% 0.72% 0.47% 3Q25 4Q25 1Q26 2Q26 3Q26 CRE Loans (excluding MF and Construction) Other Core Loans(1) Discontinued Loans Delinquent Loans to Loans/Leases HFI Nonperforming Loans ($mm) $28.9 $22.8 $14.0 $10.9 $8.2 $89.4 $83.2 $123.4 $128.6 $119.0 $56.2 $53.1 $48.4 $64.2 $50.0 $174.5 $159.2 $185.7 $203.7 $177.2 0.72% 0.64% 0.75% 0.84% 0.72% 3Q25 4Q25 1Q26 2Q26 3Q26 CRE Loans (excluding MF and Construction) Other Core Loans(1) Discontinued Loans NPLs to Loans/Leases HFI 1. Reference Page 10 for Core Loan Portfolio. Other Core Loans comprises Core Loan Portfolio less CRE loans (excluding MF and Construction). Third Quarter 2026 Earnings | 13
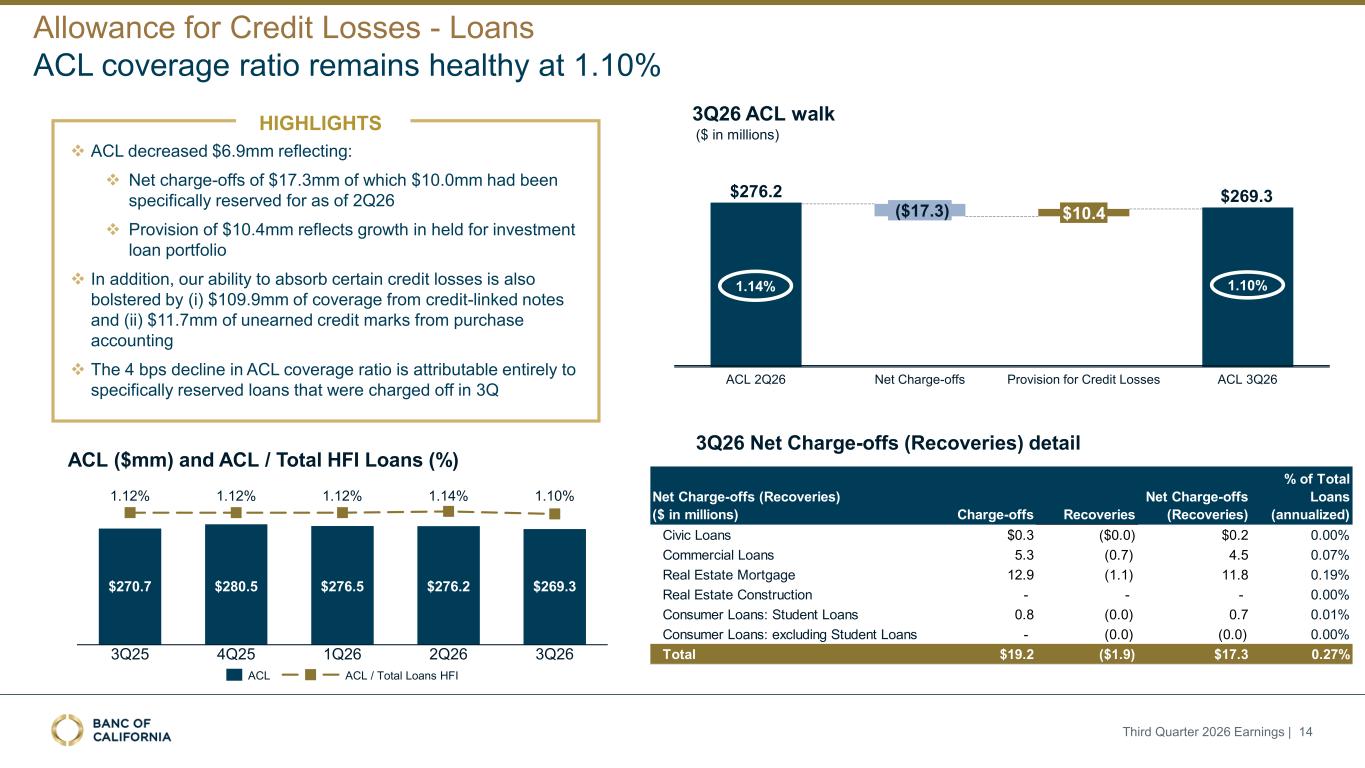
❖ ACL decreased $6.9mm reflecting: ❖ Net charge-offs of $17.3mm of which $10.0mm had been specifically reserved for as of 2Q26 ❖ Provision of $10.4mm reflects growth in held for investment loan portfolio ❖ In addition, our ability to absorb certain credit losses is also bolstered by (i) $109.9mm of coverage from credit-linked notes and (ii) $11.7mm of unearned credit marks from purchase accounting ❖ The 4 bps decline in ACL coverage ratio is attributable entirely to specifically reserved loans that were charged off in 3Q ($ in millions) 3Q26 Net Charge-offs (Recoveries) detail ACL 2Q26 ($17.3) Net Charge-offs $10.4 Provision for Credit Losses ACL 3Q26 $276.2 ACL coverage ratio remains healthy at 1.10% HIGHLIGHTS $270.7 1.12% 3Q25 $280.5 1.12% 4Q25 $276.5 1.12% 1Q26 ACL ACL / Total Loans HFI ACL ($mm) and ACL / Total HFI Loans (%) 3Q26 ACL walk 1.14% 1.10% Allowance for Credit Losses - Loans Third Quarter 2026 Earnings | 14 1.14% 1.10% $276.2 $269.3 2Q26 3Q26 $269.3 Net Charge-offs (Recoveries) ($ in millions) Charge-offs Recoveries Net Charge-offs (Recoveries) % of Total Loans (annualized) Civic Loans $0.3 ($0.0) $0.2 0.00% Commercial Loans 5.3 (0.7) 4.5 0.07% Real Estate Mortgage 12.9 (1.1) 11.8 0.19% Real Estate Construction - - - 0.00% Consumer Loans: Student Loans 0.8 (0.0) 0.7 0.01% Consumer Loans: excluding Student Loans - (0.0) (0.0) 0.00% Total $19.2 ($1.9) $17.3 0.27%
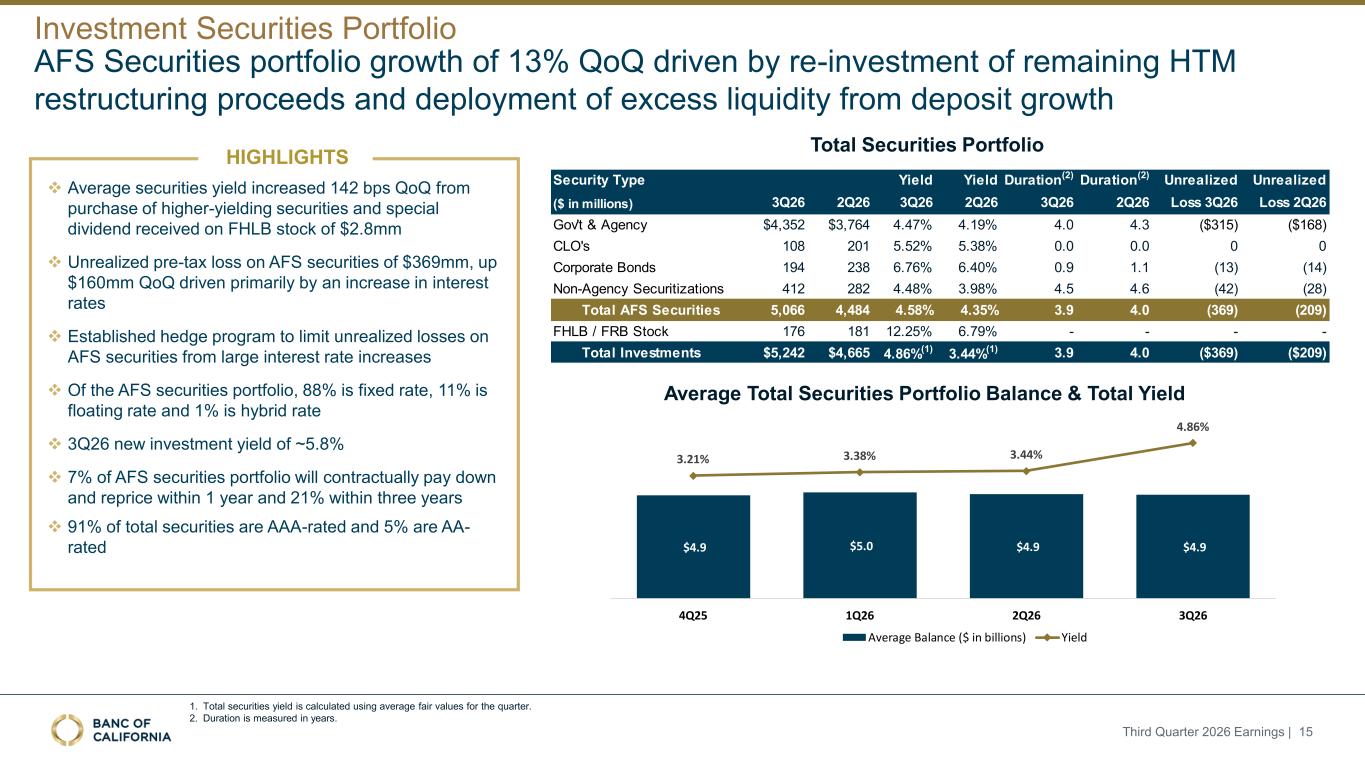
1. Total securities yield is calculated using average fair values for the quarter. 2. Duration is measured in years. AFS Securities portfolio growth of 13% QoQ driven by re-investment of remaining HTM restructuring proceeds and deployment of excess liquidity from deposit growth ❖ Average securities yield increased 142 bps QoQ from purchase of higher-yielding securities and special dividend received on FHLB stock of $2.8mm ❖ Unrealized pre-tax loss on AFS securities of $369mm, up $160mm QoQ driven primarily by an increase in interest rates ❖ Established hedge program to limit unrealized losses on AFS securities from large interest rate increases ❖ Of the AFS securities portfolio, 88% is fixed rate, 11% is floating rate and 1% is hybrid rate ❖ 3Q26 new investment yield of ~5.8% ❖ 7% of AFS securities portfolio will contractually pay down and reprice within 1 year and 21% within three years ❖ 91% of total securities are AAA-rated and 5% are AA- rated HIGHLIGHTS Investment Securities Portfolio (4) Third Quarter 2026 Earnings | 15 Average Total Securities Portfolio Balance & Total Yield $4.9 $5.0 $4.9 $4.9 3.21% 3.38% 3.44% 4.86% -3.00% -2.00% -1.00% 0.00% 1.00% 2.00% 3.00% 4.00% 5.00% $- $1.0 $2.0 $3.0 $4.0 $5.0 $6.0 $7.0 4Q25 1Q26 2Q26 3Q26 Average Balance ($ in billions) Yield Total Securities Portfolio Security Type Yield Yield Duration(2) Duration(2) Unrealized Unrealized ($ in millions) 3Q26 2Q26 3Q26 2Q26 3Q26 2Q26 Loss 3Q26 Loss 2Q26 Gov't & Agency $4,352 $3,764 4.47% 4.19% 4.0 4.3 ($315) ($168) CLO's 108 201 5.52% 5.38% 0.0 0.0 0 0 Corporate Bonds 194 238 6.76% 6.40% 0.9 1.1 (13) (14) Non-Agency Securitizations 412 282 4.48% 3.98% 4.5 4.6 (42) (28) Total AFS Securities 5,066 4,484 4.58% 4.35% 3.9 4.0 (369) (209) FHLB / FRB Stock 176 181 12.25% 6.79% - - - - Total Investments $5,242 $4,665 4.86%(1) 3.44%(1) 3.9 4.0 ($369) ($209)
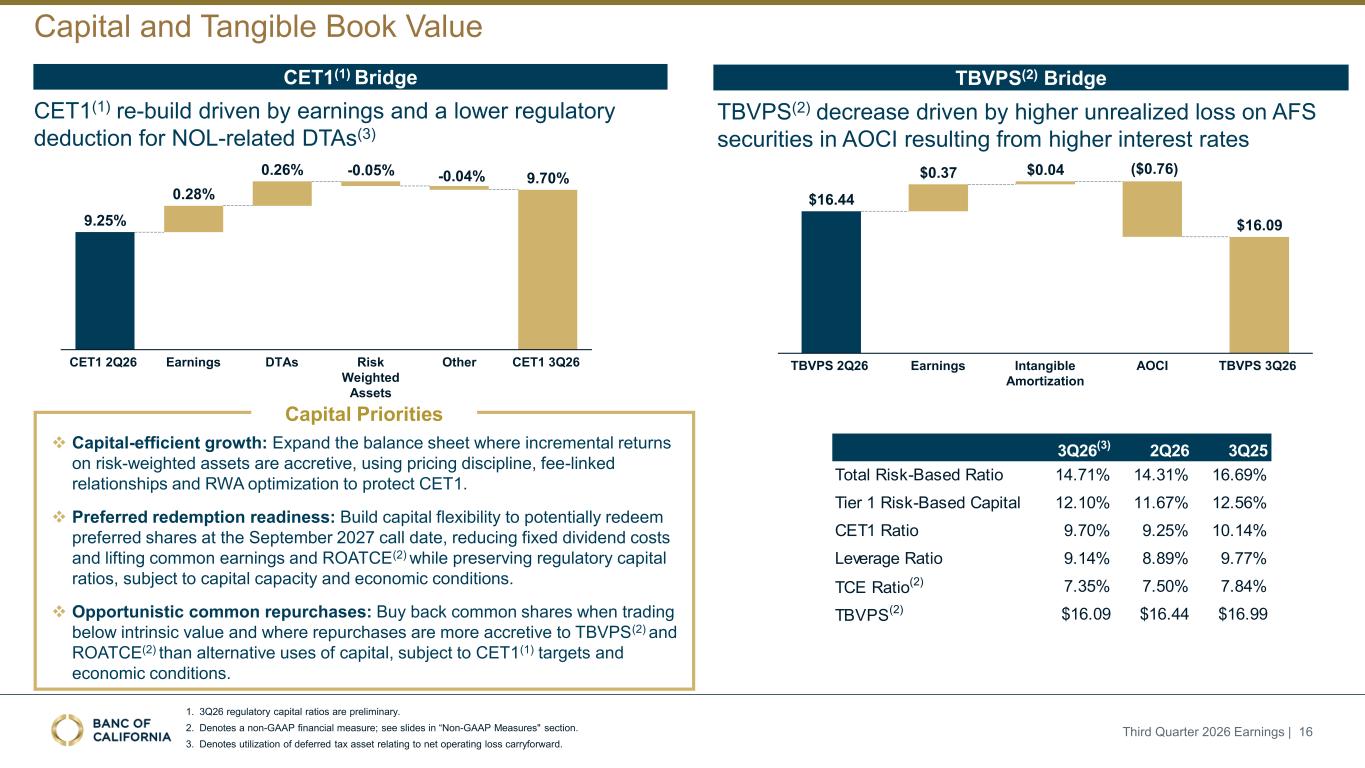
3Q26(3) 2Q26 3Q25 Total Risk-Based Ratio 14.71% 14.31% 16.69% Tier 1 Risk-Based Capital 12.10% 11.67% 12.56% CET1 Ratio 9.70% 9.25% 10.14% Leverage Ratio 9.14% 8.89% 9.77% TCE Ratio(2) 7.35% 7.50% 7.84% TBVPS(2) $16.09 $16.44 $16.99 1. 3Q26 regulatory capital ratios are preliminary. 2. Denotes a non-GAAP financial measure; see slides in “Non-GAAP Measures" section. 3. Denotes utilization of deferred tax asset relating to net operating loss carryforward. CET1(1) re-build driven by earnings and a lower regulatory deduction for NOL-related DTAs(3) Capital and Tangible Book Value Third Quarter 2026 Earnings | 16 TBVPS(2) decrease driven by higher unrealized loss on AFS securities in AOCI resulting from higher interest rates 9.25% 9.70% 0.28% 0.26% CET1 2Q26 Earnings DTAs Risk Weighted Assets Other CET1 3Q26 $16.44 $16.09 $0.37 $0.04 TBVPS 2Q26 Earnings Intangible Amortization AOCI TBVPS 3Q26 CET1(1) Bridge TBVPS(2) Bridge ❖ Capital-efficient growth: Expand the balance sheet where incremental returns on risk-weighted assets are accretive, using pricing discipline, fee-linked relationships and RWA optimization to protect CET1. ❖ Preferred redemption readiness: Build capital flexibility to potentially redeem preferred shares at the September 2027 call date, reducing fixed dividend costs and lifting common earnings and ROATCE(2) while preserving regulatory capital ratios, subject to capital capacity and economic conditions. ❖ Opportunistic common repurchases: Buy back common shares when trading below intrinsic value and where repurchases are more accretive to TBVPS(2) and ROATCE(2) than alternative uses of capital, subject to CET1(1) targets and economic conditions. Capital Priorities ($0.76)-0.05% -0.04%
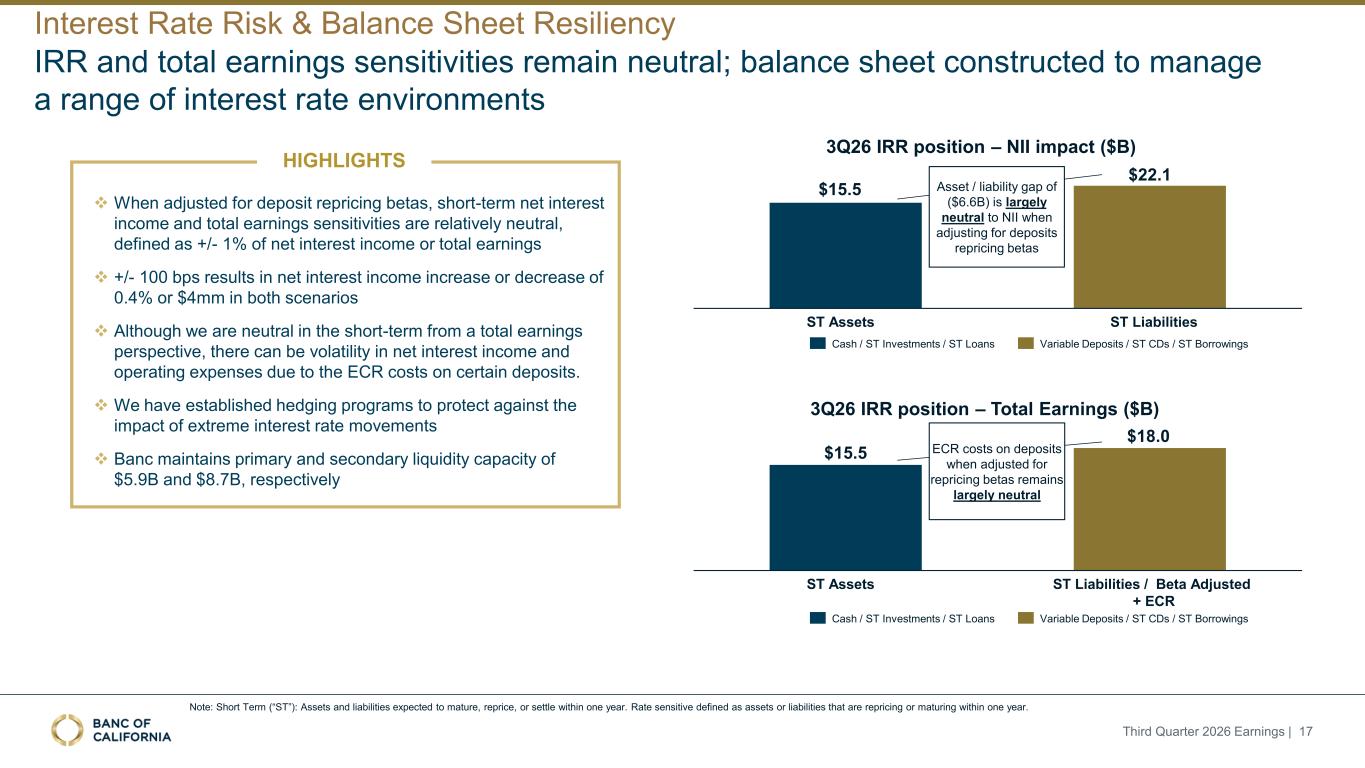
Third Quarter 2026 Earnings | 17 IRR and total earnings sensitivities remain neutral; balance sheet constructed to manage a range of interest rate environments 3Q26 IRR position – NII impact ($B) ❖ When adjusted for deposit repricing betas, short-term net interest income and total earnings sensitivities are relatively neutral, defined as +/- 1% of net interest income or total earnings ❖ +/- 100 bps results in net interest income increase or decrease of 0.4% or $4mm in both scenarios ❖ Although we are neutral in the short-term from a total earnings perspective, there can be volatility in net interest income and operating expenses due to the ECR costs on certain deposits. ❖ We have established hedging programs to protect against the impact of extreme interest rate movements ❖ Banc maintains primary and secondary liquidity capacity of $5.9B and $8.7B, respectively HIGHLIGHTS $15.5 $22.1 ST Assets ST Liabilities Asset / liability gap of ($6.6B) is largely neutral to NII when adjusting for deposits repricing betas 3Q26 IRR position – Total Earnings ($B) $15.5 $18.0 ST Assets ST Liabilities / Beta Adjusted + ECR ECR costs on deposits when adjusted for repricing betas remains largely neutral Cash / ST Investments / ST Loans Cash / ST Investments / ST Loans Variable Deposits / ST CDs / ST Borrowings Variable Deposits / ST CDs / ST Borrowings Interest Rate Risk & Balance Sheet Resiliency Note: Short Term (“ST”): Assets and liabilities expected to mature, reprice, or settle within one year. Rate sensitive defined as assets or liabilities that are repricing or maturing within one year.

Appendix
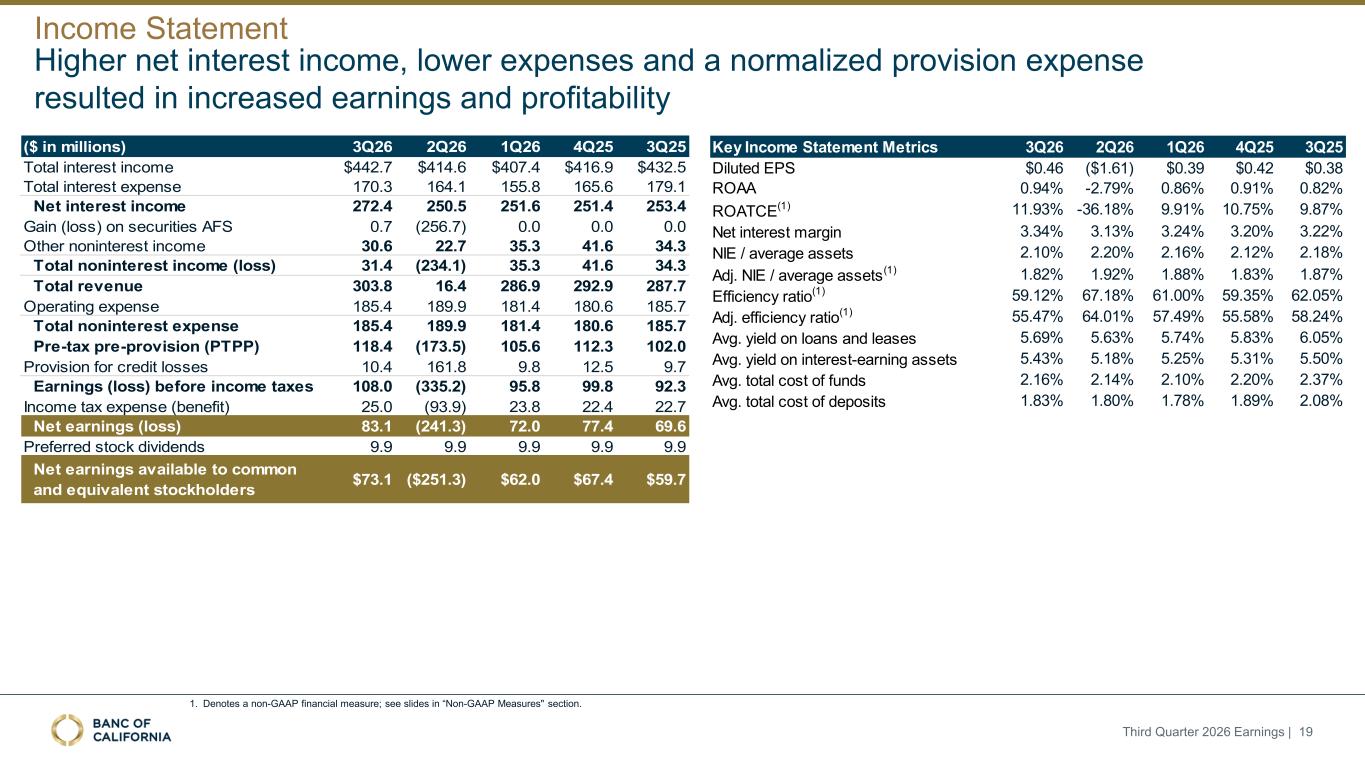
Key Income Statement Metrics 3Q26 2Q26 1Q26 4Q25 3Q25 Diluted EPS $0.46 ($1.61) $0.39 $0.42 $0.38 ROAA 0.94% -2.79% 0.86% 0.91% 0.82% ROATCE(1) 11.93% -36.18% 9.91% 10.75% 9.87% Net interest margin 3.34% 3.13% 3.24% 3.20% 3.22% NIE / average assets 2.10% 2.20% 2.16% 2.12% 2.18% Adj. NIE / average assets(1) 1.82% 1.92% 1.88% 1.83% 1.87% Efficiency ratio(1) 59.12% 67.18% 61.00% 59.35% 62.05% Adj. efficiency ratio(1) 55.47% 64.01% 57.49% 55.58% 58.24% Avg. yield on loans and leases 5.69% 5.63% 5.74% 5.83% 6.05% Avg. yield on interest-earning assets 5.43% 5.18% 5.25% 5.31% 5.50% Avg. total cost of funds 2.16% 2.14% 2.10% 2.20% 2.37% Avg. total cost of deposits 1.83% 1.80% 1.78% 1.89% 2.08% ($ in millions) 3Q26 2Q26 1Q26 4Q25 3Q25 Total interest income $442.7 $414.6 $407.4 $416.9 $432.5 Total interest expense 170.3 164.1 155.8 165.6 179.1 Net interest income 272.4 250.5 251.6 251.4 253.4 Gain (loss) on securities AFS 0.7 (256.7) 0.0 0.0 0.0 Other noninterest income 30.6 22.7 35.3 41.6 34.3 Total noninterest income (loss) 31.4 (234.1) 35.3 41.6 34.3 Total revenue 303.8 16.4 286.9 292.9 287.7 Operating expense 185.4 189.9 181.4 180.6 185.7 Total noninterest expense 185.4 189.9 181.4 180.6 185.7 Pre-tax pre-provision (PTPP) 118.4 (173.5) 105.6 112.3 102.0 Provision for credit losses 10.4 161.8 9.8 12.5 9.7 Earnings (loss) before income taxes 108.0 (335.2) 95.8 99.8 92.3 Income tax expense (benefit) 25.0 (93.9) 23.8 22.4 22.7 Net earnings (loss) 83.1 (241.3) 72.0 77.4 69.6 Preferred stock dividends 9.9 9.9 9.9 9.9 9.9 Net earnings available to common and equivalent stockholders $73.1 ($251.3) $62.0 $67.4 $59.7 1. Denotes a non-GAAP financial measure; see slides in “Non-GAAP Measures" section. Higher net interest income, lower expenses and a normalized provision expense resulted in increased earnings and profitability Income Statement Third Quarter 2026 Earnings | 19
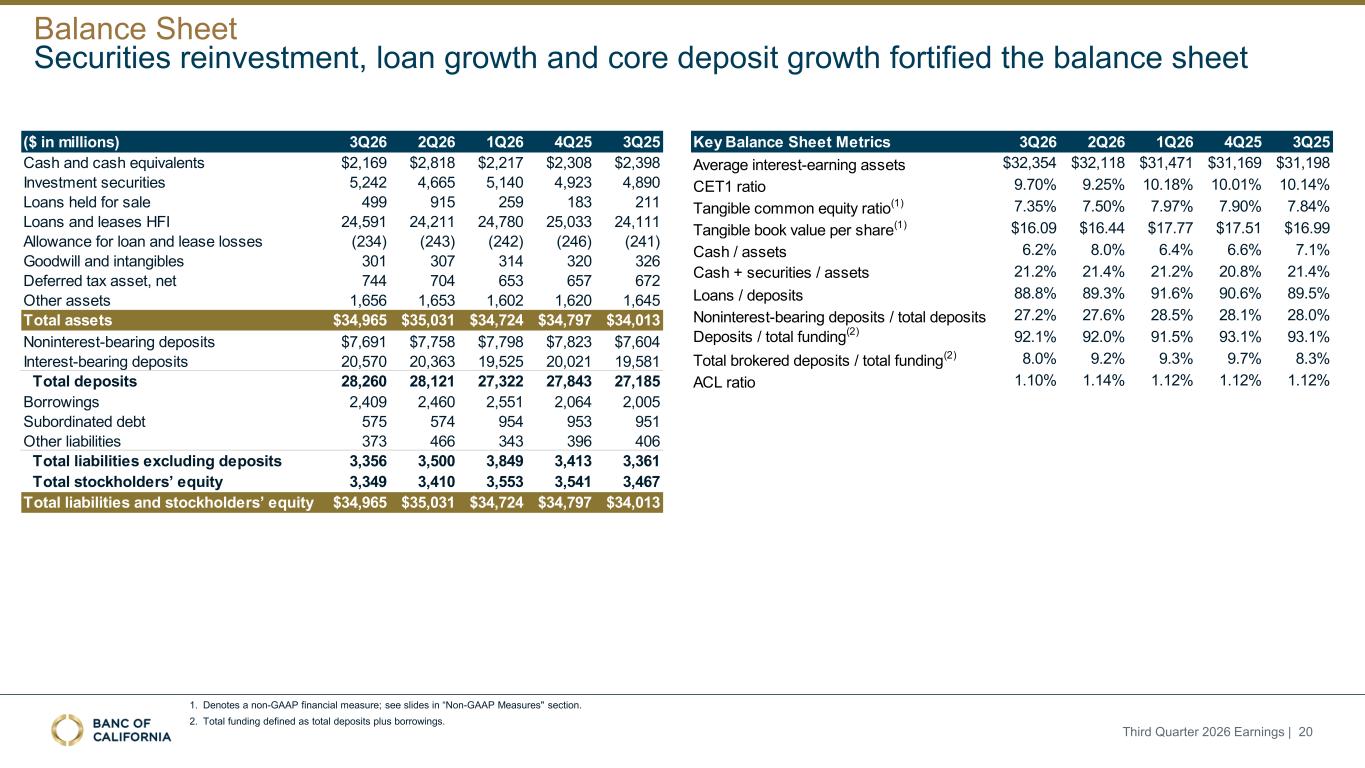
Key Balance Sheet Metrics 3Q26 2Q26 1Q26 4Q25 3Q25 Average interest-earning assets $32,354 $32,118 $31,471 $31,169 $31,198 CET1 ratio 9.70% 9.25% 10.18% 10.01% 10.14% Tangible common equity ratio(1) 7.35% 7.50% 7.97% 7.90% 7.84% Tangible book value per share(1) $16.09 $16.44 $17.77 $17.51 $16.99 Cash / assets 6.2% 8.0% 6.4% 6.6% 7.1% Cash + securities / assets 21.2% 21.4% 21.2% 20.8% 21.4% Loans / deposits 88.8% 89.3% 91.6% 90.6% 89.5% Noninterest-bearing deposits / total deposits 27.2% 27.6% 28.5% 28.1% 28.0% Deposits / total funding(2) 92.1% 92.0% 91.5% 93.1% 93.1% Total brokered deposits / total funding(2) 8.0% 9.2% 9.3% 9.7% 8.3% ACL ratio 1.10% 1.14% 1.12% 1.12% 1.12% ($ in millions) 3Q26 2Q26 1Q26 4Q25 3Q25 Cash and cash equivalents $2,169 $2,818 $2,217 $2,308 $2,398 Investment securities 5,242 4,665 5,140 4,923 4,890 Loans held for sale 499 915 259 183 211 Loans and leases HFI 24,591 24,211 24,780 25,033 24,111 Allowance for loan and lease losses (234) (243) (242) (246) (241) Goodwill and intangibles 301 307 314 320 326 Deferred tax asset, net 744 704 653 657 672 Other assets 1,656 1,653 1,602 1,620 1,645 Total assets $34,965 $35,031 $34,724 $34,797 $34,013 Noninterest-bearing deposits $7,691 $7,758 $7,798 $7,823 $7,604 Interest-bearing deposits 20,570 20,363 19,525 20,021 19,581 Total deposits 28,260 28,121 27,322 27,843 27,185 Borrowings 2,409 2,460 2,551 2,064 2,005 Subordinated debt 575 574 954 953 951 Other liabilities 373 466 343 396 406 Total liabilities excluding deposits 3,356 3,500 3,849 3,413 3,361 Total stockholders’ equity 3,349 3,410 3,553 3,541 3,467 Total liabilities and stockholders’ equity $34,965 $35,031 $34,724 $34,797 $34,013 Securities reinvestment, loan growth and core deposit growth fortified the balance sheet 1. Denotes a non-GAAP financial measure; see slides in “Non-GAAP Measures" section. 2. Total funding defined as total deposits plus borrowings. Balance Sheet Third Quarter 2026 Earnings | 20
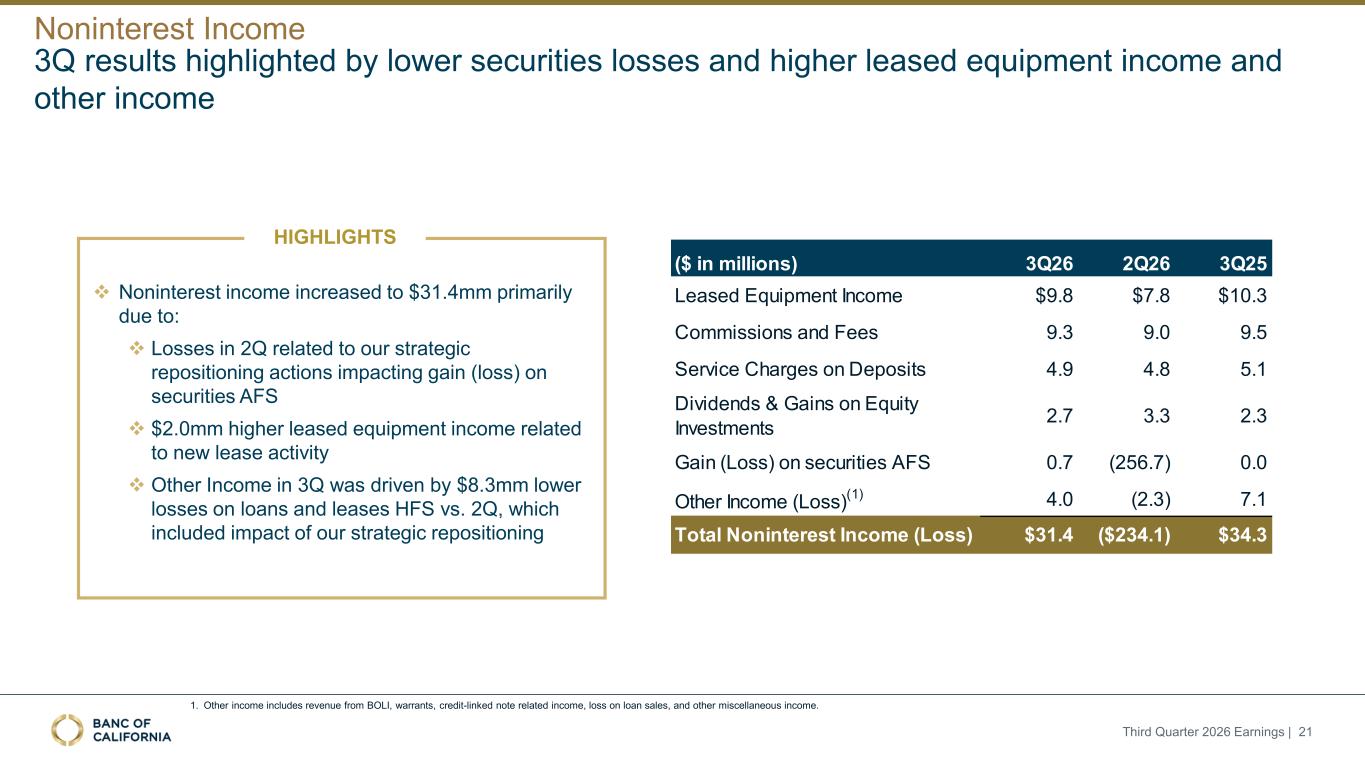
($ in millions) 3Q26 2Q26 3Q25 Leased Equipment Income $9.8 $7.8 $10.3 Commissions and Fees 9.3 9.0 9.5 Service Charges on Deposits 4.9 4.8 5.1 Dividends & Gains on Equity Investments 2.7 3.3 2.3 Gain (Loss) on securities AFS 0.7 (256.7) 0.0 Other Income (Loss) (1) 4.0 (2.3) 7.1 Total Noninterest Income (Loss) $31.4 ($234.1) $34.3 3Q results highlighted by lower securities losses and higher leased equipment income and other income Noninterest Income Third Quarter 2026 Earnings | 21 HIGHLIGHTS ❖ Noninterest income increased to $31.4mm primarily due to: ❖ Losses in 2Q related to our strategic repositioning actions impacting gain (loss) on securities AFS ❖ $2.0mm higher leased equipment income related to new lease activity ❖ Other Income in 3Q was driven by $8.3mm lower losses on loans and leases HFS vs. 2Q, which included impact of our strategic repositioning 1. Other income includes revenue from BOLI, warrants, credit-linked note related income, loss on loan sales, and other miscellaneous income.
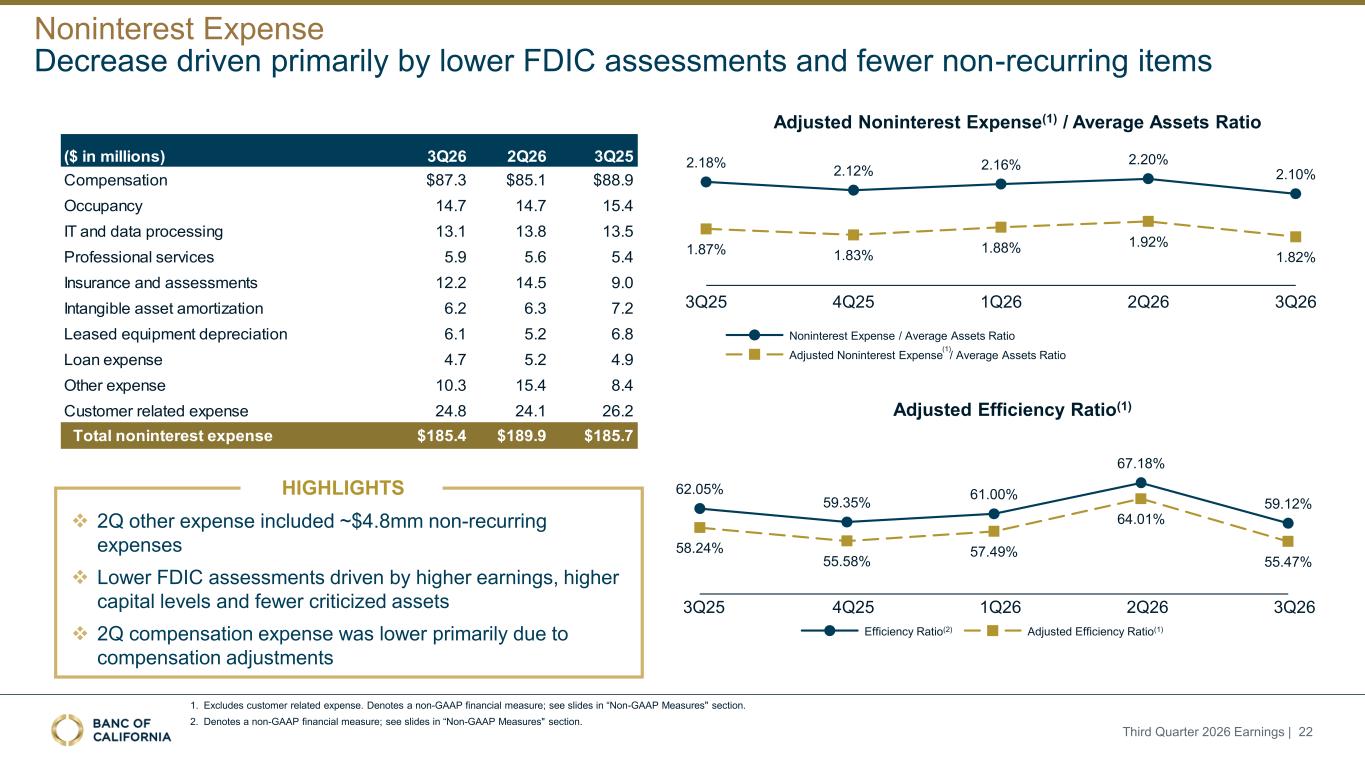
($ in millions) 3Q26 2Q26 3Q25 Compensation $87.3 $85.1 $88.9 Occupancy 14.7 14.7 15.4 IT and data processing 13.1 13.8 13.5 Professional services 5.9 5.6 5.4 Insurance and assessments 12.2 14.5 9.0 Intangible asset amortization 6.2 6.3 7.2 Leased equipment depreciation 6.1 5.2 6.8 Loan expense 4.7 5.2 4.9 Other expense 10.3 15.4 8.4 Customer related expense 24.8 24.1 26.2 Total noninterest expense $185.4 $189.9 $185.7 Adjusted Noninterest Expense(1) / Average Assets Ratio 1. Excludes customer related expense. Denotes a non-GAAP financial measure; see slides in “Non-GAAP Measures" section. 2. Denotes a non-GAAP financial measure; see slides in “Non-GAAP Measures" section. Decrease driven primarily by lower FDIC assessments and fewer non-recurring items 62.05% 59.35% 61.00% 67.18% 59.12% 58.24% 55.58% 57.49% 64.01% 55.47% 3Q25 4Q25 1Q26 2Q26 3Q26 Efficiency Ratio(2) Adjusted Efficiency Ratio(1) Adjusted Efficiency Ratio(1) 2.18% 1.87% 3Q25 2.12% 1.83% 4Q25 2.16% 1.88% 1Q26 2.20% 1.92% 2Q26 2.10% 1.82% 3Q26 Noninterest Expense / Average Assets Ratio Adjusted Noninterest Expense / Average Assets Ratio Noninterest Expense (1) Third Quarter 2026 Earnings | 22 ❖ 2Q other expense included ~$4.8mm non-recurring expenses ❖ Lower FDIC assessments driven by higher earnings, higher capital levels and fewer criticized assets ❖ 2Q compensation expense was lower primarily due to compensation adjustments HIGHLIGHTS
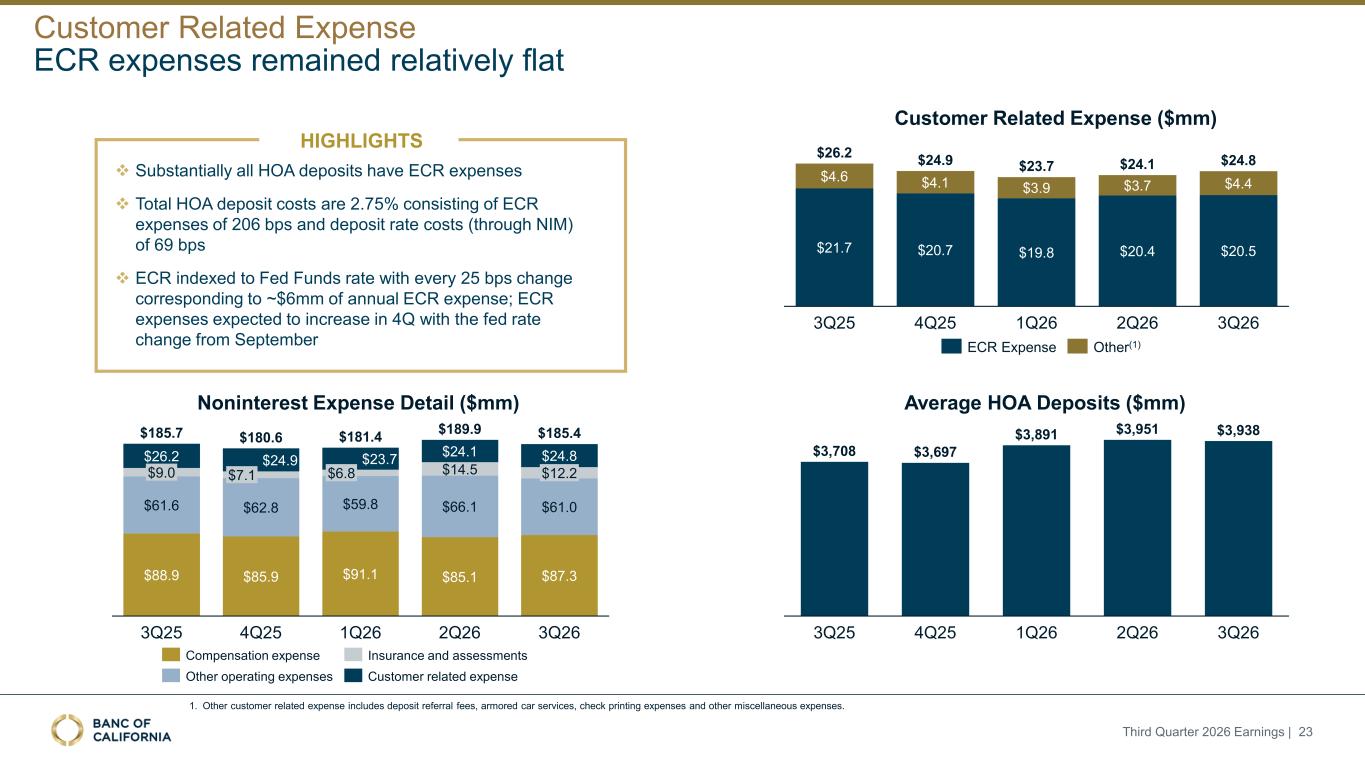
Noninterest Expense Detail ($mm) $26.2 $9.0 $61.6 $88.9 3Q25 $24.9 $7.1 $62.8 $85.9 4Q25 $23.7 $6.8 $59.8 $91.1 1Q26 $24.1 $14.5 $66.1 $85.1 2Q26 $24.8 $12.2 $61.0 $87.3 3Q26 $185.7 $180.6 $181.4 $189.9 $185.4 Compensation expense Other operating expenses Insurance and assessments Customer related expense Customer Related Expense ($mm) $21.7 $4.6 3Q25 $20.7 $4.1 4Q25 $19.8 $3.9 1Q26 $20.4 $3.7 2Q26 $26.2 $24.9 $23.7 $24.1 3Q26 $24.8 $20.5 $4.4 ECR Expense Other(1) 1. Other customer related expense includes deposit referral fees, armored car services, check printing expenses and other miscellaneous expenses. ECR expenses remained relatively flat Customer Related Expense HIGHLIGHTS ❖ Substantially all HOA deposits have ECR expenses ❖ Total HOA deposit costs are 2.75% consisting of ECR expenses of 206 bps and deposit rate costs (through NIM) of 69 bps ❖ ECR indexed to Fed Funds rate with every 25 bps change corresponding to ~$6mm of annual ECR expense; ECR expenses expected to increase in 4Q with the fed rate change from September Third Quarter 2026 Earnings | 23 3Q25 4Q25 1Q26 2Q26 3Q26 $3,708 $3,697 $3,891 $3,951 $3,938 Average HOA Deposits ($mm)
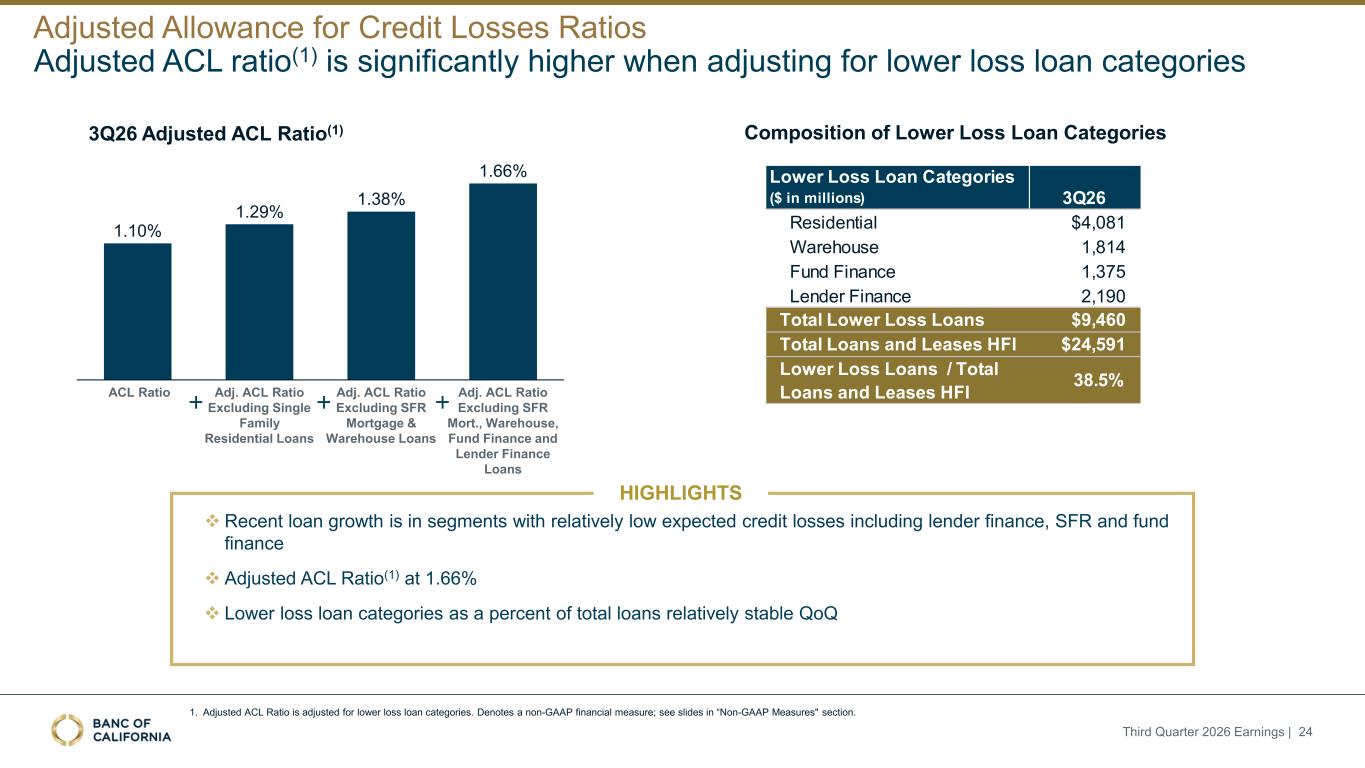
Lower Loss Loan Categories ($ in millions) 3Q26 Residential $4,081 Warehouse 1,814 Fund Finance 1,375 Lender Finance 2,190 Total Lower Loss Loans $9,460 Total Loans and Leases HFI $24,591 Lower Loss Loans / Total Loans and Leases HFI 38.5% Adjusted ACL ratio(1) is significantly higher when adjusting for lower loss loan categories 3Q26 Adjusted ACL Ratio(1) Composition of Lower Loss Loan Categories ❖ Recent loan growth is in segments with relatively low expected credit losses including lender finance, SFR and fund finance ❖ Adjusted ACL Ratio(1) at 1.66% ❖ Lower loss loan categories as a percent of total loans relatively stable QoQ 1.38% ACL Ratio Adj. ACL Ratio Excluding Single Family Residential Loans Adj. ACL Ratio Excluding SFR Mortgage & Warehouse Loans Adj. ACL Ratio Excluding SFR Mort., Warehouse, Fund Finance and Lender Finance Loans 1.10% 1.29% 1.66% HIGHLIGHTS 1. Adjusted ACL Ratio is adjusted for lower loss loan categories. Denotes a non-GAAP financial measure; see slides in “Non-GAAP Measures" section. Adjusted Allowance for Credit Losses Ratios Third Quarter 2026 Earnings | 24
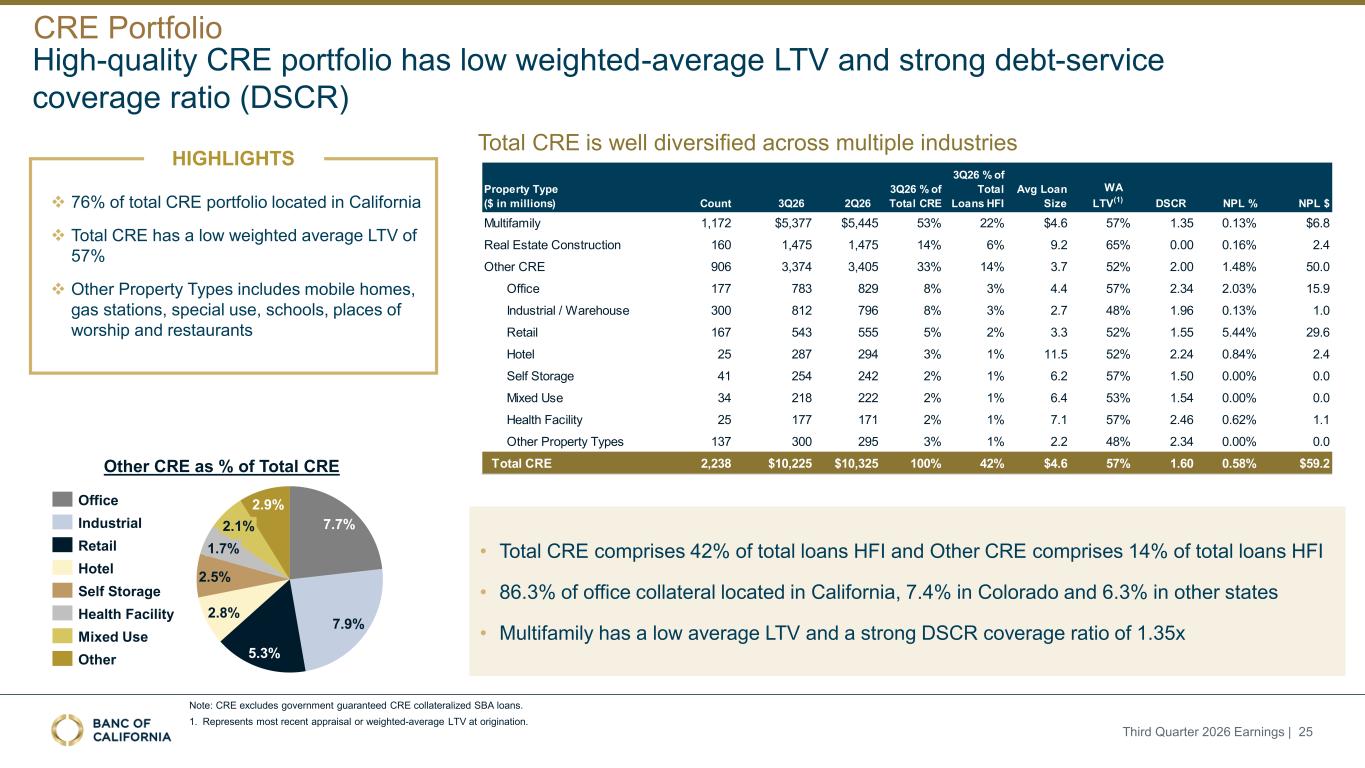
❖ 76% of total CRE portfolio located in California ❖ Total CRE has a low weighted average LTV of 57% ❖ Other Property Types includes mobile homes, gas stations, special use, schools, places of worship and restaurants 7.7% 7.9% 5.3% 2.8% 2.5% 2.9% 1.7% 2.1% Office Industrial Retail Hotel Self Storage Health Facility Mixed Use Other Other CRE as % of Total CRE Total CRE is well diversified across multiple industries • Total CRE comprises 42% of total loans HFI and Other CRE comprises 14% of total loans HFI • 86.3% of office collateral located in California, 7.4% in Colorado and 6.3% in other states • Multifamily has a low average LTV and a strong DSCR coverage ratio of 1.35x Note: CRE excludes government guaranteed CRE collateralized SBA loans. 1. Represents most recent appraisal or weighted-average LTV at origination. High-quality CRE portfolio has low weighted-average LTV and strong debt-service coverage ratio (DSCR) HIGHLIGHTS CRE Portfolio Third Quarter 2026 Earnings | 25 Property Type ($ in millions) Count 3Q26 2Q26 3Q26 % of Total CRE 3Q26 % of Total Loans HFI Avg Loan Size WA LTV(1) DSCR NPL % NPL $ Multifamily 1,172 $5,377 $5,445 53% 22% $4.6 57% 1.35 0.13% $6.8 Real Estate Construction 160 1,475 1,475 14% 6% 9.2 65% 0.00 0.16% 2.4 Other CRE 906 3,374 3,405 33% 14% 3.7 52% 2.00 1.48% 50.0 Office 177 783 829 8% 3% 4.4 57% 2.34 2.03% 15.9 Industrial / Warehouse 300 812 796 8% 3% 2.7 48% 1.96 0.13% 1.0 Retail 167 543 555 5% 2% 3.3 52% 1.55 5.44% 29.6 Hotel 25 287 294 3% 1% 11.5 52% 2.24 0.84% 2.4 Self Storage 41 254 242 2% 1% 6.2 57% 1.50 0.00% 0.0 Mixed Use 34 218 222 2% 1% 6.4 53% 1.54 0.00% 0.0 Health Facility 25 177 171 2% 1% 7.1 57% 2.46 0.62% 1.1 Other Property Types 137 300 295 3% 1% 2.2 48% 2.34 0.00% 0.0 Total CRE 2,238 $10,225 $10,325 100% 42% $4.6 57% 1.60 0.58% $59.2
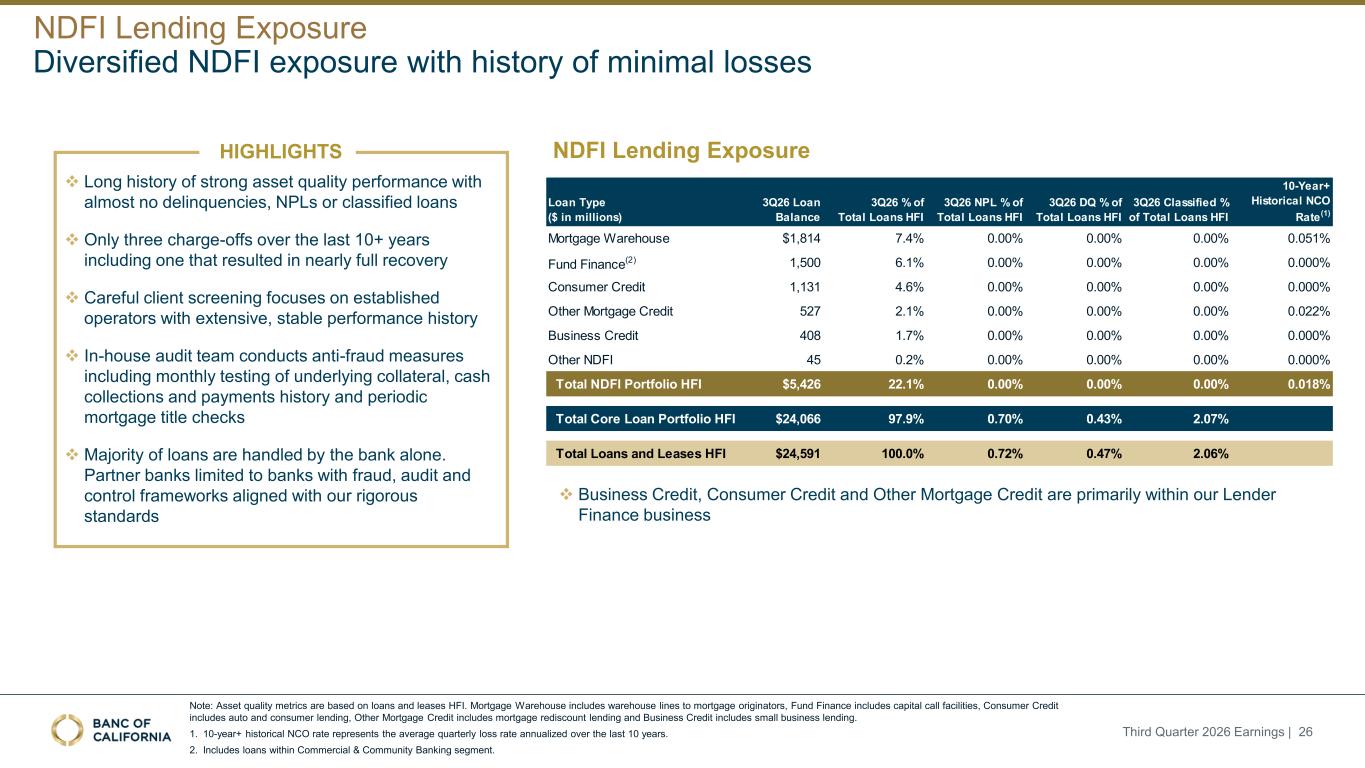
Loan Type ($ in millions) 3Q26 Loan Balance 3Q26 % of Total Loans HFI 3Q26 NPL % of Total Loans HFI 3Q26 DQ % of Total Loans HFI 3Q26 Classified % of Total Loans HFI 10-Year+ Historical NCO Rate(1) Mortgage Warehouse $1,814 7.4% 0.00% 0.00% 0.00% 0.051% Fund Finance(2) 1,500 6.1% 0.00% 0.00% 0.00% 0.000% Consumer Credit 1,131 4.6% 0.00% 0.00% 0.00% 0.000% Other Mortgage Credit 527 2.1% 0.00% 0.00% 0.00% 0.022% Business Credit 408 1.7% 0.00% 0.00% 0.00% 0.000% Other NDFI 45 0.2% 0.00% 0.00% 0.00% 0.000% Total NDFI Portfolio HFI $5,426 22.1% 0.00% 0.00% 0.00% 0.018% Total Core Loan Portfolio HFI $24,066 97.9% 0.70% 0.43% 2.07% Total Loans and Leases HFI $24,591 100.0% 0.72% 0.47% 2.06% Diversified NDFI exposure with history of minimal losses Third Quarter 2026 Earnings | 26 NDFI Lending Exposure Note: Asset quality metrics are based on loans and leases HFI. Mortgage Warehouse includes warehouse lines to mortgage originators, Fund Finance includes capital call facilities, Consumer Credit includes auto and consumer lending, Other Mortgage Credit includes mortgage rediscount lending and Business Credit includes small business lending. 1. 10-year+ historical NCO rate represents the average quarterly loss rate annualized over the last 10 years. 2. Includes loans within Commercial & Community Banking segment. HIGHLIGHTS ❖ Long history of strong asset quality performance with almost no delinquencies, NPLs or classified loans ❖ Only three charge-offs over the last 10+ years including one that resulted in nearly full recovery ❖ Careful client screening focuses on established operators with extensive, stable performance history ❖ In-house audit team conducts anti-fraud measures including monthly testing of underlying collateral, cash collections and payments history and periodic mortgage title checks ❖ Majority of loans are handled by the bank alone. Partner banks limited to banks with fraud, audit and control frameworks aligned with our rigorous standards NDFI Lending Exposure ❖ Business Credit, Consumer Credit and Other Mortgage Credit are primarily within our Lender Finance business
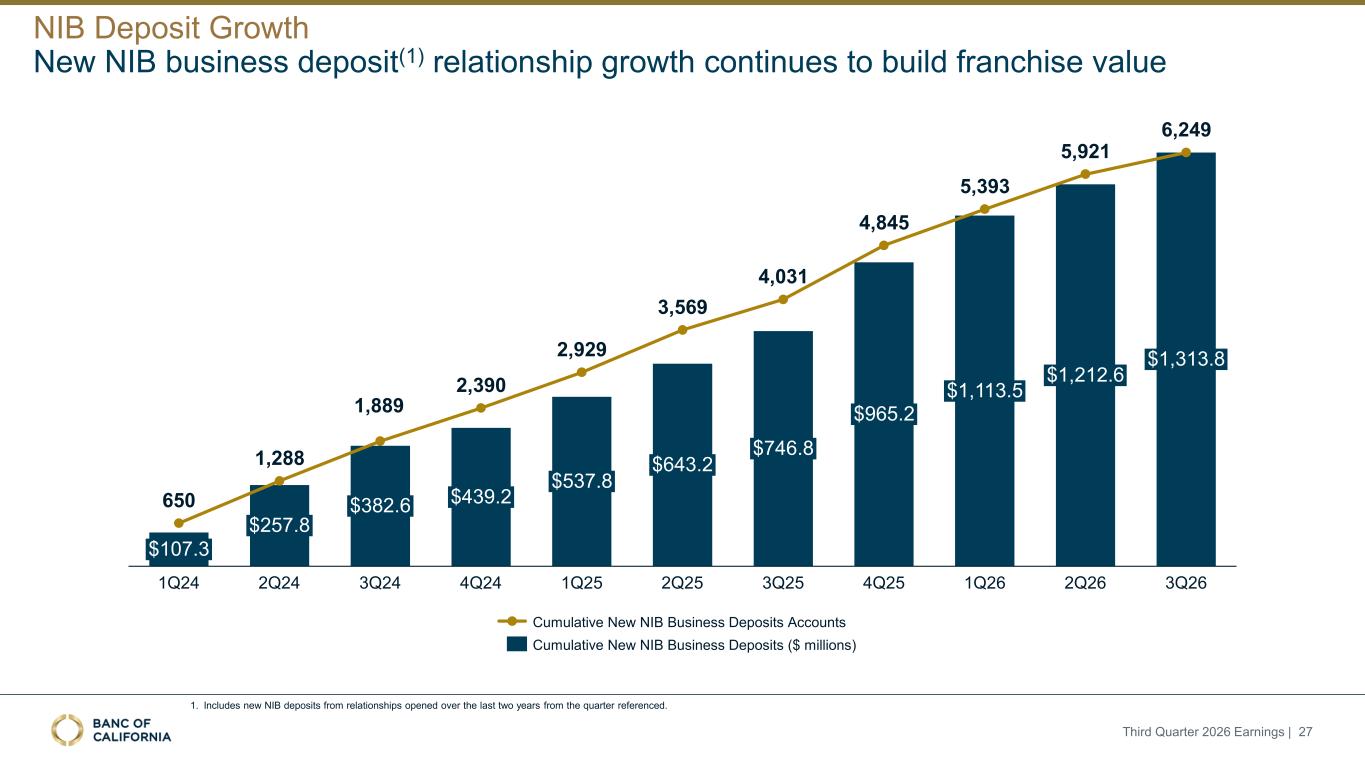
650 1,288 1,889 2,390 2,929 3,569 4,031 4,845 5,393 5,921 6,249 $107.3 1Q24 $257.8 2Q24 $382.6 3Q24 $439.2 4Q24 $537.8 1Q25 $643.2 2Q25 $746.8 3Q25 $965.2 4Q25 $1,113.5 1Q26 $1,212.6 2Q26 $1,313.8 3Q26 Cumulative New NIB Business Deposits Accounts Cumulative New NIB Business Deposits ($ millions) New NIB business deposit(1) relationship growth continues to build franchise value 1. Includes new NIB deposits from relationships opened over the last two years from the quarter referenced. NIB Deposit Growth Third Quarter 2026 Earnings | 27
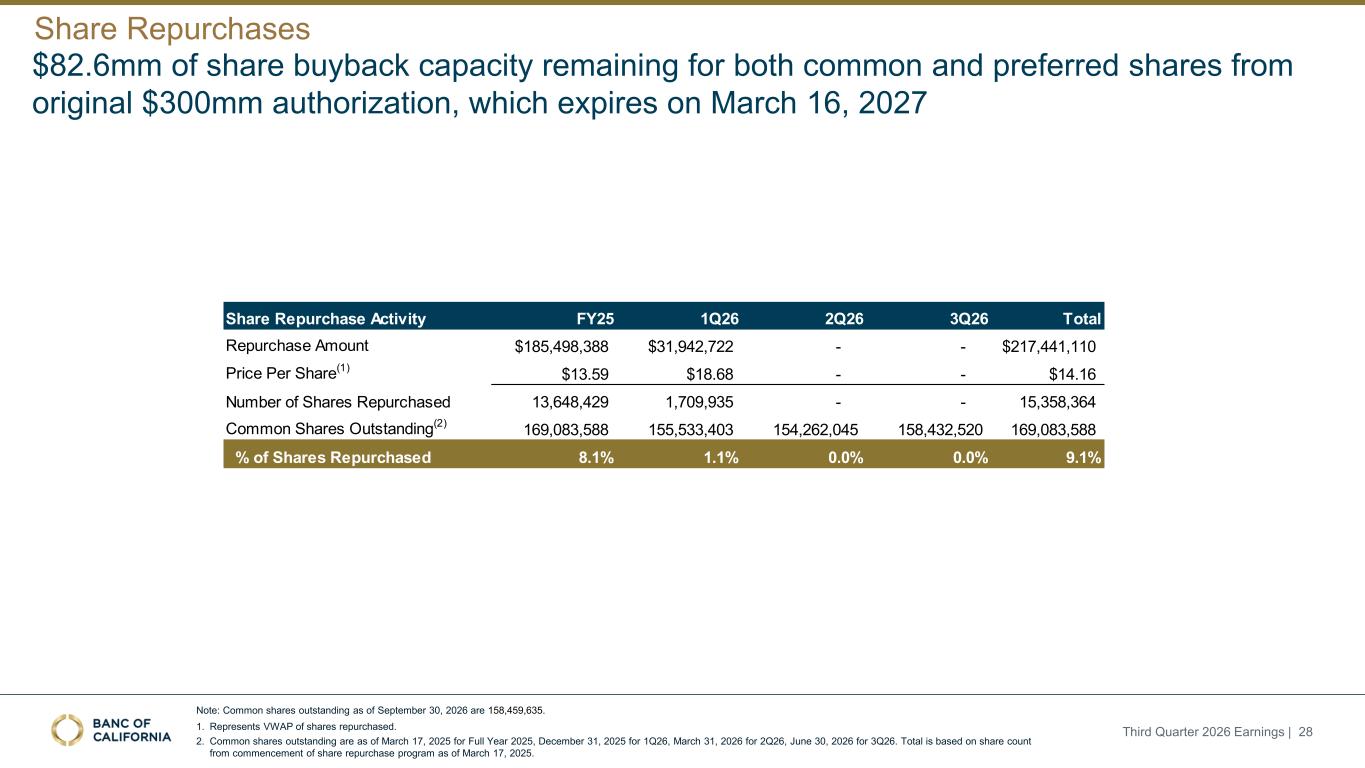
Note: Common shares outstanding as of September 30, 2026 are 158,459,635. 1. Represents VWAP of shares repurchased. 2. Common shares outstanding are as of March 17, 2025 for Full Year 2025, December 31, 2025 for 1Q26, March 31, 2026 for 2Q26, June 30, 2026 for 3Q26. Total is based on share count from commencement of share repurchase program as of March 17, 2025. $82.6mm of share buyback capacity remaining for both common and preferred shares from original $300mm authorization, which expires on March 16, 2027 Share Repurchases Third Quarter 2026 Earnings | 28 Share Repurchase Activity FY25 1Q26 2Q26 3Q26 Total Repurchase Amount $185,498,388 $31,942,722 - - $217,441,110 Price Per Share(1) $13.59 $18.68 - - $14.16 Number of Shares Repurchased 13,648,429 1,709,935 - - 15,358,364 Common Shares Outstanding(2) 169,083,588 155,533,403 154,262,045 158,432,520 169,083,588 % of Shares Repurchased 8.1% 1.1% 0.0% 0.0% 9.1%
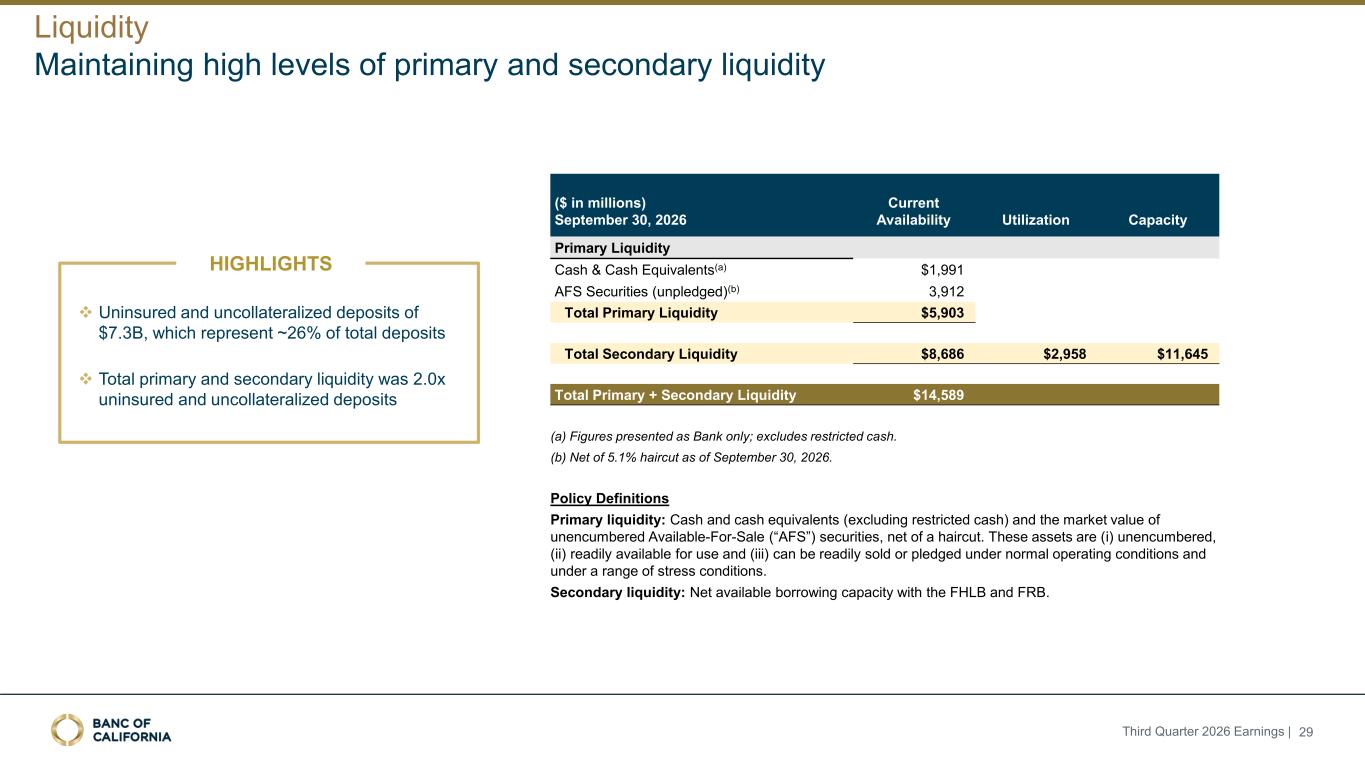
Third Quarter 2026 Earnings | Liquidity Maintaining high levels of primary and secondary liquidity ($ in millions) September 30, 2026 Current Availability Utilization Capacity Primary Liquidity Cash & Cash Equivalents(a) $1,991 AFS Securities (unpledged)(b) 3,912 Total Primary Liquidity $5,903 Total Secondary Liquidity $8,686 $2,958 $11,645 Total Primary + Secondary Liquidity $14,589 (a) Figures presented as Bank only; excludes restricted cash. (b) Net of 5.1% haircut as of September 30, 2026. Policy Definitions Primary liquidity: Cash and cash equivalents (excluding restricted cash) and the market value of unencumbered Available-For-Sale (“AFS”) securities, net of a haircut. These assets are (i) unencumbered, (ii) readily available for use and (iii) can be readily sold or pledged under normal operating conditions and under a range of stress conditions. Secondary liquidity: Net available borrowing capacity with the FHLB and FRB. ❖ Uninsured and uncollateralized deposits of $7.3B, which represent ~26% of total deposits ❖ Total primary and secondary liquidity was 2.0x uninsured and uncollateralized deposits HIGHLIGHTS 29
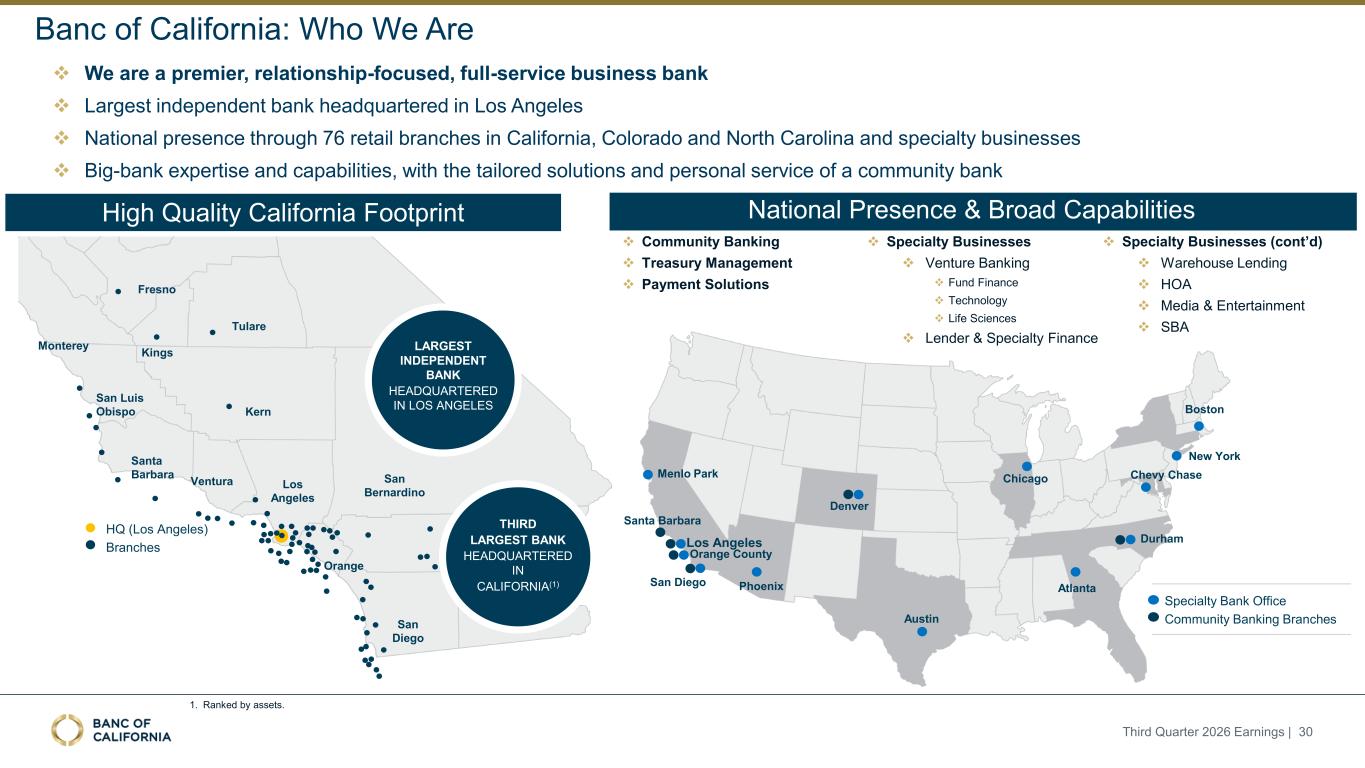
Banc of California: Who We Are ❖ We are a premier, relationship-focused, full-service business bank ❖ Largest independent bank headquartered in Los Angeles ❖ National presence through 76 retail branches in California, Colorado and North Carolina and specialty businesses ❖ Big-bank expertise and capabilities, with the tailored solutions and personal service of a community bank High Quality California Footprint National Presence & Broad Capabilities ❖ Community Banking ❖ Treasury Management ❖ Payment Solutions ❖ Specialty Businesses ❖ Venture Banking ❖ Fund Finance ❖ Technology ❖ Life Sciences ❖ Lender & Specialty Finance Specialty Bank Office Community Banking Branches Menlo Park Orange County Los Angeles Denver San Diego Austin Atlanta Chicago Boston New York Chevy Chase Durham Phoenix Santa Barbara ❖ Specialty Businesses (cont’d) ❖ Warehouse Lending ❖ HOA ❖ Media & Entertainment ❖ SBA Third Quarter 2026 Earnings | 30 1. Ranked by assets. Fresno Monterey Kings Tulare Kern San Luis Obispo Santa Barbara Ventura Los Angeles San Bernardino RiversideOrange San Diego 61 62 63 64 65 66 67 69 68 70 71 72 73 74 76 16 75 17 20 18 15 14 10 8 22 25 26 7 56 12 11 34 35 36 37 38 13 4 9 39 40 4142 43 44 45 32 33 46 2 13 29 27 28 31 30 47 48 49 53 50 51 52 55 54 56 57 58 LARGEST INDEPENDENT BANK HEADQUARTERED IN LOS ANGELES HQ (Los Angeles) Branches THIRD LARGEST BANK HEADQUARTERED IN CALIFORNIA(1) 1923 21 24
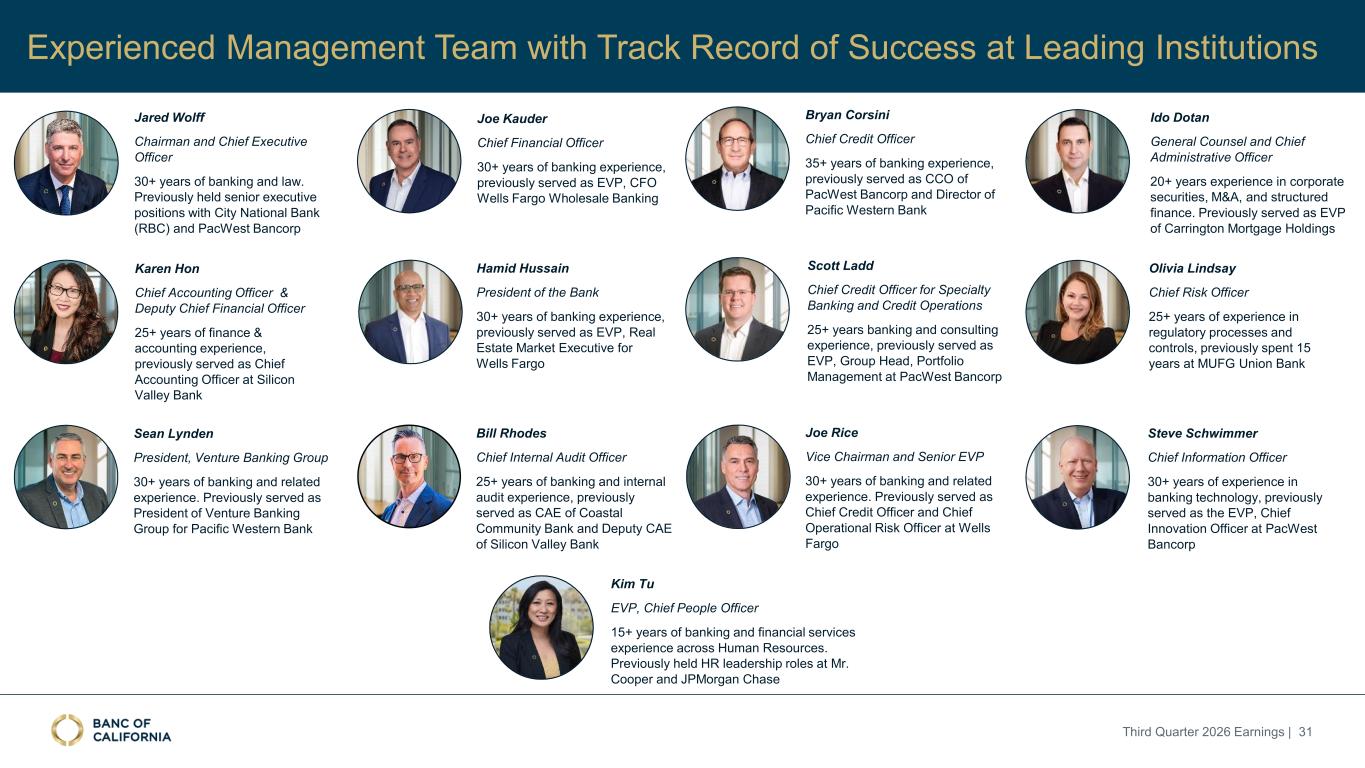
Experienced Management Team with Track Record of Success at Leading Institutions Scott Ladd Chief Credit Officer for Specialty Banking and Credit Operations 25+ years banking and consulting experience, previously served as EVP, Group Head, Portfolio Management at PacWest Bancorp Hamid Hussain President of the Bank 30+ years of banking experience, previously served as EVP, Real Estate Market Executive for Wells Fargo Bryan Corsini Chief Credit Officer 35+ years of banking experience, previously served as CCO of PacWest Bancorp and Director of Pacific Western Bank Ido Dotan General Counsel and Chief Administrative Officer 20+ years experience in corporate securities, M&A, and structured finance. Previously served as EVP of Carrington Mortgage Holdings Olivia Lindsay Chief Risk Officer 25+ years of experience in regulatory processes and controls, previously spent 15 years at MUFG Union Bank Steve Schwimmer Chief Information Officer 30+ years of experience in banking technology, previously served as the EVP, Chief Innovation Officer at PacWest Bancorp Sean Lynden President, Venture Banking Group 30+ years of banking and related experience. Previously served as President of Venture Banking Group for Pacific Western Bank Kim Tu EVP, Chief People Officer 15+ years of banking and financial services experience across Human Resources. Previously held HR leadership roles at Mr. Cooper and JPMorgan Chase Karen Hon Chief Accounting Officer & Deputy Chief Financial Officer 25+ years of finance & accounting experience, previously served as Chief Accounting Officer at Silicon Valley Bank Jared Wolff Chairman and Chief Executive Officer 30+ years of banking and law. Previously held senior executive positions with City National Bank (RBC) and PacWest Bancorp Joe Kauder Chief Financial Officer 30+ years of banking experience, previously served as EVP, CFO Wells Fargo Wholesale Banking Bill Rhodes Chief Internal Audit Officer 25+ years of banking and internal audit experience, previously served as CAE of Coastal Community Bank and Deputy CAE of Silicon Valley Bank Joe Rice Vice Chairman and Senior EVP 30+ years of banking and related experience. Previously served as Chief Credit Officer and Chief Operational Risk Officer at Wells Fargo Third Quarter 2026 Earnings | 31
Non-GAAP Measures
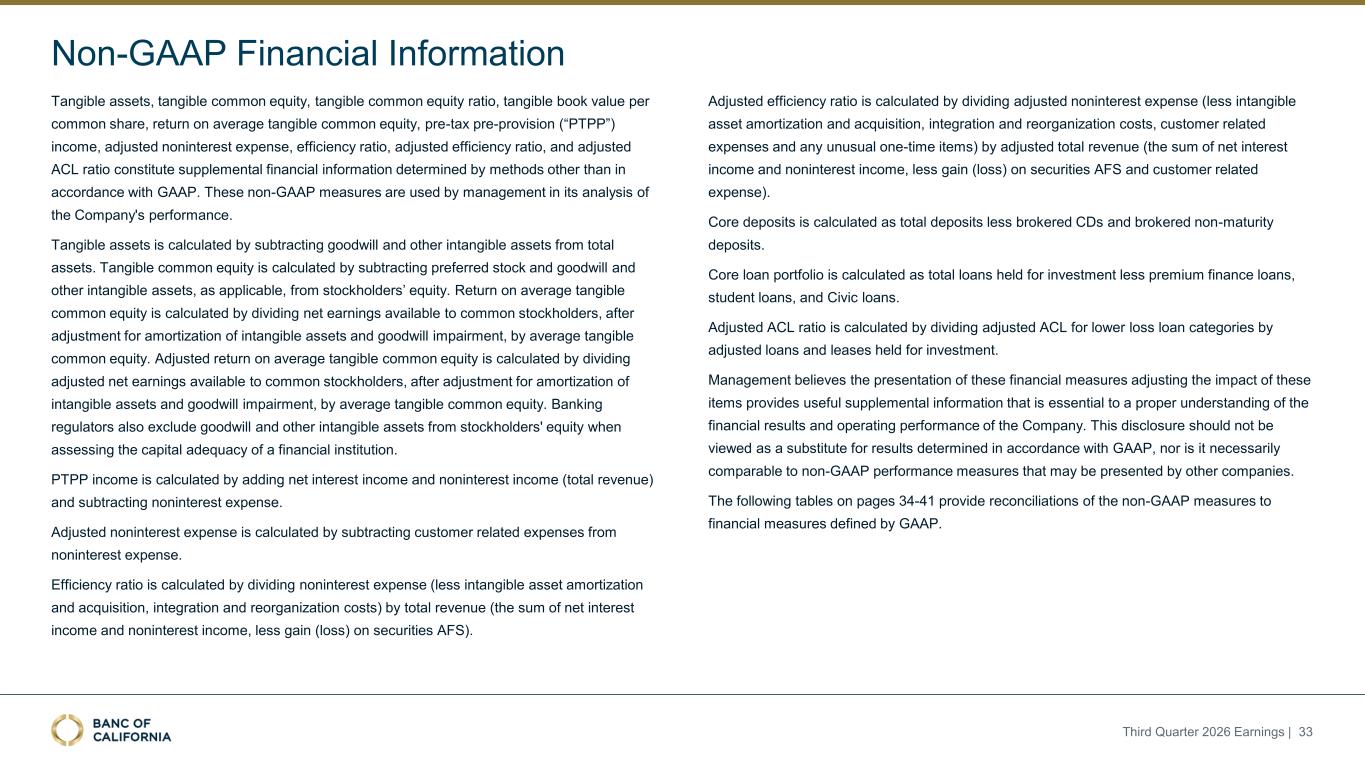
Non-GAAP Financial Information Third Quarter 2026 Earnings | 33 Tangible assets, tangible common equity, tangible common equity ratio, tangible book value per common share, return on average tangible common equity, pre-tax pre-provision (“PTPP”) income, adjusted noninterest expense, efficiency ratio, adjusted efficiency ratio, and adjusted ACL ratio constitute supplemental financial information determined by methods other than in accordance with GAAP. These non-GAAP measures are used by management in its analysis of the Company's performance. Tangible assets is calculated by subtracting goodwill and other intangible assets from total assets. Tangible common equity is calculated by subtracting preferred stock and goodwill and other intangible assets, as applicable, from stockholders’ equity. Return on average tangible common equity is calculated by dividing net earnings available to common stockholders, after adjustment for amortization of intangible assets and goodwill impairment, by average tangible common equity. Adjusted return on average tangible common equity is calculated by dividing adjusted net earnings available to common stockholders, after adjustment for amortization of intangible assets and goodwill impairment, by average tangible common equity. Banking regulators also exclude goodwill and other intangible assets from stockholders' equity when assessing the capital adequacy of a financial institution. PTPP income is calculated by adding net interest income and noninterest income (total revenue) and subtracting noninterest expense. Adjusted noninterest expense is calculated by subtracting customer related expenses from noninterest expense. Efficiency ratio is calculated by dividing noninterest expense (less intangible asset amortization and acquisition, integration and reorganization costs) by total revenue (the sum of net interest income and noninterest income, less gain (loss) on securities AFS). Adjusted efficiency ratio is calculated by dividing adjusted noninterest expense (less intangible asset amortization and acquisition, integration and reorganization costs, customer related expenses and any unusual one-time items) by adjusted total revenue (the sum of net interest income and noninterest income, less gain (loss) on securities AFS and customer related expense). Core deposits is calculated as total deposits less brokered CDs and brokered non-maturity deposits. Core loan portfolio is calculated as total loans held for investment less premium finance loans, student loans, and Civic loans. Adjusted ACL ratio is calculated by dividing adjusted ACL for lower loss loan categories by adjusted loans and leases held for investment. Management believes the presentation of these financial measures adjusting the impact of these items provides useful supplemental information that is essential to a proper understanding of the financial results and operating performance of the Company. This disclosure should not be viewed as a substitute for results determined in accordance with GAAP, nor is it necessarily comparable to non-GAAP performance measures that may be presented by other companies. The following tables on pages 34-41 provide reconciliations of the non-GAAP measures to financial measures defined by GAAP.
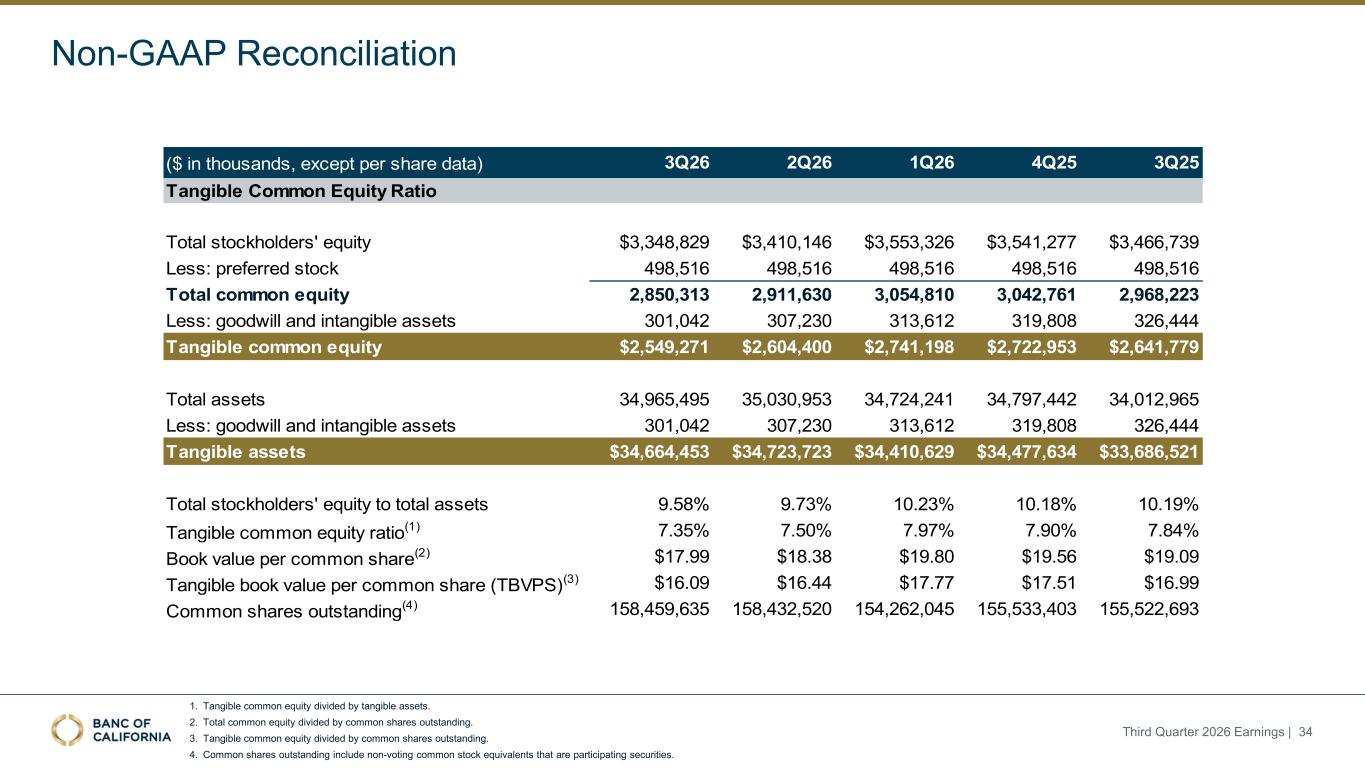
($ in thousands, except per share data) 3Q26 2Q26 1Q26 4Q25 3Q25 Tangible Common Equity Ratio Total stockholders' equity $3,348,829 $3,410,146 $3,553,326 $3,541,277 $3,466,739 Less: preferred stock 498,516 498,516 498,516 498,516 498,516 Total common equity 2,850,313 2,911,630 3,054,810 3,042,761 2,968,223 Less: goodwill and intangible assets 301,042 307,230 313,612 319,808 326,444 Tangible common equity $2,549,271 $2,604,400 $2,741,198 $2,722,953 $2,641,779 Total assets 34,965,495 35,030,953 34,724,241 34,797,442 34,012,965 Less: goodwill and intangible assets 301,042 307,230 313,612 319,808 326,444 Tangible assets $34,664,453 $34,723,723 $34,410,629 $34,477,634 $33,686,521 Total stockholders' equity to total assets 9.58% 9.73% 10.23% 10.18% 10.19% Tangible common equity ratio(1) 7.35% 7.50% 7.97% 7.90% 7.84% Book value per common share(2) $17.99 $18.38 $19.80 $19.56 $19.09 Tangible book value per common share (TBVPS)(3) $16.09 $16.44 $17.77 $17.51 $16.99 Common shares outstanding(4) 158,459,635 158,432,520 154,262,045 155,533,403 155,522,693 Non-GAAP Reconciliation Third Quarter 2026 Earnings | 34 1. Tangible common equity divided by tangible assets. 2. Total common equity divided by common shares outstanding. 3. Tangible common equity divided by common shares outstanding. 4. Common shares outstanding include non-voting common stock equivalents that are participating securities.
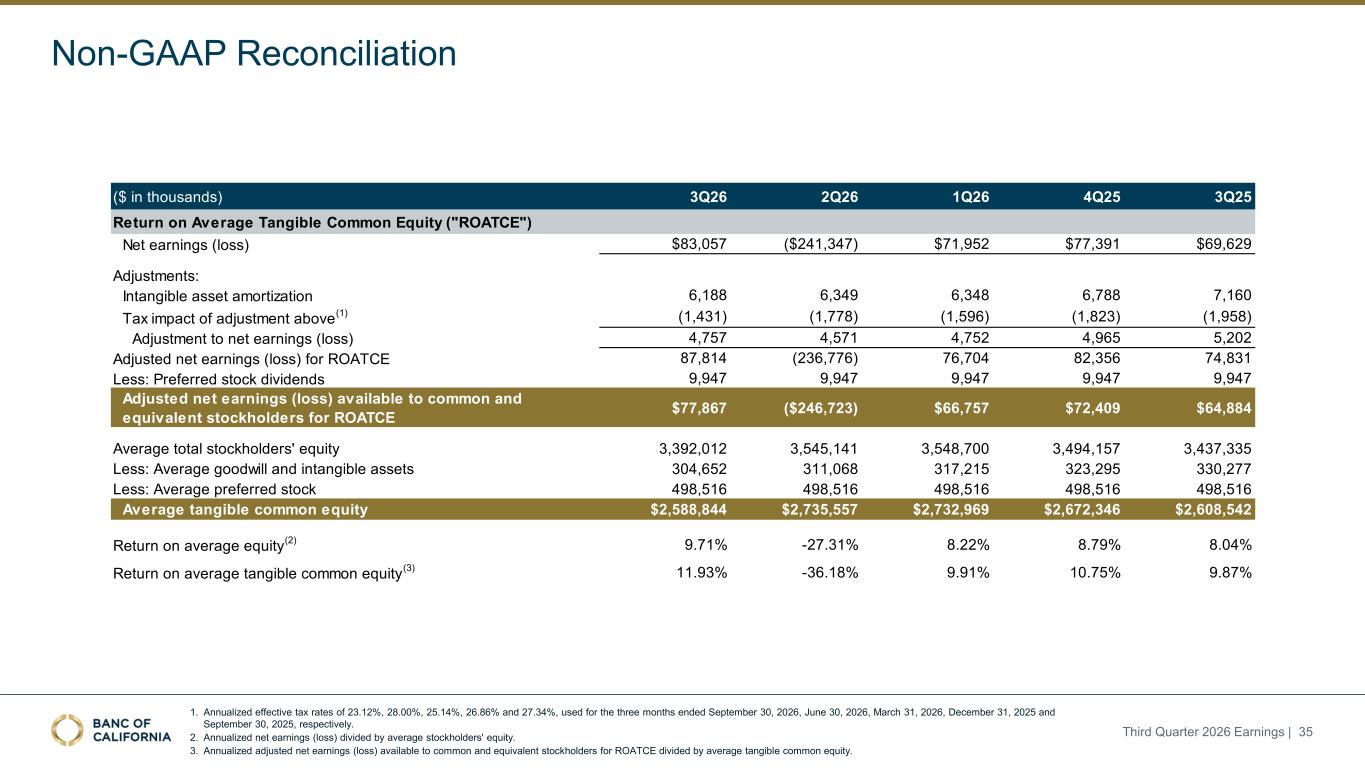
($ in thousands) 3Q26 2Q26 1Q26 4Q25 3Q25 Return on Average Tangible Common Equity ("ROATCE") Net earnings (loss) $83,057 ($241,347) $71,952 $77,391 $69,629 Adjustments: Intangible asset amortization 6,188 6,349 6,348 6,788 7,160 Tax impact of adjustment above (1) (1,431) (1,778) (1,596) (1,823) (1,958) Adjustment to net earnings (loss) 4,757 4,571 4,752 4,965 5,202 Adjusted net earnings (loss) for ROATCE 87,814 (236,776) 76,704 82,356 74,831 Less: Preferred stock dividends 9,947 9,947 9,947 9,947 9,947 Adjusted net earnings (loss) available to common and equivalent stockholders for ROATCE $77,867 ($246,723) $66,757 $72,409 $64,884 Average total stockholders' equity 3,392,012 3,545,141 3,548,700 3,494,157 3,437,335 Less: Average goodwill and intangible assets 304,652 311,068 317,215 323,295 330,277 Less: Average preferred stock 498,516 498,516 498,516 498,516 498,516 Average tangible common equity $2,588,844 $2,735,557 $2,732,969 $2,672,346 $2,608,542 Return on average equity (2) 9.71% -27.31% 8.22% 8.79% 8.04% Return on average tangible common equity (3) 11.93% -36.18% 9.91% 10.75% 9.87% 1. Annualized effective tax rates of 23.12%, 28.00%, 25.14%, 26.86% and 27.34%, used for the three months ended September 30, 2026, June 30, 2026, March 31, 2026, December 31, 2025 and September 30, 2025, respectively. 2. Annualized net earnings (loss) divided by average stockholders' equity. 3. Annualized adjusted net earnings (loss) available to common and equivalent stockholders for ROATCE divided by average tangible common equity. Non-GAAP Reconciliation Third Quarter 2026 Earnings | 35
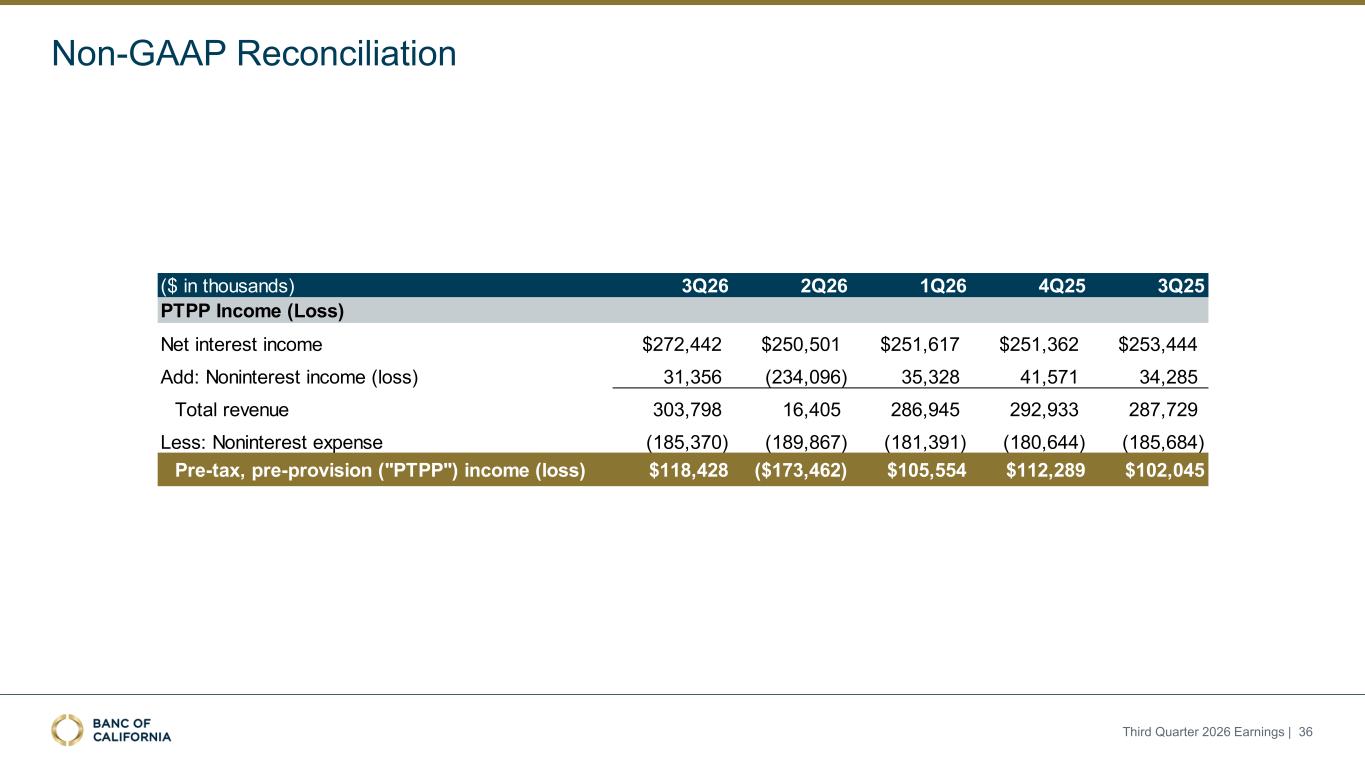
Non-GAAP Reconciliation Third Quarter 2026 Earnings | 36 ($ in thousands) 3Q26 2Q26 1Q26 4Q25 3Q25 PTPP Income (Loss) Net interest income $272,442 $250,501 $251,617 $251,362 $253,444 Add: Noninterest income (loss) 31,356 (234,096) 35,328 41,571 34,285 Total revenue 303,798 16,405 286,945 292,933 287,729 Less: Noninterest expense (185,370) (189,867) (181,391) (180,644) (185,684) Pre-tax, pre-provision ("PTPP") income (loss) $118,428 ($173,462) $105,554 $112,289 $102,045
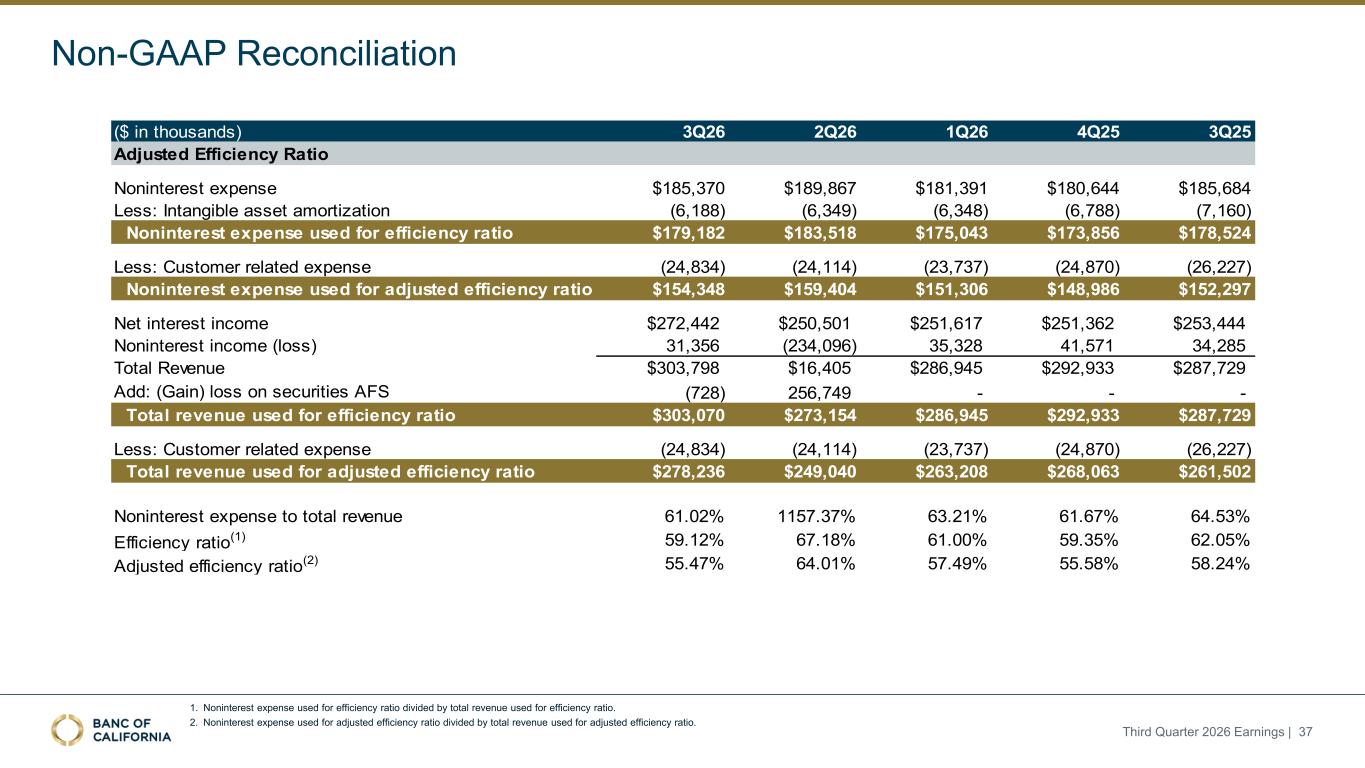
($ in thousands) 3Q26 2Q26 1Q26 4Q25 3Q25 Adjusted Efficiency Ratio Noninterest expense $185,370 $189,867 $181,391 $180,644 $185,684 Less: Intangible asset amortization (6,188) (6,349) (6,348) (6,788) (7,160) Noninterest expense used for efficiency ratio $179,182 $183,518 $175,043 $173,856 $178,524 Less: Customer related expense (24,834) (24,114) (23,737) (24,870) (26,227) Noninterest expense used for adjusted efficiency ratio $154,348 $159,404 $151,306 $148,986 $152,297 Net interest income $272,442 $250,501 $251,617 $251,362 $253,444 Noninterest income (loss) 31,356 (234,096) 35,328 41,571 34,285 Total Revenue $303,798 $16,405 $286,945 $292,933 $287,729 Add: (Gain) loss on securities AFS (728) 256,749 - - - Total revenue used for efficiency ratio $303,070 $273,154 $286,945 $292,933 $287,729 Less: Customer related expense (24,834) (24,114) (23,737) (24,870) (26,227) Total revenue used for adjusted efficiency ratio $278,236 $249,040 $263,208 $268,063 $261,502 Noninterest expense to total revenue 61.02% 1157.37% 63.21% 61.67% 64.53% Efficiency ratio(1) 59.12% 67.18% 61.00% 59.35% 62.05% Adjusted efficiency ratio(2) 55.47% 64.01% 57.49% 55.58% 58.24% 1. Noninterest expense used for efficiency ratio divided by total revenue used for efficiency ratio. 2. Noninterest expense used for adjusted efficiency ratio divided by total revenue used for adjusted efficiency ratio. Non-GAAP Reconciliation Third Quarter 2026 Earnings | 37
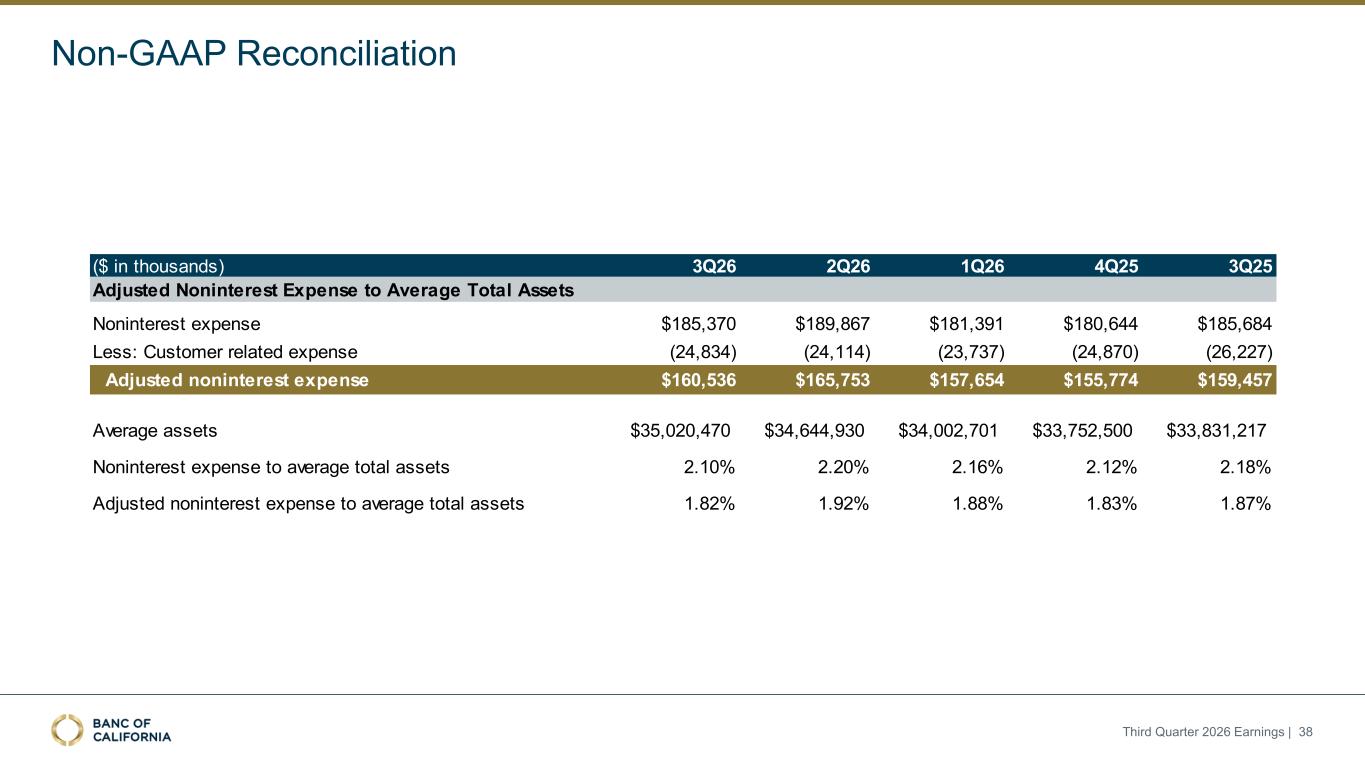
($ in thousands) 3Q26 2Q26 1Q26 4Q25 3Q25 Noninterest expense $185,370 $189,867 $181,391 $180,644 $185,684 Less: Customer related expense (24,834) (24,114) (23,737) (24,870) (26,227) Adjusted noninterest expense $160,536 $165,753 $157,654 $155,774 $159,457 Average assets $35,020,470 $34,644,930 $34,002,701 $33,752,500 $33,831,217 Noninterest expense to average total assets 2.10% 2.20% 2.16% 2.12% 2.18% Adjusted noninterest expense to average total assets 1.82% 1.92% 1.88% 1.83% 1.87% Adjusted Noninterest Expense to Average Total Assets Non-GAAP Reconciliation Third Quarter 2026 Earnings | 38
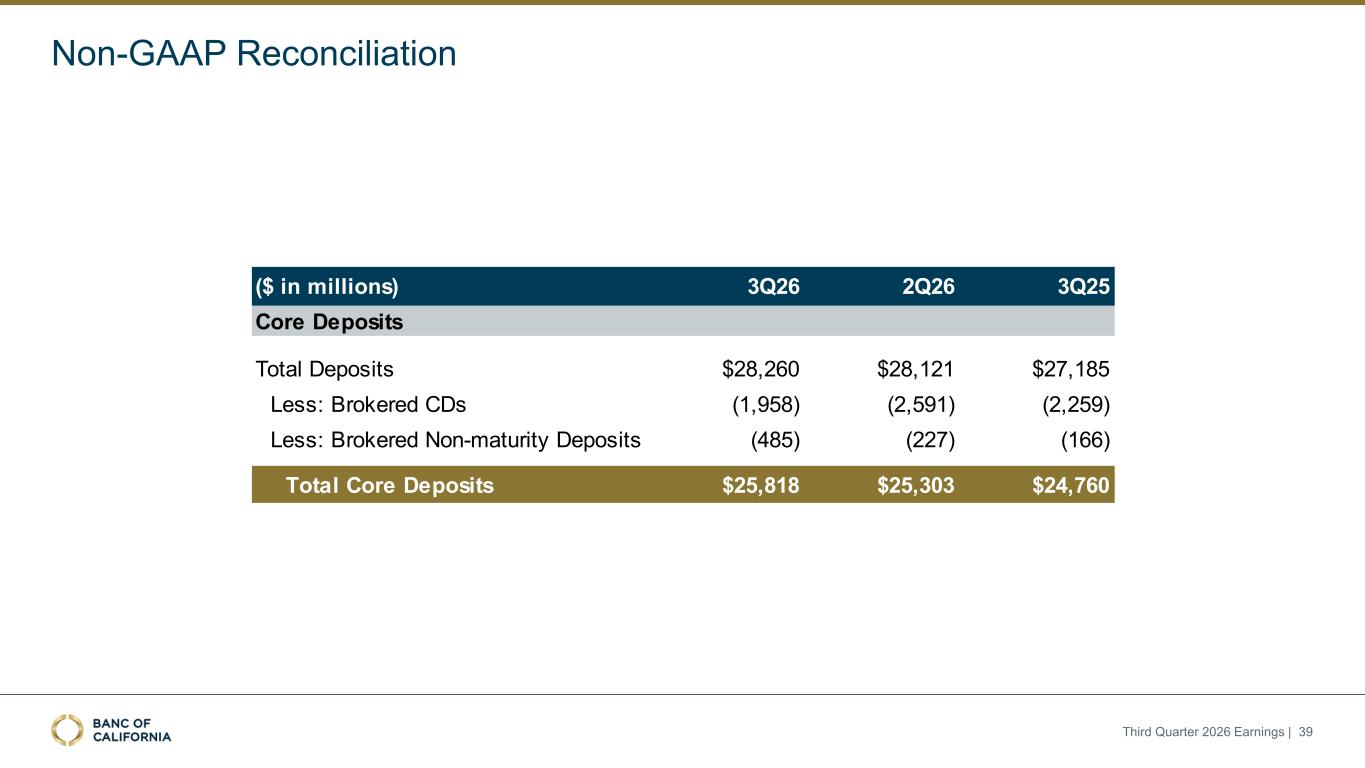
($ in millions) 3Q26 2Q26 3Q25 Total Deposits $28,260 $28,121 $27,185 Less: Brokered CDs (1,958) (2,591) (2,259) Less: Brokered Non-maturity Deposits (485) (227) (166) Total Core Deposits $25,818 $25,303 $24,760 Core Deposits Non-GAAP Reconciliation Third Quarter 2026 Earnings | 39
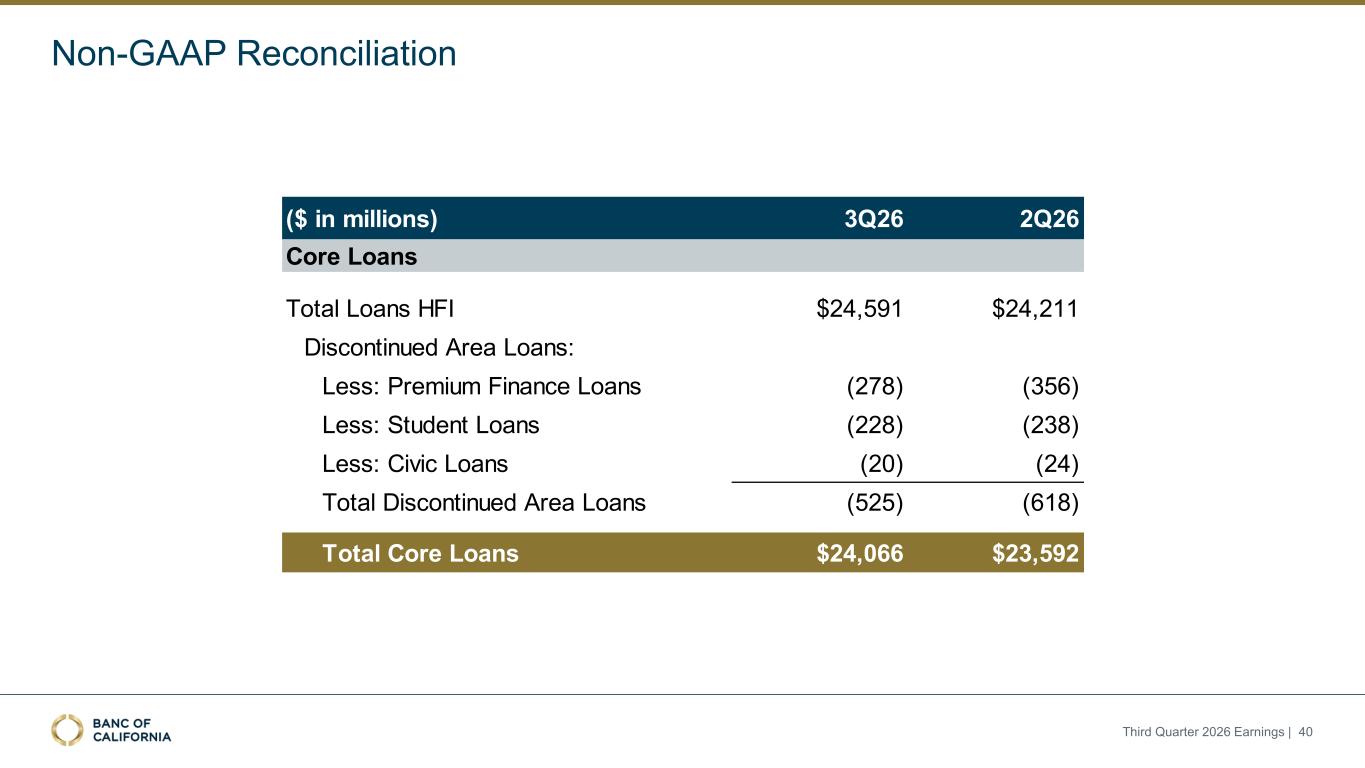
Non-GAAP Reconciliation ($ in millions) 3Q26 2Q26 Total Loans HFI $24,591 $24,211 Discontinued Area Loans: Less: Premium Finance Loans (278) (356) Less: Student Loans (228) (238) Less: Civic Loans (20) (24) Total Discontinued Area Loans (525) (618) Total Core Loans $24,066 $23,592 Core Loans Third Quarter 2026 Earnings | 40
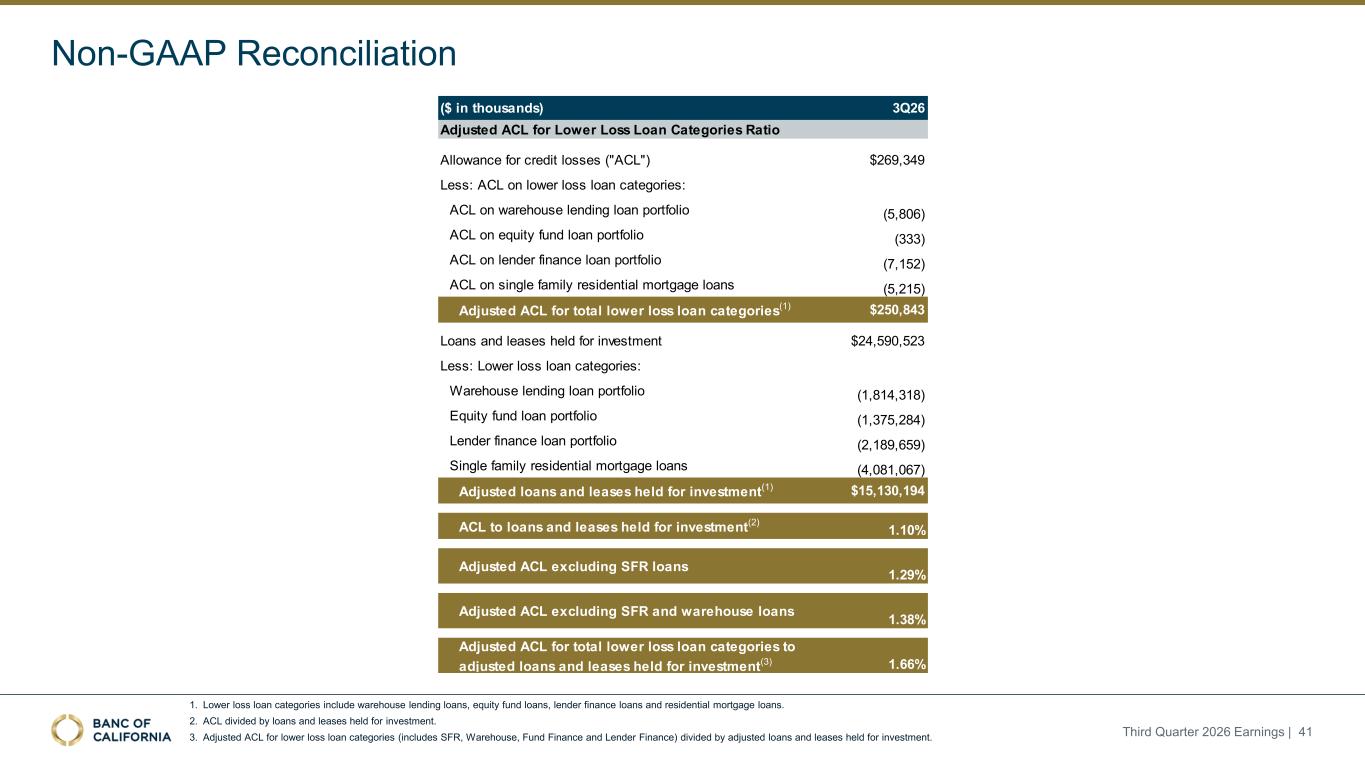
Non-GAAP Reconciliation 1. Lower loss loan categories include warehouse lending loans, equity fund loans, lender finance loans and residential mortgage loans. 2. ACL divided by loans and leases held for investment. 3. Adjusted ACL for lower loss loan categories (includes SFR, Warehouse, Fund Finance and Lender Finance) divided by adjusted loans and leases held for investment. Third Quarter 2026 Earnings | 41 ($ in thousands) 3Q26 Allowance for credit losses ("ACL") $269,349 Less: ACL on lower loss loan categories: ACL on warehouse lending loan portfolio (5,806) ACL on equity fund loan portfolio (333) ACL on lender finance loan portfolio (7,152) ACL on single family residential mortgage loans (5,215) Adjusted ACL for total lower loss loan categories(1) $250,843 Loans and leases held for investment $24,590,523 Less: Lower loss loan categories: Warehouse lending loan portfolio (1,814,318) Equity fund loan portfolio (1,375,284) Lender finance loan portfolio (2,189,659) Single family residential mortgage loans (4,081,067) Adjusted loans and leases held for investment(1) $15,130,194 ACL to loans and leases held for investment(2) 1.10% Adjusted ACL excluding SFR loans 1.29% Adjusted ACL excluding SFR and warehouse loans 1.38% Adjusted ACL for total lower loss loan categories to adjusted loans and leases held for investment(3) 1.66% Adjusted ACL for Lower Loss Loan Categories Ratio