|
|

|
|

|
|

|
|
|
|
|
|
|
|
|
|
|
|
|
|
•••• |
|
|
|
|
|
|

|
|
|
|
➜➜➜ |
|
|
|
|
|
|
|
|
|
|

|
|
|
|
|
|
|
|
|
|
|
|

|
|
•••• |
|
|
|
|
|
|
|
|
➜➜➜ |
|
|
➜➜➜➜ |
|
|
|
|
|
|
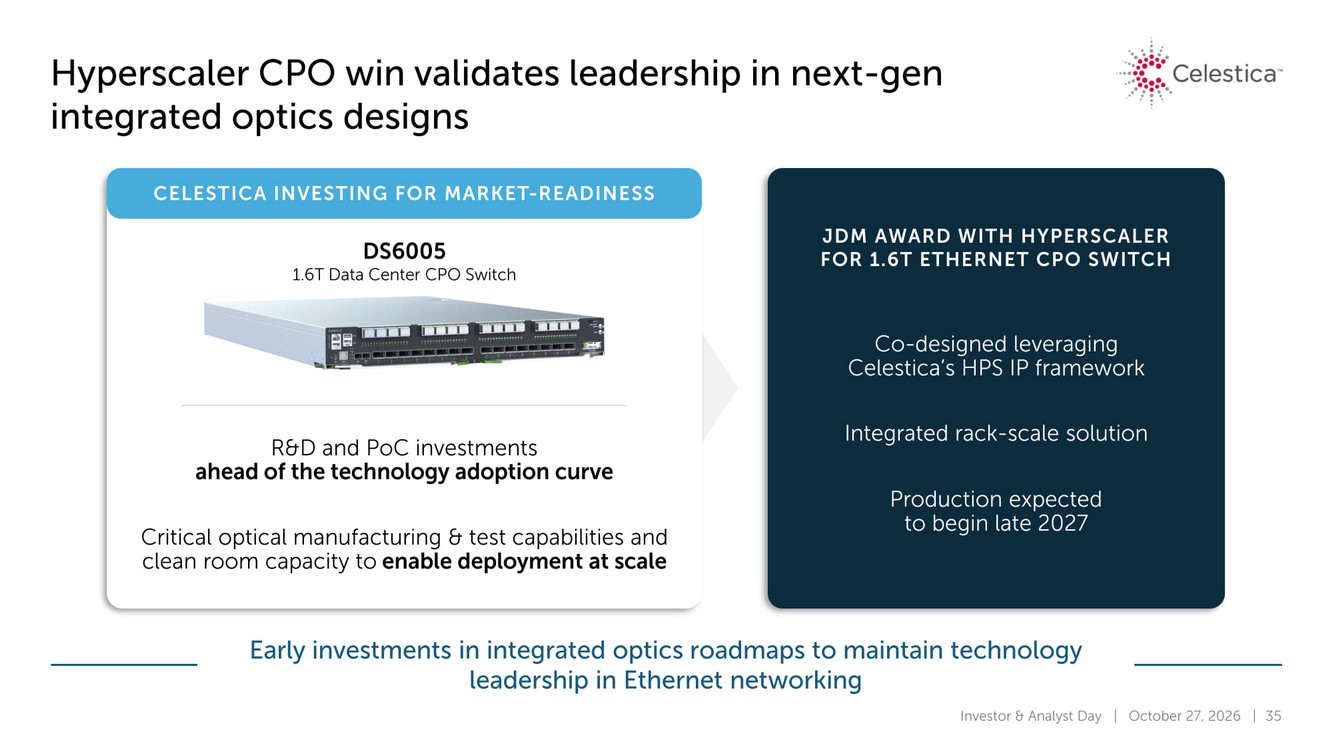
|
|
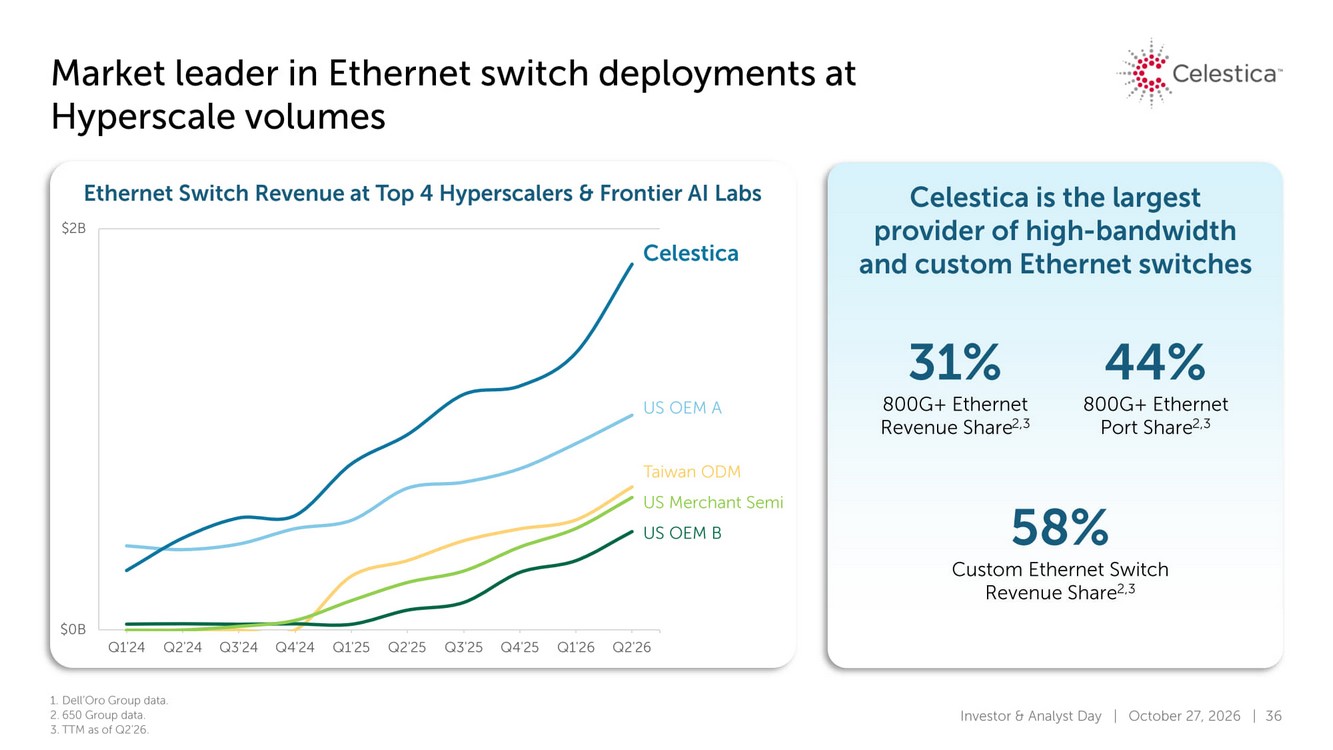
|
|

|
|
•• |
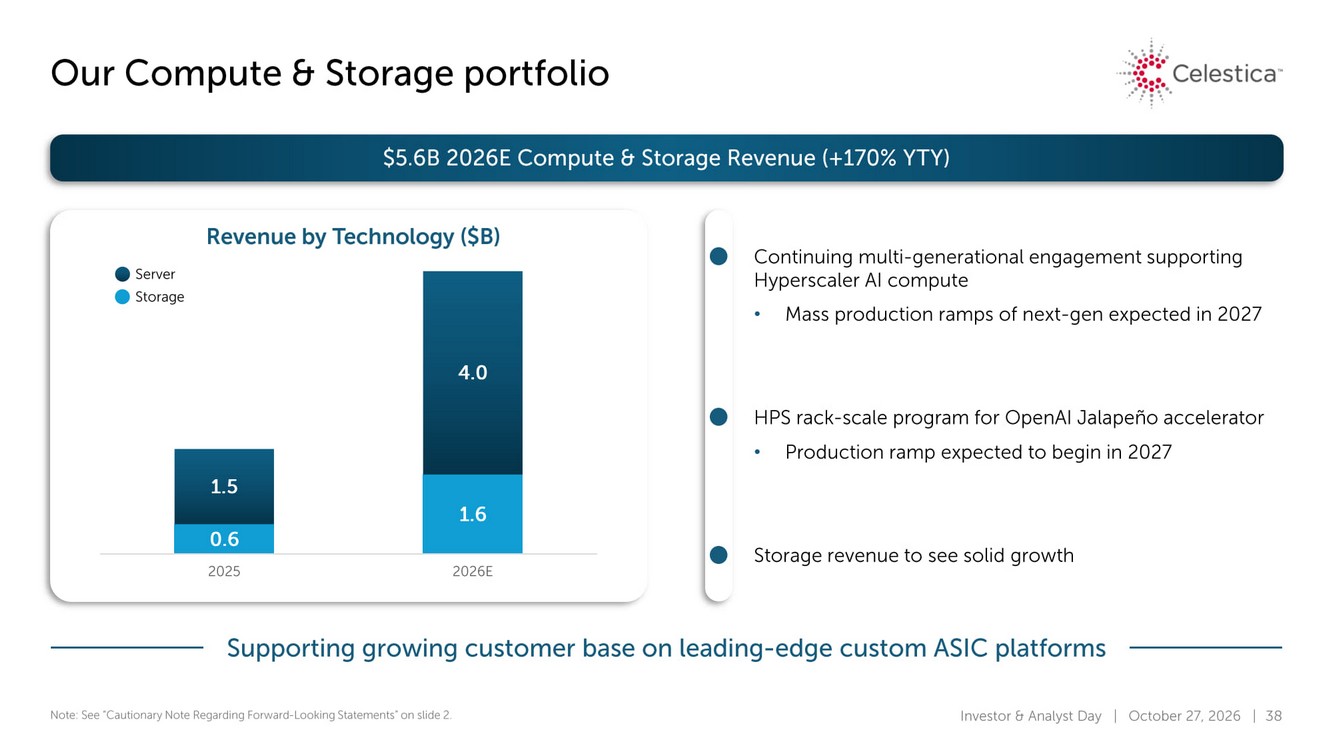
|
|
➜ • • • • ➜ • |
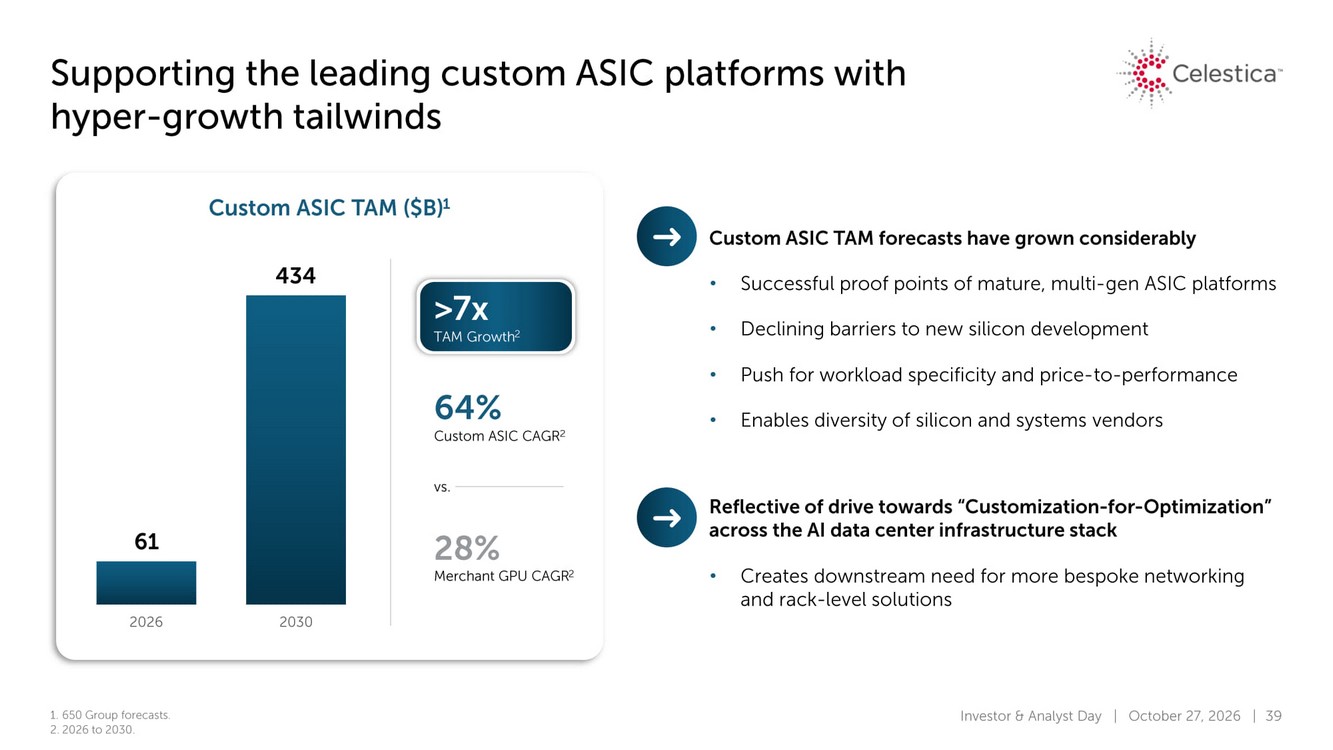
|
|
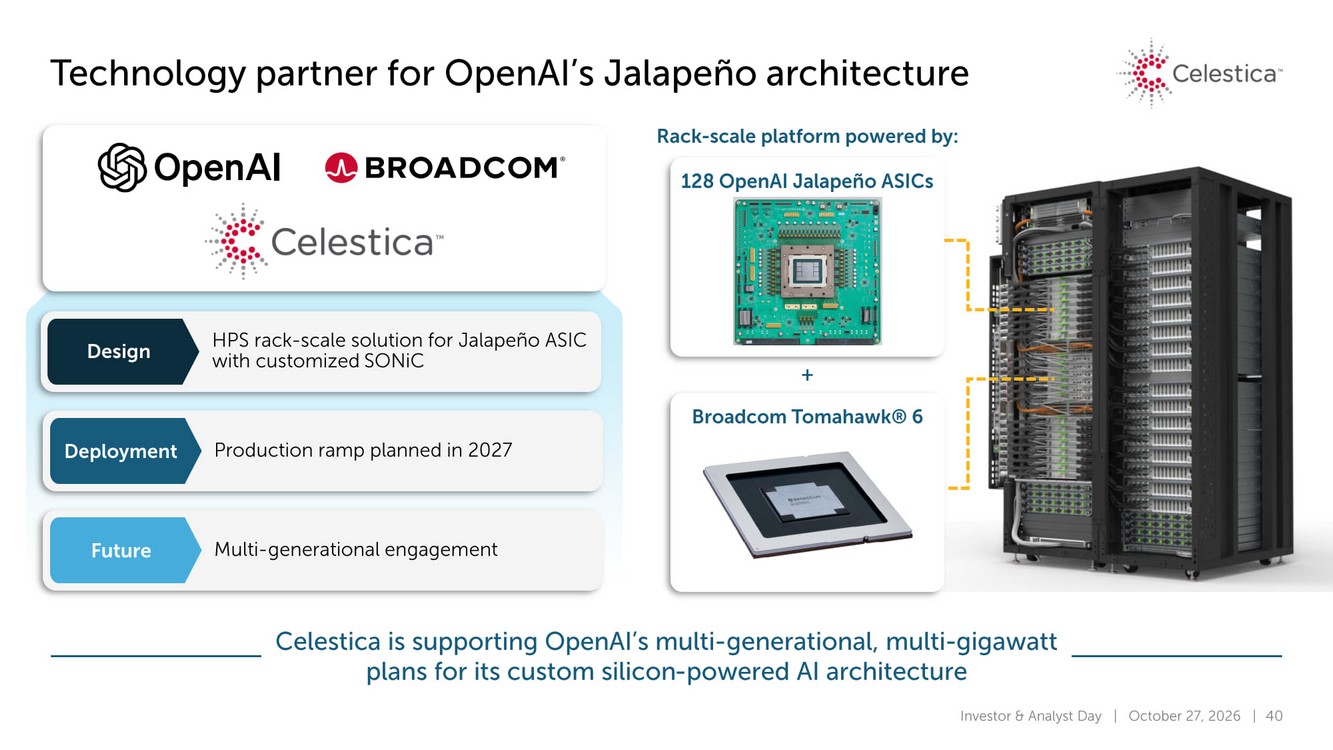
|
|

|
|
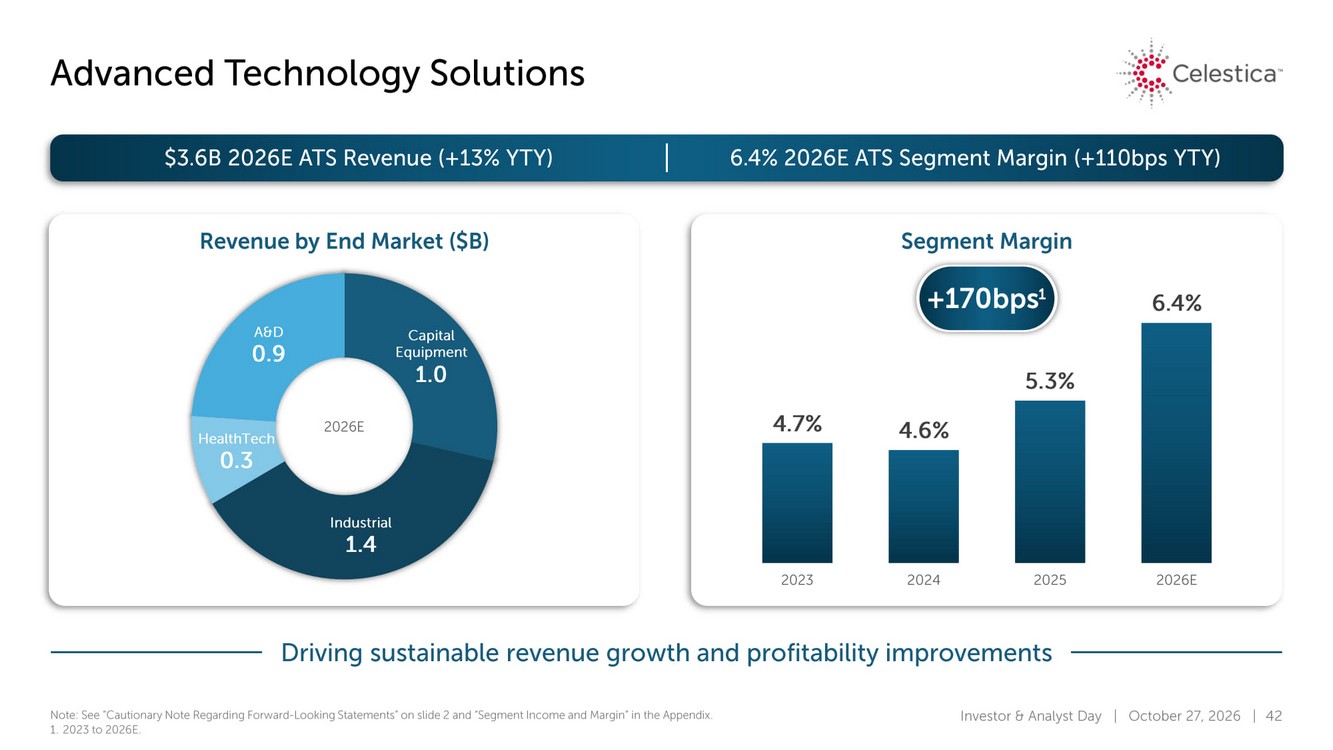
|
|
✓✓ ✓✓ ✓✓ ✓✓ |
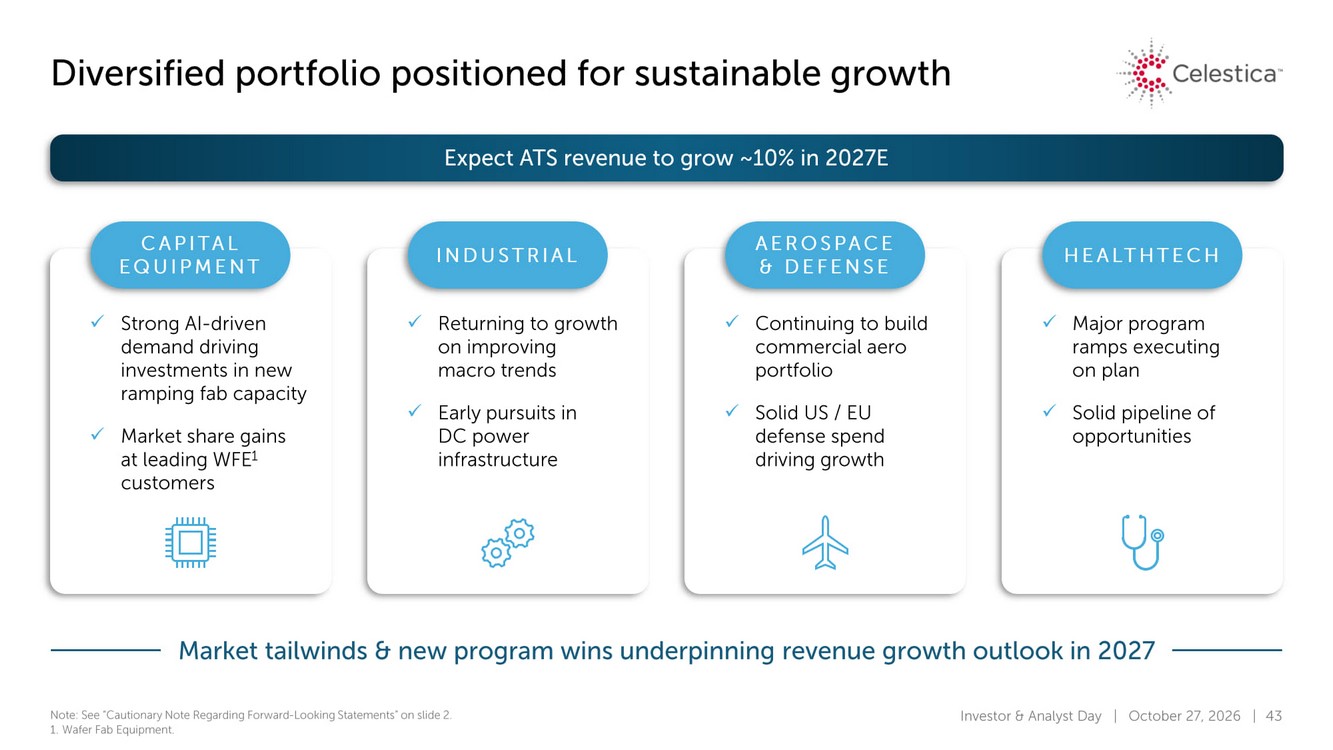
|
|
•••••• |
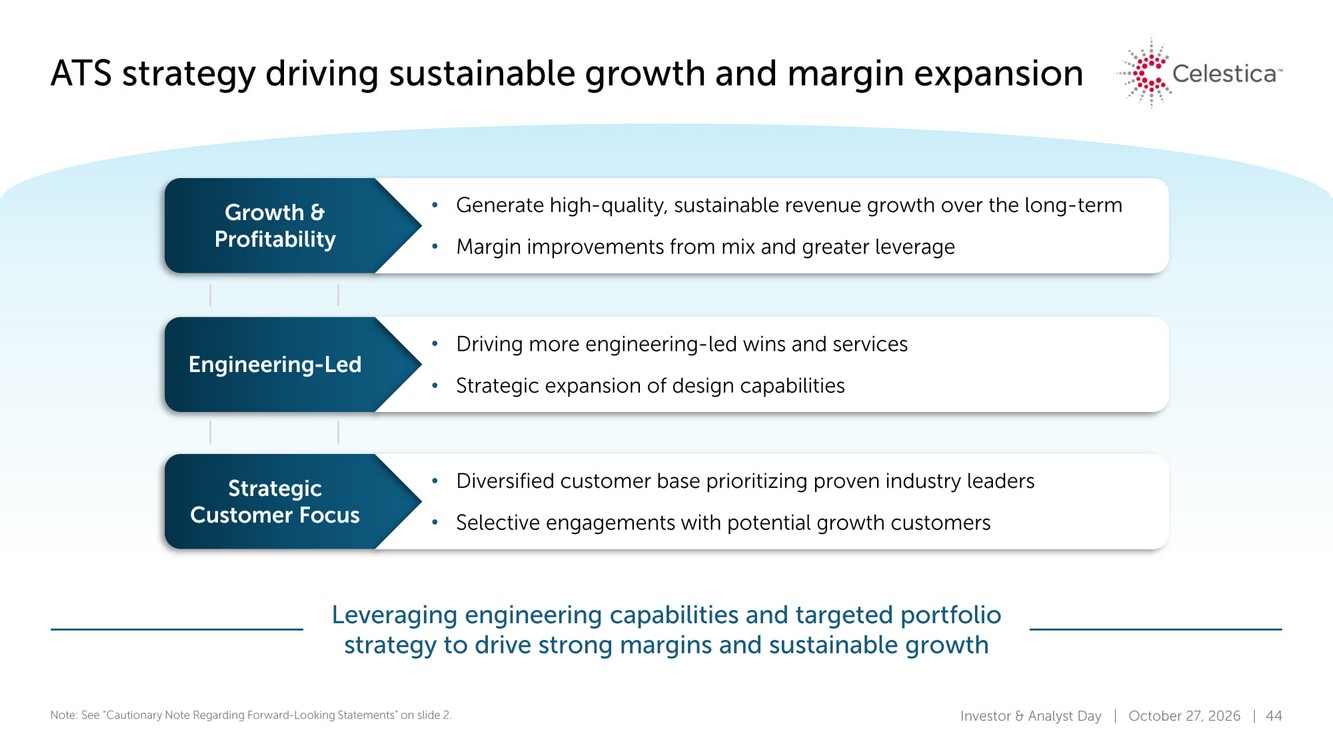
|
|

|
|
••• |
|
|
|
|
|
|
|
|
➜➜➜ |
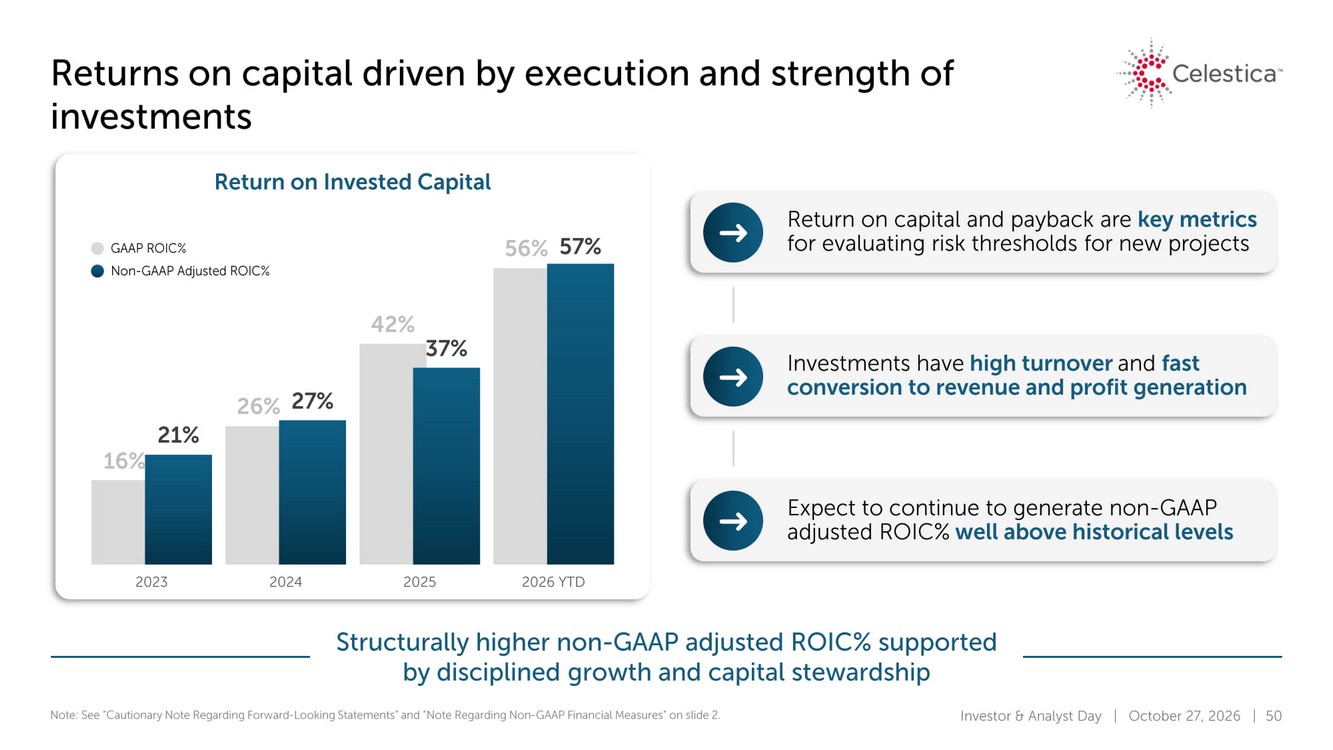
|
|
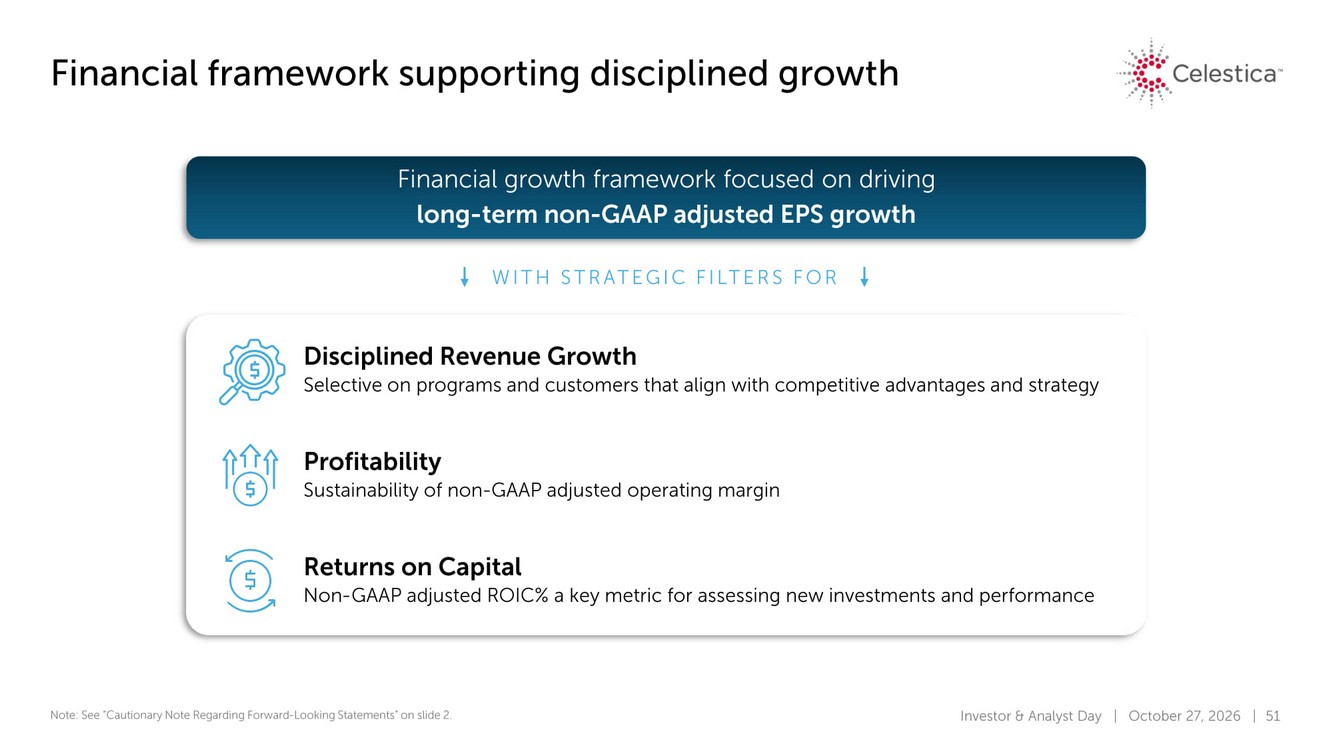
|
|
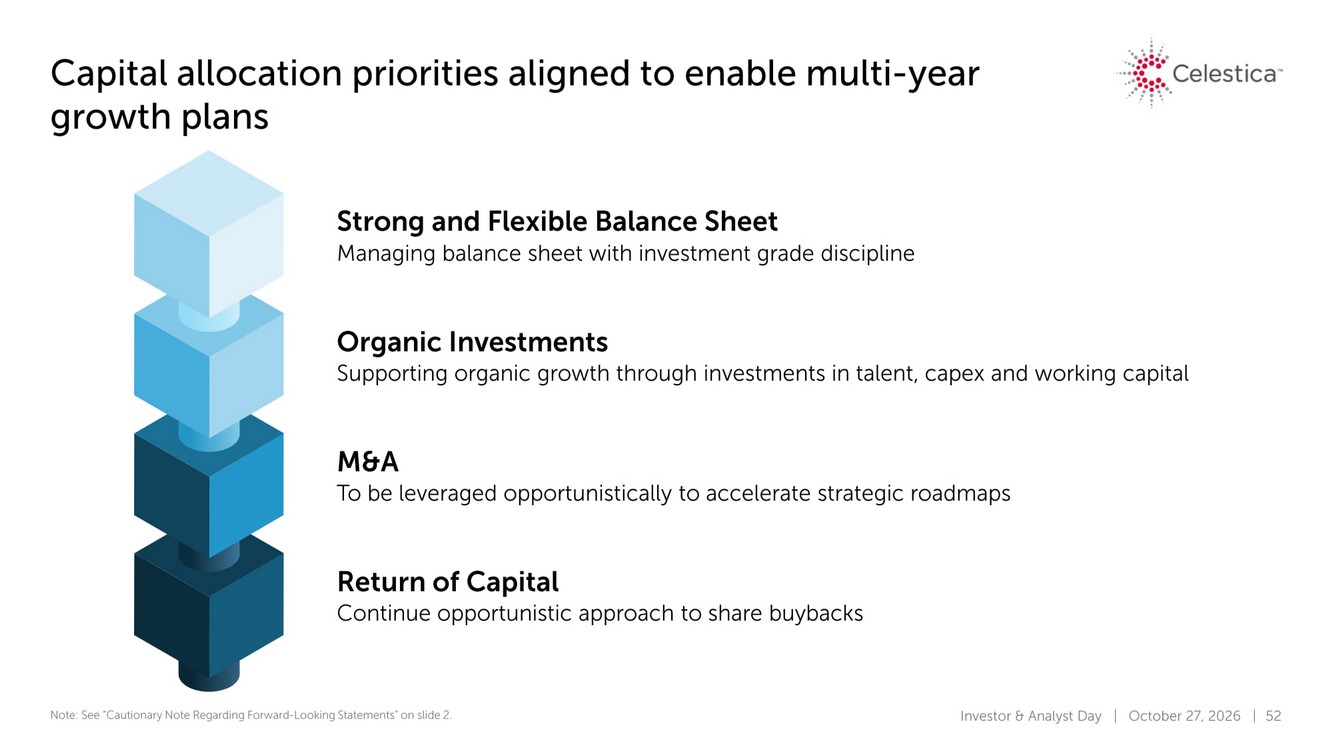
|
|

|
|
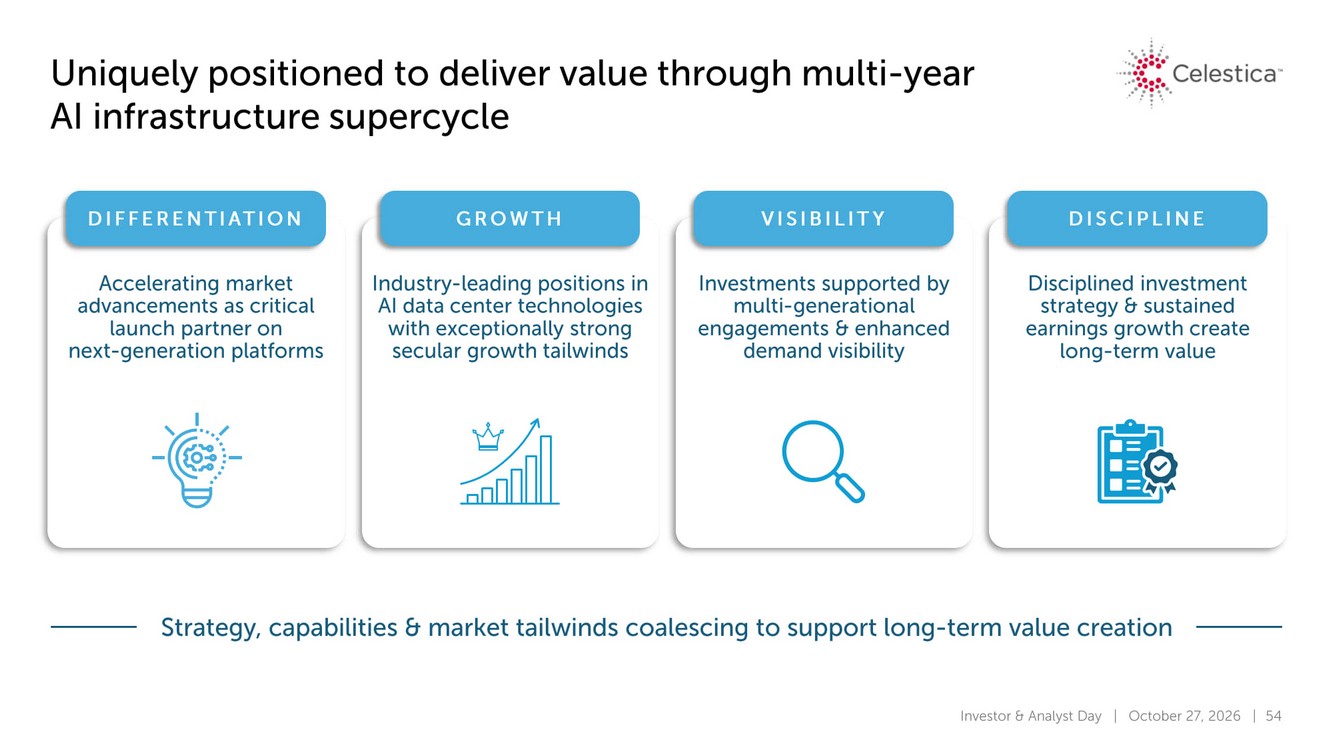
|
|

|
|

|
|

|
|

|
|
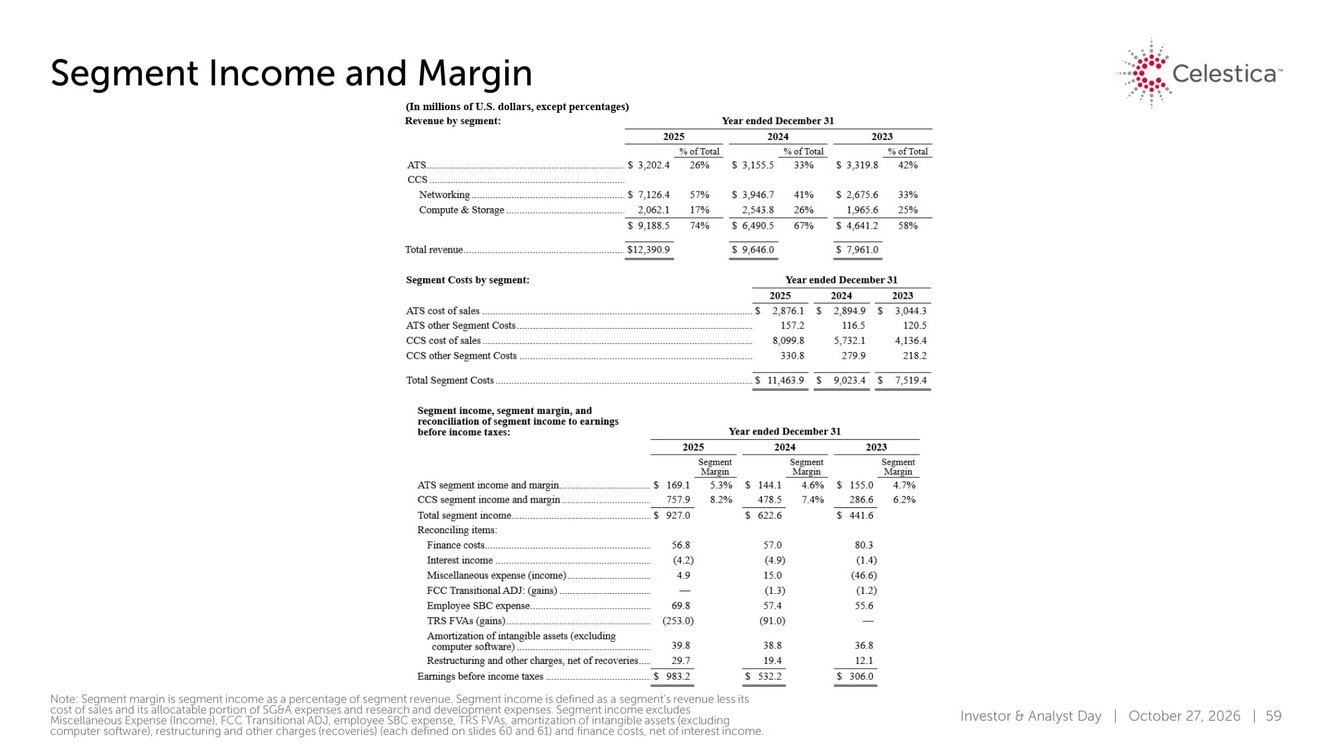
(In millions of U.S. dollars, except percentages) |
|
|
|
|
|
|
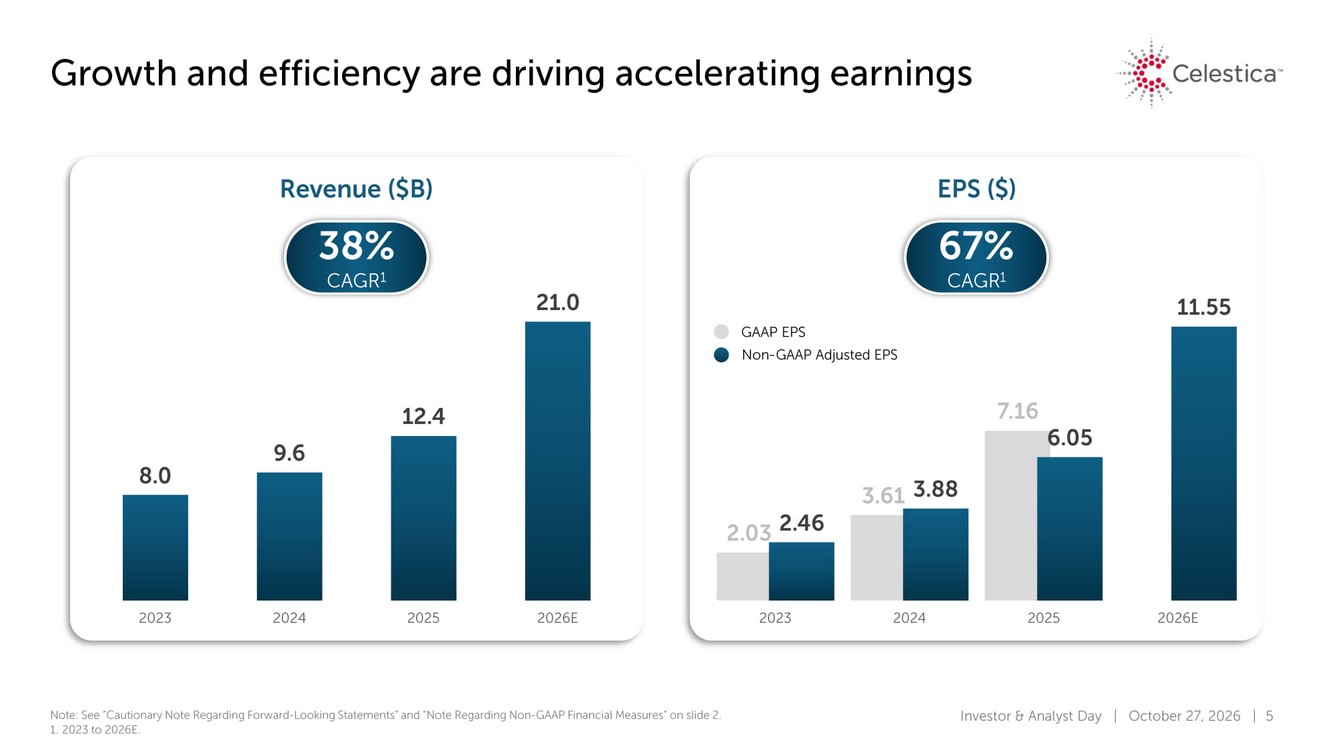
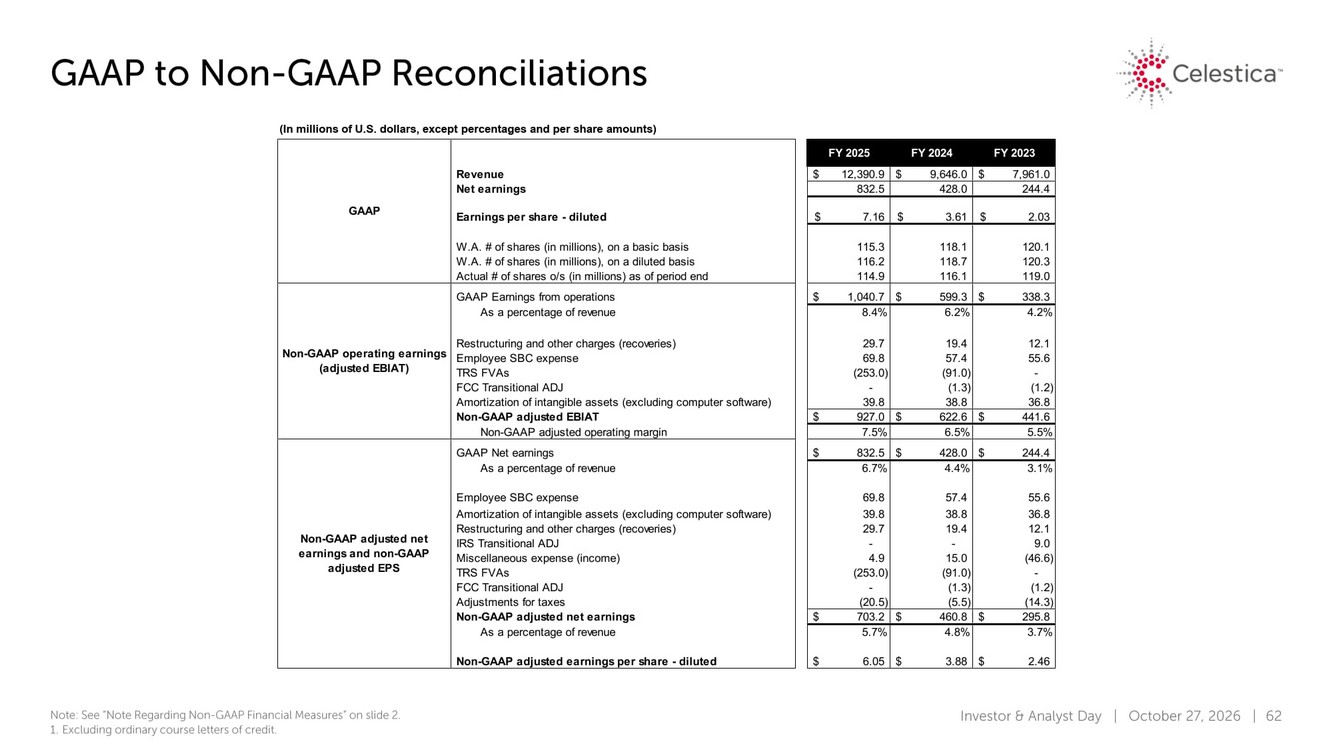
FY 2025 FY 2024 FY 2023 Revenue $ 12,390.9 $ 9,646.0 $ 7,961.0 Net earnings 832.5 428.0 244.4 Earnings per share - diluted $ 7.16 $ 3.61 $ 2.03 W.A. # of shares (in millions), on a basic basis 115.3 118.1 120.1 W.A. # of shares (in millions), on a diluted basis 116.2 118.7 120.3 Actual # of shares o/s (in millions) as of period end 114.9 116.1 119.0 GAAP Earnings from operations $ 1,040.7 $ 599.3 $ 338.3 A s a perc ent age of revenue 8.4% 6.2% 4.2% Restructuring and other charges (recoveries) 29.7 19.4 12.1 Employee SBC expense 69.8 57.4 55.6 TRS FVAs (253.0) (91.0) - FCC Transitional ADJ - (1.3) (1.2) Amortization of intangible assets (excluding computer software) 39.8 38.8 36.8 Non-GAAP adjusted EBIAT $ 927.0 $ 622.6 $ 441.6 Non-GAAP adjusted operating margin 7.5% 6.5% 5.5% GAAP Net earnings $ 832.5 $ 428.0 $ 244.4 A s a perc ent age of revenue 6.7% 4.4% 3.1% Employee SBC expense 69.8 57.4 55.6 Amortization of intangible assets (excluding computer software) 39.8 38.8 36.8 Restructuring and other charges (recoveries) 29.7 19.4 12.1 IRS Transitional ADJ - - 9.0 Miscellaneous expense (income) 4.9 15.0 (46.6) TRS FVAs (253.0) (91.0) - FCC Transitional ADJ - (1.3) (1.2) Adjustments for taxes (20.5) (5.5) (14.3) Non-GAAP adjusted net earnings $ 703.2 $ 460.8 $ 295.8 A s a perc ent age of revenue 5.7% 4.8% 3.7% Non-GAAP adjusted earnings per share - diluted $ 6.05 $ 3.88 $ 2.46 GAAP Non-GAAP operating earnings (adjusted EBIAT) Non-GAAP adjusted net earnings and non-GAAP adjusted EPS (In millions of U.S. dollars, except percentages and per share amounts) |
|
|
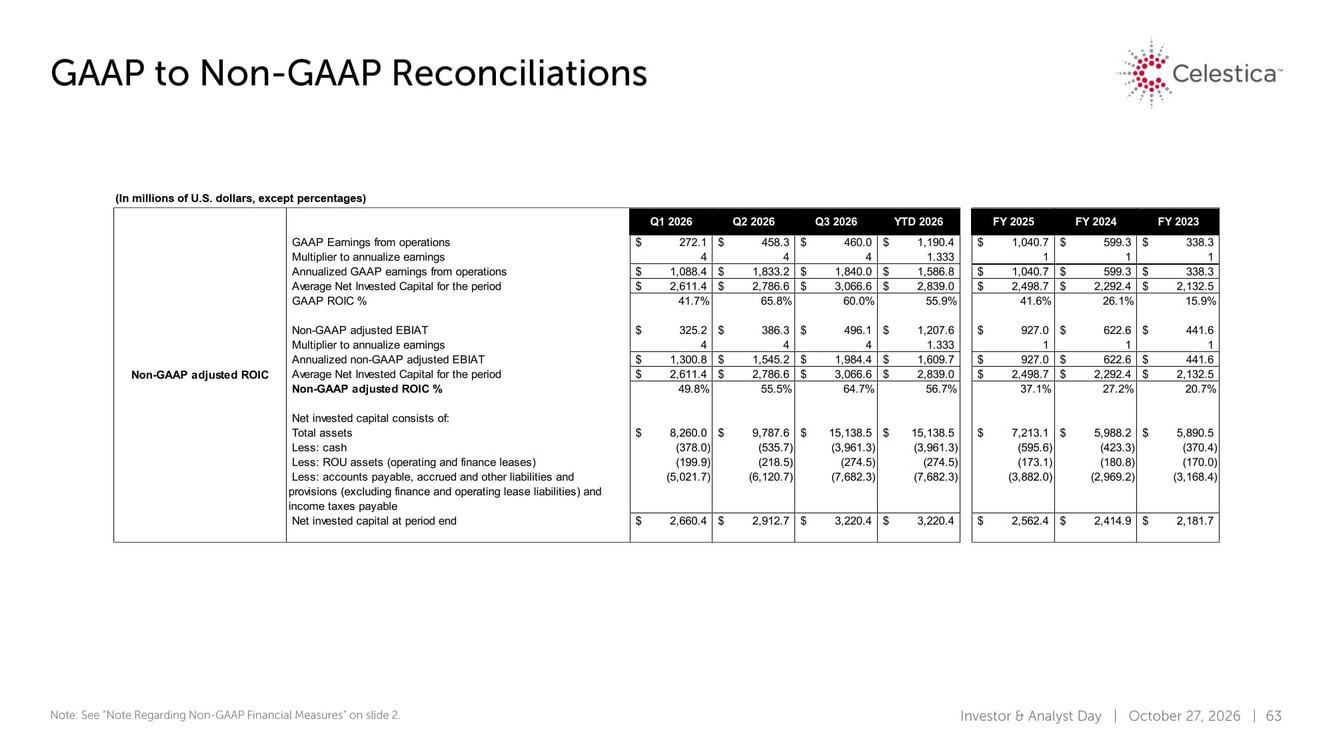
Q1 2026 Q2 2026 Q3 2026 YTD 2026 FY 2025 FY 2024 FY 2023 GAAP Earnings from operations $ 272.1 $ 458.3 $ 460.0 $ 1,190.4 $ 1,040.7 $ 599.3 $ 338.3 Multiplier to annualize earnings 4 4 4 1.333 1 1 1 Annualized GAAP earnings from operations $ 1,088.4 $ 1,833.2 $ 1,840.0 $ 1,586.8 $ 1,040.7 $ 599.3 $ 338.3 Average Net Invested Capital for the period $ 2,611.4 $ 2,786.6 $ 3,066.6 $ 2,839.0 $ 2,498.7 $ 2,292.4 $ 2,132.5 GAAP ROIC % 41.7% 65.8% 60.0% 55.9% 41.6% 26.1% 15.9% Non-GAAP adjusted EBIAT $ 325.2 $ 386.3 $ 496.1 $ 1,207.6 $ 927.0 $ 622.6 $ 441.6 Multiplier to annualize earnings 4 4 4 1.333 1 1 1 Annualized non-GAAP adjusted EBIAT $ 1,300.8 $ 1,545.2 $ 1,984.4 $ 1,609.7 $ 927.0 $ 622.6 $ 441.6 Average Net Invested Capital for the period $ 2,611.4 $ 2,786.6 $ 3,066.6 $ 2,839.0 $ 2,498.7 $ 2,292.4 $ 2,132.5 Non-GAAP adjusted ROIC % 49.8% 55.5% 64.7% 56.7% 37.1% 27.2% 20.7% Net invested capital consists of: Total assets $ 8,260.0 $ 9,787.6 $ 15,138.5 $ 15,138.5 $ 7,213.1 $ 5,988.2 $ 5,890.5 Less: cash (378.0) (535.7) (3,961.3) (3,961.3) (595.6) (423.3) (370.4) Less: ROU assets (operating and finance leases) (199.9) (218.5) (274.5) (274.5) (173.1) (180.8) (170.0) (5,021.7) (6,120.7) (7,682.3) (7,682.3) (3,882.0) (2,969.2) (3,168.4) Net invested capital at period end $ 2,660.4 $ 2,912.7 $ 3,220.4 $ 3,220.4 $ 2,562.4 $ 2,414.9 $ 2,181.7 Non-GAAP adjusted ROIC Less: accounts payable, accrued and other liabilities and provisions (excluding finance and operating lease liabilities) and income taxes payable (In millions of U.S. dollars, except percentages) |
|
|
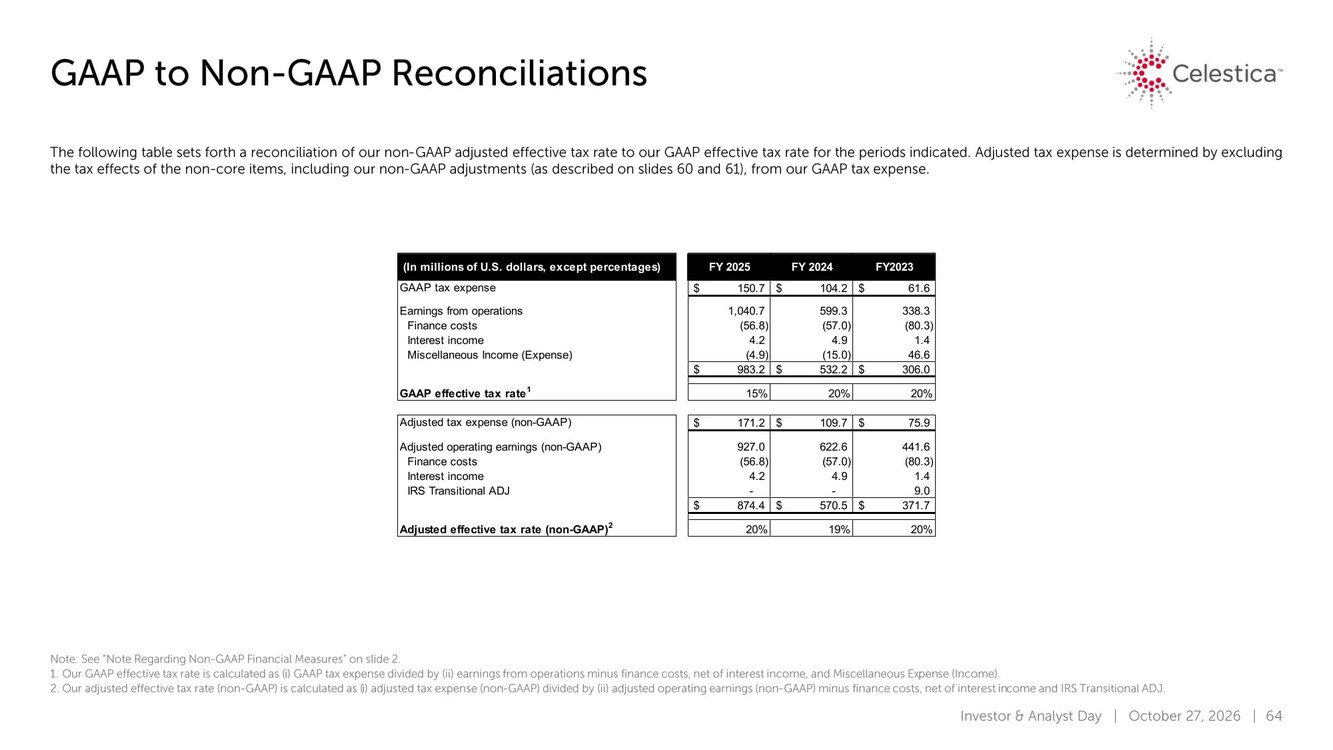
(In millions of U.S. dollars, except percentages) FY 2025 FY 2024 FY2023 GAAP tax expense $ 150.7 $ 104.2 $ 61.6 Earnings from operations 1,040.7 599.3 338.3 Finance costs (56.8) (57.0) (80.3) Interest income 4.2 4.9 1.4 Miscellaneous Income (Expense) (4.9) (15.0) 46.6 $ 983.2 $ 532.2 $ 306.0 GAAP effective tax rate1 15% 20% 20% Adjusted tax expense (non-GAAP) $ 171.2 $ 109.7 $ 75.9 Adjusted operating earnings (non-GAAP) 927.0 622.6 441.6 Finance costs (56.8) (57.0) (80.3) Interest income 4.2 4.9 1.4 IRS Transitional ADJ - - 9.0 $ 874.4 $ 570.5 $ 371.7 Adjusted effective tax rate (non-GAAP)2 20% 19% 20% |
|
|