Q3 2026 PRELIMINARY EARNINGS SUPPLEMENT October 2026
BWIN | NASDAQ | Earnings Supplement 2 The financial results for the third quarter ended September 30, 2026 included in this supplement are preliminary, have not been reviewed or audited, are based on Baldwin's estimates, and were prepared prior to the completion of the Company's financial statement close process. Accordingly, there can be no assurance that actual results will not differ from the preliminary financial information presented herein, and any such differences could be material. Our actual results for the third quarter ended September 30, 2026 will be subsequently released and also filed in connection with the Company's Form 10-Q for the quarter ended September 30, 2026 within the requisite time prescribed by the Securities and Exchange Commission. Disclaimer
BWIN | NASDAQ | Earnings Supplement 3 This presentation includes certain financial measures (including, retained commissions and fees, organic revenue, organic revenue growth, adjusted EBITDA, adjusted EBITDA margin, adjusted EBITDA margin on retained commissions and fees, adjusted net income, adjusted diluted EPS, pro forma credit adjusted EBITDA, adjusted free cash flow and adjusted free cash flow conversion) that are calculated and presented on the basis of methodologies other than in accordance with generally accepted accounting principles in the United States of America (“non-GAAP”). These non-GAAP financial measures should be considered only as supplemental to, and not as superior to, financial measures prepared in accordance with generally accepted accounting principles in the United States of America (“GAAP”). These non-GAAP financial measures have limitations as analytical tools, and when assessing our operating performance, you should not consider these non-GAAP financial measures in isolation or as substitutes for commissions and fees, revenues, net income (loss), net income (loss) attributable to Baldwin, diluted earnings (loss) per share, net cash provided by (used in) operating activities or other consolidated income statement data prepared in accordance with GAAP. Other companies in our industry may define or calculate these non-GAAP financial measures differently than we do, and accordingly, these measures may not be comparable to similarly titled measures used by other companies. The pro forma information presented herein (i) assumes our 2025 and 2026 partnerships were consummated on January 1, 2025, such that our 2025 financial pro forma figures take into account adjusted EBITDA from our 2025 and 2026 partnerships in the unowned period of 2025, and (ii) removes the effects of 2025 divestitures for the respective periods as if the divestitures had occurred on January 1, 2025. This unaudited pro forma information should not be relied upon as being indicative of the historical results that would have been obtained if the acquisitions had occurred on that date, nor the results that may be obtained in the future. Pro forma credit adjusted EBITDA is adjusted to include the effects of partnerships and credit adjustments. We define pro forma credit adjusted EBITDA as net income (loss) before interest, taxes, depreciation, amortization and certain items of income and expense, including share-based compensation expense, transaction-related partnership and integration expenses, transformation costs, severance, and certain non-recurring items, including capital related expenses, and additional adjustments (without duplication) permitted under our debt agreements, including pro forma credit adjustments for the CAC Group, Obie and Capstone partnerships in the unowned periods. Pro forma credit adjusted EBITDA is a key metric used by management and our board of directors to assess our financial performance. We believe that pro forma credit adjusted EBITDA is useful to investors because the presentation of this measure enhances their understanding of the effect that the CAC Group, Obie and Capstone partnerships and credit adjustments have on our financial performance. Please refer to the organic revenue growth reconciliation, adjusted EBITDA bridge, adjusted compensation and benefits expense, adjusted selling, operating and administrative expense, adjusted EBITDA margin on retained commissions and fees bridge and pro forma consolidated and credit adjusted EBITDA bridge slides in the appendix to this presentation, in addition to our earnings release issued on October 27, 2026 and posted to our website, for reconciliations of the non-GAAP financial measures to the most directly comparable financial measures prepared in accordance with GAAP. Note, however, that the Company is unable to reconcile forward-looking non-GAAP guidance contained in this presentation to the most comparable GAAP measures. Reconciliation of such guidance is not available without unreasonable efforts due to the high variability, complexity, and low visibility with respect to commissions and fees, net income (loss), diluted earnings (loss) per share or other consolidated income statement data prepared in accordance with GAAP for these periods. The unavailable information could have a significant impact on the non-GAAP measures. Non-GAAP Financial Measures
BWIN | NASDAQ | Earnings Supplement 4 Table of Contents 01 Quarterly Results Financial highlights, segment performance, and key metrics 02 Strategic Initiatives Update CAC integration milestones, synergy capture, and transformation program execution 03 Appendix GAAP reconciliations, segment detail, and supplemental data
BWIN | NASDAQ | Earnings Supplement 5 01 Quarterly Results Financial highlights, segment performance, and key metrics
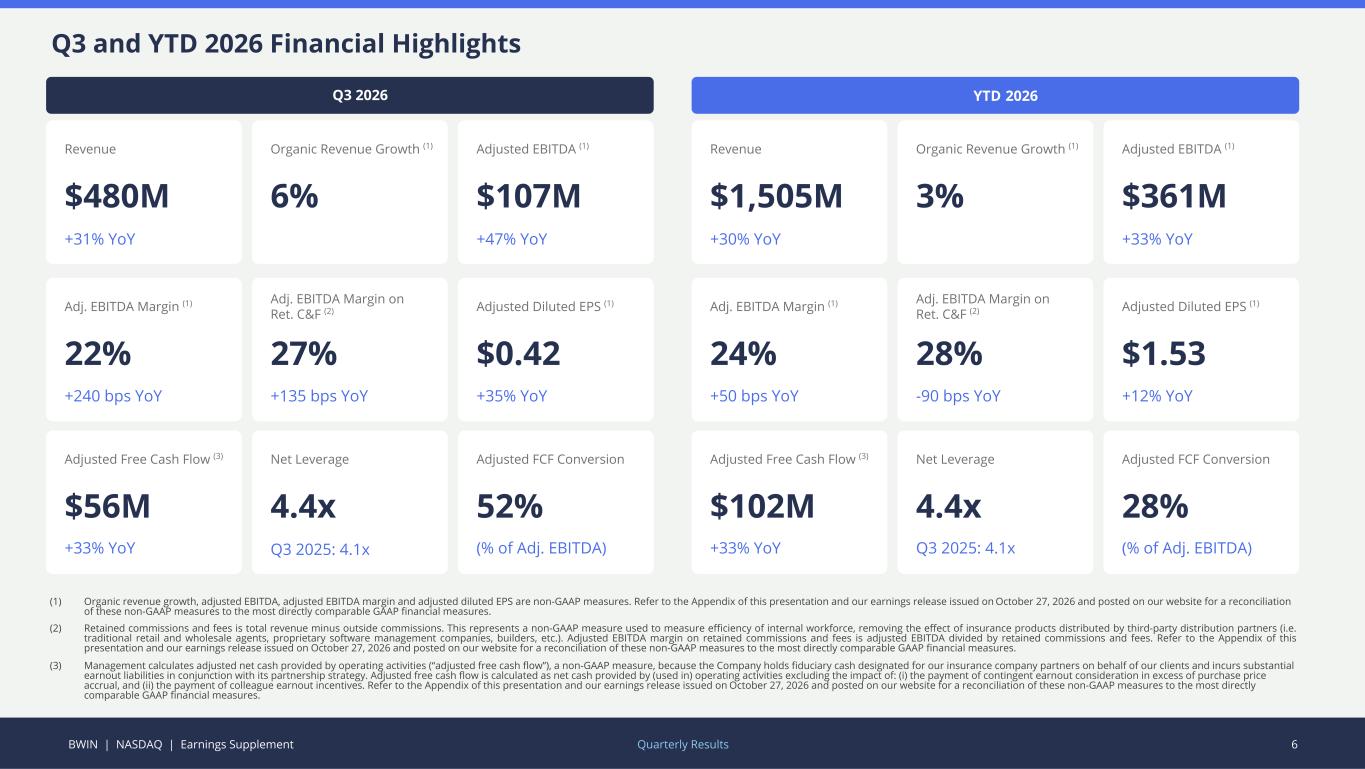
BWIN | NASDAQ | Earnings Supplement 6 Q3 and YTD 2026 Financial Highlights Q3 2026 YTD 2026 Revenue $480M +31% YoY Revenue $1,505M +30% YoY Organic Revenue Growth (1) 6% Organic Revenue Growth (1) 3% Adjusted EBITDA (1) $107M +47% YoY Adjusted EBITDA (1) $361M +33% YoY Adj. EBITDA Margin (1) 22% +240 bps YoY Adj. EBITDA Margin (1) 24% +50 bps YoY Adj. EBITDA Margin on Ret. C&F (2) 27% +135 bps YoY Adj. EBITDA Margin on Ret. C&F (2) 28% -90 bps YoY Adjusted Diluted EPS (1) $0.42 +35% YoY Adjusted Diluted EPS (1) $1.53 +12% YoY Adjusted Free Cash Flow (3) $56M +33% YoY Adjusted Free Cash Flow (3) $102M +33% YoY Net Leverage 4.4x Net Leverage 4.4x Adjusted FCF Conversion 52% (% of Adj. EBITDA) Adjusted FCF Conversion 28% (% of Adj. EBITDA) Quarterly Results (1) Organic revenue growth, adjusted EBITDA, adjusted EBITDA margin and adjusted diluted EPS are non-GAAP measures. Refer to the Appendix of this presentation and our earnings release issued on October 27, 2026 and posted on our website for a reconciliation of these non-GAAP measures to the most directly comparable GAAP financial measures. (2) Retained commissions and fees is total revenue minus outside commissions. This represents a non-GAAP measure used to measure efficiency of internal workforce, removing the effect of insurance products distributed by third-party distribution partners (i.e. traditional retail and wholesale agents, proprietary software management companies, builders, etc.). Adjusted EBITDA margin on retained commissions and fees is adjusted EBITDA divided by retained commissions and fees. Refer to the Appendix of this presentation and our earnings release issued on October 27, 2026 and posted on our website for a reconciliation of these non-GAAP measures to the most directly comparable GAAP financial measures. (3) Management calculates adjusted net cash provided by operating activities (“adjusted free cash flow”), a non-GAAP measure, because the Company holds fiduciary cash designated for our insurance company partners on behalf of our clients and incurs substantial earnout liabilities in conjunction with its partnership strategy. Adjusted free cash flow is calculated as net cash provided by (used in) operating activities excluding the impact of: (i) the payment of contingent earnout consideration in excess of purchase price accrual, and (ii) the payment of colleague earnout incentives. Refer to the Appendix of this presentation and our earnings release issued on October 27, 2026 and posted on our website for a reconciliation of these non-GAAP measures to the most directly comparable GAAP financial measures. Q3 2025: 4.1x Q3 2025: 4.1x
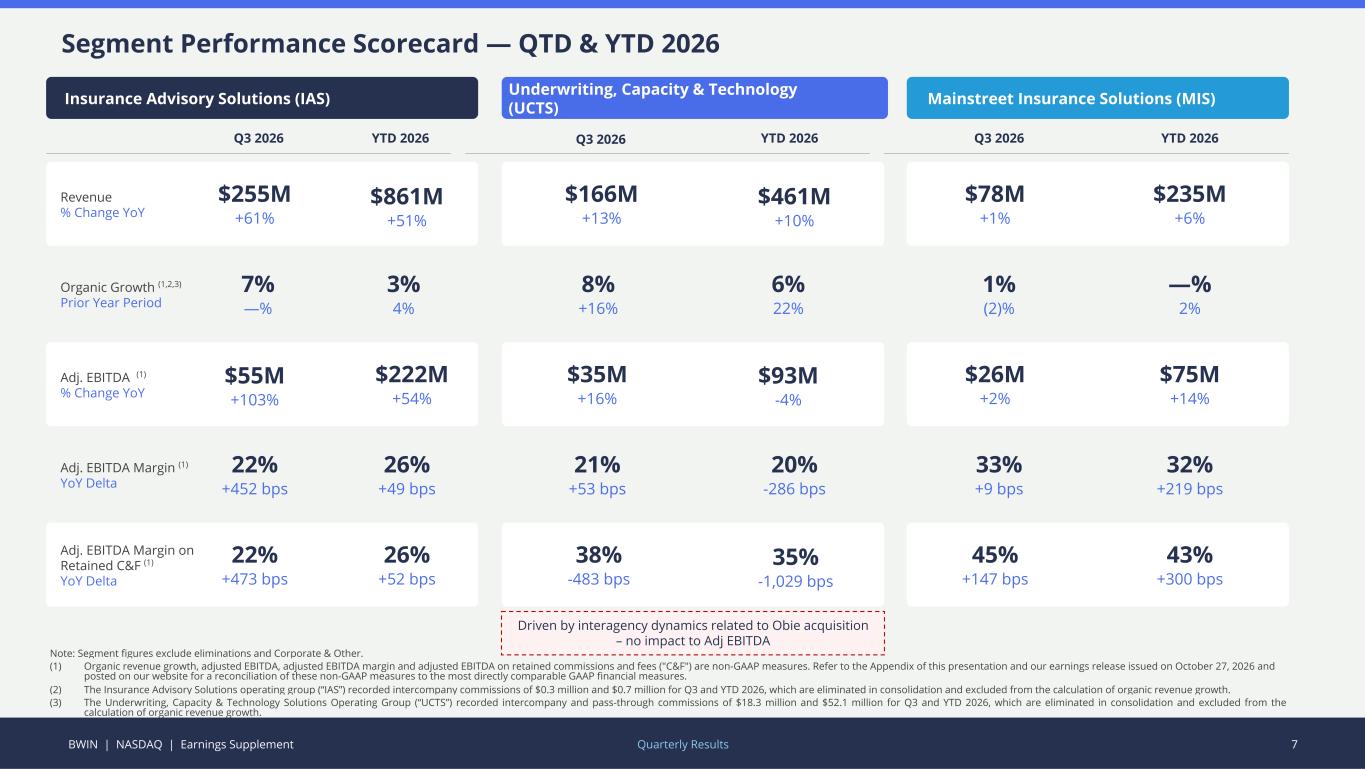
BWIN | NASDAQ | Earnings Supplement 7 Segment Performance Scorecard — QTD & YTD 2026 Quarterly Results Insurance Advisory Solutions (IAS) Q3 2026 YTD 2026 Revenue % Change YoY $255M +61% $861M +51% Organic Growth (1,2,3) Prior Year Period 7% —% 3% 4% Adj. EBITDA (1) % Change YoY $55M +103% $222M +54% Adj. EBITDA Margin (1) YoY Delta 22% +452 bps 26% +49 bps Adj. EBITDA Margin on Retained C&F (1) YoY Delta 22% +473 bps 26% +52 bps Underwriting, Capacity & Technology (UCTS) Q3 2026 YTD 2026 $166M +13% $461M +10% 8% +16% 6% 22% $35M +16% $93M -4% 21% +53 bps 20% -286 bps 38% -483 bps 35% -1,029 bps Mainstreet Insurance Solutions (MIS) Q3 2026 YTD 2026 $78M +1% $235M +6% 1% (2)% —% 2% $26M +2% $75M +14% 33% +9 bps 32% +219 bps 45% +147 bps 43% +300 bps Note: Segment figures exclude eliminations and Corporate & Other. (1) Organic revenue growth, adjusted EBITDA, adjusted EBITDA margin and adjusted EBITDA on retained commissions and fees ("C&F") are non-GAAP measures. Refer to the Appendix of this presentation and our earnings release issued on October 27, 2026 and posted on our website for a reconciliation of these non-GAAP measures to the most directly comparable GAAP financial measures. (2) The Insurance Advisory Solutions operating group (“IAS”) recorded intercompany commissions of $0.3 million and $0.7 million for Q3 and YTD 2026, which are eliminated in consolidation and excluded from the calculation of organic revenue growth. (3) The Underwriting, Capacity & Technology Solutions Operating Group (“UCTS”) recorded intercompany and pass-through commissions of $18.3 million and $52.1 million for Q3 and YTD 2026, which are eliminated in consolidation and excluded from the calculation of organic revenue growth. Driven by interagency dynamics related to Obie acquisition – no impact to Adj EBITDA
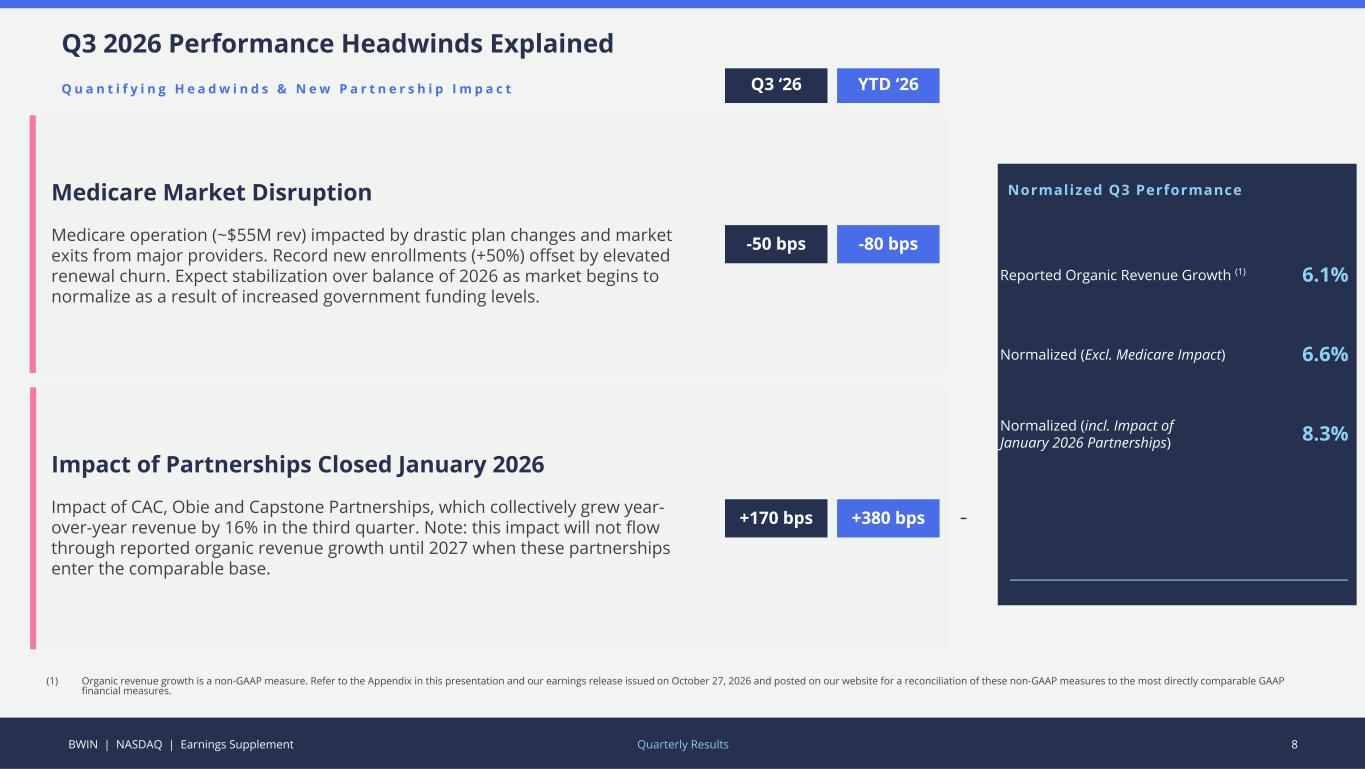
BWIN | NASDAQ | Earnings Supplement 8 Q3 2026 Performance Headwinds Explained Quarterly Results Q u a n t i f y i n g H e a d w i n d s & N e w P a r t n e r s h i p I m p a c t Normalized Q3 Performance (1) Organic revenue growth is a non-GAAP measure. Refer to the Appendix in this presentation and our earnings release issued on October 27, 2026 and posted on our website for a reconciliation of these non-GAAP measures to the most directly comparable GAAP financial measures. Impact of Partnerships Closed January 2026 Impact of CAC, Obie and Capstone Partnerships, which collectively grew year- over-year revenue by 16% in the third quarter. Note: this impact will not flow through reported organic revenue growth until 2027 when these partnerships enter the comparable base. Medicare Market Disruption Medicare operation (~$55M rev) impacted by drastic plan changes and market exits from major providers. Record new enrollments (+50%) offset by elevated renewal churn. Expect stabilization over balance of 2026 as market begins to normalize as a result of increased government funding levels. YTD ‘26Q3 ‘26 +170 bps +380 bps -50 bps -80 bps Reported Organic Revenue Growth (1) 6.1% Normalized (Excl. Medicare Impact) 6.6% Normalized (incl. Impact of January 2026 Partnerships) 8.3%
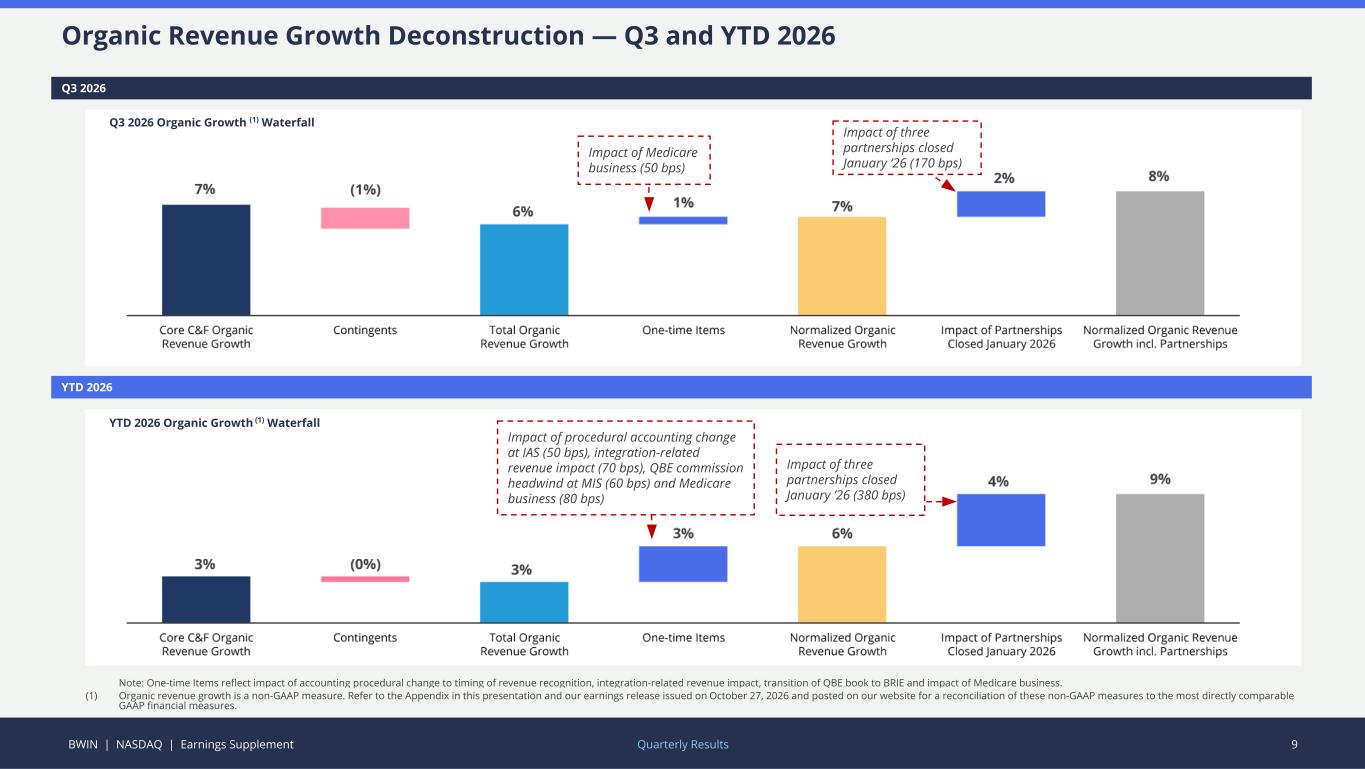
BWIN | NASDAQ | Earnings Supplement 9 Organic Revenue Growth Deconstruction — Q3 and YTD 2026 Quarterly Results Q3 2026 Q3 2026 Organic Growth (1) Waterfall Impact of Medicare business (50 bps) Impact of three partnerships closed January ‘26 (170 bps) YTD 2026 YTD 2026 Organic Growth (1) Waterfall Note: One-time Items reflect impact of accounting procedural change to timing of revenue recognition, integration-related revenue impact, transition of QBE book to BRIE and impact of Medicare business. (1) Organic revenue growth is a non-GAAP measure. Refer to the Appendix in this presentation and our earnings release issued on October 27, 2026 and posted on our website for a reconciliation of these non-GAAP measures to the most directly comparable GAAP financial measures. Impact of procedural accounting change at IAS (50 bps), integration-related revenue impact (70 bps), QBE commission headwind at MIS (60 bps) and Medicare business (80 bps) Impact of three partnerships closed January ’26 (380 bps)
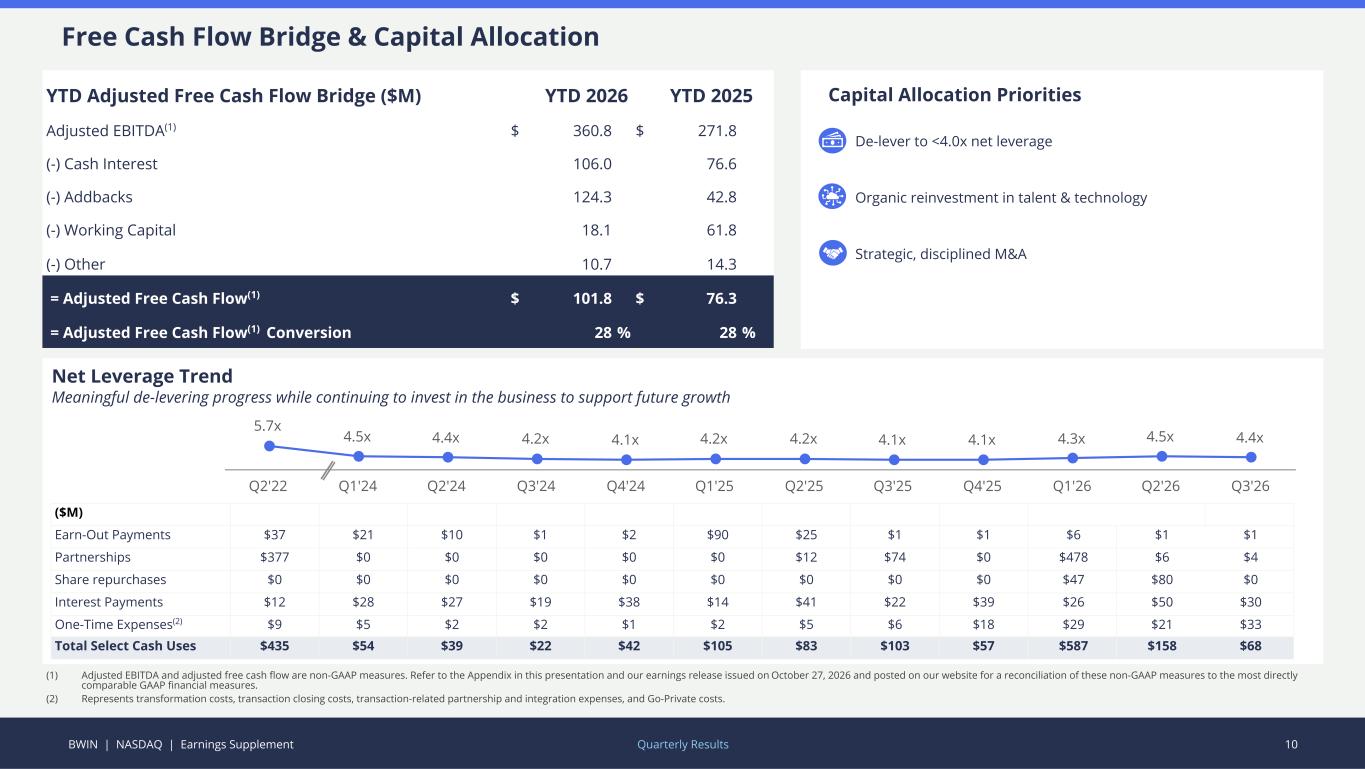
BWIN | NASDAQ | Earnings Supplement 10 Net Leverage Trend Meaningful de-levering progress while continuing to invest in the business to support future growth Quarterly Results ($M) Earn-Out Payments $37 $21 $10 $1 $2 $90 $25 $1 $1 $6 $1 $1 Partnerships $377 $0 $0 $0 $0 $0 $12 $74 $0 $478 $6 $4 Share repurchases $0 $0 $0 $0 $0 $0 $0 $0 $0 $47 $80 $0 Interest Payments $12 $28 $27 $19 $38 $14 $41 $22 $39 $26 $50 $30 One-Time Expenses(2) $9 $5 $2 $2 $1 $2 $5 $6 $18 $29 $21 $33 Total Select Cash Uses $435 $54 $39 $22 $42 $105 $83 $103 $57 $587 $158 $68 Free Cash Flow Bridge & Capital Allocation (1) Adjusted EBITDA and adjusted free cash flow are non-GAAP measures. Refer to the Appendix in this presentation and our earnings release issued on October 27, 2026 and posted on our website for a reconciliation of these non-GAAP measures to the most directly comparable GAAP financial measures. (2) Represents transformation costs, transaction closing costs, transaction-related partnership and integration expenses, and Go-Private costs. Capital Allocation Priorities De-lever to <4.0x net leverage Organic reinvestment in talent & technology Strategic, disciplined M&A YTD Adjusted Free Cash Flow Bridge ($M) YTD 2026 YTD 2025 Adjusted EBITDA(1) $ 360.8 $ 271.8 (-) Cash Interest 106.0 76.6 (-) Addbacks 124.3 42.8 (-) Working Capital 18.1 61.8 (-) Other 10.7 14.3 '= Adjusted Free Cash Flow(1) $ 101.8 $ 76.3 '= Adjusted Free Cash Flow(1) Conversion 28 % 28 % 5.7x 4.5x 4.4x 4.2x 4.1x 4.2x 4.2x 4.1x 4.1x 4.3x 4.5x 4.4x Q2'22 Q1'24 Q2'24 Q3'24 Q4'24 Q1'25 Q2'25 Q3'25 Q4'25 Q1'26 Q2'26 Q3'26
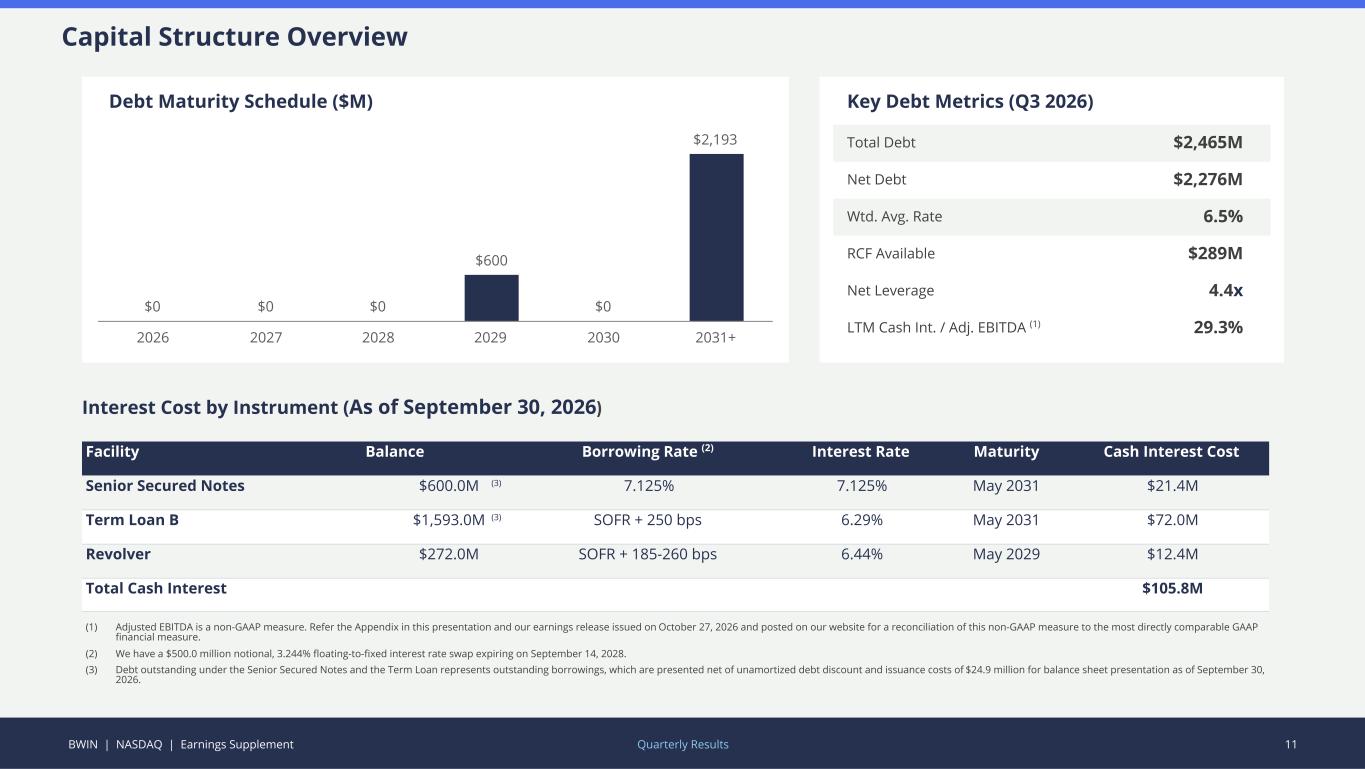
BWIN | NASDAQ | Earnings Supplement 11 Key Debt Metrics (Q3 2026) Total Debt $2,465M Net Debt $2,276M Wtd. Avg. Rate 6.5% RCF Available $289M Net Leverage 4.4x LTM Cash Int. / Adj. EBITDA (1) 29.3% Interest Cost by Instrument (As of September 30, 2026) Facility Balance Borrowing Rate (2) Interest Rate Maturity Cash Interest Cost Senior Secured Notes $600.0M (3) 7.125% 7.125% May 2031 $21.4M Term Loan B $1,593.0M (3) SOFR + 250 bps 6.29% May 2031 $72.0M Revolver $272.0M SOFR + 185-260 bps 6.44% May 2029 $12.4M Total Cash Interest $105.8M Capital Structure Overview (1) Adjusted EBITDA is a non-GAAP measure. Refer the Appendix in this presentation and our earnings release issued on October 27, 2026 and posted on our website for a reconciliation of this non-GAAP measure to the most directly comparable GAAP financial measure. (2) We have a $500.0 million notional, 3.244% floating-to-fixed interest rate swap expiring on September 14, 2028. (3) Debt outstanding under the Senior Secured Notes and the Term Loan represents outstanding borrowings, which are presented net of unamortized debt discount and issuance costs of $24.9 million for balance sheet presentation as of September 30, 2026. Quarterly Results $0 $0 $0 $600 $0 $2,193 2026 2027 2028 2029 2030 2031+ Debt Maturity Schedule ($M)
BWIN | NASDAQ | Earnings Supplement 12 02 Strategic Initiatives Update CAC integration milestones, synergy capture, and transformation program execution
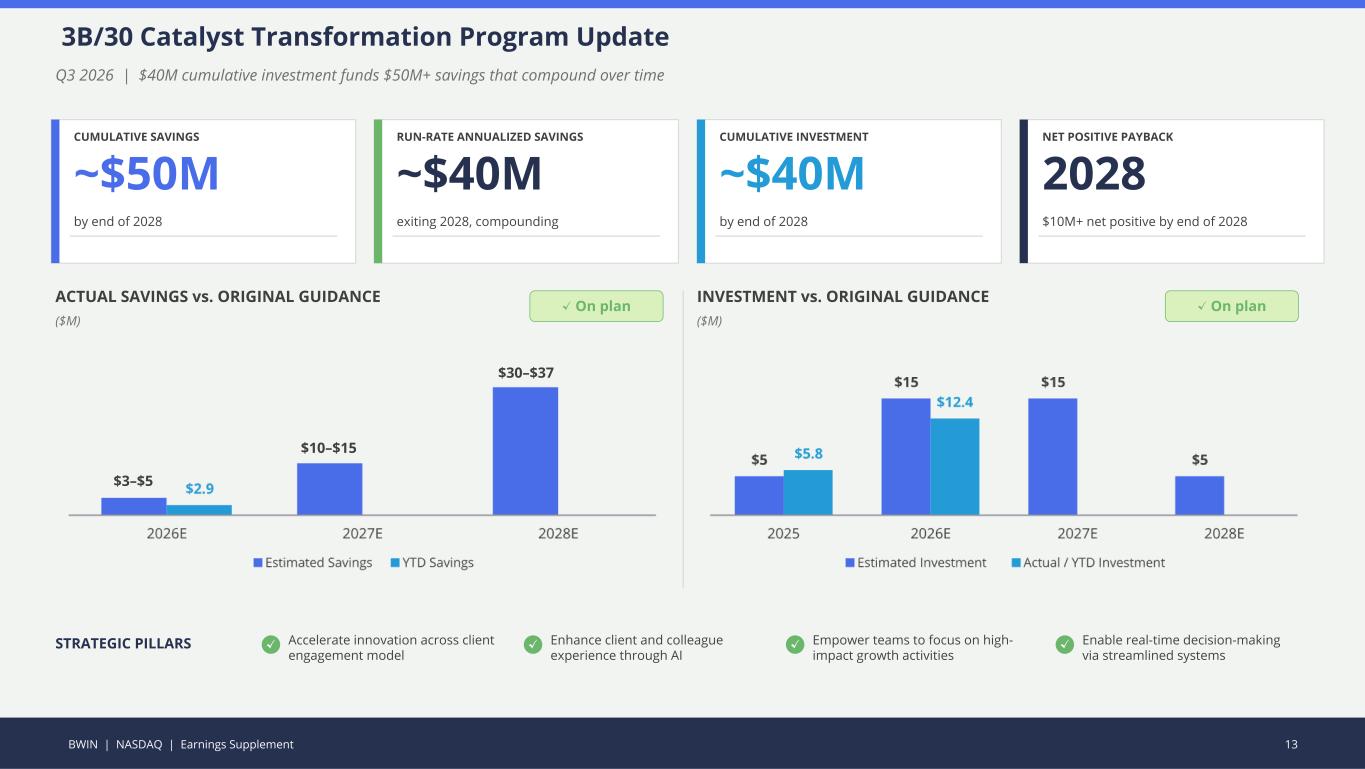
BWIN | NASDAQ | Earnings Supplement 13 Q3 2026 | $40M cumulative investment funds $50M+ savings that compound over time 3B/30 Catalyst Transformation Program Update CUMULATIVE SAVINGS ~$50M by end of 2028 RUN-RATE ANNUALIZED SAVINGS ~$40M exiting 2028, compounding CUMULATIVE INVESTMENT ~$40M by end of 2028 NET POSITIVE PAYBACK 2028 $10M+ net positive by end of 2028 ACTUAL SAVINGS vs. ORIGINAL GUIDANCE ($M) ✓ On plan INVESTMENT vs. ORIGINAL GUIDANCE ($M) ✓ On plan STRATEGIC PILLARS ✓ Accelerate innovation across client engagement model ✓ Enhance client and colleague experience through AI ✓ Empower teams to focus on high- impact growth activities ✓ Enable real-time decision-making via streamlined systems $3–$5 $10–$15 $30–$37
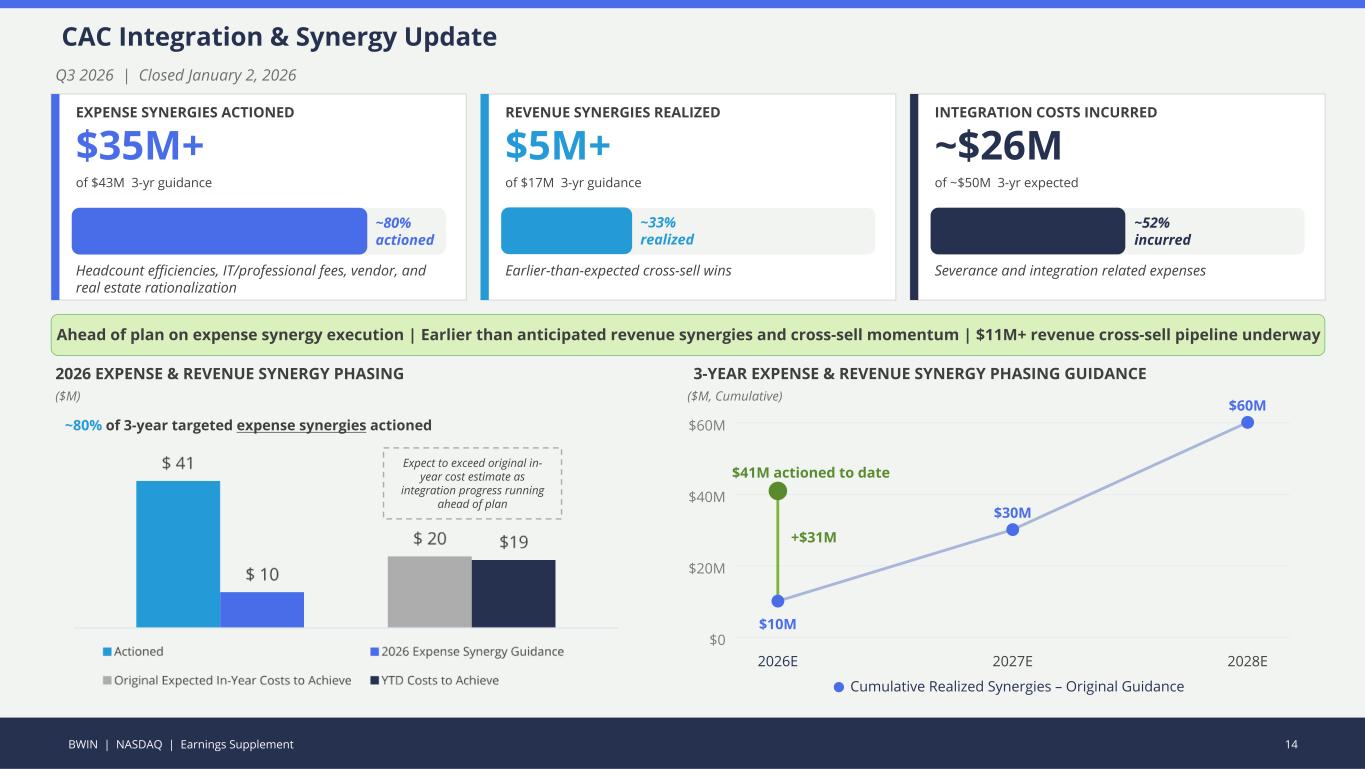
BWIN | NASDAQ | Earnings Supplement 14 Q3 2026 | Closed January 2, 2026 CAC Integration & Synergy Update Q 1 2 0 2 6 | M e r g e r C l o s e d J a n u a r y 2 , 2 0 2 6 EXPENSE SYNERGIES ACTIONED $35M+ of $43M 3-yr guidance Headcount efficiencies, IT/professional fees, vendor, and real estate rationalization REVENUE SYNERGIES REALIZED $5M+ of $17M 3-yr guidance Earlier-than-expected cross-sell wins INTEGRATION COSTS INCURRED ~$26M of ~$50M 3-yr expected Severance and integration related expenses Ahead of plan on expense synergy execution | Earlier than anticipated revenue synergies and cross-sell momentum | $11M+ revenue cross-sell pipeline underway ~80% actioned 2026 EXPENSE & REVENUE SYNERGY PHASING ($M) ~80% of 3-year targeted expense synergies actioned $0 $20M $40M $60M +$31M $10M $30M $60M $41M actioned to date 2026E 2027E 2028E 3-YEAR EXPENSE & REVENUE SYNERGY PHASING GUIDANCE ($M, Cumulative) Cumulative Realized Synergies – Original Guidance Expect to exceed original in- year cost estimate as integration progress running ahead of plan ~33% realized ~52% incurred
BWIN | NASDAQ | Earnings Supplement 15 03 Appendix GAAP reconciliations, segment detail, and supplemental data
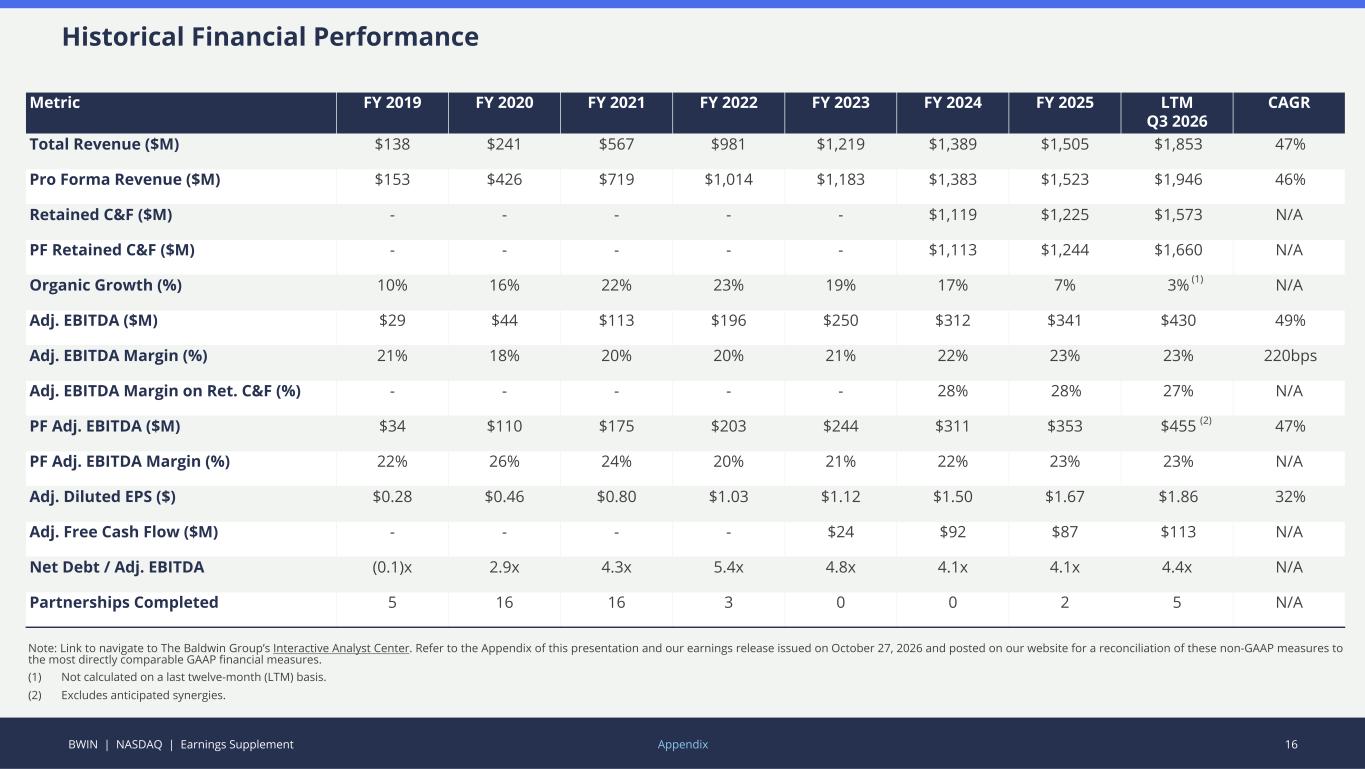
BWIN | NASDAQ | Earnings Supplement 16Appendix Note: Link to navigate to The Baldwin Group’s Interactive Analyst Center. Refer to the Appendix of this presentation and our earnings release issued on October 27, 2026 and posted on our website for a reconciliation of these non-GAAP measures to the most directly comparable GAAP financial measures. (1) Not calculated on a last twelve-month (LTM) basis. (2) Excludes anticipated synergies. Metric FY 2019 FY 2020 FY 2021 FY 2022 FY 2023 FY 2024 FY 2025 LTM Q3 2026 CAGR Total Revenue ($M) $138 $241 $567 $981 $1,219 $1,389 $1,505 $1,853 47% Pro Forma Revenue ($M) $153 $426 $719 $1,014 $1,183 $1,383 $1,523 $1,946 46% Retained C&F ($M) - - - - - $1,119 $1,225 $1,573 N/A PF Retained C&F ($M) - - - - - $1,113 $1,244 $1,660 N/A Organic Growth (%) 10% 16% 22% 23% 19% 17% 7% 3% N/A Adj. EBITDA ($M) $29 $44 $113 $196 $250 $312 $341 $430 49% Adj. EBITDA Margin (%) 21% 18% 20% 20% 21% 22% 23% 23% 220bps Adj. EBITDA Margin on Ret. C&F (%) - - - - - 28% 28% 27% N/A PF Adj. EBITDA ($M) $34 $110 $175 $203 $244 $311 $353 $455 47% PF Adj. EBITDA Margin (%) 22% 26% 24% 20% 21% 22% 23% 23% N/A Adj. Diluted EPS ($) $0.28 $0.46 $0.80 $1.03 $1.12 $1.50 $1.67 $1.86 32% Adj. Free Cash Flow ($M) - - - - $24 $92 $87 $113 N/A Net Debt / Adj. EBITDA (0.1)x 2.9x 4.3x 5.4x 4.8x 4.1x 4.1x 4.4x N/A Partnerships Completed 5 16 16 3 0 0 2 5 N/A Historical Financial Performance (1) (2)
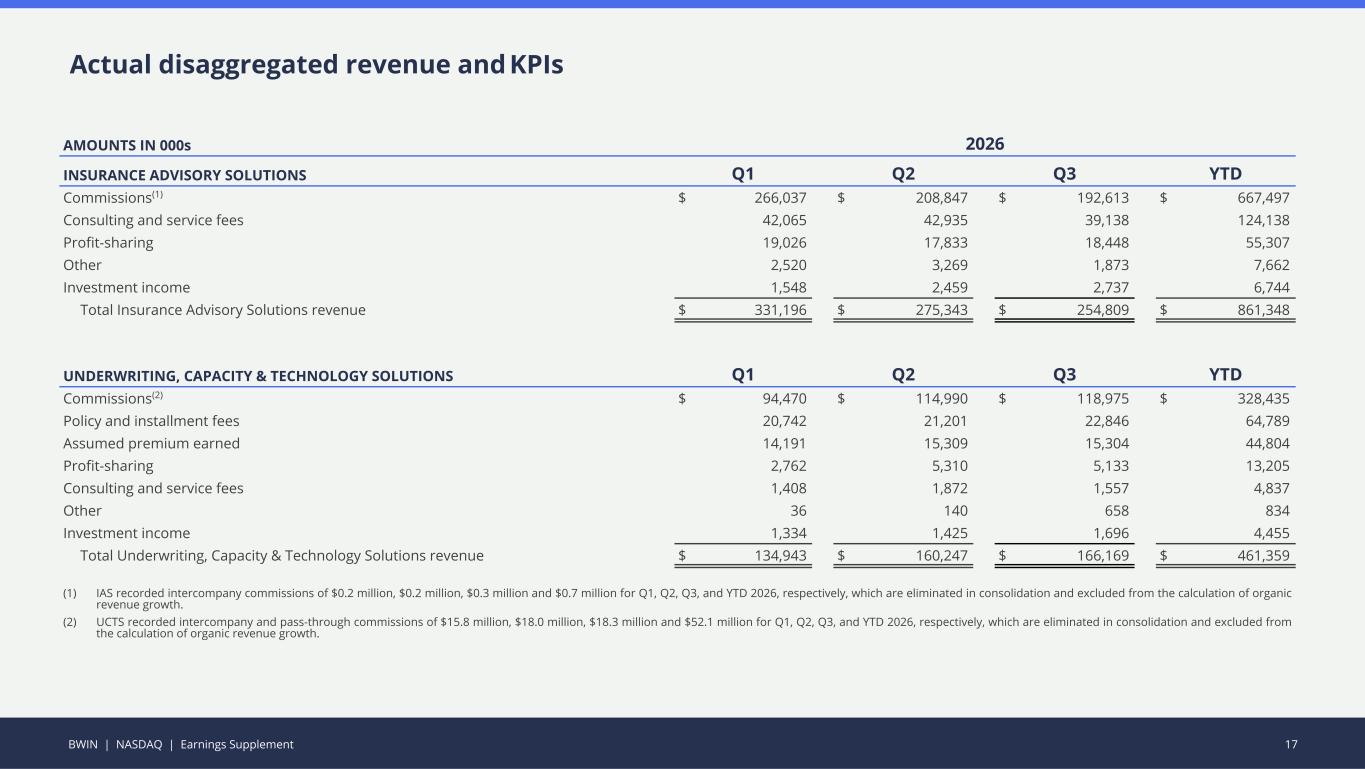
BWIN | NASDAQ | Earnings Supplement 17 Actual disaggregated revenue and KPIs AMOUNTS IN 000s 2026 INSURANCE ADVISORY SOLUTIONS Q1 Q2 Q3 YTD Commissions(1) $ 266,037 $ 208,847 $ 192,613 $ 667,497 Consulting and service fees 42,065 42,935 39,138 124,138 Profit-sharing 19,026 17,833 18,448 55,307 Other 2,520 3,269 1,873 7,662 Investment income 1,548 2,459 2,737 6,744 Total Insurance Advisory Solutions revenue $ 331,196 $ 275,343 $ 254,809 $ 861,348 UNDERWRITING, CAPACITY & TECHNOLOGY SOLUTIONS Q1 Q2 Q3 YTD Commissions(2) $ 94,470 $ 114,990 $ 118,975 $ 328,435 Policy and installment fees 20,742 21,201 22,846 64,789 Assumed premium earned 14,191 15,309 15,304 44,804 Profit-sharing 2,762 5,310 5,133 13,205 Consulting and service fees 1,408 1,872 1,557 4,837 Other 36 140 658 834 Investment income 1,334 1,425 1,696 4,455 Total Underwriting, Capacity & Technology Solutions revenue $ 134,943 $ 160,247 $ 166,169 $ 461,359 (1) IAS recorded intercompany commissions of $0.2 million, $0.2 million, $0.3 million and $0.7 million for Q1, Q2, Q3, and YTD 2026, respectively, which are eliminated in consolidation and excluded from the calculation of organic revenue growth. (2) UCTS recorded intercompany and pass-through commissions of $15.8 million, $18.0 million, $18.3 million and $52.1 million for Q1, Q2, Q3, and YTD 2026, respectively, which are eliminated in consolidation and excluded from the calculation of organic revenue growth.
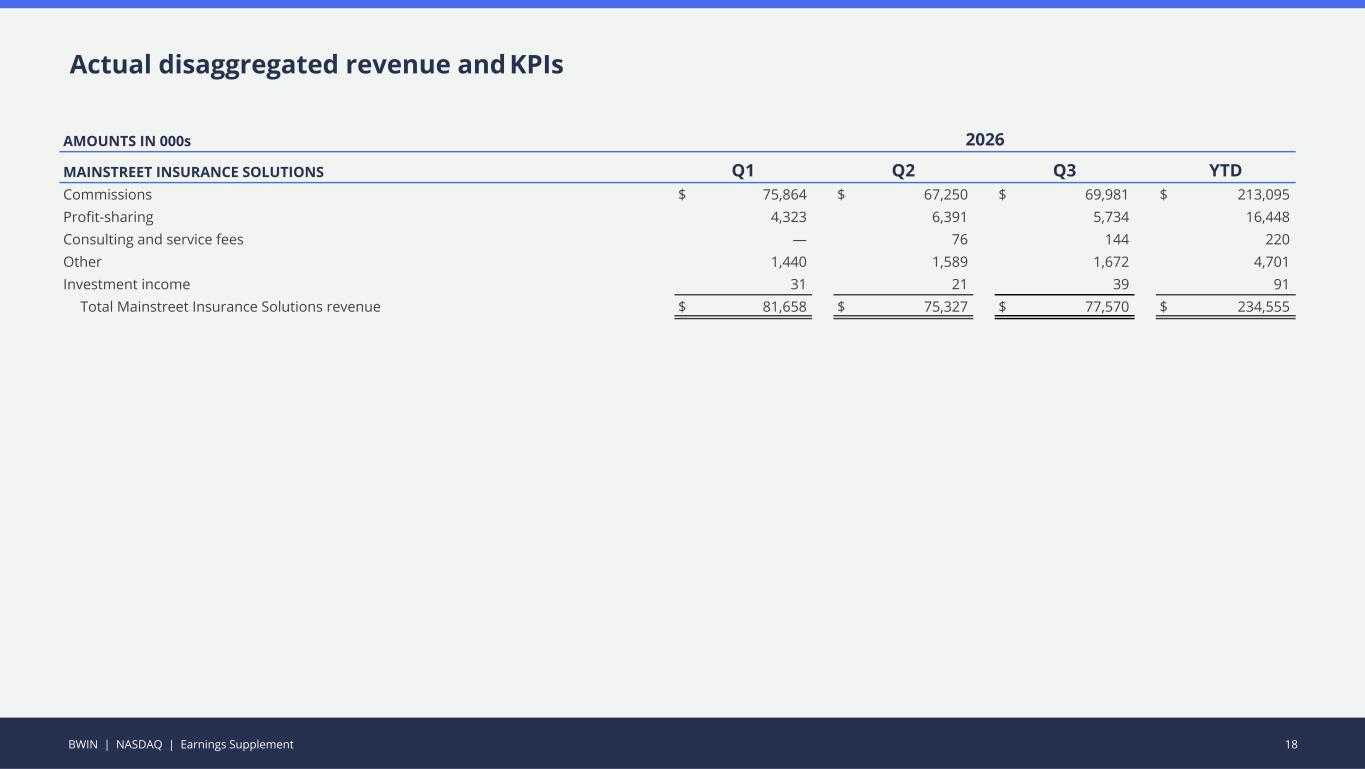
BWIN | NASDAQ | Earnings Supplement 18 Actual disaggregated revenue and KPIs AMOUNTS IN 000s 2026 MAINSTREET INSURANCE SOLUTIONS Q1 Q2 Q3 YTD Commissions $ 75,864 $ 67,250 $ 69,981 $ 213,095 Profit-sharing 4,323 6,391 5,734 16,448 Consulting and service fees — 76 144 220 Other 1,440 1,589 1,672 4,701 Investment income 31 21 39 91 Total Mainstreet Insurance Solutions revenue $ 81,658 $ 75,327 $ 77,570 $ 234,555
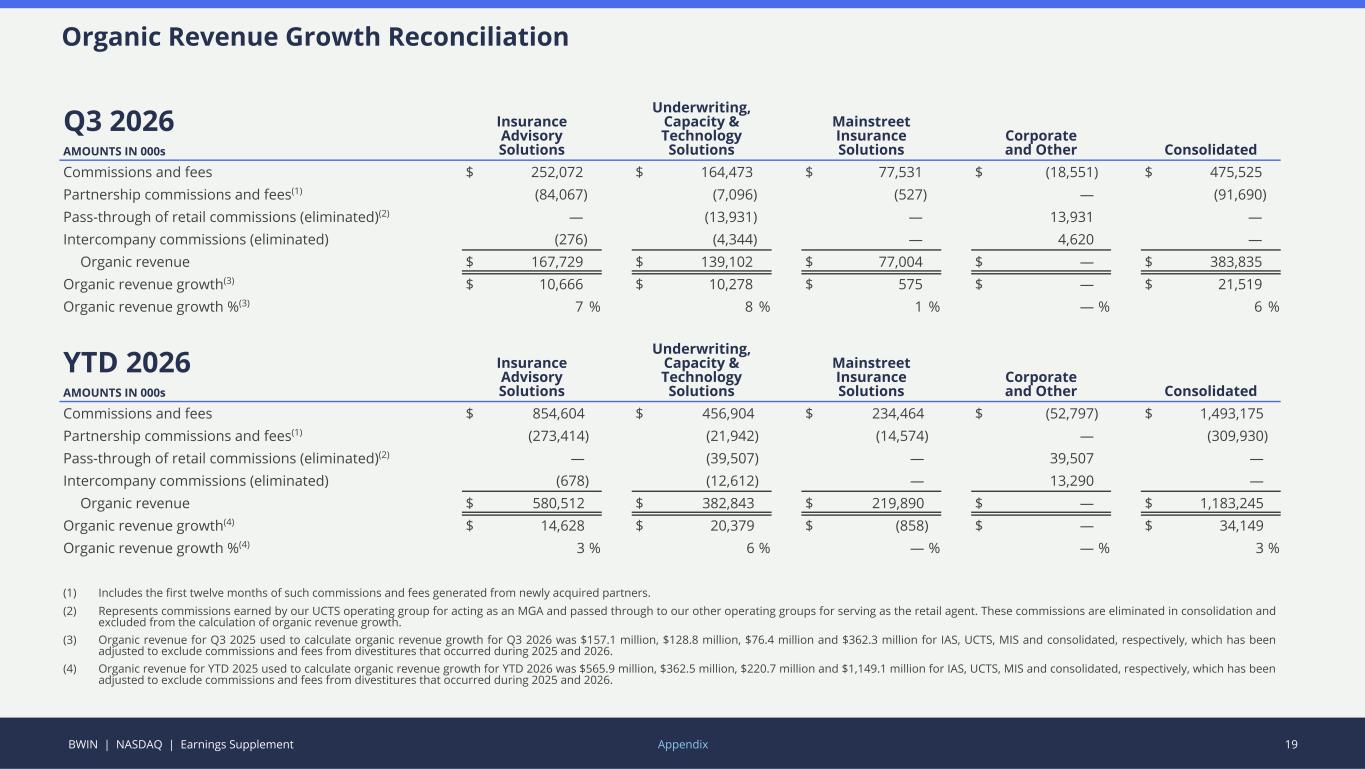
BWIN | NASDAQ | Earnings Supplement 19 Q3 2026 Insurance Advisory Solutions Underwriting, Capacity & Technology Solutions Mainstreet Insurance Solutions Corporate and Other ConsolidatedAMOUNTS IN 000s Commissions and fees $ 252,072 $ 164,473 $ 77,531 $ (18,551) $ 475,525 Partnership commissions and fees(1) (84,067) (7,096) (527) — (91,690) Pass-through of retail commissions (eliminated)(2) — (13,931) — 13,931 — Intercompany commissions (eliminated) (276) (4,344) — 4,620 — Organic revenue $ 167,729 $ 139,102 $ 77,004 $ — $ 383,835 Organic revenue growth(3) $ 10,666 $ 10,278 $ 575 $ — $ 21,519 Organic revenue growth %(3) 7 % 8 % 1 % — % 6 % YTD 2026 Insurance Advisory Solutions Underwriting, Capacity & Technology Solutions Mainstreet Insurance Solutions Corporate and Other ConsolidatedAMOUNTS IN 000s Commissions and fees $ 854,604 $ 456,904 $ 234,464 $ (52,797) $ 1,493,175 Partnership commissions and fees(1) (273,414) (21,942) (14,574) — (309,930) Pass-through of retail commissions (eliminated)(2) — (39,507) — 39,507 — Intercompany commissions (eliminated) (678) (12,612) — 13,290 — Organic revenue $ 580,512 $ 382,843 $ 219,890 $ — $ 1,183,245 Organic revenue growth(4) $ 14,628 $ 20,379 $ (858) $ — $ 34,149 Organic revenue growth %(4) 3 % 6 % — % — % 3 % (1) Includes the first twelve months of such commissions and fees generated from newly acquired partners. (2) Represents commissions earned by our UCTS operating group for acting as an MGA and passed through to our other operating groups for serving as the retail agent. These commissions are eliminated in consolidation and excluded from the calculation of organic revenue growth. (3) Organic revenue for Q3 2025 used to calculate organic revenue growth for Q3 2026 was $157.1 million, $128.8 million, $76.4 million and $362.3 million for IAS, UCTS, MIS and consolidated, respectively, which has been adjusted to exclude commissions and fees from divestitures that occurred during 2025 and 2026. (4) Organic revenue for YTD 2025 used to calculate organic revenue growth for YTD 2026 was $565.9 million, $362.5 million, $220.7 million and $1,149.1 million for IAS, UCTS, MIS and consolidated, respectively, which has been adjusted to exclude commissions and fees from divestitures that occurred during 2025 and 2026. Appendix Organic Revenue Growth Reconciliation
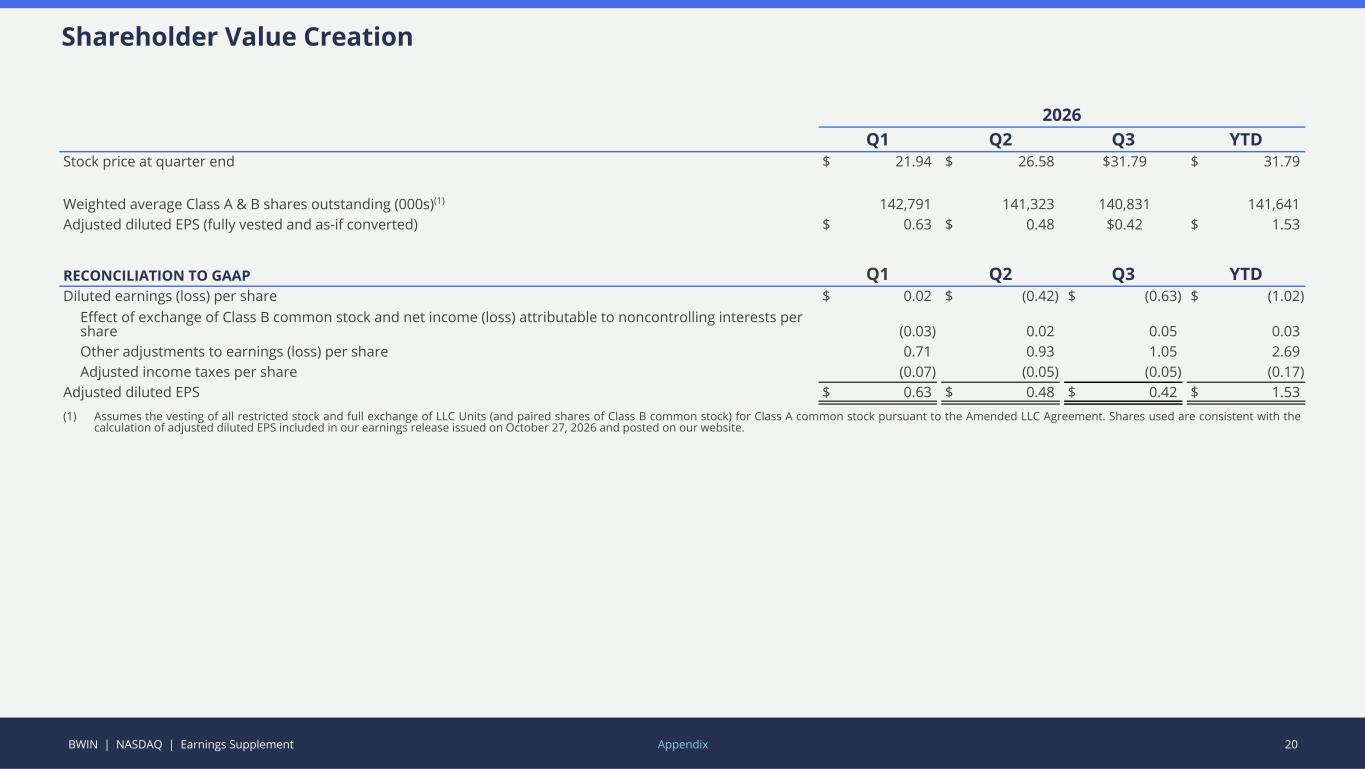
BWIN | NASDAQ | Earnings Supplement 20 2026 Q1 Q2 Q3 YTD Stock price at quarter end $ 21.94 $ 26.58 $31.79 $ 31.79 Weighted average Class A & B shares outstanding (000s)(1) 142,791 141,323 140,831 141,641 Adjusted diluted EPS (fully vested and as-if converted) $ 0.63 $ 0.48 $0.42 $ 1.53 RECONCILIATION TO GAAP Q1 Q2 Q3 YTD Diluted earnings (loss) per share $ 0.02 $ (0.42) $ (0.63) $ (1.02) Effect of exchange of Class B common stock and net income (loss) attributable to noncontrolling interests per share (0.03) 0.02 0.05 0.03 Other adjustments to earnings (loss) per share 0.71 0.93 1.05 2.69 Adjusted income taxes per share (0.07) (0.05) (0.05) (0.17) Adjusted diluted EPS $ 0.63 $ 0.48 $ 0.42 $ 1.53 (1) Assumes the vesting of all restricted stock and full exchange of LLC Units (and paired shares of Class B common stock) for Class A common stock pursuant to the Amended LLC Agreement. Shares used are consistent with the calculation of adjusted diluted EPS included in our earnings release issued on October 27, 2026 and posted on our website. Appendix Shareholder Value Creation
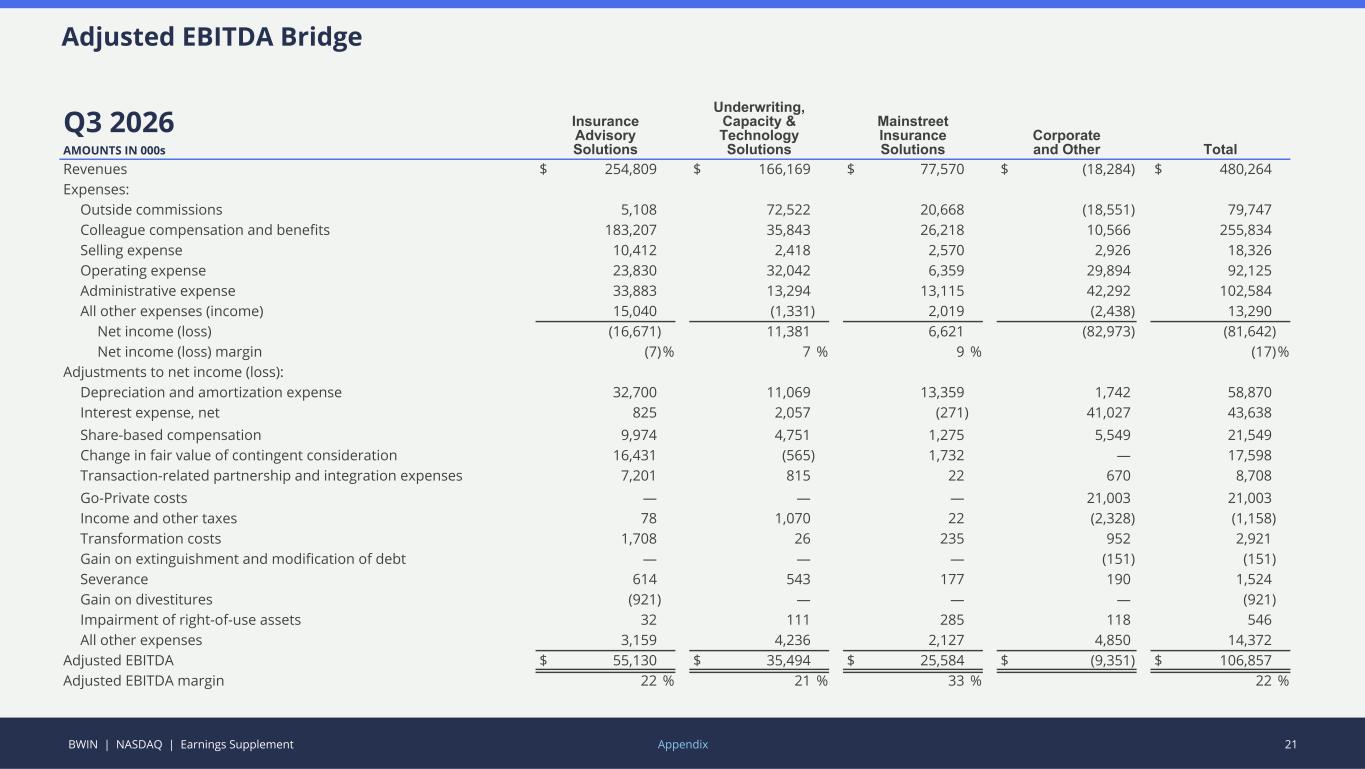
BWIN | NASDAQ | Earnings Supplement 21 Q3 2026 Insurance Advisory Solutions Underwriting, Capacity & Technology Solutions Mainstreet Insurance Solutions Corporate and Other TotalAMOUNTS IN 000s Revenues $ 254,809 $ 166,169 $ 77,570 $ (18,284) $ 480,264 Expenses: Outside commissions 5,108 72,522 20,668 (18,551) 79,747 Colleague compensation and benefits 183,207 35,843 26,218 10,566 255,834 Selling expense 10,412 2,418 2,570 2,926 18,326 Operating expense 23,830 32,042 6,359 29,894 92,125 Administrative expense 33,883 13,294 13,115 42,292 102,584 All other expenses (income) 15,040 (1,331) 2,019 (2,438) 13,290 Net income (loss) (16,671) 11,381 6,621 (82,973) (81,642) Net income (loss) margin (7) % 7 % 9 % (17) % Adjustments to net income (loss): Depreciation and amortization expense 32,700 11,069 13,359 1,742 58,870 Interest expense, net 825 2,057 (271) 41,027 43,638 Share-based compensation 9,974 4,751 1,275 5,549 21,549 Change in fair value of contingent consideration 16,431 (565) 1,732 — 17,598 Transaction-related partnership and integration expenses 7,201 815 22 670 8,708 Go-Private costs — — — 21,003 21,003 Income and other taxes 78 1,070 22 (2,328) (1,158) Transformation costs 1,708 26 235 952 2,921 Gain on extinguishment and modification of debt — — — (151) (151) Severance 614 543 177 190 1,524 Gain on divestitures (921) — — — (921) Impairment of right-of-use assets 32 111 285 118 546 All other expenses 3,159 4,236 2,127 4,850 14,372 Adjusted EBITDA $ 55,130 $ 35,494 $ 25,584 $ (9,351) $ 106,857 Adjusted EBITDA margin 22 % 21 % 33 % 22 % Appendix Adjusted EBITDA Bridge
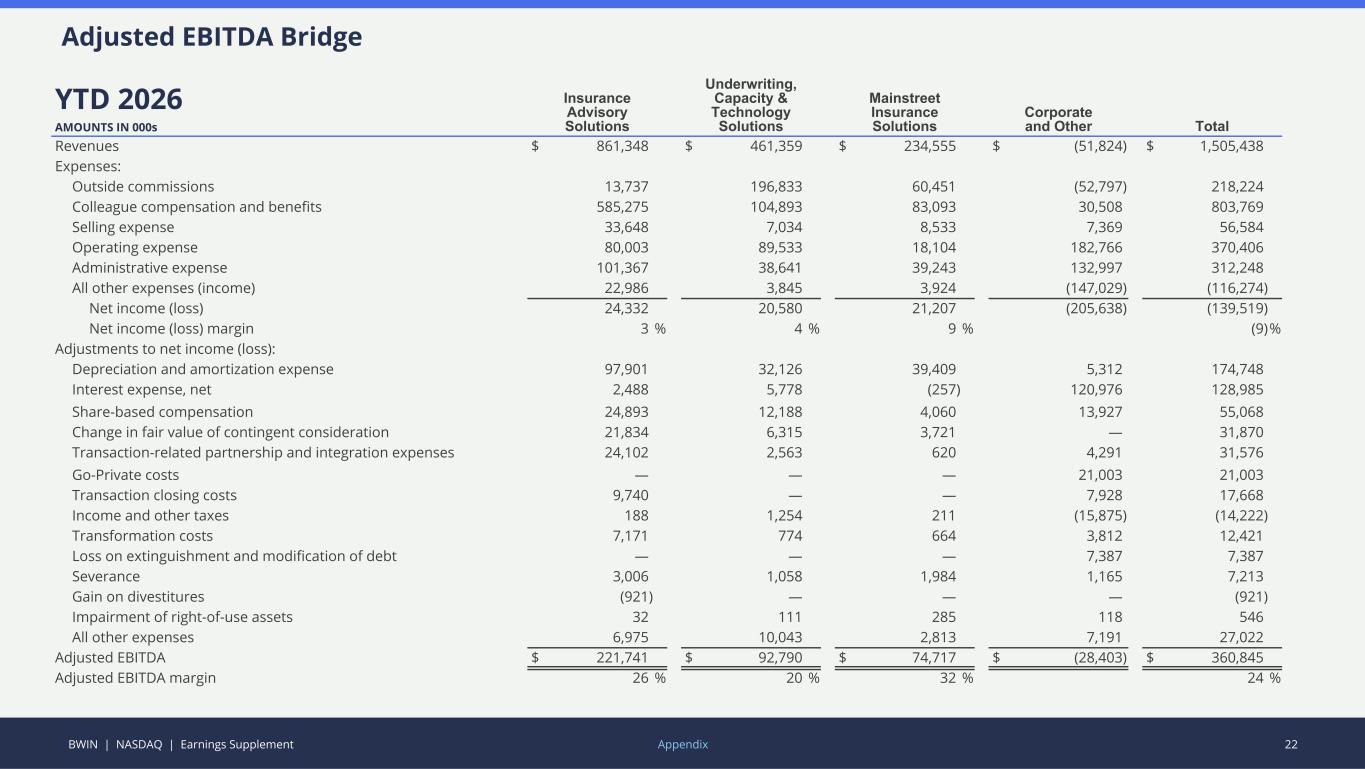
BWIN | NASDAQ | Earnings Supplement 22 YTD 2026 Insurance Advisory Solutions Underwriting, Capacity & Technology Solutions Mainstreet Insurance Solutions Corporate and Other TotalAMOUNTS IN 000s Revenues $ 861,348 $ 461,359 $ 234,555 $ (51,824) $ 1,505,438 Expenses: Outside commissions 13,737 196,833 60,451 (52,797) 218,224 Colleague compensation and benefits 585,275 104,893 83,093 30,508 803,769 Selling expense 33,648 7,034 8,533 7,369 56,584 Operating expense 80,003 89,533 18,104 182,766 370,406 Administrative expense 101,367 38,641 39,243 132,997 312,248 All other expenses (income) 22,986 3,845 3,924 (147,029) (116,274) Net income (loss) 24,332 20,580 21,207 (205,638) (139,519) Net income (loss) margin 3 % 4 % 9 % (9) % Adjustments to net income (loss): Depreciation and amortization expense 97,901 32,126 39,409 5,312 174,748 Interest expense, net 2,488 5,778 (257) 120,976 128,985 Share-based compensation 24,893 12,188 4,060 13,927 55,068 Change in fair value of contingent consideration 21,834 6,315 3,721 — 31,870 Transaction-related partnership and integration expenses 24,102 2,563 620 4,291 31,576 Go-Private costs — — — 21,003 21,003 Transaction closing costs 9,740 — — 7,928 17,668 Income and other taxes 188 1,254 211 (15,875) (14,222) Transformation costs 7,171 774 664 3,812 12,421 Loss on extinguishment and modification of debt — — — 7,387 7,387 Severance 3,006 1,058 1,984 1,165 7,213 Gain on divestitures (921) — — — (921) Impairment of right-of-use assets 32 111 285 118 546 All other expenses 6,975 10,043 2,813 7,191 27,022 Adjusted EBITDA $ 221,741 $ 92,790 $ 74,717 $ (28,403) $ 360,845 Adjusted EBITDA margin 26 % 20 % 32 % 24 % Appendix Adjusted EBITDA Bridge
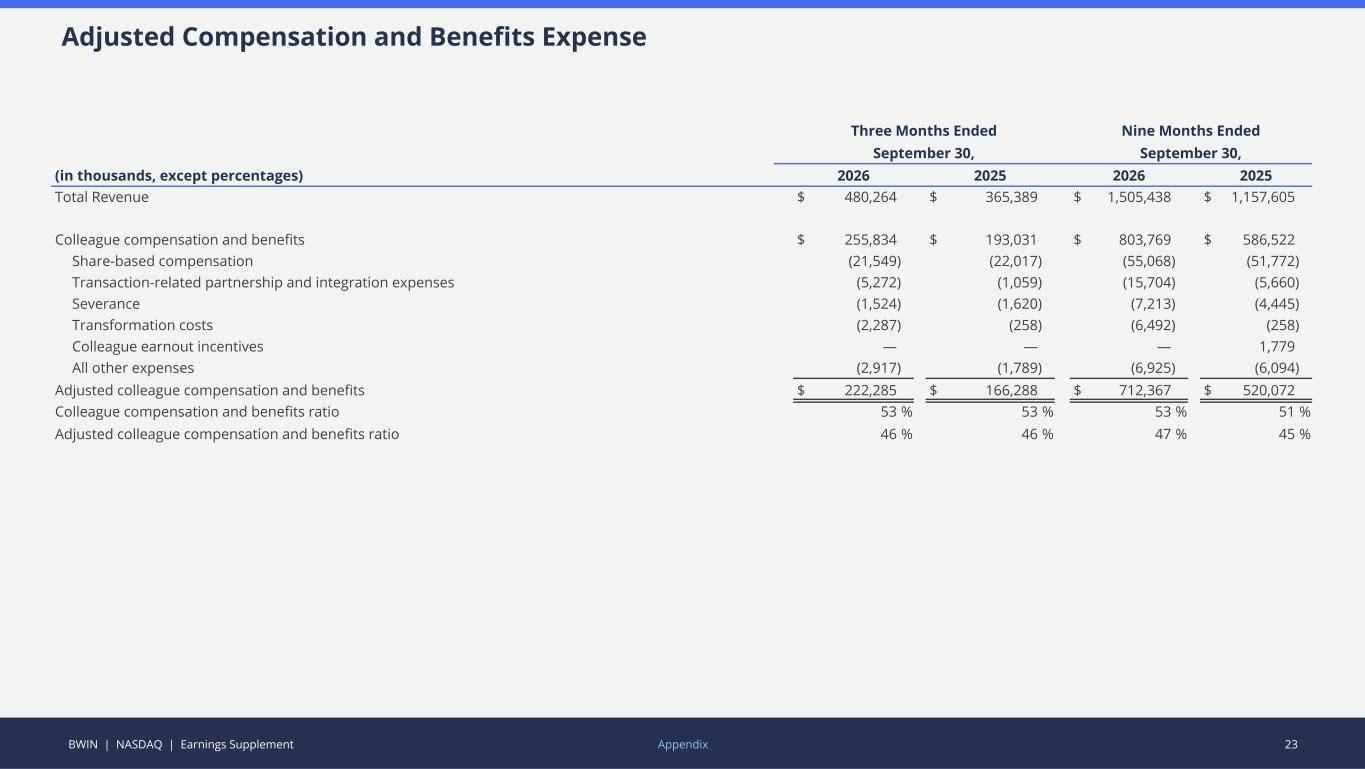
BWIN | NASDAQ | Earnings Supplement 23 Adjusted Compensation and Benefits Expense Three Months Ended Nine Months Ended September 30, September 30, (in thousands, except percentages) 2026 2025 2026 2025 Total Revenue $ 480,264 $ 365,389 $ 1,505,438 $ 1,157,605 Colleague compensation and benefits $ 255,834 $ 193,031 $ 803,769 $ 586,522 Share-based compensation (21,549) (22,017) (55,068) (51,772) Transaction-related partnership and integration expenses (5,272) (1,059) (15,704) (5,660) Severance (1,524) (1,620) (7,213) (4,445) Transformation costs (2,287) (258) (6,492) (258) Colleague earnout incentives — — — 1,779 All other expenses (2,917) (1,789) (6,925) (6,094) Adjusted colleague compensation and benefits $ 222,285 $ 166,288 $ 712,367 $ 520,072 Colleague compensation and benefits ratio 53 % 53 % 53 % 51 % Adjusted colleague compensation and benefits ratio 46 % 46 % 47 % 45 % Appendix
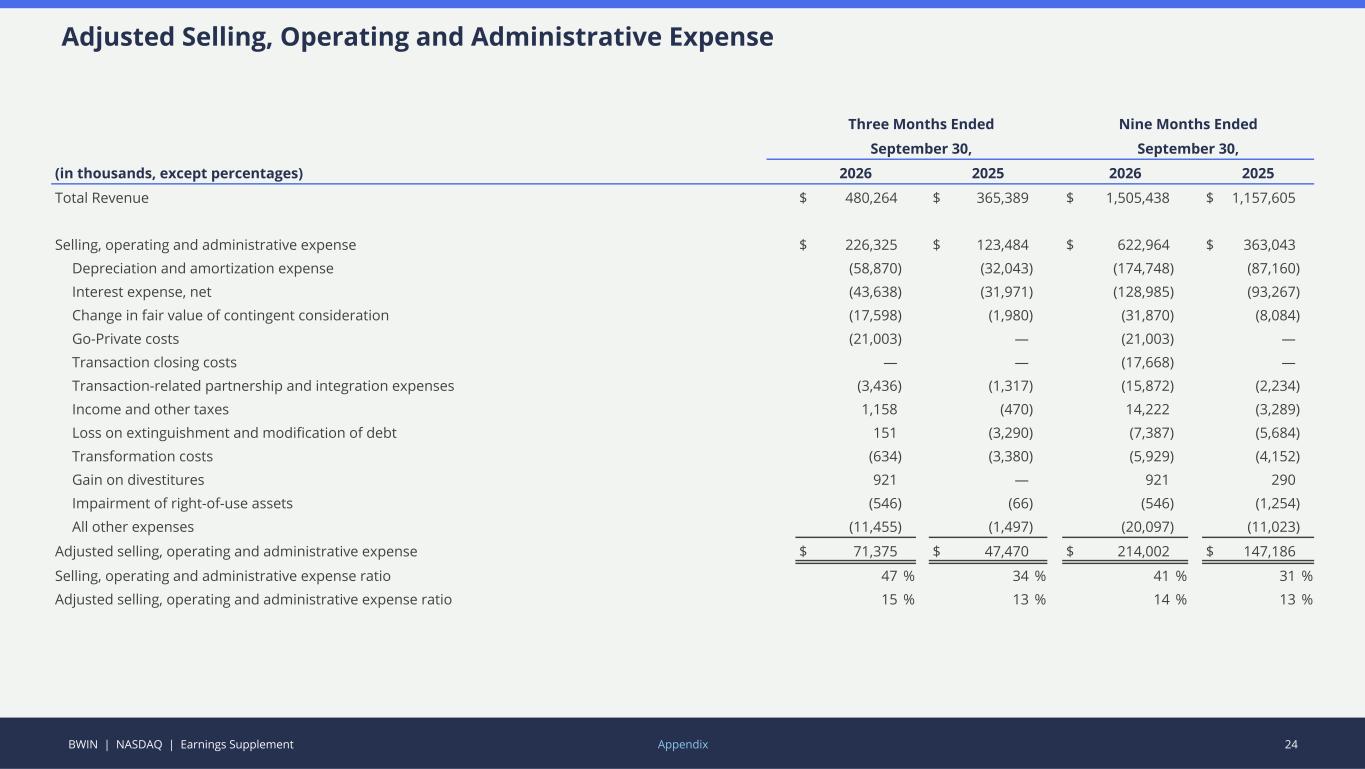
BWIN | NASDAQ | Earnings Supplement 24 Adjusted Selling, Operating and Administrative Expense Three Months Ended Nine Months Ended September 30, September 30, (in thousands, except percentages) 2026 2025 2026 2025 Total Revenue $ 480,264 $ 365,389 $ 1,505,438 $ 1,157,605 Selling, operating and administrative expense $ 226,325 $ 123,484 $ 622,964 $ 363,043 Depreciation and amortization expense (58,870) (32,043) (174,748) (87,160) Interest expense, net (43,638) (31,971) (128,985) (93,267) Change in fair value of contingent consideration (17,598) (1,980) (31,870) (8,084) Go-Private costs (21,003) — (21,003) — Transaction closing costs — — (17,668) — Transaction-related partnership and integration expenses (3,436) (1,317) (15,872) (2,234) Income and other taxes 1,158 (470) 14,222 (3,289) Loss on extinguishment and modification of debt 151 (3,290) (7,387) (5,684) Transformation costs (634) (3,380) (5,929) (4,152) Gain on divestitures 921 — 921 290 Impairment of right-of-use assets (546) (66) (546) (1,254) All other expenses (11,455) (1,497) (20,097) (11,023) Adjusted selling, operating and administrative expense $ 71,375 $ 47,470 $ 214,002 $ 147,186 Selling, operating and administrative expense ratio 47 % 34 % 41 % 31 % Adjusted selling, operating and administrative expense ratio 15 % 13 % 14 % 13 % Appendix
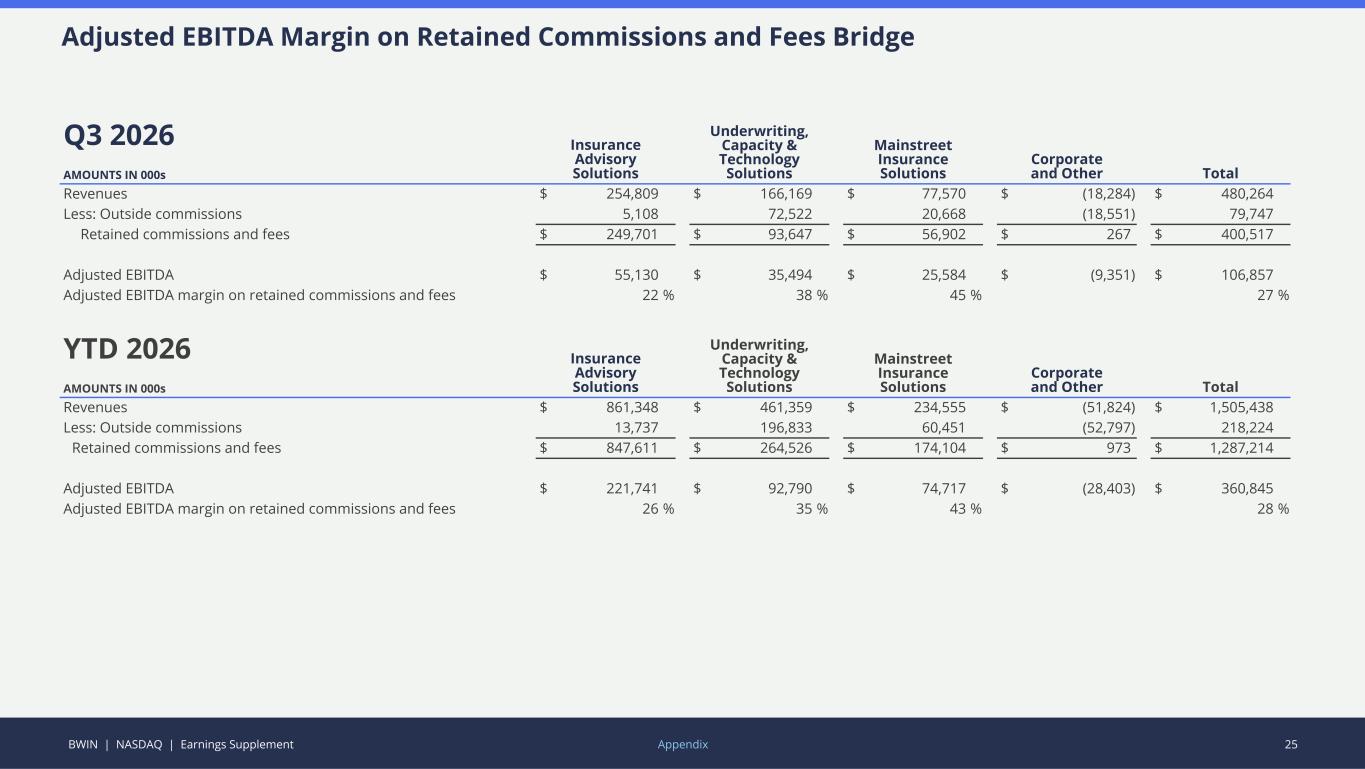
BWIN | NASDAQ | Earnings Supplement 25Appendix Q3 2026 Insurance Advisory Solutions Underwriting, Capacity & Technology Solutions Mainstreet Insurance Solutions Corporate and Other TotalAMOUNTS IN 000s Revenues $ 254,809 $ 166,169 $ 77,570 $ (18,284) $ 480,264 Less: Outside commissions 5,108 72,522 20,668 (18,551) 79,747 Retained commissions and fees $ 249,701 $ 93,647 $ 56,902 $ 267 $ 400,517 Adjusted EBITDA $ 55,130 $ 35,494 $ 25,584 $ (9,351) $ 106,857 Adjusted EBITDA margin on retained commissions and fees 22 % 38 % 45 % 27 % YTD 2026 Insurance Advisory Solutions Underwriting, Capacity & Technology Solutions Mainstreet Insurance Solutions Corporate and Other TotalAMOUNTS IN 000s Revenues $ 861,348 $ 461,359 $ 234,555 $ (51,824) $ 1,505,438 Less: Outside commissions 13,737 196,833 60,451 (52,797) 218,224 Retained commissions and fees $ 847,611 $ 264,526 $ 174,104 $ 973 $ 1,287,214 Adjusted EBITDA $ 221,741 $ 92,790 $ 74,717 $ (28,403) $ 360,845 Adjusted EBITDA margin on retained commissions and fees 26 % 35 % 43 % 28 % Adjusted EBITDA Margin on Retained Commissions and Fees Bridge
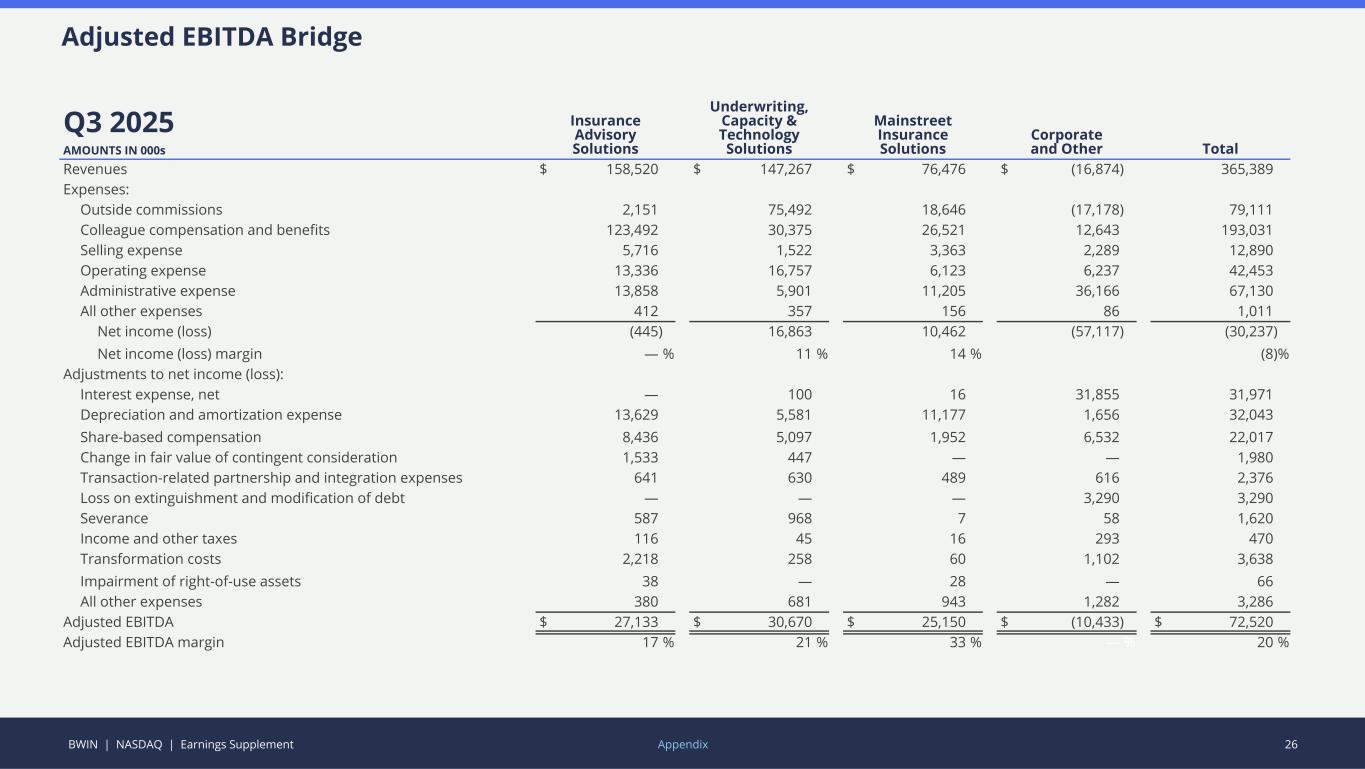
BWIN | NASDAQ | Earnings Supplement 26 Q3 2025 Insurance Advisory Solutions Underwriting, Capacity & Technology Solutions Mainstreet Insurance Solutions Corporate and Other TotalAMOUNTS IN 000s Revenues $ 158,520 $ 147,267 $ 76,476 $ (16,874) 365,389 Expenses: Outside commissions 2,151 75,492 18,646 (17,178) 79,111 Colleague compensation and benefits 123,492 30,375 26,521 12,643 193,031 Selling expense 5,716 1,522 3,363 2,289 12,890 Operating expense 13,336 16,757 6,123 6,237 42,453 Administrative expense 13,858 5,901 11,205 36,166 67,130 All other expenses 412 357 156 86 1,011 Net income (loss) (445) 16,863 10,462 (57,117) (30,237) Net income (loss) margin — % 11 % 14 % (8) % Adjustments to net income (loss): Interest expense, net — 100 16 31,855 31,971 Depreciation and amortization expense 13,629 5,581 11,177 1,656 32,043 Share-based compensation 8,436 5,097 1,952 6,532 22,017 Change in fair value of contingent consideration 1,533 447 — — 1,980 Transaction-related partnership and integration expenses 641 630 489 616 2,376 Loss on extinguishment and modification of debt — — — 3,290 3,290 Severance 587 968 7 58 1,620 Income and other taxes 116 45 16 293 470 Transformation costs 2,218 258 60 1,102 3,638 Impairment of right-of-use assets 38 — 28 — 66 All other expenses 380 681 943 1,282 3,286 Adjusted EBITDA $ 27,133 $ 30,670 $ 25,150 $ (10,433) $ 72,520 Adjusted EBITDA margin 17 % 21 % 33 % — % 20 % Appendix Adjusted EBITDA Bridge
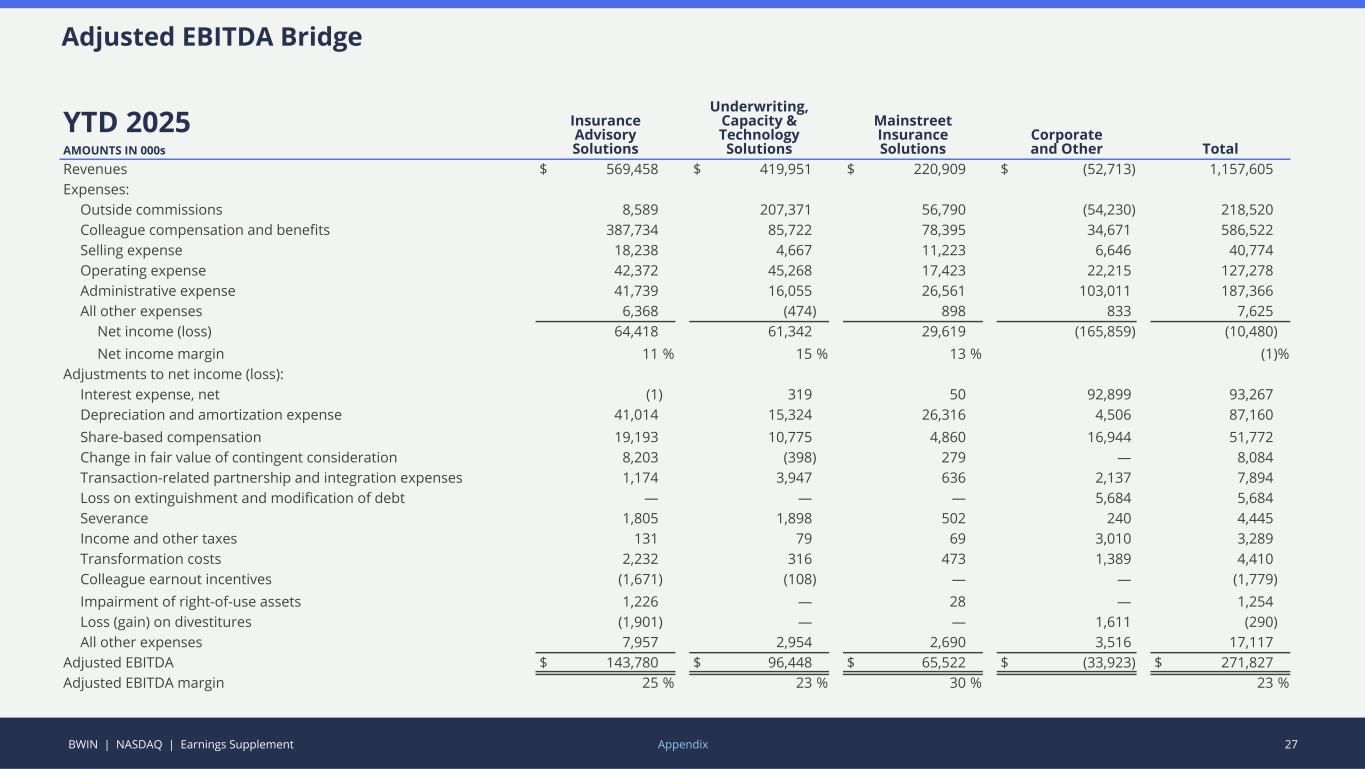
BWIN | NASDAQ | Earnings Supplement 27 YTD 2025 Insurance Advisory Solutions Underwriting, Capacity & Technology Solutions Mainstreet Insurance Solutions Corporate and Other TotalAMOUNTS IN 000s Revenues $ 569,458 $ 419,951 $ 220,909 $ (52,713) 1,157,605 Expenses: Outside commissions 8,589 207,371 56,790 (54,230) 218,520 Colleague compensation and benefits 387,734 85,722 78,395 34,671 586,522 Selling expense 18,238 4,667 11,223 6,646 40,774 Operating expense 42,372 45,268 17,423 22,215 127,278 Administrative expense 41,739 16,055 26,561 103,011 187,366 All other expenses 6,368 (474) 898 833 7,625 Net income (loss) 64,418 61,342 29,619 (165,859) (10,480) Net income margin 11 % 15 % 13 % (1) % Adjustments to net income (loss): Interest expense, net (1) 319 50 92,899 93,267 Depreciation and amortization expense 41,014 15,324 26,316 4,506 87,160 Share-based compensation 19,193 10,775 4,860 16,944 51,772 Change in fair value of contingent consideration 8,203 (398) 279 — 8,084 Transaction-related partnership and integration expenses 1,174 3,947 636 2,137 7,894 Loss on extinguishment and modification of debt — — — 5,684 5,684 Severance 1,805 1,898 502 240 4,445 Income and other taxes 131 79 69 3,010 3,289 Transformation costs 2,232 316 473 1,389 4,410 Colleague earnout incentives (1,671) (108) — — (1,779) Impairment of right-of-use assets 1,226 — 28 — 1,254 Loss (gain) on divestitures (1,901) — — 1,611 (290) All other expenses 7,957 2,954 2,690 3,516 17,117 Adjusted EBITDA $ 143,780 $ 96,448 $ 65,522 $ (33,923) $ 271,827 Adjusted EBITDA margin 25 % 23 % 30 % 23 % Appendix Adjusted EBITDA Bridge
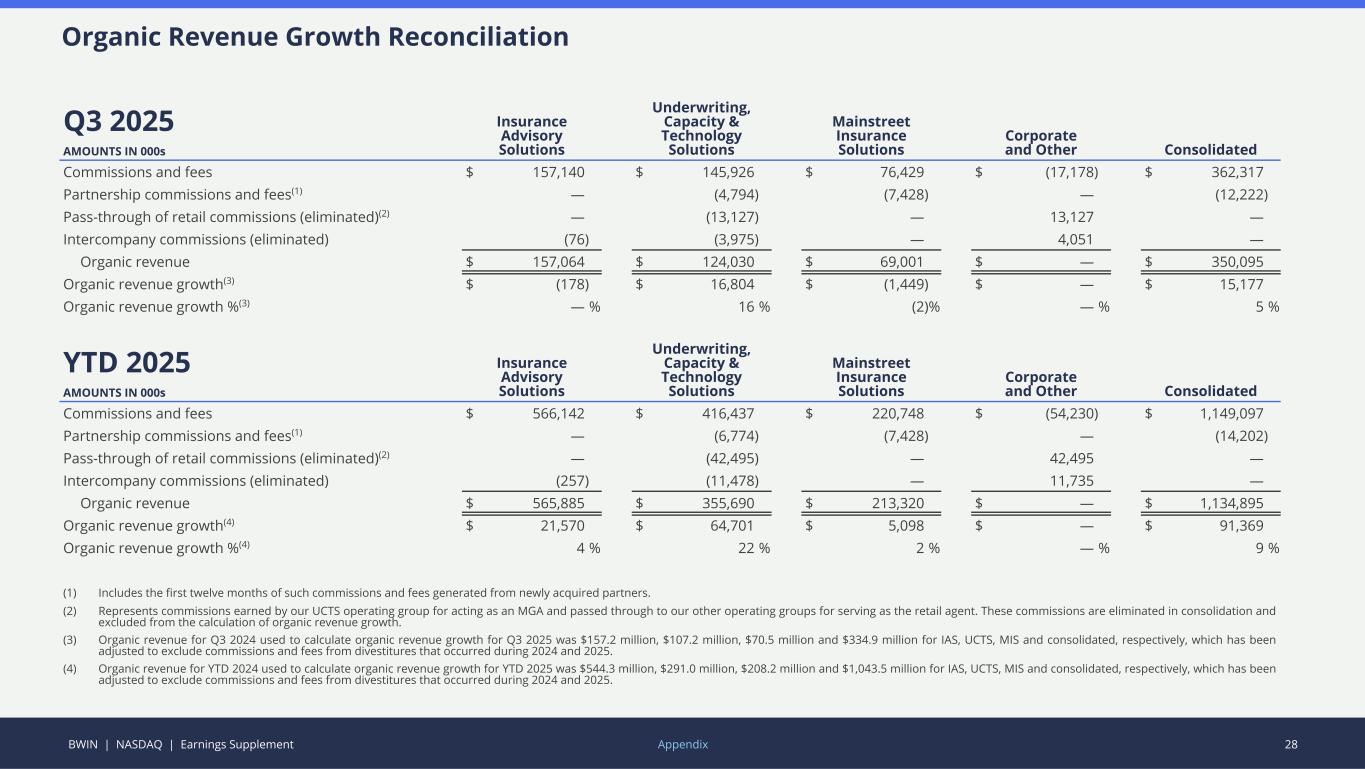
BWIN | NASDAQ | Earnings Supplement 28 Q3 2025 Insurance Advisory Solutions Underwriting, Capacity & Technology Solutions Mainstreet Insurance Solutions Corporate and Other ConsolidatedAMOUNTS IN 000s Commissions and fees $ 157,140 $ 145,926 $ 76,429 $ (17,178) $ 362,317 Partnership commissions and fees(1) — (4,794) (7,428) — (12,222) Pass-through of retail commissions (eliminated)(2) — (13,127) — 13,127 — Intercompany commissions (eliminated) (76) (3,975) — 4,051 — Organic revenue $ 157,064 $ 124,030 $ 69,001 $ — $ 350,095 Organic revenue growth(3) $ (178) $ 16,804 $ (1,449) $ — $ 15,177 Organic revenue growth %(3) — % 16 % (2) % — % 5 % YTD 2025 Insurance Advisory Solutions Underwriting, Capacity & Technology Solutions Mainstreet Insurance Solutions Corporate and Other ConsolidatedAMOUNTS IN 000s Commissions and fees $ 566,142 $ 416,437 $ 220,748 $ (54,230) $ 1,149,097 Partnership commissions and fees(1) — (6,774) (7,428) — (14,202) Pass-through of retail commissions (eliminated)(2) — (42,495) — 42,495 — Intercompany commissions (eliminated) (257) (11,478) — 11,735 — Organic revenue $ 565,885 $ 355,690 $ 213,320 $ — $ 1,134,895 Organic revenue growth(4) $ 21,570 $ 64,701 $ 5,098 $ — $ 91,369 Organic revenue growth %(4) 4 % 22 % 2 % — % 9 % (1) Includes the first twelve months of such commissions and fees generated from newly acquired partners. (2) Represents commissions earned by our UCTS operating group for acting as an MGA and passed through to our other operating groups for serving as the retail agent. These commissions are eliminated in consolidation and excluded from the calculation of organic revenue growth. (3) Organic revenue for Q3 2024 used to calculate organic revenue growth for Q3 2025 was $157.2 million, $107.2 million, $70.5 million and $334.9 million for IAS, UCTS, MIS and consolidated, respectively, which has been adjusted to exclude commissions and fees from divestitures that occurred during 2024 and 2025. (4) Organic revenue for YTD 2024 used to calculate organic revenue growth for YTD 2025 was $544.3 million, $291.0 million, $208.2 million and $1,043.5 million for IAS, UCTS, MIS and consolidated, respectively, which has been adjusted to exclude commissions and fees from divestitures that occurred during 2024 and 2025. Appendix Organic Revenue Growth Reconciliation
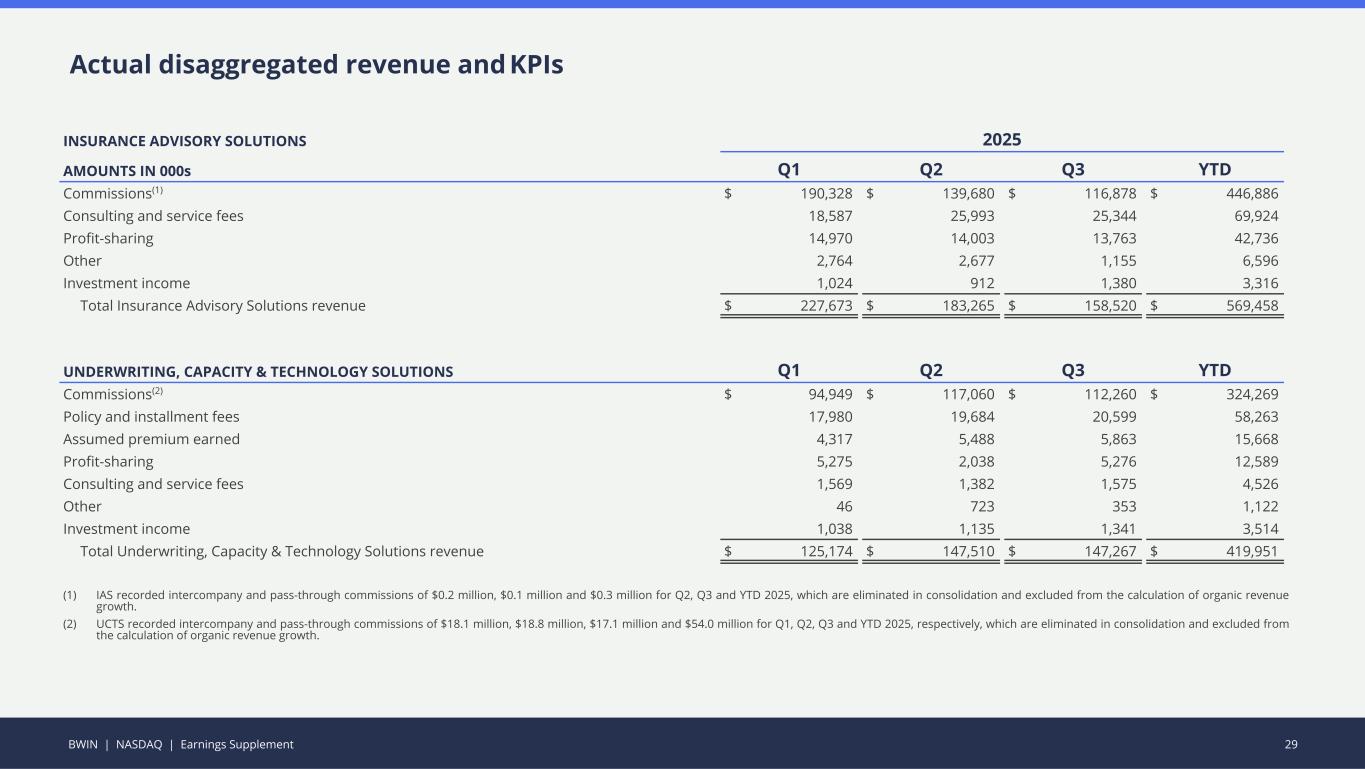
BWIN | NASDAQ | Earnings Supplement 29 Actual disaggregated revenue and KPIs INSURANCE ADVISORY SOLUTIONS 2025 AMOUNTS IN 000s Q1 Q2 Q3 YTD Commissions(1) $ 190,328 $ 139,680 $ 116,878 $ 446,886 Consulting and service fees 18,587 25,993 25,344 69,924 Profit-sharing 14,970 14,003 13,763 42,736 Other 2,764 2,677 1,155 6,596 Investment income 1,024 912 1,380 3,316 Total Insurance Advisory Solutions revenue $ 227,673 $ 183,265 $ 158,520 $ 569,458 UNDERWRITING, CAPACITY & TECHNOLOGY SOLUTIONS Q1 Q2 Q3 YTD Commissions(2) $ 94,949 $ 117,060 $ 112,260 $ 324,269 Policy and installment fees 17,980 19,684 20,599 58,263 Assumed premium earned 4,317 5,488 5,863 15,668 Profit-sharing 5,275 2,038 5,276 12,589 Consulting and service fees 1,569 1,382 1,575 4,526 Other 46 723 353 1,122 Investment income 1,038 1,135 1,341 3,514 Total Underwriting, Capacity & Technology Solutions revenue $ 125,174 $ 147,510 $ 147,267 $ 419,951 (1) IAS recorded intercompany and pass-through commissions of $0.2 million, $0.1 million and $0.3 million for Q2, Q3 and YTD 2025, which are eliminated in consolidation and excluded from the calculation of organic revenue growth. (2) UCTS recorded intercompany and pass-through commissions of $18.1 million, $18.8 million, $17.1 million and $54.0 million for Q1, Q2, Q3 and YTD 2025, respectively, which are eliminated in consolidation and excluded from the calculation of organic revenue growth.
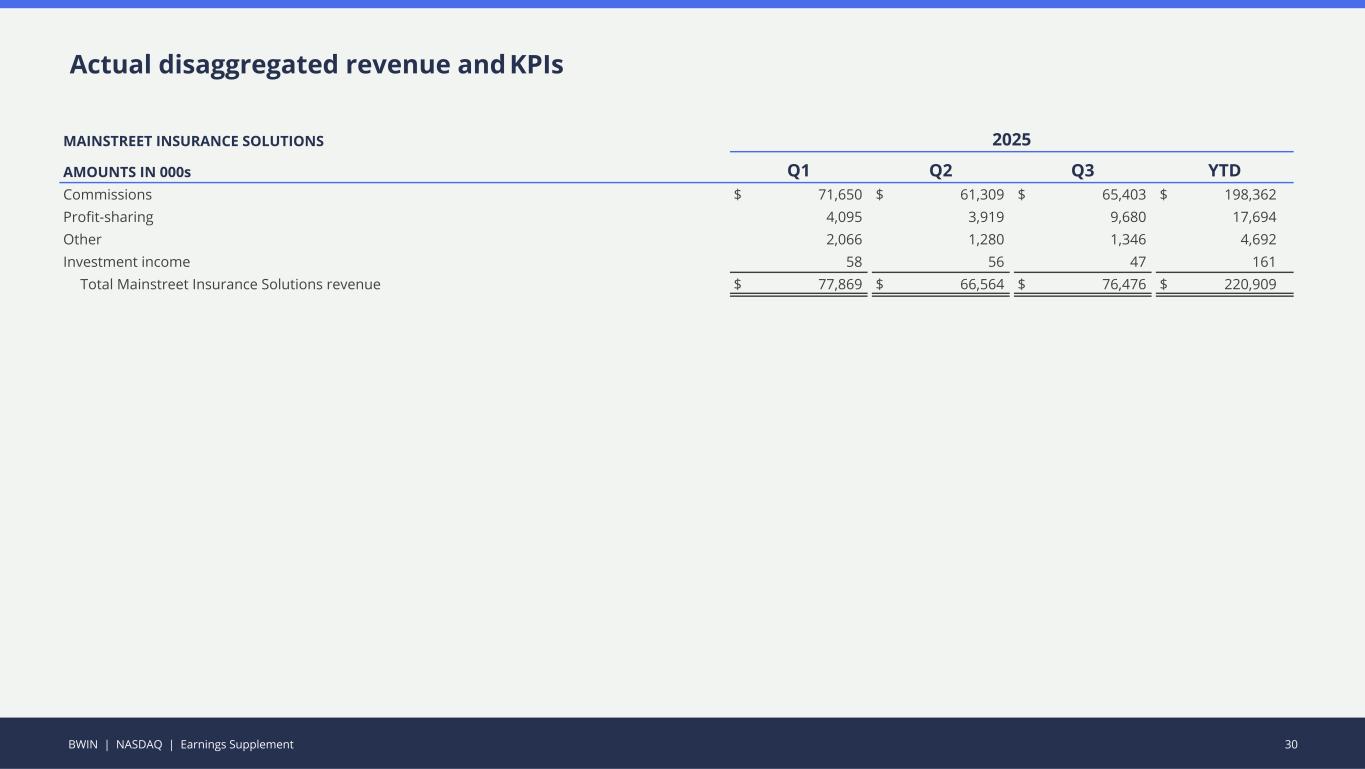
BWIN | NASDAQ | Earnings Supplement 30 Actual disaggregated revenue and KPIs MAINSTREET INSURANCE SOLUTIONS 2025 AMOUNTS IN 000s Q1 Q2 Q3 YTD Commissions $ 71,650 $ 61,309 $ 65,403 $ 198,362 Profit-sharing 4,095 3,919 9,680 17,694 Other 2,066 1,280 1,346 4,692 Investment income 58 56 47 161 Total Mainstreet Insurance Solutions revenue $ 77,869 $ 66,564 $ 76,476 $ 220,909
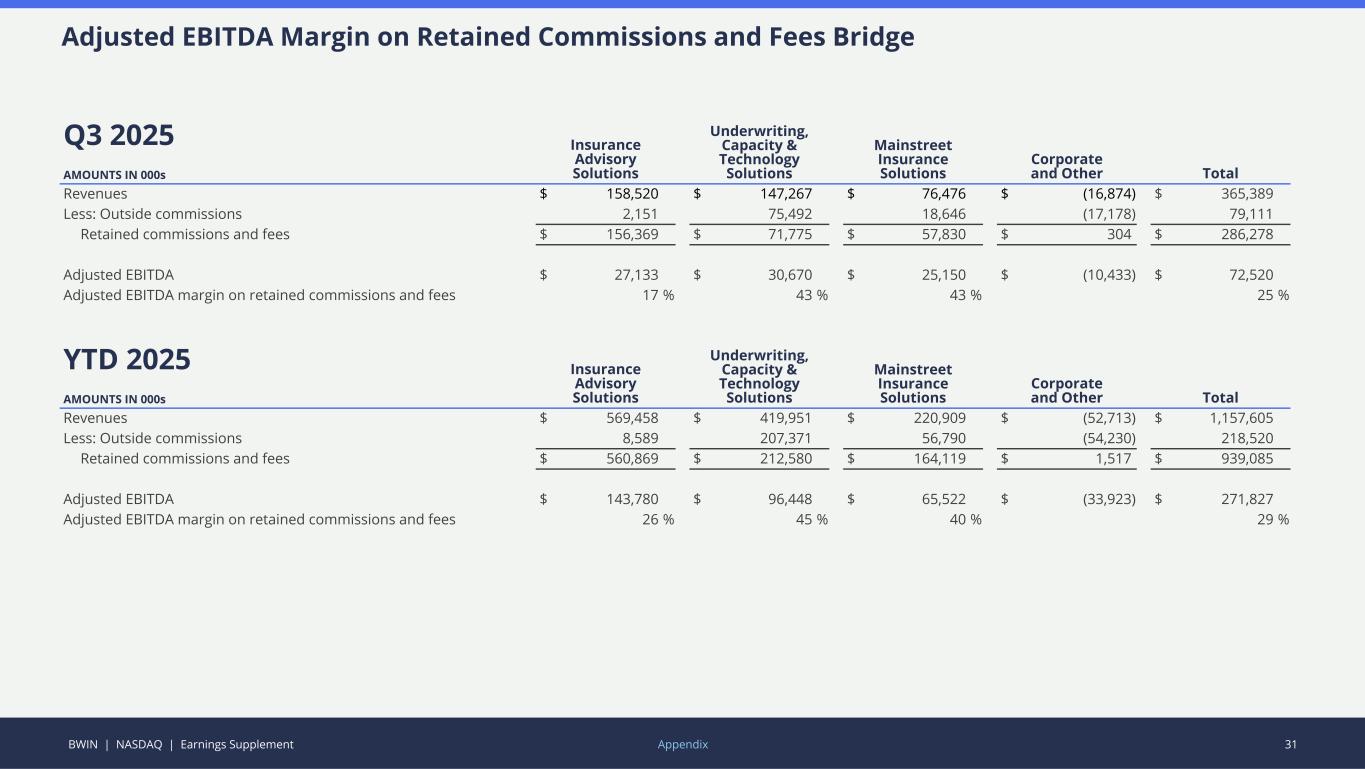
BWIN | NASDAQ | Earnings Supplement 31Appendix Q3 2025 Insurance Advisory Solutions Underwriting, Capacity & Technology Solutions Mainstreet Insurance Solutions Corporate and Other TotalAMOUNTS IN 000s Revenues $ 158,520 $ 147,267 $ 76,476 $ (16,874) $ 365,389 Less: Outside commissions 2,151 75,492 18,646 (17,178) 79,111 Retained commissions and fees $ 156,369 $ 71,775 $ 57,830 $ 304 $ 286,278 Adjusted EBITDA $ 27,133 $ 30,670 $ 25,150 $ (10,433) $ 72,520 Adjusted EBITDA margin on retained commissions and fees 17 % 43 % 43 % 25 % Adjusted EBITDA Margin on Retained Commissions and Fees Bridge YTD 2025 Insurance Advisory Solutions Underwriting, Capacity & Technology Solutions Mainstreet Insurance Solutions Corporate and Other TotalAMOUNTS IN 000s Revenues $ 569,458 $ 419,951 $ 220,909 $ (52,713) $ 1,157,605 Less: Outside commissions 8,589 207,371 56,790 (54,230) 218,520 Retained commissions and fees $ 560,869 $ 212,580 $ 164,119 $ 1,517 $ 939,085 Adjusted EBITDA $ 143,780 $ 96,448 $ 65,522 $ (33,923) $ 271,827 Adjusted EBITDA margin on retained commissions and fees 26 % 45 % 40 % 29 %
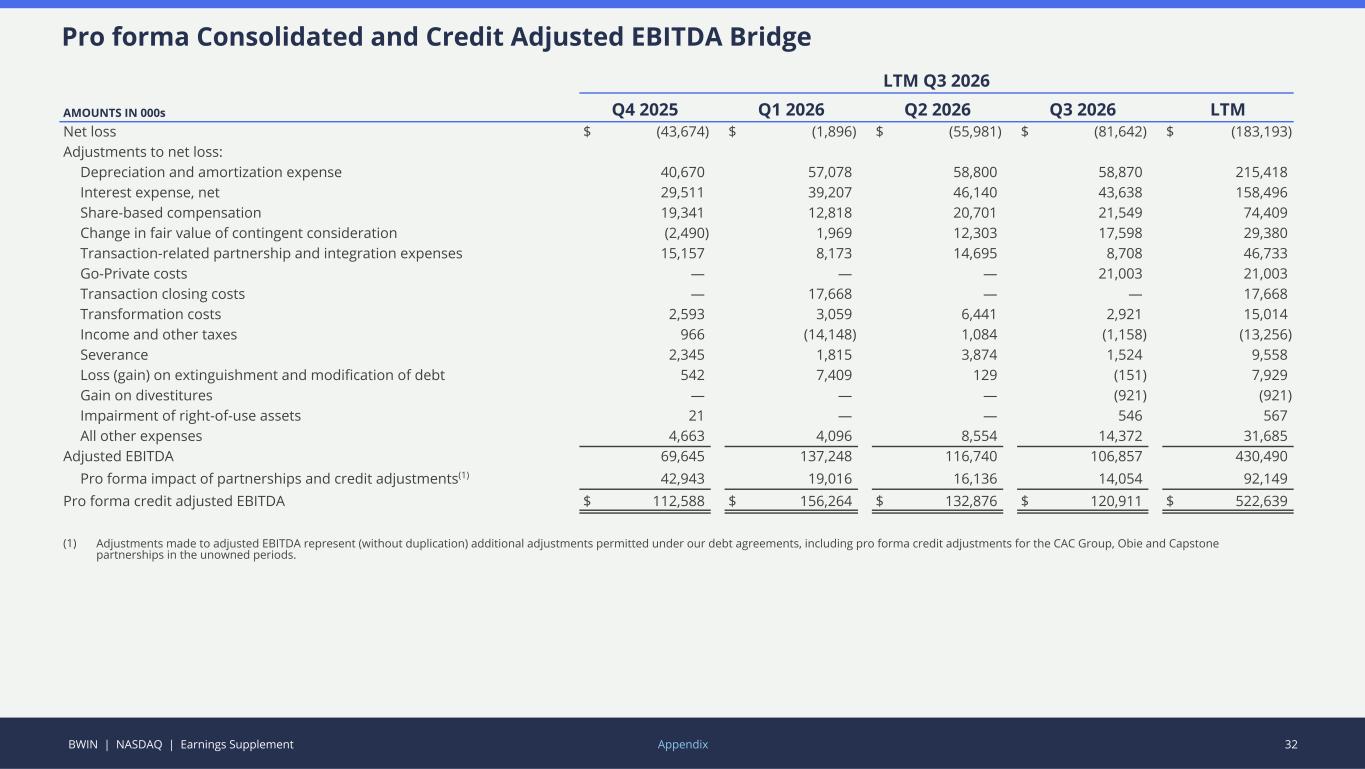
BWIN | NASDAQ | Earnings Supplement 32Appendix Pro forma Consolidated and Credit Adjusted EBITDA Bridge LTM Q3 2026 AMOUNTS IN 000s Q4 2025 Q1 2026 Q2 2026 Q3 2026 LTM Net loss $ (43,674) $ (1,896) $ (55,981) $ (81,642) $ (183,193) Adjustments to net loss: Depreciation and amortization expense 40,670 57,078 58,800 58,870 215,418 Interest expense, net 29,511 39,207 46,140 43,638 158,496 Share-based compensation 19,341 12,818 20,701 21,549 74,409 Change in fair value of contingent consideration (2,490) 1,969 12,303 17,598 29,380 Transaction-related partnership and integration expenses 15,157 8,173 14,695 8,708 46,733 Go-Private costs — — — 21,003 21,003 Transaction closing costs — 17,668 — — 17,668 Transformation costs 2,593 3,059 6,441 2,921 15,014 Income and other taxes 966 (14,148) 1,084 (1,158) (13,256) Severance 2,345 1,815 3,874 1,524 9,558 Loss (gain) on extinguishment and modification of debt 542 7,409 129 (151) 7,929 Gain on divestitures — — — (921) (921) Impairment of right-of-use assets 21 — — 546 567 All other expenses 4,663 4,096 8,554 14,372 31,685 Adjusted EBITDA 69,645 137,248 116,740 106,857 430,490 Pro forma impact of partnerships and credit adjustments(1) 42,943 19,016 16,136 14,054 92,149 Pro forma credit adjusted EBITDA $ 112,588 $ 156,264 $ 132,876 $ 120,911 $ 522,639 (1) Adjustments made to adjusted EBITDA represent (without duplication) additional adjustments permitted under our debt agreements, including pro forma credit adjustments for the CAC Group, Obie and Capstone partnerships in the unowned periods.

BWIN | NASDAQ | Earnings Supplement 33 T H E B A L D W I N G R O U P Thank You Investor Relations Bonnie Bishop, Executive Director, Investor Relations 813.259.8032 | IR@baldwin.com ir.baldwin.com