1 Hex #003666 Hex #007CBA Hex #80BEDD Hex #809BB3 Hex #CCD7E1 Hex #E7E6E6 Hex #F4F7FA Hex #BFBFBF Hex #7F7F7F Hex #55565A Hex #3F3F3F Hex #CCE5F1 Hex #D2D0E6 Hex #7773B5 1 2 3 7 8 4 9 10 5 6 11 13 14 12 W. P. Carey Inc. | NYSE: WPC Third Quarter 2026 50+ YEARS OF INVESTING FOR THE LONG RUN® Investor Presentation Exhibit 99.3
2 Hex #003666 Hex #007CBA Hex #80BEDD Hex #809BB3 Hex #CCD7E1 Hex #E7E6E6 Hex #F4F7FA Hex #BFBFBF Hex #7F7F7F Hex #55565A Hex #3F3F3F Hex #CCE5F1 Hex #D2D0E6 Hex #7773B5 1 2 3 7 8 4 9 10 5 6 11 13 14 12 Cautionary Statement Concerning Forward-Looking Statements All data presented herein is as of September 30, 2026 unless otherwise noted. Amounts may not sum to totals due to rounding. Past performance does not guarantee future results. This presentation includes non-GAAP financial measures and other metrics, disclosures of which are included in the Appendix. This presentation references the net lease “sector”, which includes a representative list of net lease REITs: ADC, BNL, EPRT, FCPT, GTY, NNN, NTST, O. Certain of the matters discussed in this communication constitute forward-looking statements within the meaning of the Securities Act of 1933 (as amended, the “Securities Act”) and the Securities Exchange Act of 1934 (as amended, the “Exchange Act”), both as amended by the Private Securities Litigation Reform Act of 1995. The forward-looking statements include, among other things, statements regarding the intent, belief or expectations of the Company and can be identified by the use of words such as “may,” “will,” “should,” “would,” “will be,” “will continue,” “will likely result,” “believe,” “project,” “expect,” “anticipate,” “intend,” “estimate,” “opportunities,” “possibility,” “strategy,” “maintain” or the negative version of these words and other comparable terms. These forward-looking statements include, but are not limited to, statements that are not historical facts. These statements are based on the current expectations of our management, and it is important to note that our actual results could be materially different from those projected in such forward-looking statements. There are a number of risks and uncertainties that could cause actual results to differ materially from the forward-looking statements. Other unknown or unpredictable risks or uncertainties, like the risks related to fluctuating interest rates, the impact of inflation and tariffs on our tenants and us, the effects of pandemics and global outbreaks of contagious diseases and domestic or geopolitical crises (such as terrorism, military conflict, war or the perception that hostilities may be imminent), political instability or civil unrest, or other conflict, and those additional risk factors discussed in reports that we have filed with the SEC, could also have material adverse effects on our future results, performance or achievements. Discussions of some of these other important factors and assumptions are contained in W. P. Carey’s filings with the SEC and are available at the SEC’s website at http://www.sec.gov, including Part I, Item 1A. Risk Factors in W. P. Carey’s Annual Report on Form 10-K for the fiscal year ended December 31, 2025. Investors are cautioned not to place undue reliance on these forward-looking statements, which speak only as of the date of this communication, unless noted otherwise. Except as required under the federal securities laws and the rules and regulations of the SEC, W. P. Carey does not undertake any obligation to release publicly any revisions to the forward-looking statements to reflect events or circumstances after the date of this communication or to reflect the occurrence of unanticipated events.
3 Hex #003666 Hex #007CBA Hex #80BEDD Hex #809BB3 Hex #CCD7E1 Hex #E7E6E6 Hex #F4F7FA Hex #BFBFBF Hex #7F7F7F Hex #55565A Hex #3F3F3F Hex #CCE5F1 Hex #D2D0E6 Hex #7773B5 1 2 3 7 8 4 9 10 5 6 11 13 14 12 4 12 23 33 39 45 Key Highlights Platform Overview Portfolio Balance Sheet Case Studies Corporate Responsibility Table of Contents
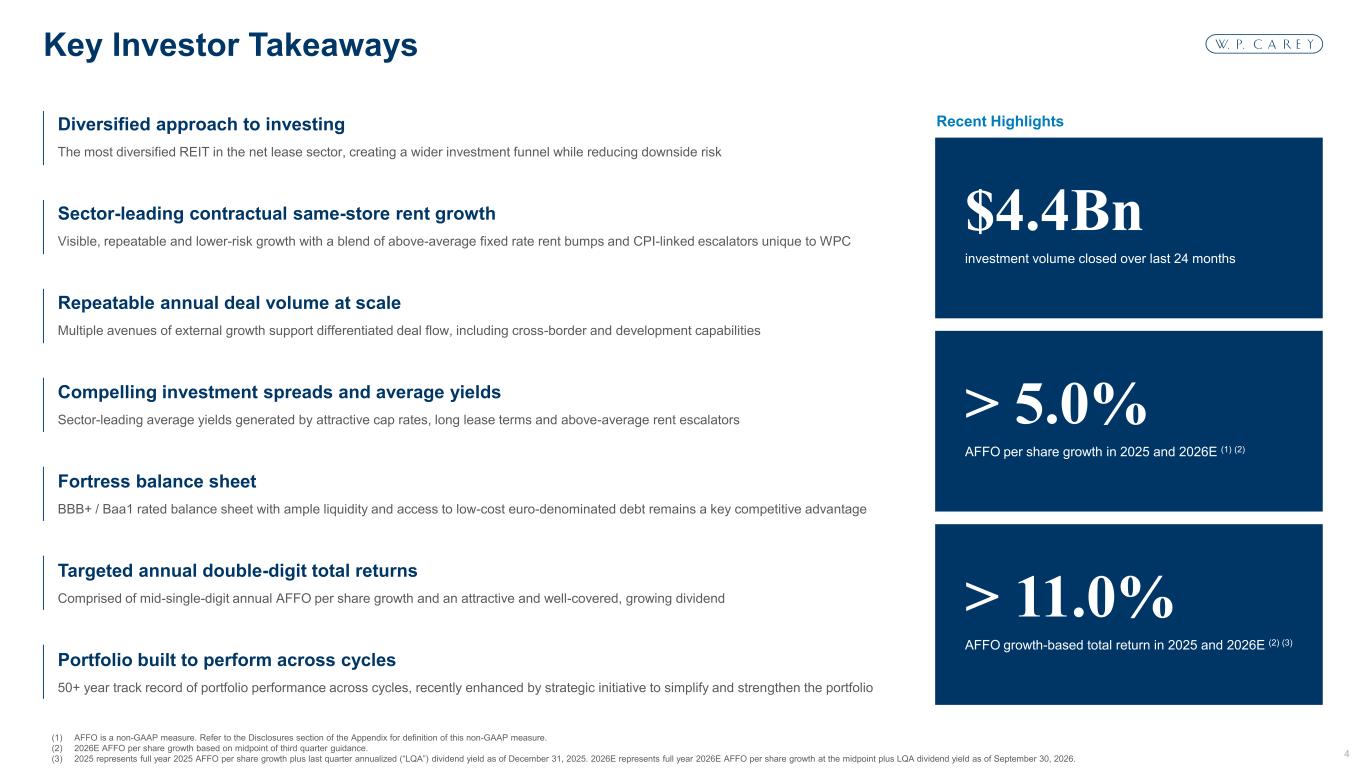
4 Hex #003666 Hex #007CBA Hex #80BEDD Hex #809BB3 Hex #CCD7E1 Hex #E7E6E6 Hex #F4F7FA Hex #BFBFBF Hex #7F7F7F Hex #55565A Hex #3F3F3F Hex #CCE5F1 Hex #D2D0E6 Hex #7773B5 1 2 3 7 8 4 9 10 5 6 11 13 14 12 (1) AFFO is a non-GAAP measure. Refer to the Disclosures section of the Appendix for definition of this non-GAAP measure. (2) 2026E AFFO per share growth based on midpoint of third quarter guidance. (3) 2025 represents full year 2025 AFFO per share growth plus last quarter annualized (“LQA”) dividend yield as of December 31, 2025. 2026E represents full year 2026E AFFO per share growth at the midpoint plus LQA dividend yield as of September 30, 2026. Key Investor Takeaways Diversified approach to investing The most diversified REIT in the net lease sector, creating a wider investment funnel while reducing downside risk Sector-leading contractual same-store rent growth Visible, repeatable and lower-risk growth with a blend of above-average fixed rate rent bumps and CPI-linked escalators unique to WPC Repeatable annual deal volume at scale Multiple avenues of external growth support differentiated deal flow, including cross-border and development capabilities Compelling investment spreads and average yields Sector-leading average yields generated by attractive cap rates, long lease terms and above-average rent escalators Fortress balance sheet BBB+ / Baa1 rated balance sheet with ample liquidity and access to low-cost euro-denominated debt remains a key competitive advantage Targeted annual double-digit total returns Comprised of mid-single-digit annual AFFO per share growth and an attractive and well-covered, growing dividend Portfolio built to perform across cycles 50+ year track record of portfolio performance across cycles, recently enhanced by strategic initiative to simplify and strengthen the portfolio $4.4Bn investment volume closed over last 24 months > 5.0% AFFO per share growth in 2025 and 2026E (1) (2) > 11.0% AFFO growth-based total return in 2025 and 2026E (2) (3) Recent Highlights
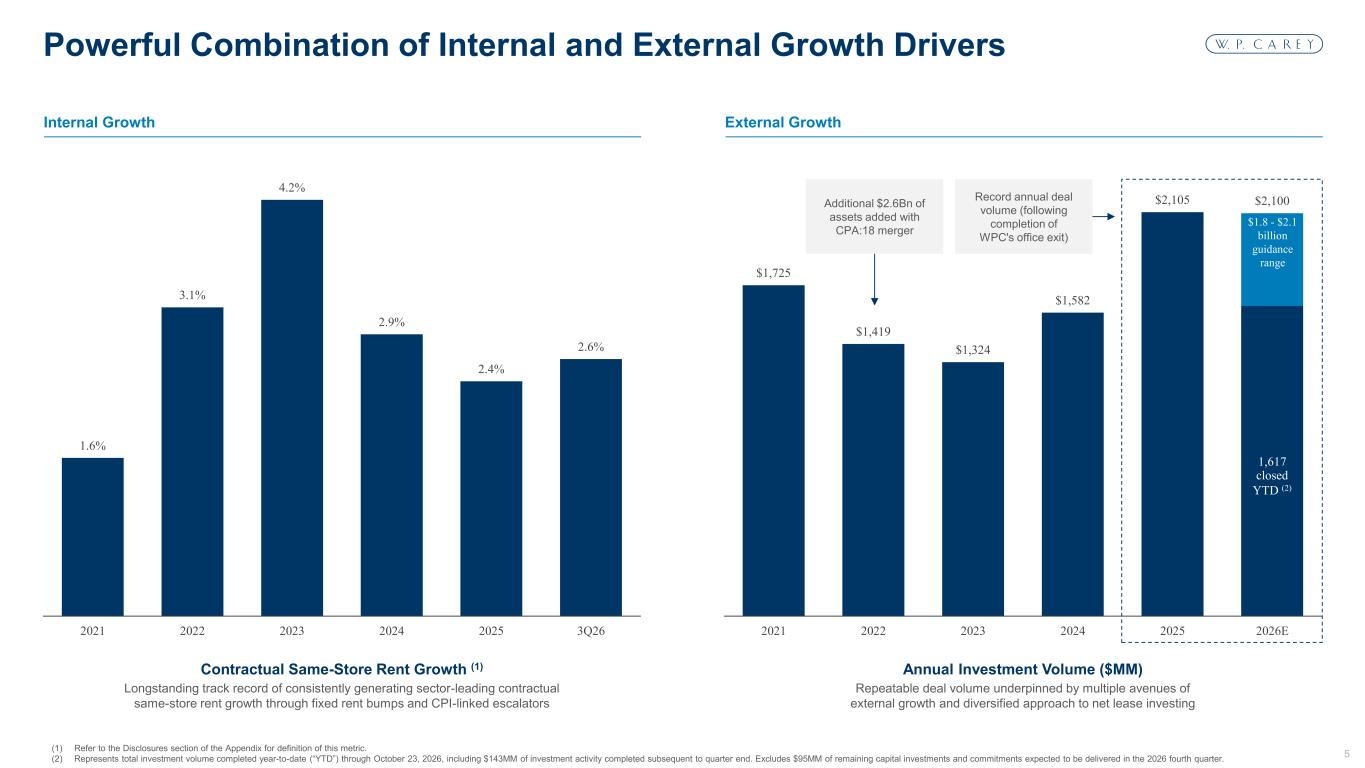
5 Hex #003666 Hex #007CBA Hex #80BEDD Hex #809BB3 Hex #CCD7E1 Hex #E7E6E6 Hex #F4F7FA Hex #BFBFBF Hex #7F7F7F Hex #55565A Hex #3F3F3F Hex #CCE5F1 Hex #D2D0E6 Hex #7773B5 1 2 3 7 8 4 9 10 5 6 11 13 14 12 1,617 $1,725 $1,419 $1,324 $1,582 $2,105 $2,100 2021 2022 2023 2024 2025 2026E 1.6% 3.1% 4.2% 2.9% 2.4% 2.6% 2021 2022 2023 2024 2025 3Q26 Internal Growth External Growth (1) Refer to the Disclosures section of the Appendix for definition of this metric. (2) Represents total investment volume completed year-to-date (“YTD”) through October 23, 2026, including $143MM of investment activity completed subsequent to quarter end. Excludes $95MM of remaining capital investments and commitments expected to be delivered in the 2026 fourth quarter. Powerful Combination of Internal and External Growth Drivers Repeatable deal volume underpinned by multiple avenues of external growth and diversified approach to net lease investing Longstanding track record of consistently generating sector-leading contractual same-store rent growth through fixed rent bumps and CPI-linked escalators $1.8 - $2.1 billion guidance range Annual Investment Volume ($MM)Contractual Same-Store Rent Growth (1) closed YTD (2) Record annual deal volume (following completion of WPC's office exit) Additional $2.6Bn of assets added with CPA:18 merger
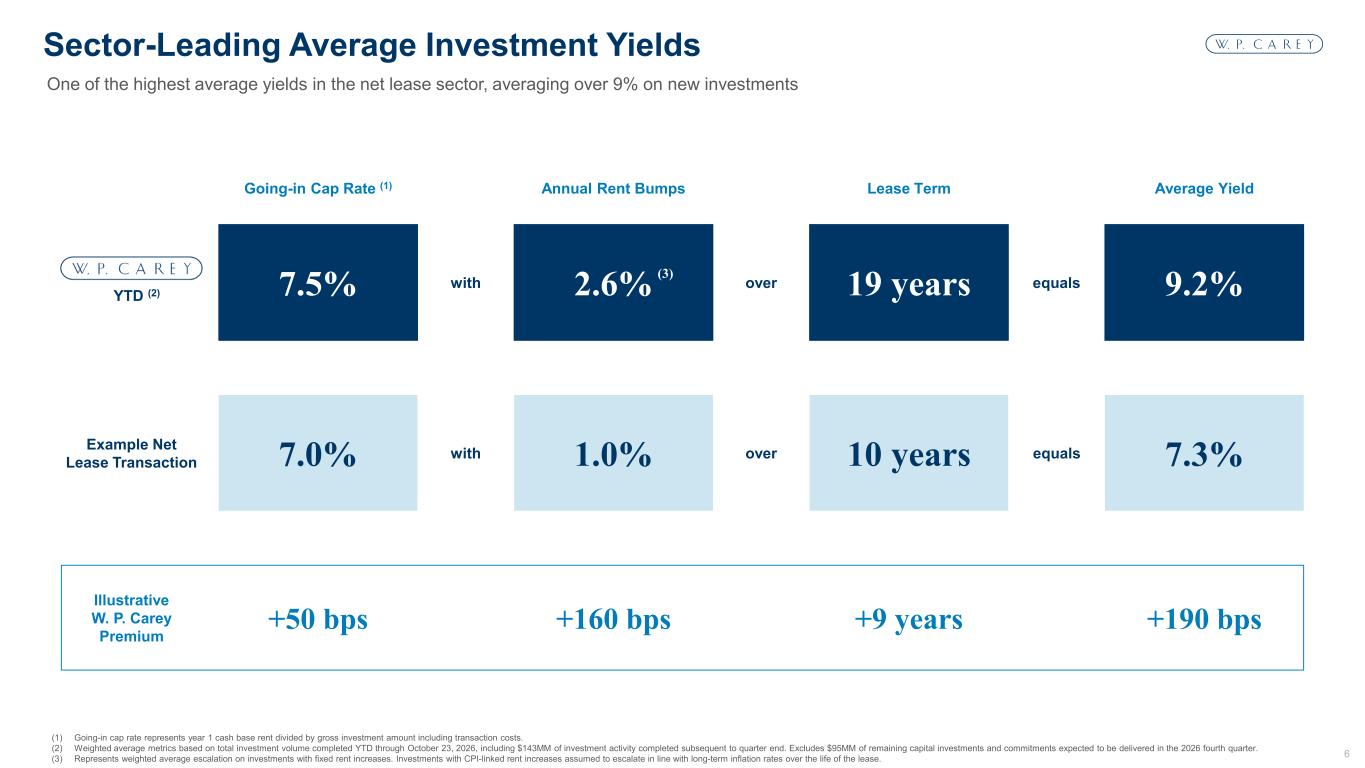
6 Hex #003666 Hex #007CBA Hex #80BEDD Hex #809BB3 Hex #CCD7E1 Hex #E7E6E6 Hex #F4F7FA Hex #BFBFBF Hex #7F7F7F Hex #55565A Hex #3F3F3F Hex #CCE5F1 Hex #D2D0E6 Hex #7773B5 1 2 3 7 8 4 9 10 5 6 11 13 14 12 (1) Going-in cap rate represents year 1 cash base rent divided by gross investment amount including transaction costs. (2) Weighted average metrics based on total investment volume completed YTD through October 23, 2026, including $143MM of investment activity completed subsequent to quarter end. Excludes $95MM of remaining capital investments and commitments expected to be delivered in the 2026 fourth quarter. (3) Represents weighted average escalation on investments with fixed rent increases. Investments with CPI-linked rent increases assumed to escalate in line with long-term inflation rates over the life of the lease. One of the highest average yields in the net lease sector, averaging over 9% on new investments Sector-Leading Average Investment Yields +190 bps+160 bps +9 years +50 bps 7.5% 2.6% 19 years 9.2%with over equals YTD (2) overwith equals7.0% 1.0% 10 years 7.3% Example Net Lease Transaction Going-in Cap Rate (1) Annual Rent Bumps Lease Term Average Yield Illustrative W. P. Carey Premium (3)
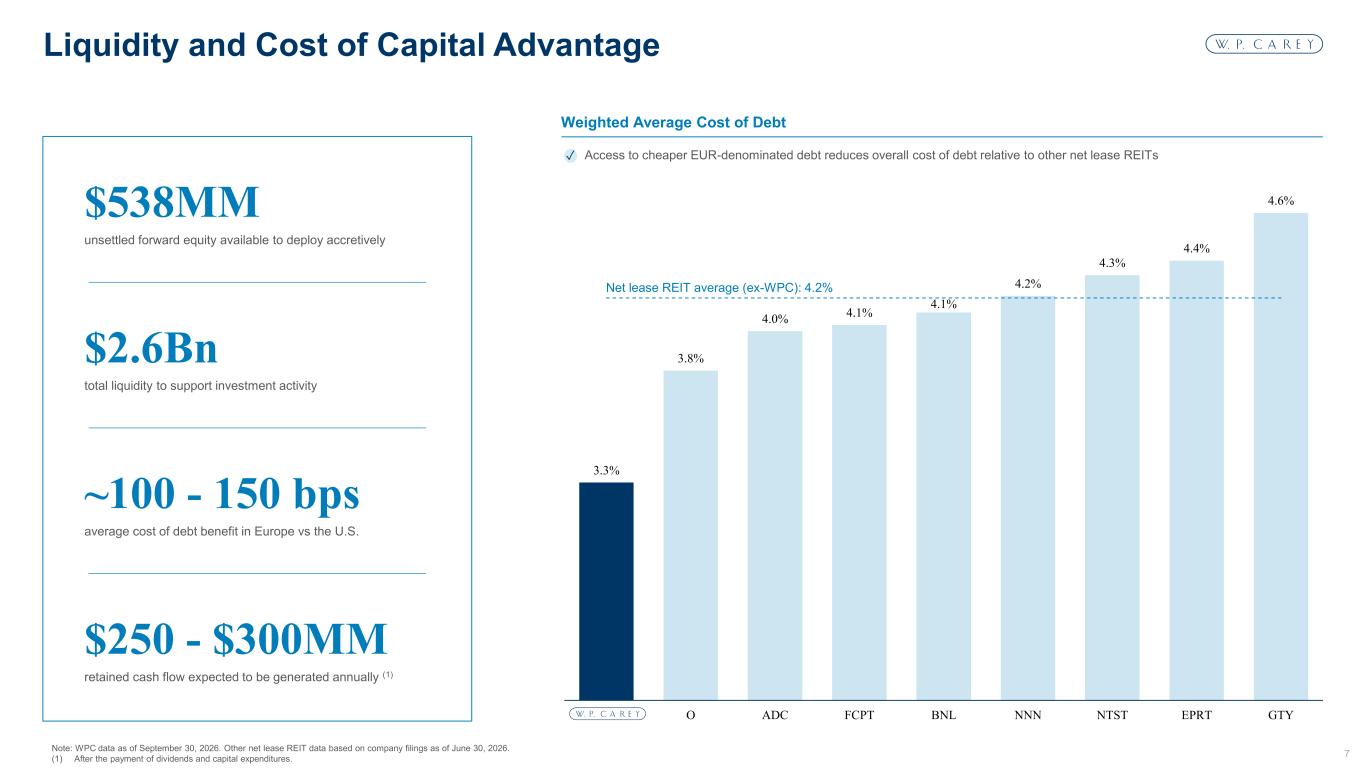
7 Hex #003666 Hex #007CBA Hex #80BEDD Hex #809BB3 Hex #CCD7E1 Hex #E7E6E6 Hex #F4F7FA Hex #BFBFBF Hex #7F7F7F Hex #55565A Hex #3F3F3F Hex #CCE5F1 Hex #D2D0E6 Hex #7773B5 1 2 3 7 8 4 9 10 5 6 11 13 14 12 Note: WPC data as of September 30, 2026. Other net lease REIT data based on company filings as of June 30, 2026. (1) After the payment of dividends and capital expenditures. Liquidity and Cost of Capital Advantage 3.3% 3.8% 4.0% 4.1% 4.1% 4.2% 4.3% 4.4% 4.6% O ADC FCPT BNL NNN NTST EPRT GTY $2.6Bn total liquidity to support investment activity ~100 - 150 bps average cost of debt benefit in Europe vs the U.S. $250 - $300MM retained cash flow expected to be generated annually (1) Net lease REIT average (ex-WPC): 4.2% $538MM unsettled forward equity available to deploy accretively Access to cheaper EUR-denominated debt reduces overall cost of debt relative to other net lease REITs✓ Weighted Average Cost of Debt
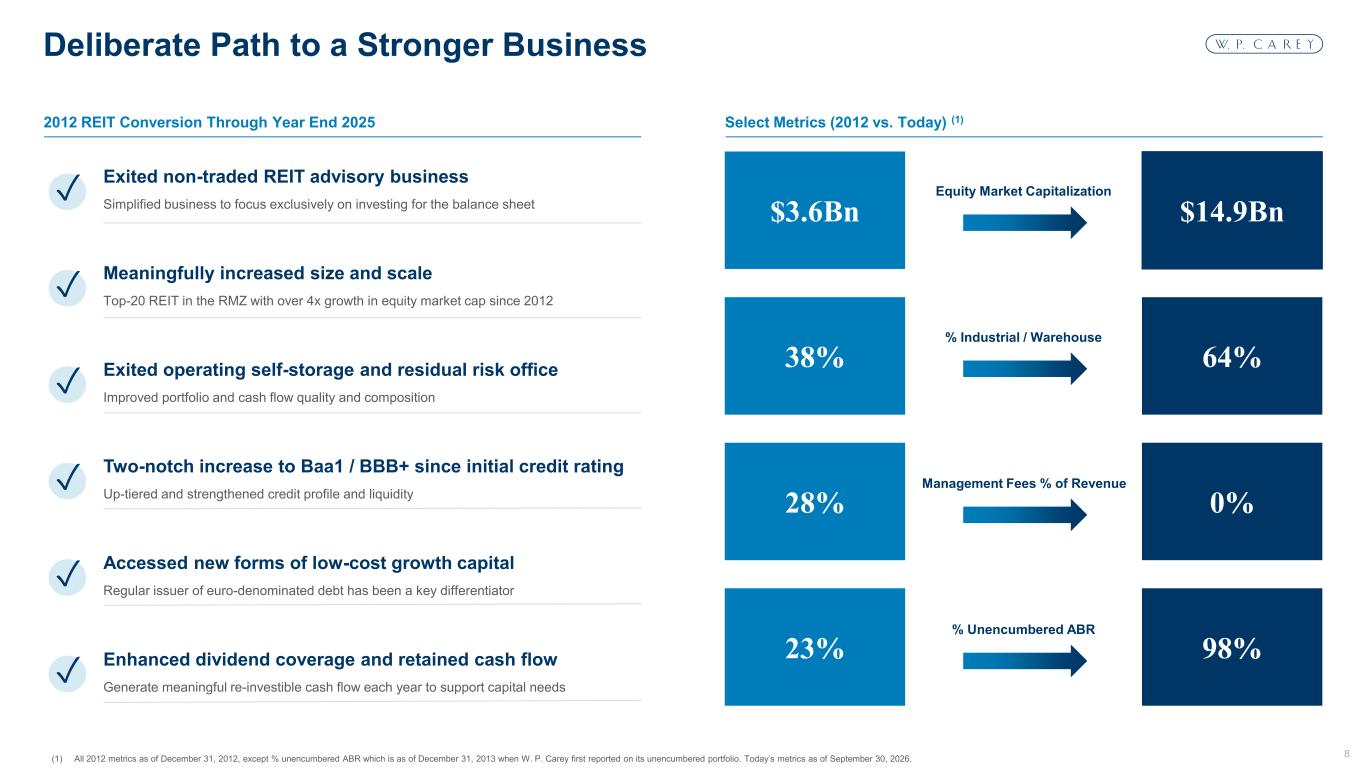
8 Hex #003666 Hex #007CBA Hex #80BEDD Hex #809BB3 Hex #CCD7E1 Hex #E7E6E6 Hex #F4F7FA Hex #BFBFBF Hex #7F7F7F Hex #55565A Hex #3F3F3F Hex #CCE5F1 Hex #D2D0E6 Hex #7773B5 1 2 3 7 8 4 9 10 5 6 11 13 14 12 ✓ 2012 REIT Conversion Through Year End 2025 Select Metrics (2012 vs. Today) (1) (1) All 2012 metrics as of December 31, 2012, except % unencumbered ABR which is as of December 31, 2013 when W. P. Carey first reported on its unencumbered portfolio. Today’s metrics as of September 30, 2026. Deliberate Path to a Stronger Business Exited non-traded REIT advisory business Simplified business to focus exclusively on investing for the balance sheet Meaningfully increased size and scale Top-20 REIT in the RMZ with over 4x growth in equity market cap since 2012 Exited operating self-storage and residual risk office Improved portfolio and cash flow quality and composition Two-notch increase to Baa1 / BBB+ since initial credit rating Up-tiered and strengthened credit profile and liquidity Accessed new forms of low-cost growth capital Regular issuer of euro-denominated debt has been a key differentiator Enhanced dividend coverage and retained cash flow Generate meaningful re-investible cash flow each year to support capital needs 28% 0% 38% 64% $3.6Bn $14.9Bn 23% 98% Equity Market Capitalization % Unencumbered ABR % Industrial / Warehouse Management Fees % of Revenue ✓ ✓ ✓ ✓ ✓
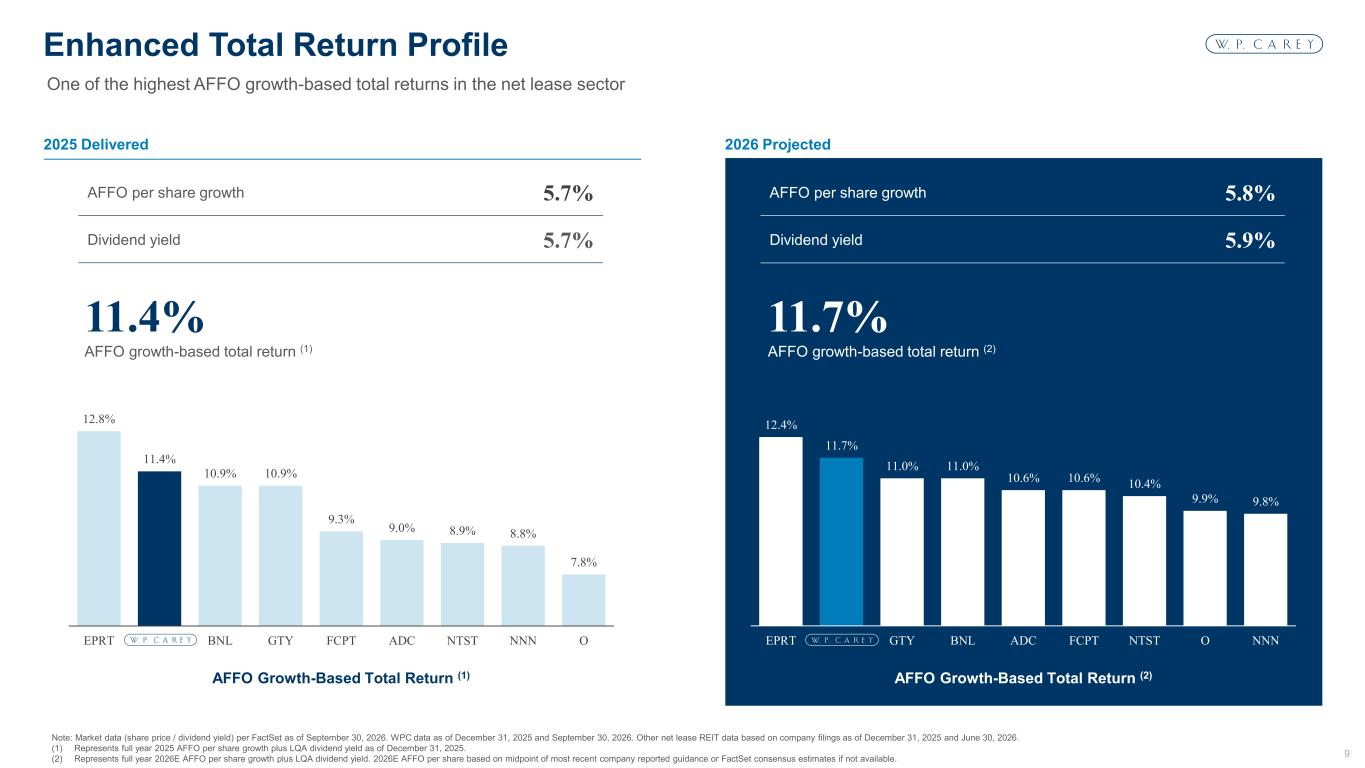
9 Hex #003666 Hex #007CBA Hex #80BEDD Hex #809BB3 Hex #CCD7E1 Hex #E7E6E6 Hex #F4F7FA Hex #BFBFBF Hex #7F7F7F Hex #55565A Hex #3F3F3F Hex #CCE5F1 Hex #D2D0E6 Hex #7773B5 1 2 3 7 8 4 9 10 5 6 11 13 14 12 2025 Delivered 2026 Projected Note: Market data (share price / dividend yield) per FactSet as of September 30, 2026. WPC data as of December 31, 2025 and September 30, 2026. Other net lease REIT data based on company filings as of December 31, 2025 and June 30, 2026. (1) Represents full year 2025 AFFO per share growth plus LQA dividend yield as of December 31, 2025. (2) Represents full year 2026E AFFO per share growth plus LQA dividend yield. 2026E AFFO per share based on midpoint of most recent company reported guidance or FactSet consensus estimates if not available. Enhanced Total Return Profile One of the highest AFFO growth-based total returns in the net lease sector 12.8% 11.4% 10.9% 10.9% 9.3% 9.0% 8.9% 8.8% 7.8% EPRT BNL GTY FCPT ADC NTST NNN O AFFO Growth-Based Total Return (1) 11.4% AFFO growth-based total return (1) AFFO per share growth 5.7% Dividend yield 5.7% 11.7% AFFO growth-based total return (2) AFFO per share growth 5.8% Dividend yield 5.9% 12.4% 11.7% 11.0% 11.0% 10.6% 10.6% 10.4% 9.9% 9.8% EPRT GTY BNL ADC FCPT NTST O NNN AFFO Growth-Based Total Return (2)
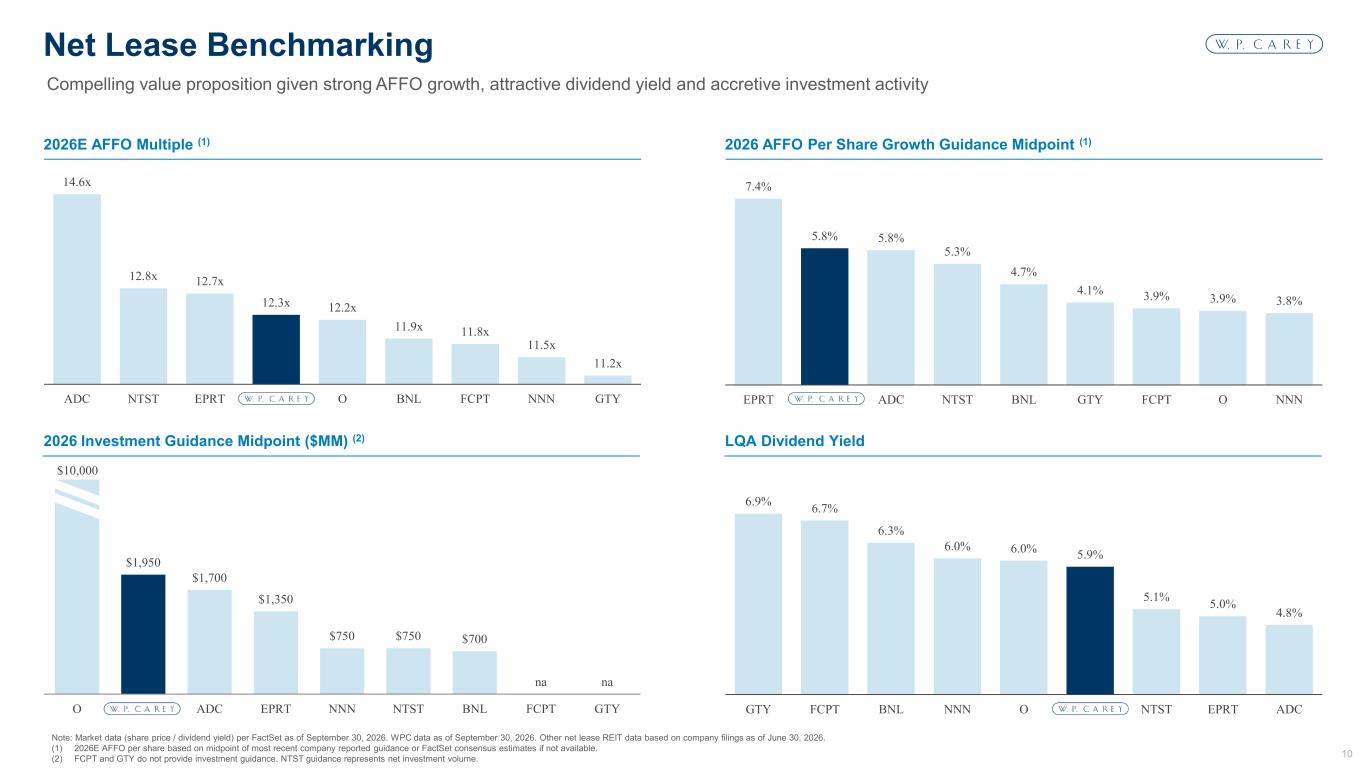
10 Hex #003666 Hex #007CBA Hex #80BEDD Hex #809BB3 Hex #CCD7E1 Hex #E7E6E6 Hex #F4F7FA Hex #BFBFBF Hex #7F7F7F Hex #55565A Hex #3F3F3F Hex #CCE5F1 Hex #D2D0E6 Hex #7773B5 1 2 3 7 8 4 9 10 5 6 11 13 14 12 2026 Investment Guidance Midpoint ($MM) (2) LQA Dividend Yield Note: Market data (share price / dividend yield) per FactSet as of September 30, 2026. WPC data as of September 30, 2026. Other net lease REIT data based on company filings as of June 30, 2026. (1) 2026E AFFO per share based on midpoint of most recent company reported guidance or FactSet consensus estimates if not available. (2) FCPT and GTY do not provide investment guidance. NTST guidance represents net investment volume. Net Lease Benchmarking 2026E AFFO Multiple (1) 2026 AFFO Per Share Growth Guidance Midpoint (1) Compelling value proposition given strong AFFO growth, attractive dividend yield and accretive investment activity 7.4% 5.8% 5.8% 5.3% 4.7% 4.1% 3.9% 3.9% 3.8% EPRT ADC NTST BNL GTY FCPT O NNN $1,950 $1,700 $1,350 $750 $750 $700 na na O ADC EPRT NNN NTST BNL FCPT GTY $10,000 6.9% 6.7% 6.3% 6.0% 6.0% 5.9% 5.1% 5.0% 4.8% GTY FCPT BNL NNN O NTST EPRT ADC 14.6x 12.8x 12.7x 12.3x 12.2x 11.9x 11.8x 11.5x 11.2x ADC NTST EPRT O BNL FCPT NNN GTY
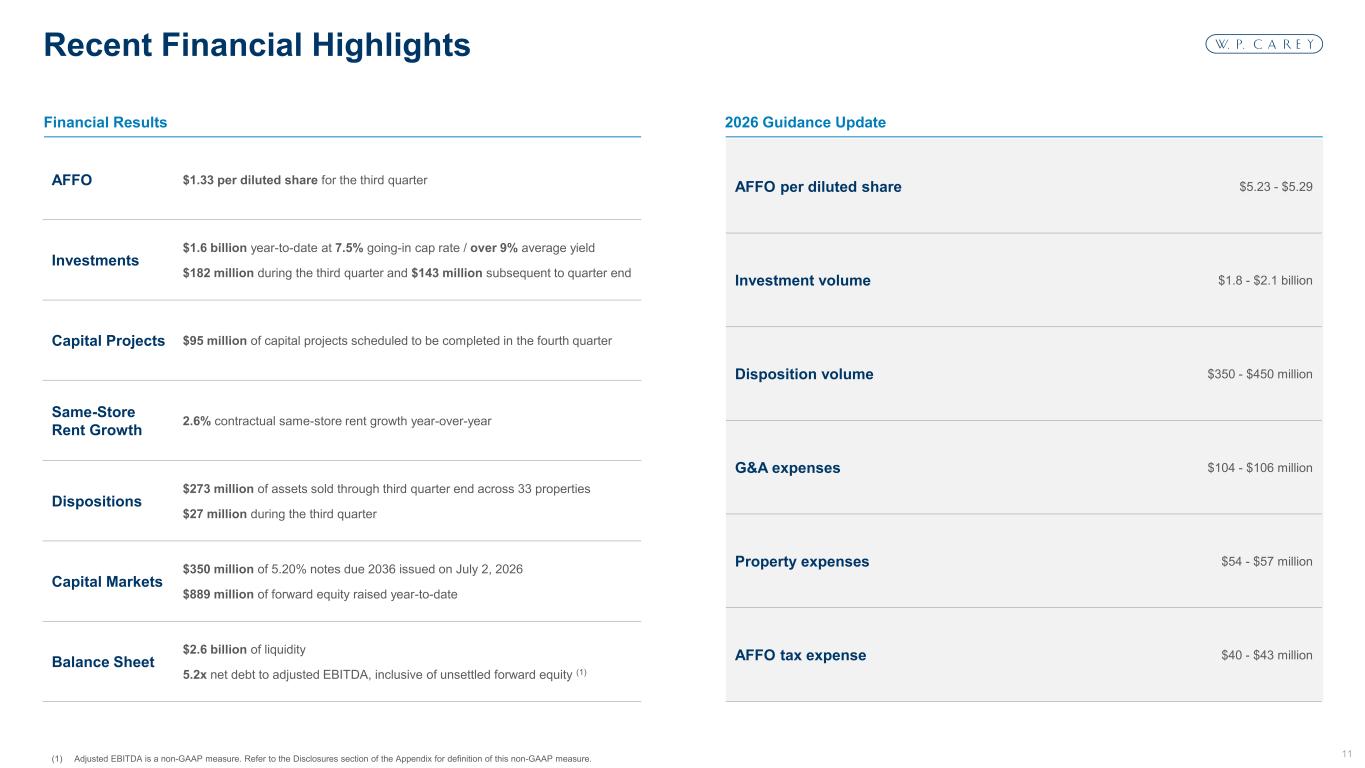
11 Hex #003666 Hex #007CBA Hex #80BEDD Hex #809BB3 Hex #CCD7E1 Hex #E7E6E6 Hex #F4F7FA Hex #BFBFBF Hex #7F7F7F Hex #55565A Hex #3F3F3F Hex #CCE5F1 Hex #D2D0E6 Hex #7773B5 1 2 3 7 8 4 9 10 5 6 11 13 14 12 AFFO per diluted share $5.23 - $5.29 Investment volume $1.8 - $2.1 billion Disposition volume $350 - $450 million G&A expenses $104 - $106 million Property expenses $54 - $57 million AFFO tax expense $40 - $43 million AFFO $1.33 per diluted share for the third quarter Investments $1.6 billion year-to-date at 7.5% going-in cap rate / over 9% average yield $182 million during the third quarter and $143 million subsequent to quarter end Capital Projects $95 million of capital projects scheduled to be completed in the fourth quarter Same-Store Rent Growth 2.6% contractual same-store rent growth year-over-year Dispositions $273 million of assets sold through third quarter end across 33 properties $27 million during the third quarter Capital Markets $350 million of 5.20% notes due 2036 issued on July 2, 2026 $889 million of forward equity raised year-to-date Balance Sheet $2.6 billion of liquidity 5.2x net debt to adjusted EBITDA, inclusive of unsettled forward equity (1) Financial Results 2026 Guidance Update (1) Adjusted EBITDA is a non-GAAP measure. Refer to the Disclosures section of the Appendix for definition of this non-GAAP measure. Recent Financial Highlights
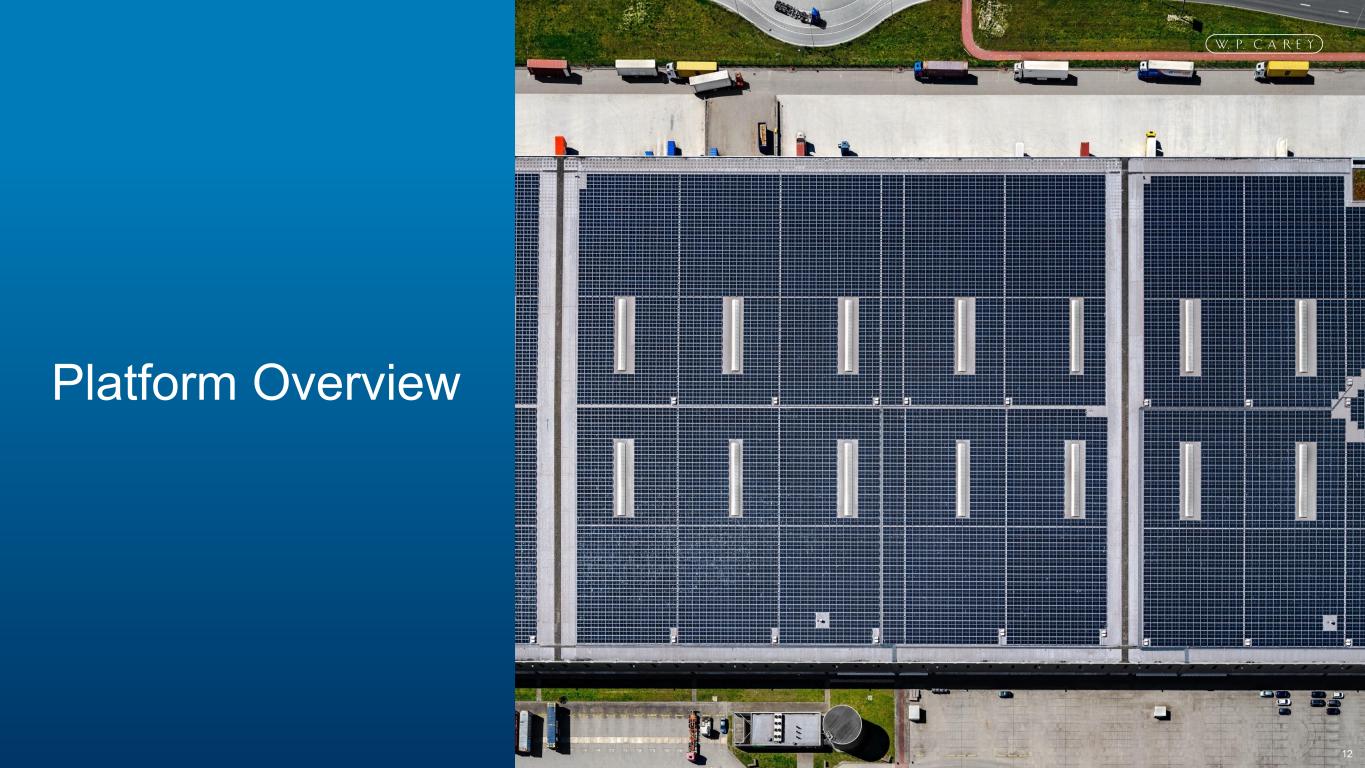
12 Hex #003666 Hex #007CBA Hex #80BEDD Hex #809BB3 Hex #CCD7E1 Hex #E7E6E6 Hex #F4F7FA Hex #BFBFBF Hex #7F7F7F Hex #55565A Hex #3F3F3F Hex #CCE5F1 Hex #D2D0E6 Hex #7773B5 1 2 3 7 8 4 9 10 5 6 11 13 14 12 Property: Nippon Platform Overview
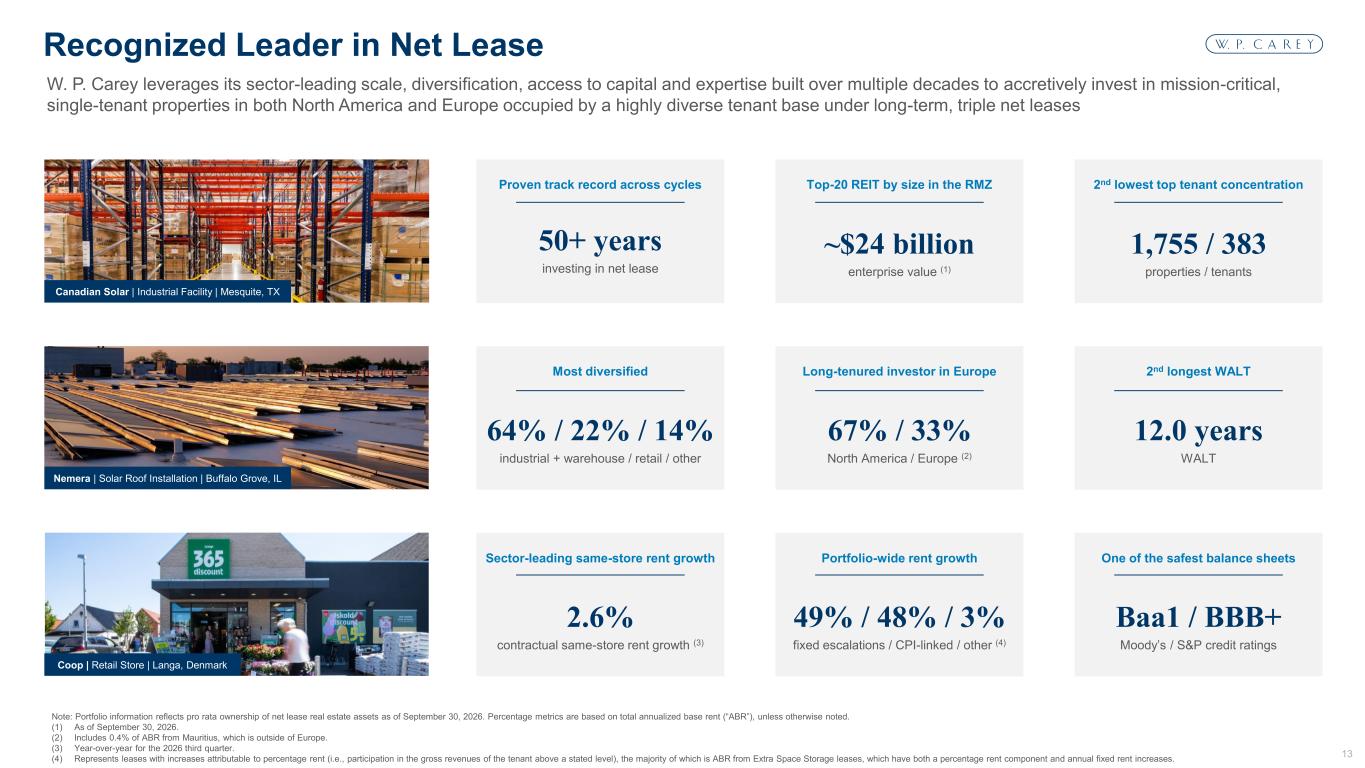
13 Hex #003666 Hex #007CBA Hex #80BEDD Hex #809BB3 Hex #CCD7E1 Hex #E7E6E6 Hex #F4F7FA Hex #BFBFBF Hex #7F7F7F Hex #55565A Hex #3F3F3F Hex #CCE5F1 Hex #D2D0E6 Hex #7773B5 1 2 3 7 8 4 9 10 5 6 11 13 14 12 50+ years investing in net lease ~$24 billion enterprise value (1) 1,755 / 383 properties / tenants 12.0 years WALT 64% / 22% / 14% industrial + warehouse / retail / other 67% / 33% North America / Europe (2) Baa1 / BBB+ Moody’s / S&P credit ratings 2.6% contractual same-store rent growth (3) 49% / 48% / 3% fixed escalations / CPI-linked / other (4) Note: Portfolio information reflects pro rata ownership of net lease real estate assets as of September 30, 2026. Percentage metrics are based on total annualized base rent (“ABR”), unless otherwise noted. (1) As of September 30, 2026. (2) Includes 0.4% of ABR from Mauritius, which is outside of Europe. (3) Year-over-year for the 2026 third quarter. (4) Represents leases with increases attributable to percentage rent (i.e., participation in the gross revenues of the tenant above a stated level), the majority of which is ABR from Extra Space Storage leases, which have both a percentage rent component and annual fixed rent increases. W. P. Carey leverages its sector-leading scale, diversification, access to capital and expertise built over multiple decades to accretively invest in mission-critical, single-tenant properties in both North America and Europe occupied by a highly diverse tenant base under long-term, triple net leases Recognized Leader in Net Lease Top-20 REIT by size in the RMZ 2nd longest WALTMost diversified Sector-leading same-store rent growth One of the safest balance sheets Proven track record across cycles Long-tenured investor in Europe 2nd lowest top tenant concentration Portfolio-wide rent growth Canadian Solar | Industrial Facility | Mesquite, TX Nemera | Solar Roof Installation | Buffalo Grove, IL Coop | Retail Store | Langa, Denmark
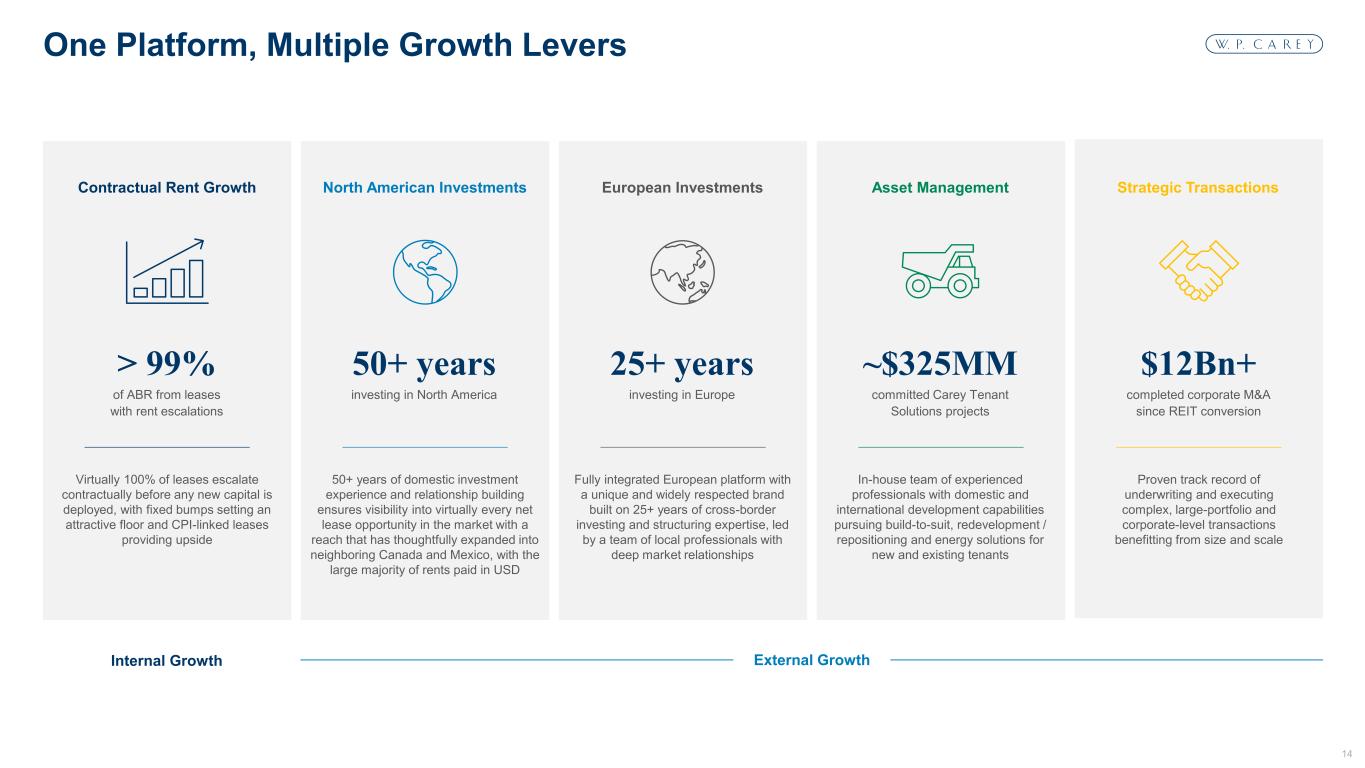
14 Hex #003666 Hex #007CBA Hex #80BEDD Hex #809BB3 Hex #CCD7E1 Hex #E7E6E6 Hex #F4F7FA Hex #BFBFBF Hex #7F7F7F Hex #55565A Hex #3F3F3F Hex #CCE5F1 Hex #D2D0E6 Hex #7773B5 1 2 3 7 8 4 9 10 5 6 11 13 14 12 One Platform, Multiple Growth Levers Contractual Rent Growth North American Investments European Investments Fully integrated European platform with a unique and widely respected brand built on 25+ years of cross-border investing and structuring expertise, led by a team of local professionals with deep market relationships Asset Management Strategic Transactions Proven track record of underwriting and executing complex, large-portfolio and corporate-level transactions benefitting from size and scale 50+ years of domestic investment experience and relationship building ensures visibility into virtually every net lease opportunity in the market with a reach that has thoughtfully expanded into neighboring Canada and Mexico, with the large majority of rents paid in USD Virtually 100% of leases escalate contractually before any new capital is deployed, with fixed bumps setting an attractive floor and CPI-linked leases providing upside In-house team of experienced professionals with domestic and international development capabilities pursuing build-to-suit, redevelopment / repositioning and energy solutions for new and existing tenants Internal Growth External Growth > 99% of ABR from leases with rent escalations 50+ years investing in North America 25+ years investing in Europe ~$325MM committed Carey Tenant Solutions projects $12Bn+ completed corporate M&A since REIT conversion
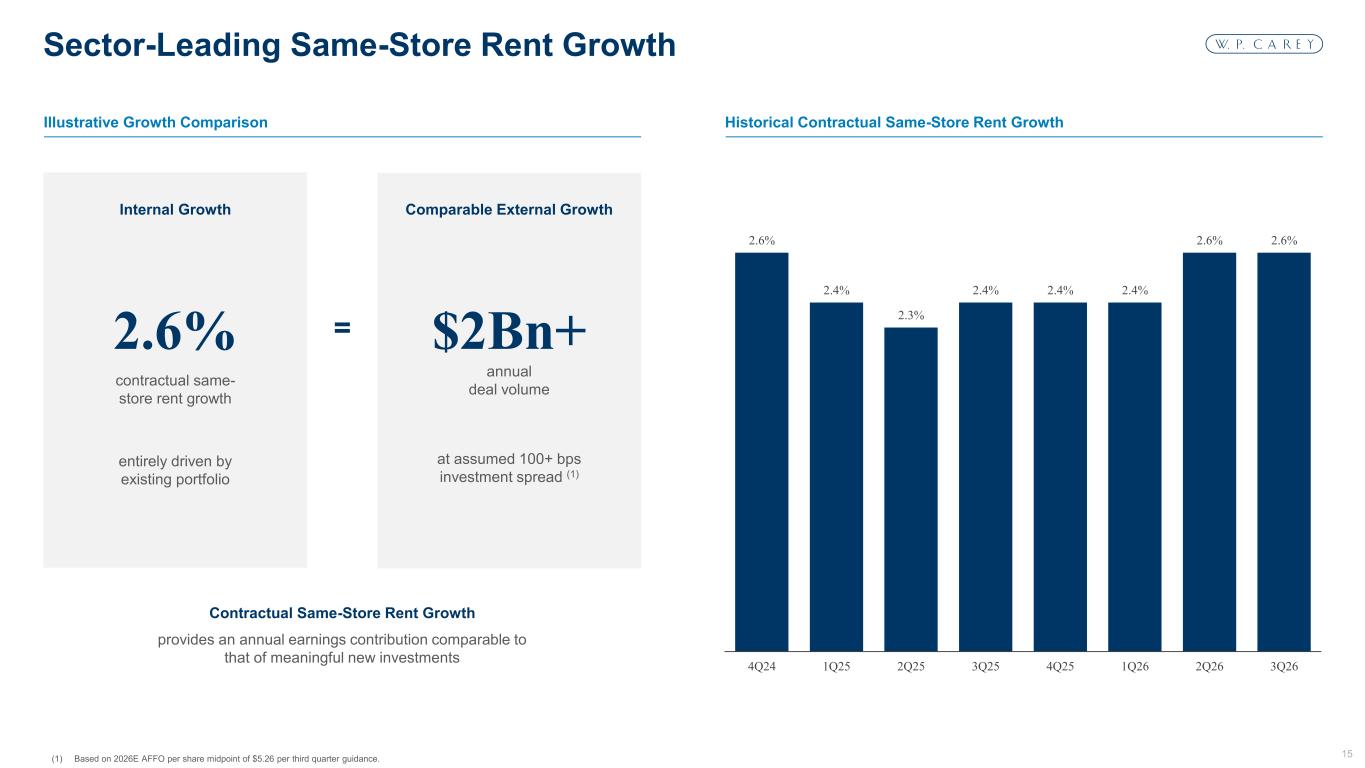
15 Hex #003666 Hex #007CBA Hex #80BEDD Hex #809BB3 Hex #CCD7E1 Hex #E7E6E6 Hex #F4F7FA Hex #BFBFBF Hex #7F7F7F Hex #55565A Hex #3F3F3F Hex #CCE5F1 Hex #D2D0E6 Hex #7773B5 1 2 3 7 8 4 9 10 5 6 11 13 14 12 Illustrative Growth Comparison Historical Contractual Same-Store Rent Growth (1) Based on 2026E AFFO per share midpoint of $5.26 per third quarter guidance. Sector-Leading Same-Store Rent Growth 2.6% 2.4% 2.3% 2.4% 2.4% 2.4% 2.6% 2.6% 4Q24 1Q25 2Q25 3Q25 4Q25 1Q26 2Q26 3Q26 2.6% contractual same- store rent growth $2Bn+ annual deal volume at assumed 100+ bps investment spread (1) = entirely driven by existing portfolio provides an annual earnings contribution comparable to that of meaningful new investments Comparable External GrowthInternal Growth Contractual Same-Store Rent Growth
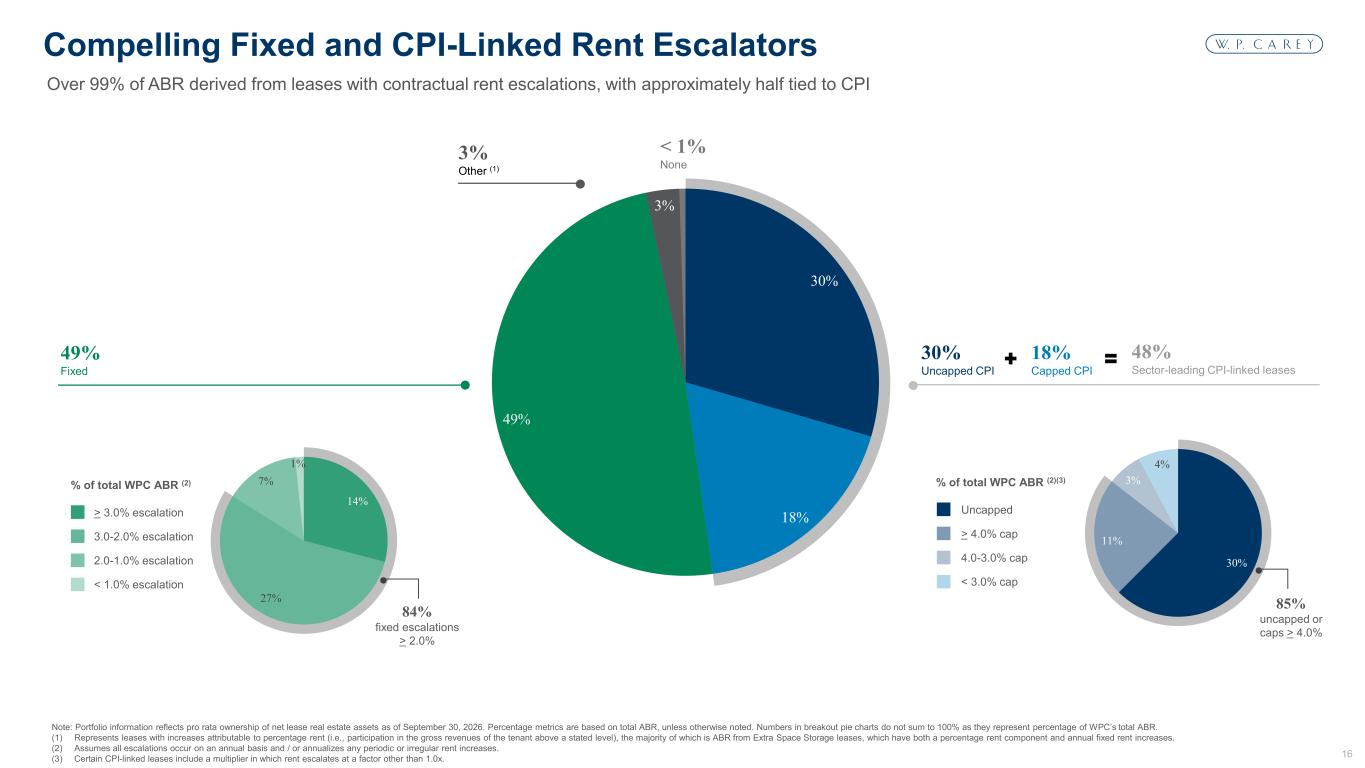
16 Hex #003666 Hex #007CBA Hex #80BEDD Hex #809BB3 Hex #CCD7E1 Hex #E7E6E6 Hex #F4F7FA Hex #BFBFBF Hex #7F7F7F Hex #55565A Hex #3F3F3F Hex #CCE5F1 Hex #D2D0E6 Hex #7773B5 1 2 3 7 8 4 9 10 5 6 11 13 14 12 30% 18% 49% 3% Note: Portfolio information reflects pro rata ownership of net lease real estate assets as of September 30, 2026. Percentage metrics are based on total ABR, unless otherwise noted. Numbers in breakout pie charts do not sum to 100% as they represent percentage of WPC’s total ABR. (1) Represents leases with increases attributable to percentage rent (i.e., participation in the gross revenues of the tenant above a stated level), the majority of which is ABR from Extra Space Storage leases, which have both a percentage rent component and annual fixed rent increases. (2) Assumes all escalations occur on an annual basis and / or annualizes any periodic or irregular rent increases. (3) Certain CPI-linked leases include a multiplier in which rent escalates at a factor other than 1.0x. Over 99% of ABR derived from leases with contractual rent escalations, with approximately half tied to CPI Compelling Fixed and CPI-Linked Rent Escalators 3% Other (1) < 1% None Uncapped > 4.0% cap 4.0-3.0% cap < 3.0% cap % of total WPC ABR (2)(3) 30% 11% 3% 4% 85% uncapped or caps > 4.0% > 3.0% escalation 3.0-2.0% escalation 2.0-1.0% escalation < 1.0% escalation % of total WPC ABR (2) 84% fixed escalations > 2.0% 14% 27% 7% 1% 49% Fixed 30% Uncapped CPI 18% Capped CPI 48% Sector-leading CPI-linked leases
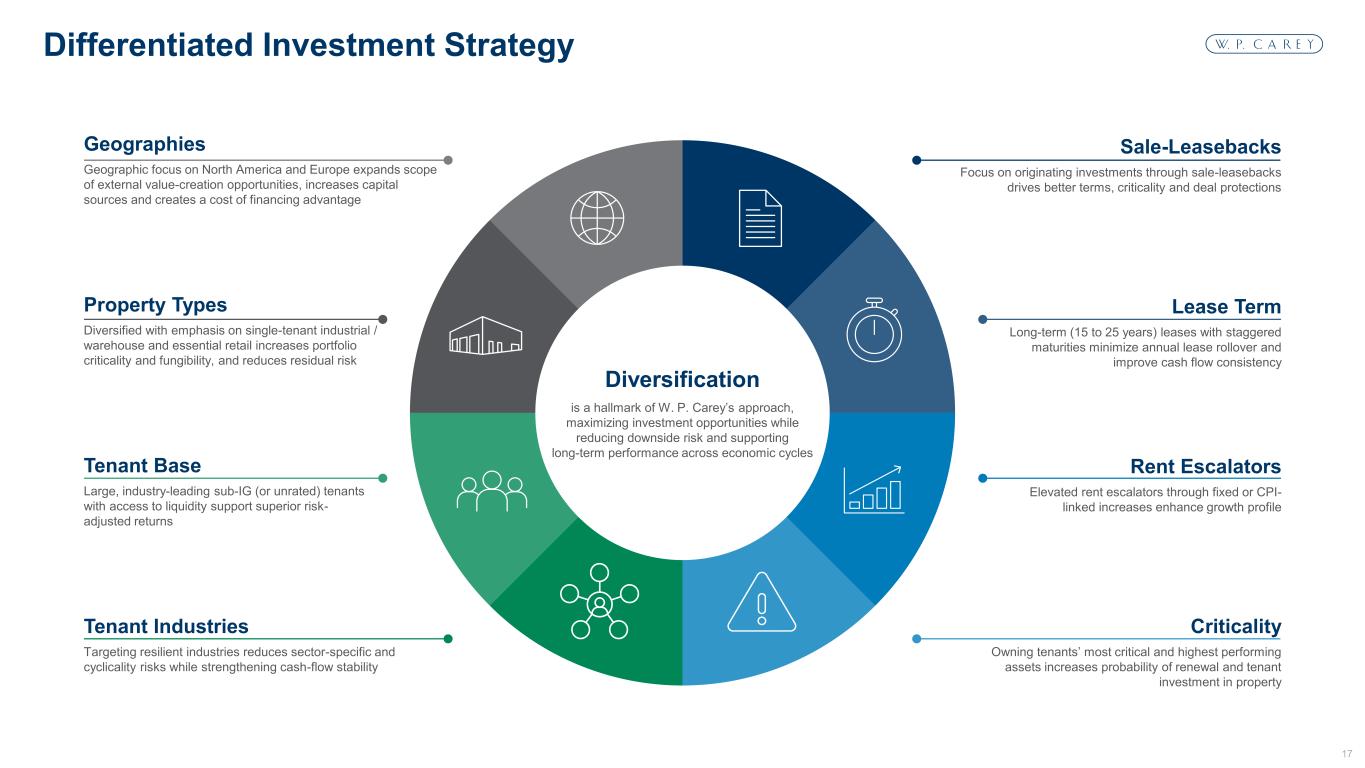
17 Hex #003666 Hex #007CBA Hex #80BEDD Hex #809BB3 Hex #CCD7E1 Hex #E7E6E6 Hex #F4F7FA Hex #BFBFBF Hex #7F7F7F Hex #55565A Hex #3F3F3F Hex #CCE5F1 Hex #D2D0E6 Hex #7773B5 1 2 3 7 8 4 9 10 5 6 11 13 14 12 Differentiated Investment Strategy Property Types Diversified with emphasis on single-tenant industrial / warehouse and essential retail increases portfolio criticality and fungibility, and reduces residual risk Tenant Industries Targeting resilient industries reduces sector-specific and cyclicality risks while strengthening cash-flow stability Tenant Base Large, industry-leading sub-IG (or unrated) tenants with access to liquidity support superior risk- adjusted returns Lease Term Long-term (15 to 25 years) leases with staggered maturities minimize annual lease rollover and improve cash flow consistency Criticality Owning tenants’ most critical and highest performing assets increases probability of renewal and tenant investment in property Sale-Leasebacks Focus on originating investments through sale-leasebacks drives better terms, criticality and deal protections Diversification is a hallmark of W. P. Carey’s approach, maximizing investment opportunities while reducing downside risk and supporting long-term performance across economic cycles Geographies Geographic focus on North America and Europe expands scope of external value-creation opportunities, increases capital sources and creates a cost of financing advantage Rent Escalators Elevated rent escalators through fixed or CPI- linked increases enhance growth profile
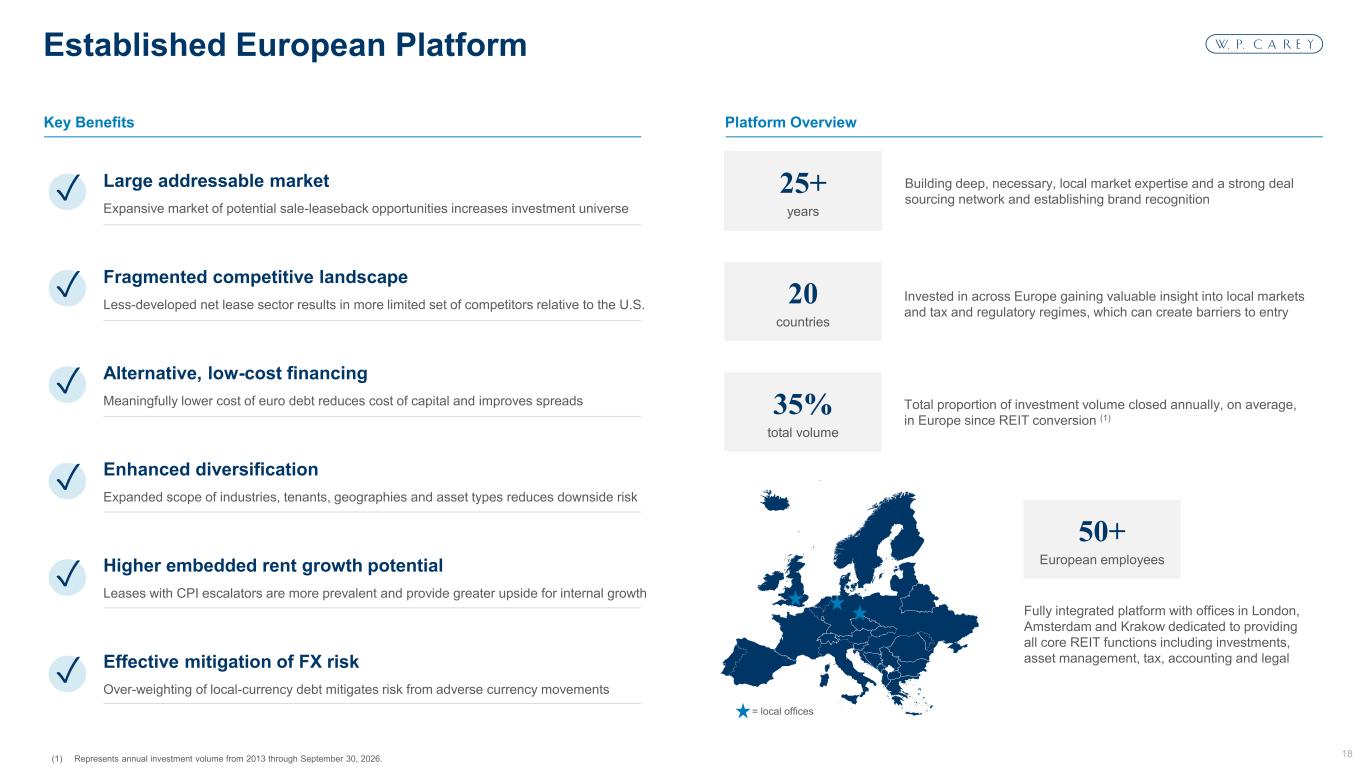
18 Hex #003666 Hex #007CBA Hex #80BEDD Hex #809BB3 Hex #CCD7E1 Hex #E7E6E6 Hex #F4F7FA Hex #BFBFBF Hex #7F7F7F Hex #55565A Hex #3F3F3F Hex #CCE5F1 Hex #D2D0E6 Hex #7773B5 1 2 3 7 8 4 9 10 5 6 11 13 14 12 25+ years 20 countries 35% total volume Key Benefits Platform Overview (1) Represents annual investment volume from 2013 through September 30, 2026. Established European Platform Building deep, necessary, local market expertise and a strong deal sourcing network and establishing brand recognition Invested in across Europe gaining valuable insight into local markets and tax and regulatory regimes, which can create barriers to entry Total proportion of investment volume closed annually, on average, in Europe since REIT conversion (1) Fully integrated platform with offices in London, Amsterdam and Krakow dedicated to providing all core REIT functions including investments, asset management, tax, accounting and legal = local offices 50+ European employees Enhanced diversification Expanded scope of industries, tenants, geographies and asset types reduces downside risk Alternative, low-cost financing Meaningfully lower cost of euro debt reduces cost of capital and improves spreads Fragmented competitive landscape Less-developed net lease sector results in more limited set of competitors relative to the U.S. Higher embedded rent growth potential Leases with CPI escalators are more prevalent and provide greater upside for internal growth Large addressable market Expansive market of potential sale-leaseback opportunities increases investment universe Effective mitigation of FX risk Over-weighting of local-currency debt mitigates risk from adverse currency movements ✓ ✓ ✓ ✓ ✓ ✓
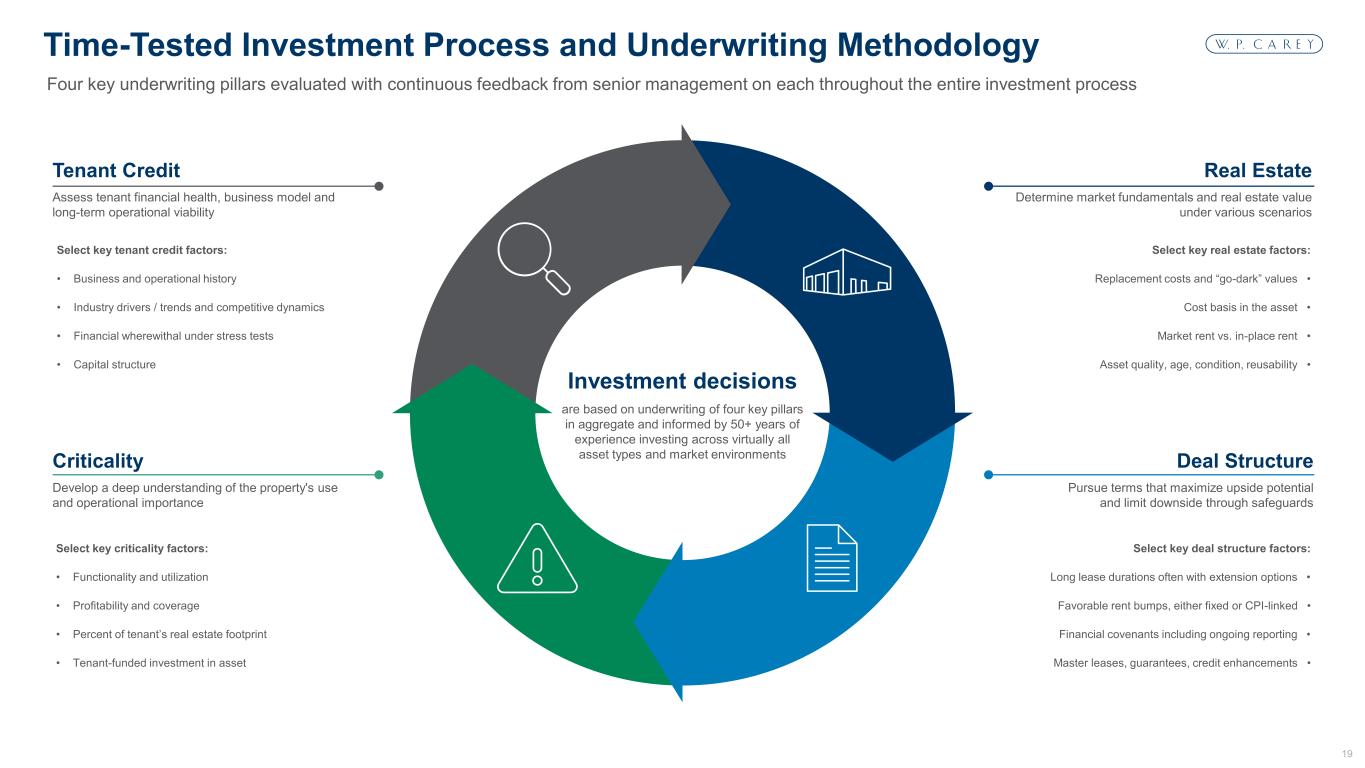
19 Hex #003666 Hex #007CBA Hex #80BEDD Hex #809BB3 Hex #CCD7E1 Hex #E7E6E6 Hex #F4F7FA Hex #BFBFBF Hex #7F7F7F Hex #55565A Hex #3F3F3F Hex #CCE5F1 Hex #D2D0E6 Hex #7773B5 1 2 3 7 8 4 9 10 5 6 11 13 14 12 Four key underwriting pillars evaluated with continuous feedback from senior management on each throughout the entire investment process Time-Tested Investment Process and Underwriting Methodology Investment decisions are based on underwriting of four key pillars in aggregate and informed by 50+ years of experience investing across virtually all asset types and market environmentsCriticality Develop a deep understanding of the property's use and operational importance Real Estate Determine market fundamentals and real estate value under various scenarios Tenant Credit Assess tenant financial health, business model and long-term operational viability Deal Structure Pursue terms that maximize upside potential and limit downside through safeguards Select key tenant credit factors: • Business and operational history • Industry drivers / trends and competitive dynamics • Financial wherewithal under stress tests • Capital structure Select key real estate factors: Replacement costs and “go-dark” values • Cost basis in the asset • Market rent vs. in-place rent • Asset quality, age, condition, reusability • Select key deal structure factors: Long lease durations often with extension options • Favorable rent bumps, either fixed or CPI-linked • Financial covenants including ongoing reporting • Master leases, guarantees, credit enhancements • Select key criticality factors: • Functionality and utilization • Profitability and coverage • Percent of tenant’s real estate footprint • Tenant-funded investment in asset
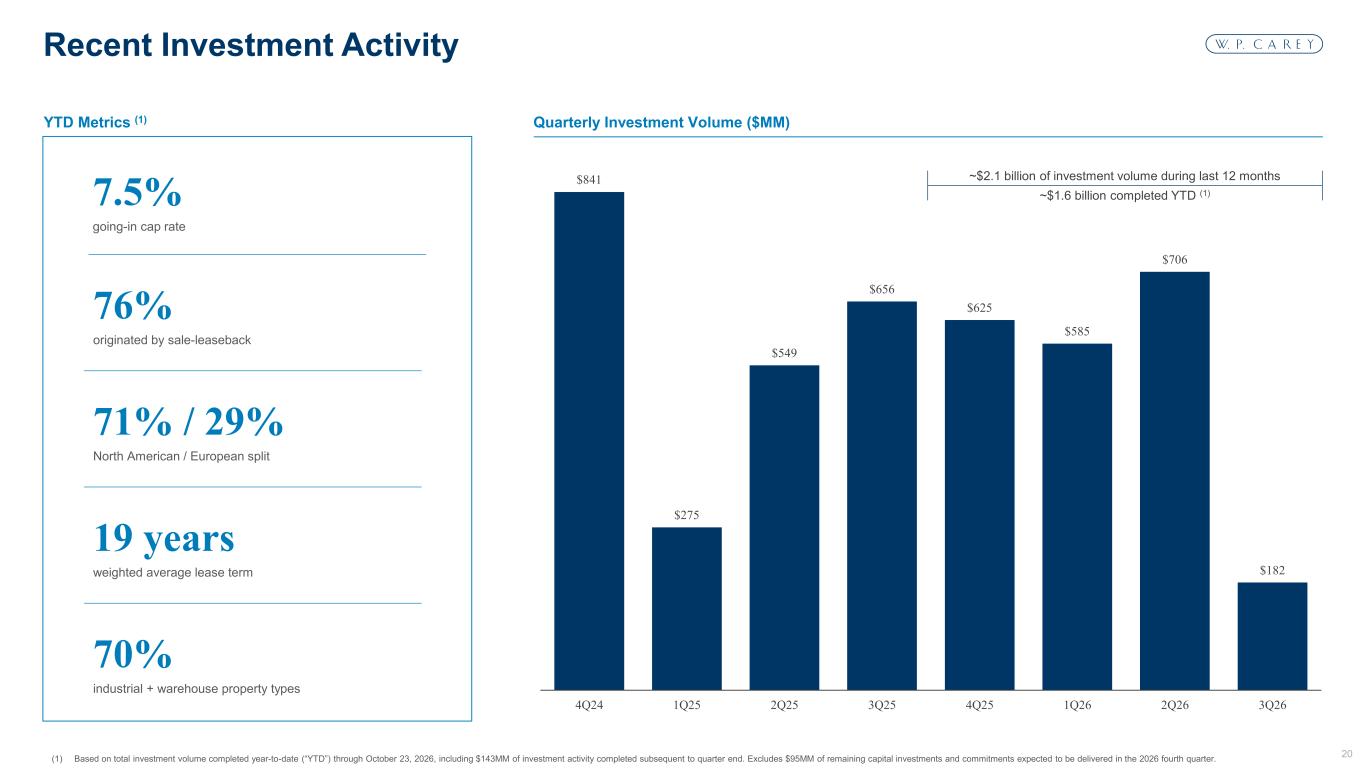
20 Hex #003666 Hex #007CBA Hex #80BEDD Hex #809BB3 Hex #CCD7E1 Hex #E7E6E6 Hex #F4F7FA Hex #BFBFBF Hex #7F7F7F Hex #55565A Hex #3F3F3F Hex #CCE5F1 Hex #D2D0E6 Hex #7773B5 1 2 3 7 8 4 9 10 5 6 11 13 14 12 (1) Based on total investment volume completed year-to-date (“YTD”) through October 23, 2026, including $143MM of investment activity completed subsequent to quarter end. Excludes $95MM of remaining capital investments and commitments expected to be delivered in the 2026 fourth quarter. Recent Investment Activity $841 $275 $549 $656 $625 $585 $706 $182 4Q24 1Q25 2Q25 3Q25 4Q25 1Q26 2Q26 3Q26 YTD Metrics (1) 76% originated by sale-leaseback 71% / 29% North American / European split 19 years weighted average lease term 70% industrial + warehouse property types ~$2.1 billion of investment volume during last 12 months ~$1.6 billion completed YTD (1)7.5% going-in cap rate Quarterly Investment Volume ($MM)
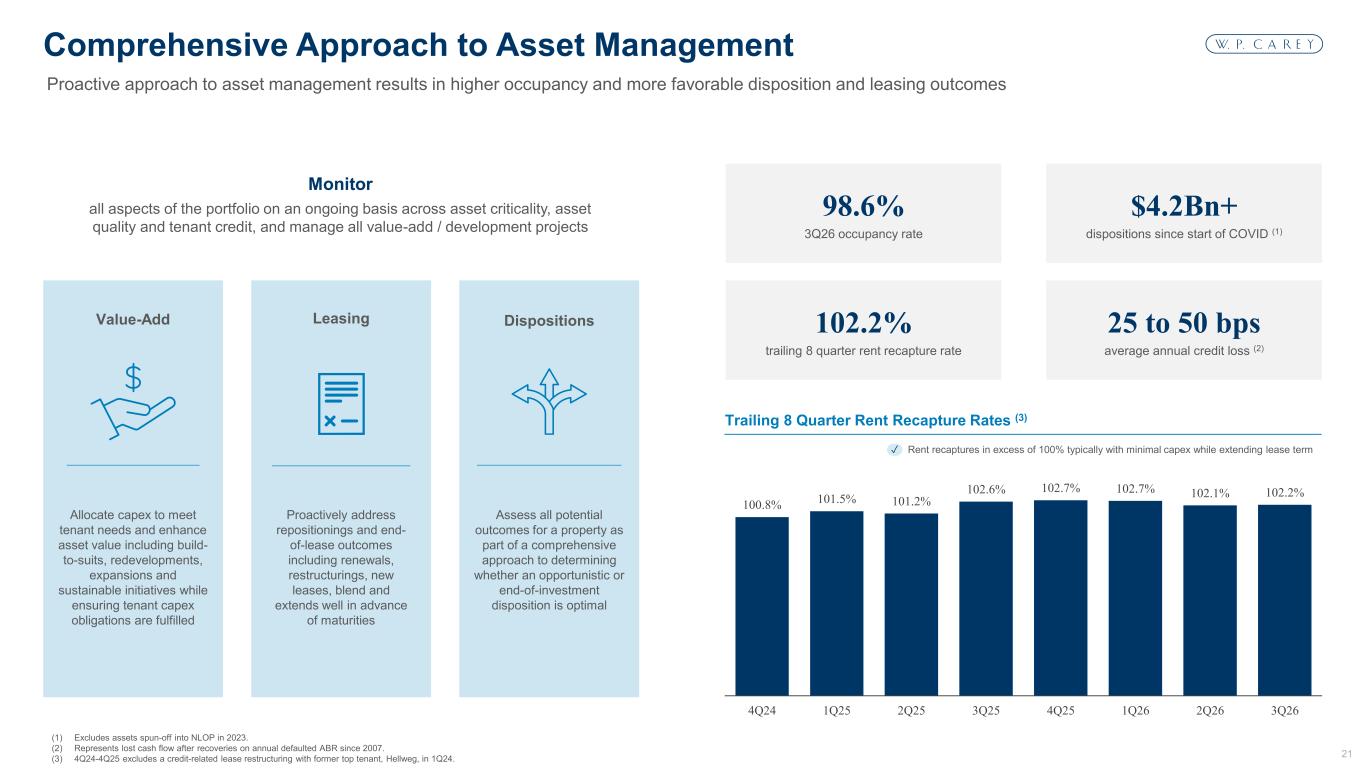
21 Hex #003666 Hex #007CBA Hex #80BEDD Hex #809BB3 Hex #CCD7E1 Hex #E7E6E6 Hex #F4F7FA Hex #BFBFBF Hex #7F7F7F Hex #55565A Hex #3F3F3F Hex #CCE5F1 Hex #D2D0E6 Hex #7773B5 1 2 3 7 8 4 9 10 5 6 11 13 14 12 (1) Excludes assets spun-off into NLOP in 2023. (2) Represents lost cash flow after recoveries on annual defaulted ABR since 2007. (3) 4Q24-4Q25 excludes a credit-related lease restructuring with former top tenant, Hellweg, in 1Q24. Proactive approach to asset management results in higher occupancy and more favorable disposition and leasing outcomes Comprehensive Approach to Asset Management 100.8% 101.5% 101.2% 102.6% 102.7% 102.7% 102.1% 102.2% 4Q24 1Q25 2Q25 3Q25 4Q25 1Q26 2Q26 3Q26 Rent recaptures in excess of 100% typically with minimal capex while extending lease term✓ Monitor all aspects of the portfolio on an ongoing basis across asset criticality, asset quality and tenant credit, and manage all value-add / development projects 98.6% 3Q26 occupancy rate $4.2Bn+ dispositions since start of COVID (1) 25 to 50 bps average annual credit loss (2) 102.2% trailing 8 quarter rent recapture rate Allocate capex to meet tenant needs and enhance asset value including build- to-suits, redevelopments, expansions and sustainable initiatives while ensuring tenant capex obligations are fulfilled Value-Add Proactively address repositionings and end- of-lease outcomes including renewals, restructurings, new leases, blend and extends well in advance of maturities Leasing Assess all potential outcomes for a property as part of a comprehensive approach to determining whether an opportunistic or end-of-investment disposition is optimal Dispositions Trailing 8 Quarter Rent Recapture Rates (3)
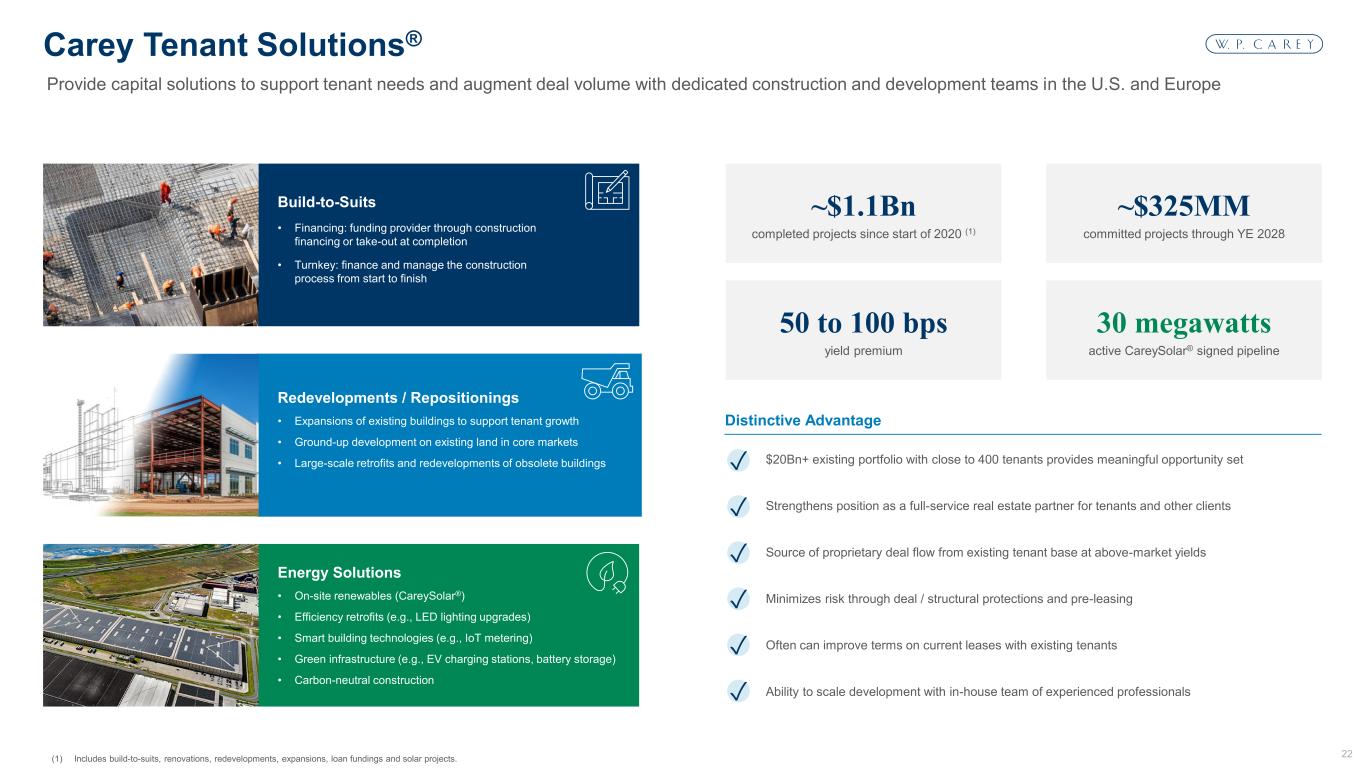
22 Hex #003666 Hex #007CBA Hex #80BEDD Hex #809BB3 Hex #CCD7E1 Hex #E7E6E6 Hex #F4F7FA Hex #BFBFBF Hex #7F7F7F Hex #55565A Hex #3F3F3F Hex #CCE5F1 Hex #D2D0E6 Hex #7773B5 1 2 3 7 8 4 9 10 5 6 11 13 14 12 Build-to-Suits • Financing: funding provider through construction financing or take-out at completion • Turnkey: finance and manage the construction process from start to finish Redevelopments / Repositionings • Expansions of existing buildings to support tenant growth • Ground-up development on existing land in core markets • Large-scale retrofits and redevelopments of obsolete buildings (1) Includes build-to-suits, renovations, redevelopments, expansions, loan fundings and solar projects. Provide capital solutions to support tenant needs and augment deal volume with dedicated construction and development teams in the U.S. and Europe Carey Tenant Solutions® ~$1.1Bn completed projects since start of 2020 (1) ~$325MM committed projects through YE 2028 30 megawatts active CareySolar® signed pipeline 50 to 100 bps yield premium ✓ $20Bn+ existing portfolio with close to 400 tenants provides meaningful opportunity set ✓ Strengthens position as a full-service real estate partner for tenants and other clients ✓ Source of proprietary deal flow from existing tenant base at above-market yields ✓ Minimizes risk through deal / structural protections and pre-leasing ✓ Often can improve terms on current leases with existing tenants ✓ Ability to scale development with in-house team of experienced professionals ✓ ✓ ✓ ✓ ✓ ✓ Distinctive Advantage Energy Solutions • On-site renewables (CareySolar®) • Efficiency retrofits (e.g., LED lighting upgrades) • Smart building technologies (e.g., IoT metering) • Green infrastructure (e.g., EV charging stations, battery storage) • Carbon-neutral construction
23 Hex #003666 Hex #007CBA Hex #80BEDD Hex #809BB3 Hex #CCD7E1 Hex #E7E6E6 Hex #F4F7FA Hex #BFBFBF Hex #7F7F7F Hex #55565A Hex #3F3F3F Hex #CCE5F1 Hex #D2D0E6 Hex #7773B5 1 2 3 7 8 4 9 10 5 6 11 13 14 12 Shutterstock Stock Image Portfolio
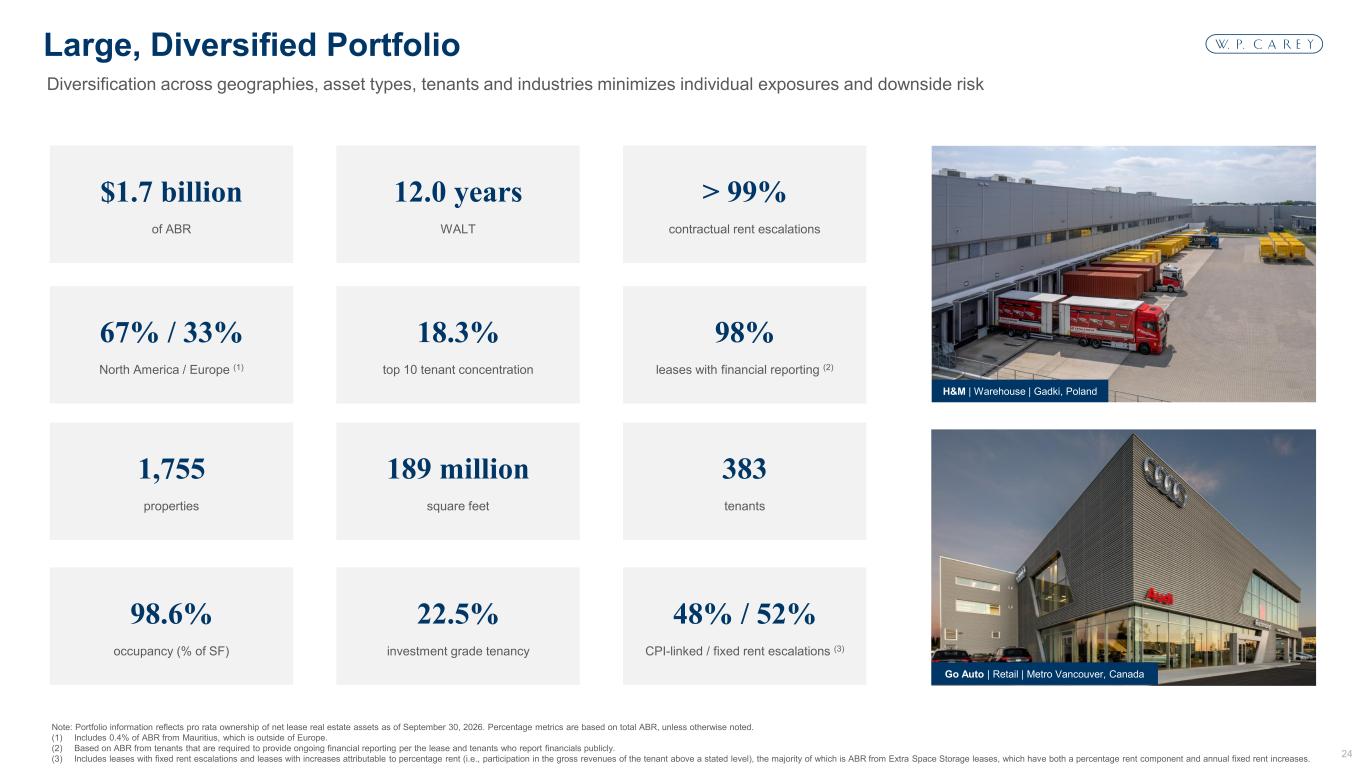
24 Hex #003666 Hex #007CBA Hex #80BEDD Hex #809BB3 Hex #CCD7E1 Hex #E7E6E6 Hex #F4F7FA Hex #BFBFBF Hex #7F7F7F Hex #55565A Hex #3F3F3F Hex #CCE5F1 Hex #D2D0E6 Hex #7773B5 1 2 3 7 8 4 9 10 5 6 11 13 14 12 $1.7 billion of ABR 67% / 33% North America / Europe (1) 1,755 properties 98.6% occupancy (% of SF) 98% leases with financial reporting (2) 383 tenants 48% / 52% CPI-linked / fixed rent escalations (3) Note: Portfolio information reflects pro rata ownership of net lease real estate assets as of September 30, 2026. Percentage metrics are based on total ABR, unless otherwise noted. (1) Includes 0.4% of ABR from Mauritius, which is outside of Europe. (2) Based on ABR from tenants that are required to provide ongoing financial reporting per the lease and tenants who report financials publicly. (3) Includes leases with fixed rent escalations and leases with increases attributable to percentage rent (i.e., participation in the gross revenues of the tenant above a stated level), the majority of which is ABR from Extra Space Storage leases, which have both a percentage rent component and annual fixed rent increases. Diversification across geographies, asset types, tenants and industries minimizes individual exposures and downside risk Large, Diversified Portfolio 12.0 years WALT > 99% contractual rent escalations 18.3% top 10 tenant concentration 189 million square feet 22.5% investment grade tenancy H&M | Warehouse | Gadki, Poland Go Auto | Retail | Metro Vancouver, Canada
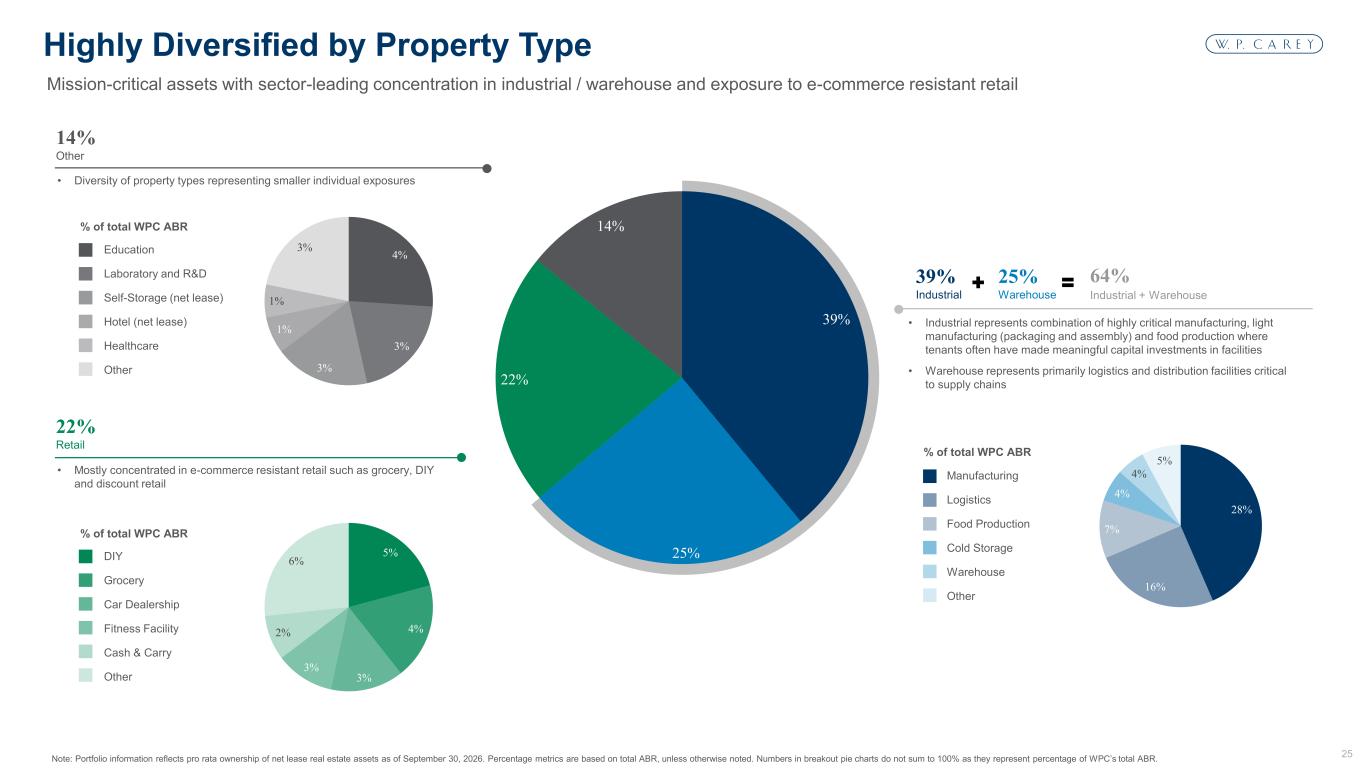
25 Hex #003666 Hex #007CBA Hex #80BEDD Hex #809BB3 Hex #CCD7E1 Hex #E7E6E6 Hex #F4F7FA Hex #BFBFBF Hex #7F7F7F Hex #55565A Hex #3F3F3F Hex #CCE5F1 Hex #D2D0E6 Hex #7773B5 1 2 3 7 8 4 9 10 5 6 11 13 14 12 Manufacturing Logistics Food Production Cold Storage Warehouse Other 39% 25% 22% 14% Note: Portfolio information reflects pro rata ownership of net lease real estate assets as of September 30, 2026. Percentage metrics are based on total ABR, unless otherwise noted. Numbers in breakout pie charts do not sum to 100% as they represent percentage of WPC’s total ABR. Mission-critical assets with sector-leading concentration in industrial / warehouse and exposure to e-commerce resistant retail Highly Diversified by Property Type 39% Industrial 14% Other 25% Warehouse 64% Industrial + Warehouse • Industrial represents combination of highly critical manufacturing, light manufacturing (packaging and assembly) and food production where tenants often have made meaningful capital investments in facilities • Warehouse represents primarily logistics and distribution facilities critical to supply chains • Mostly concentrated in e-commerce resistant retail such as grocery, DIY and discount retail 22% Retail DIY Grocery Car Dealership Fitness Facility Cash & Carry Other Education Laboratory and R&D Self-Storage (net lease) Hotel (net lease) Healthcare Other • Diversity of property types representing smaller individual exposures % of total WPC ABR % of total WPC ABR % of total WPC ABR 4% 3% 3% 1% 1% 3% 5% 4% 3% 3% 2% 6% 28% 16% 7% 4% 4% 5%
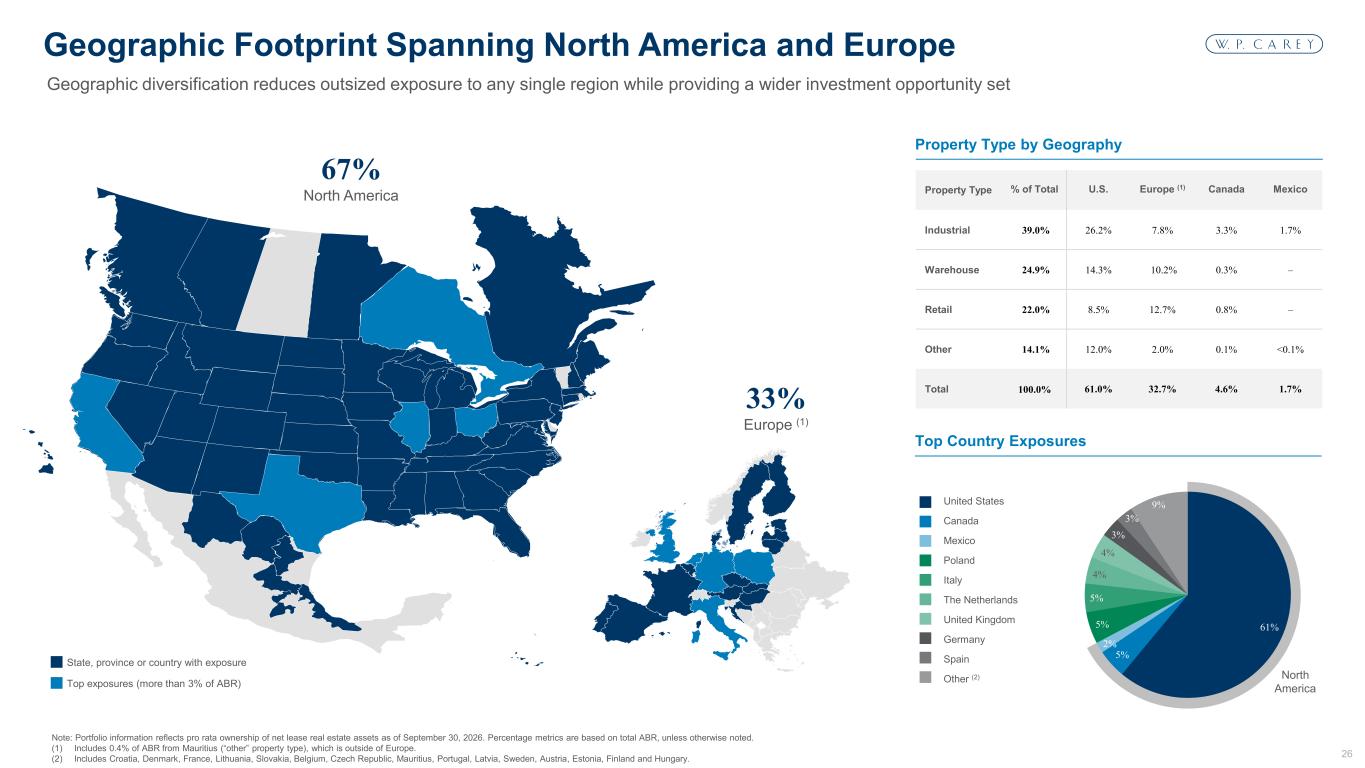
26 Hex #003666 Hex #007CBA Hex #80BEDD Hex #809BB3 Hex #CCD7E1 Hex #E7E6E6 Hex #F4F7FA Hex #BFBFBF Hex #7F7F7F Hex #55565A Hex #3F3F3F Hex #CCE5F1 Hex #D2D0E6 Hex #7773B5 1 2 3 7 8 4 9 10 5 6 11 13 14 12 Note: Portfolio information reflects pro rata ownership of net lease real estate assets as of September 30, 2026. Percentage metrics are based on total ABR, unless otherwise noted. (1) Includes 0.4% of ABR from Mauritius (“other” property type), which is outside of Europe. (2) Includes Croatia, Denmark, France, Lithuania, Slovakia, Belgium, Czech Republic, Mauritius, Portugal, Latvia, Sweden, Austria, Estonia, Finland and Hungary. Geographic diversification reduces outsized exposure to any single region while providing a wider investment opportunity set Geographic Footprint Spanning North America and Europe State, province or country with exposure Top exposures (more than 3% of ABR) 67% North America Property Type % of Total U.S. Europe (1) Canada Mexico Industrial 39.0% 26.2% 7.8% 3.3% 1.7% Warehouse 24.9% 14.3% 10.2% 0.3% – Retail 22.0% 8.5% 12.7% 0.8% – Other 14.1% 12.0% 2.0% 0.1% <0.1% Total 100.0% 61.0% 32.7% 4.6% 1.7% 61% 5% 2% 5% 5% 4% 4% 3% 3% 9%United States Canada Mexico Poland Italy The Netherlands United Kingdom Germany Spain Other (2) North America 33% Europe (1) Top Country Exposures Property Type by Geography
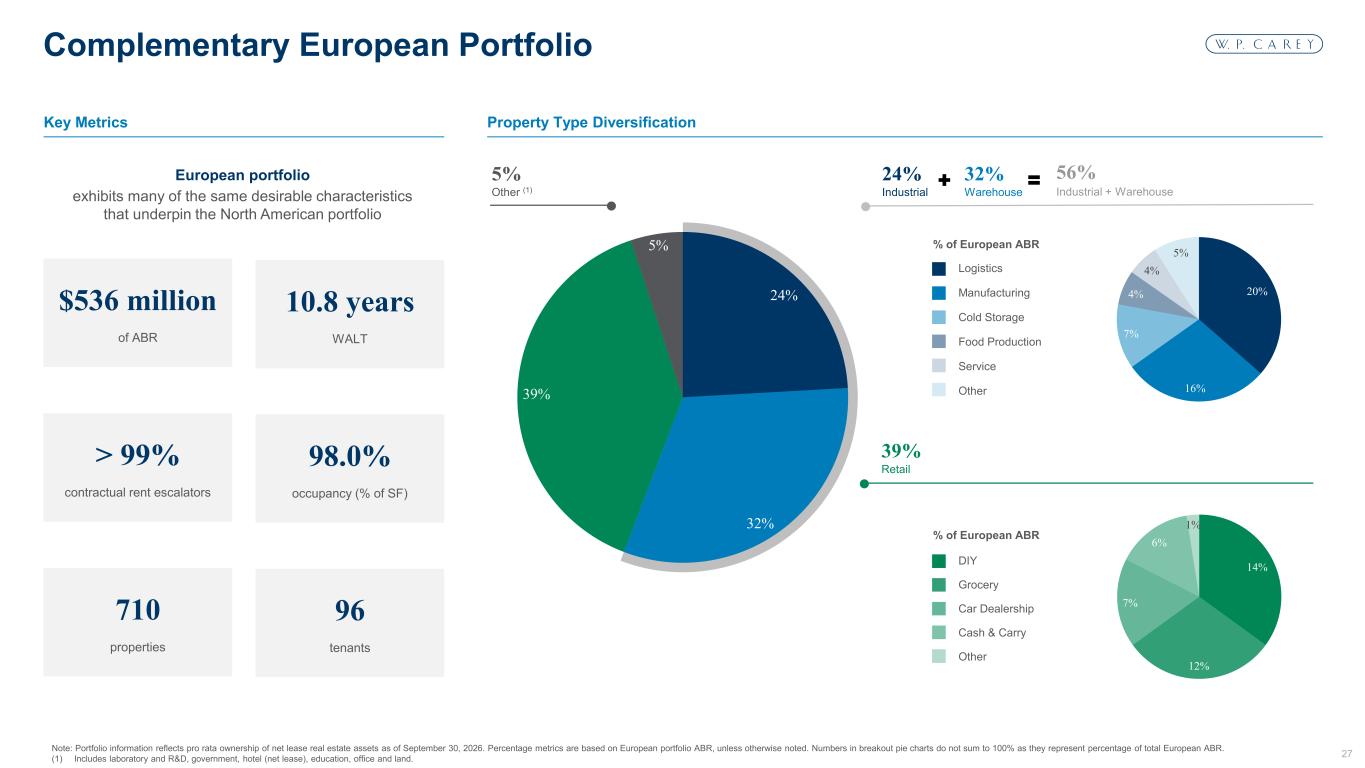
27 Hex #003666 Hex #007CBA Hex #80BEDD Hex #809BB3 Hex #CCD7E1 Hex #E7E6E6 Hex #F4F7FA Hex #BFBFBF Hex #7F7F7F Hex #55565A Hex #3F3F3F Hex #CCE5F1 Hex #D2D0E6 Hex #7773B5 1 2 3 7 8 4 9 10 5 6 11 13 14 12 Note: Portfolio information reflects pro rata ownership of net lease real estate assets as of September 30, 2026. Percentage metrics are based on European portfolio ABR, unless otherwise noted. Numbers in breakout pie charts do not sum to 100% as they represent percentage of total European ABR. (1) Includes laboratory and R&D, government, hotel (net lease), education, office and land. Complementary European Portfolio 24% 32% 39% 5% 24% Industrial 32% Warehouse 56% Industrial + Warehouse Logistics Manufacturing Cold Storage Food Production Service Other % of European ABR 20% 16% 7% 4% 4% 5% DIY Grocery Car Dealership Cash & Carry Other % of European ABR 39% Retail 5% Other (1) 14% 12% 7% 6% 1% $536 million of ABR 710 properties > 99% contractual rent escalators 10.8 years WALT 98.0% occupancy (% of SF) 96 tenants Key Metrics Property Type Diversification exhibits many of the same desirable characteristics that underpin the North American portfolio European portfolio
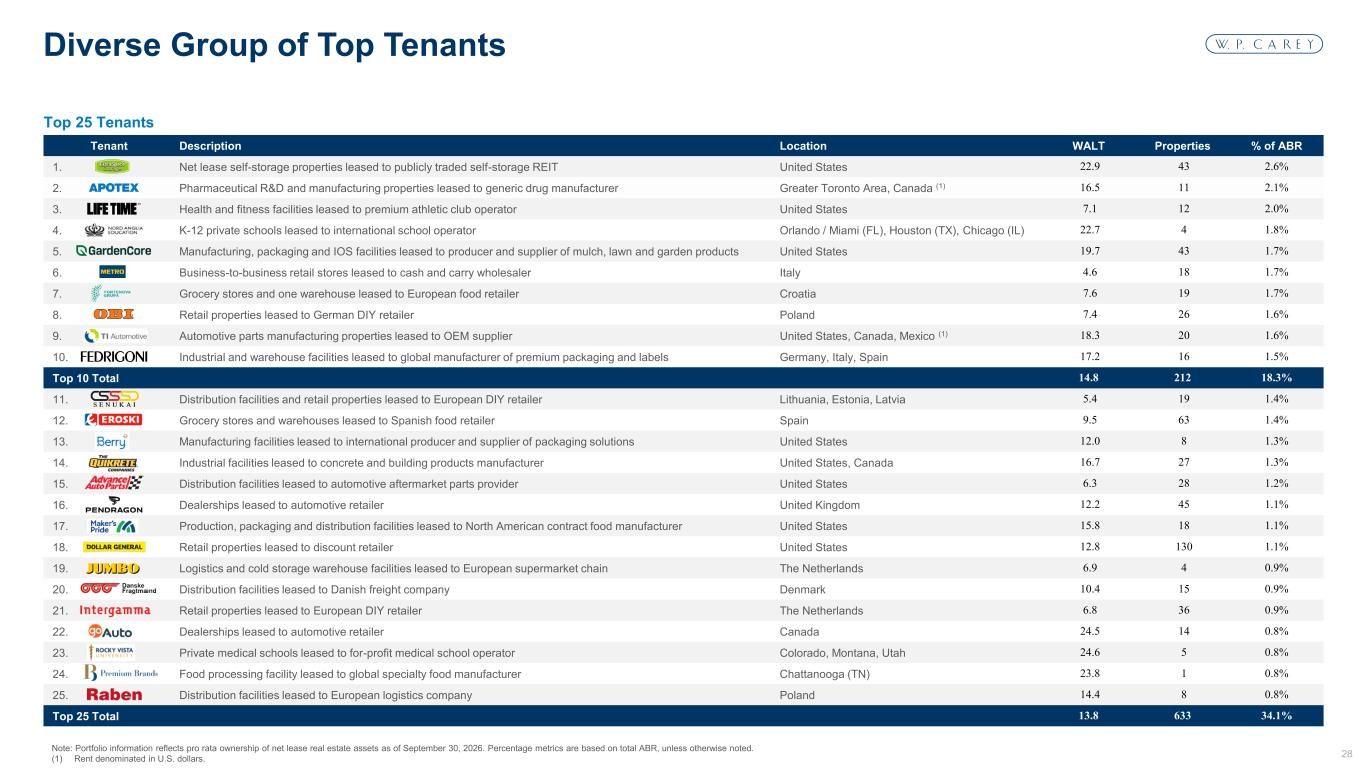
28 Hex #003666 Hex #007CBA Hex #80BEDD Hex #809BB3 Hex #CCD7E1 Hex #E7E6E6 Hex #F4F7FA Hex #BFBFBF Hex #7F7F7F Hex #55565A Hex #3F3F3F Hex #CCE5F1 Hex #D2D0E6 Hex #7773B5 1 2 3 7 8 4 9 10 5 6 11 13 14 12 Note: Portfolio information reflects pro rata ownership of net lease real estate assets as of September 30, 2026. Percentage metrics are based on total ABR, unless otherwise noted. (1) Rent denominated in U.S. dollars. Diverse Group of Top Tenants Tenant Description Location WALT Properties % of ABR 1. Net lease self-storage properties leased to publicly traded self-storage REIT United States 22.9 43 2.6% 2. Pharmaceutical R&D and manufacturing properties leased to generic drug manufacturer Greater Toronto Area, Canada (1) 16.5 11 2.1% 3. Health and fitness facilities leased to premium athletic club operator United States 7.1 12 2.0% 4. K-12 private schools leased to international school operator Orlando / Miami (FL), Houston (TX), Chicago (IL) 22.7 4 1.8% 5. Manufacturing, packaging and IOS facilities leased to producer and supplier of mulch, lawn and garden products United States 19.7 43 1.7% 6. Business-to-business retail stores leased to cash and carry wholesaler Italy 4.6 18 1.7% 7. Grocery stores and one warehouse leased to European food retailer Croatia 7.6 19 1.7% 8. Retail properties leased to German DIY retailer Poland 7.4 26 1.6% 9. Automotive parts manufacturing properties leased to OEM supplier United States, Canada, Mexico (1) 18.3 20 1.6% 10. Industrial and warehouse facilities leased to global manufacturer of premium packaging and labels Germany, Italy, Spain 17.2 16 1.5% Top 10 Total 14.8 212 18.3% 11. Distribution facilities and retail properties leased to European DIY retailer Lithuania, Estonia, Latvia 5.4 19 1.4% 12. Grocery stores and warehouses leased to Spanish food retailer Spain 9.5 63 1.4% 13. Manufacturing facilities leased to international producer and supplier of packaging solutions United States 12.0 8 1.3% 14. Industrial facilities leased to concrete and building products manufacturer United States, Canada 16.7 27 1.3% 15. Distribution facilities leased to automotive aftermarket parts provider United States 6.3 28 1.2% 16. Dealerships leased to automotive retailer United Kingdom 12.2 45 1.1% 17. Production, packaging and distribution facilities leased to North American contract food manufacturer United States 15.8 18 1.1% 18. Retail properties leased to discount retailer United States 12.8 130 1.1% 19. Logistics and cold storage warehouse facilities leased to European supermarket chain The Netherlands 6.9 4 0.9% 20. Distribution facilities leased to Danish freight company Denmark 10.4 15 0.9% 21. Retail properties leased to European DIY retailer The Netherlands 6.8 36 0.9% 22. Dealerships leased to automotive retailer Canada 24.5 14 0.8% 23. Private medical schools leased to for-profit medical school operator Colorado, Montana, Utah 24.6 5 0.8% 24. Food processing facility leased to global specialty food manufacturer Chattanooga (TN) 23.8 1 0.8% 25. Distribution facilities leased to European logistics company Poland 14.4 8 0.8% Top 25 Total 13.8 633 34.1% Top 25 Tenants
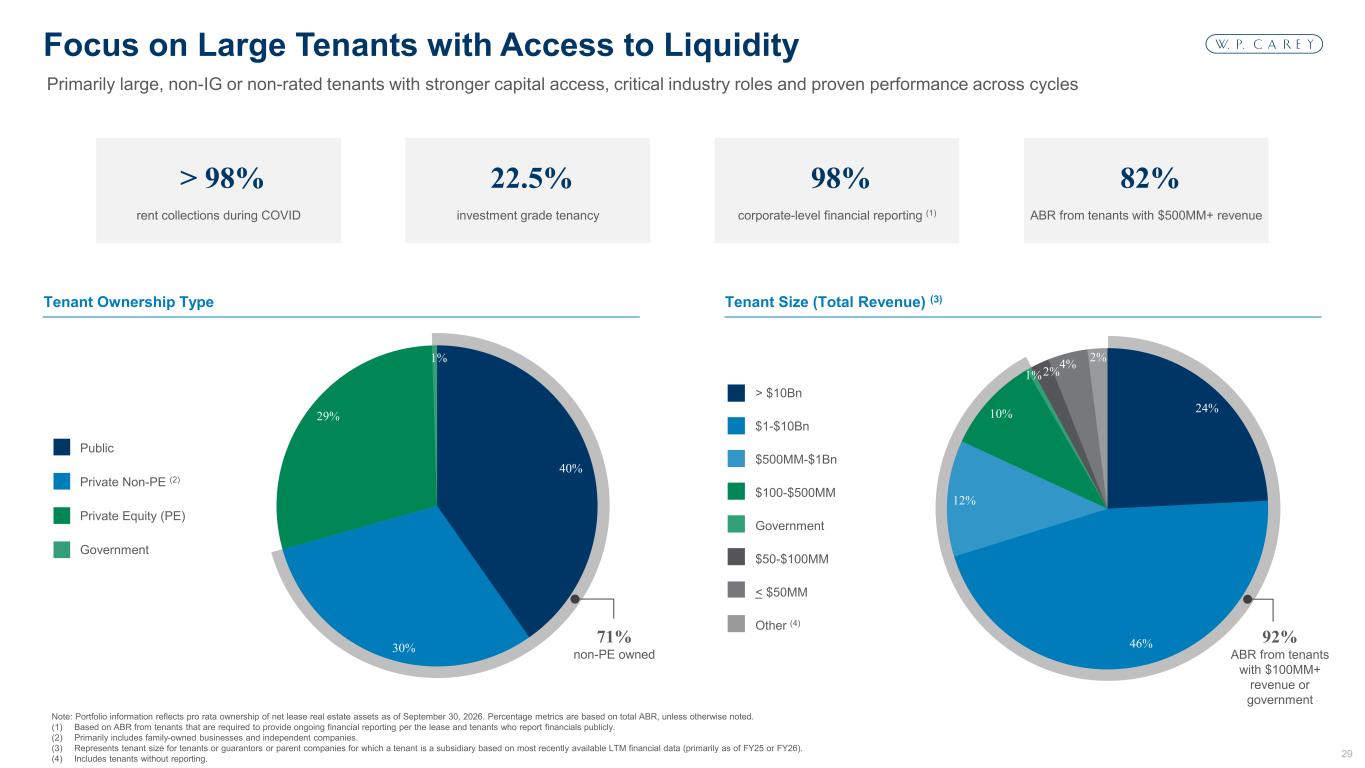
29 Hex #003666 Hex #007CBA Hex #80BEDD Hex #809BB3 Hex #CCD7E1 Hex #E7E6E6 Hex #F4F7FA Hex #BFBFBF Hex #7F7F7F Hex #55565A Hex #3F3F3F Hex #CCE5F1 Hex #D2D0E6 Hex #7773B5 1 2 3 7 8 4 9 10 5 6 11 13 14 12 Note: Portfolio information reflects pro rata ownership of net lease real estate assets as of September 30, 2026. Percentage metrics are based on total ABR, unless otherwise noted. (1) Based on ABR from tenants that are required to provide ongoing financial reporting per the lease and tenants who report financials publicly. (2) Primarily includes family-owned businesses and independent companies. (3) Represents tenant size for tenants or guarantors or parent companies for which a tenant is a subsidiary based on most recently available LTM financial data (primarily as of FY25 or FY26). (4) Includes tenants without reporting. Focus on Large Tenants with Access to Liquidity Primarily large, non-IG or non-rated tenants with stronger capital access, critical industry roles and proven performance across cycles 40% 30% 29% 1% 24% 46% 12% 10% 1%2% 4% 2% 71% non-PE owned Public Private Non-PE (2) Private Equity (PE) Government > $10Bn $1-$10Bn $500MM-$1Bn $100-$500MM Government $50-$100MM < $50MM Other (4) 92% ABR from tenants with $100MM+ revenue or government > 98% rent collections during COVID 22.5% investment grade tenancy 98% corporate-level financial reporting (1) 82% ABR from tenants with $500MM+ revenue Tenant Ownership Type Tenant Size (Total Revenue) (3)
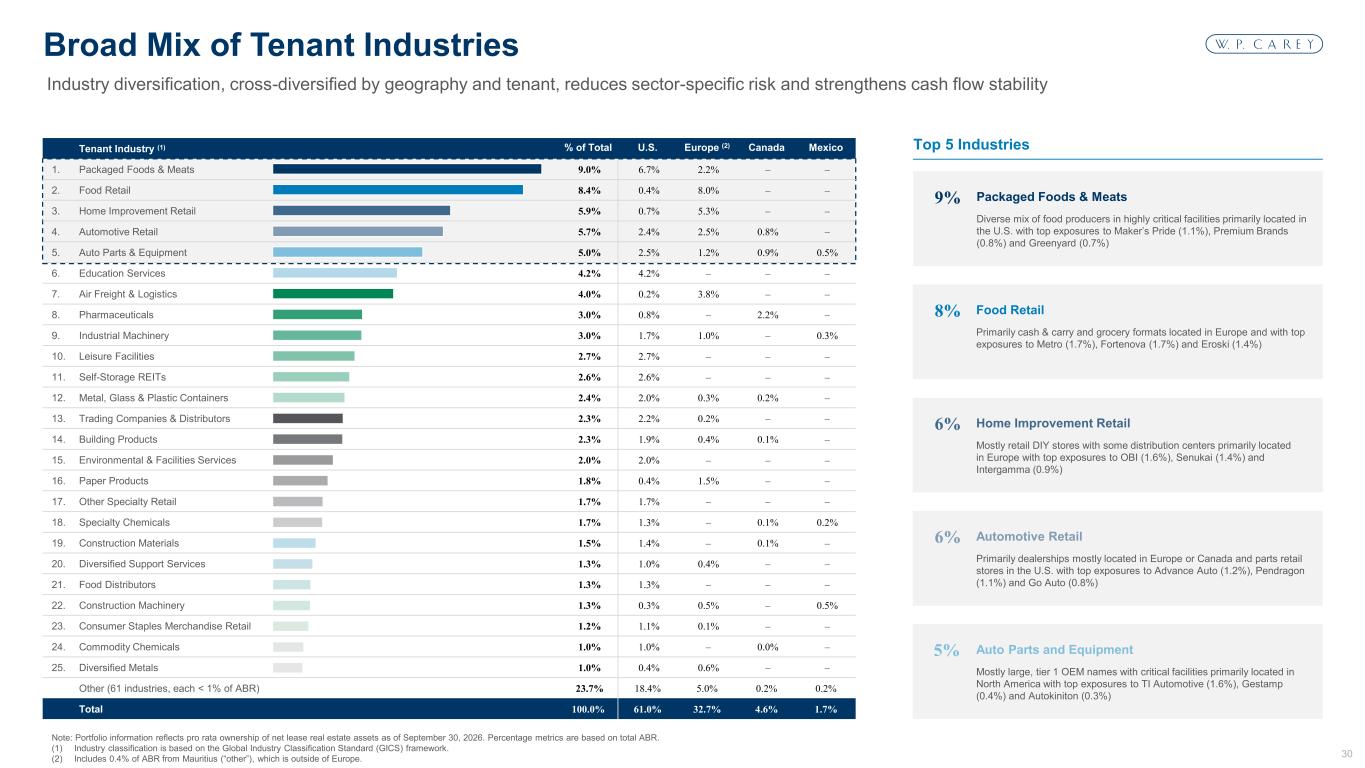
30 Hex #003666 Hex #007CBA Hex #80BEDD Hex #809BB3 Hex #CCD7E1 Hex #E7E6E6 Hex #F4F7FA Hex #BFBFBF Hex #7F7F7F Hex #55565A Hex #3F3F3F Hex #CCE5F1 Hex #D2D0E6 Hex #7773B5 1 2 3 7 8 4 9 10 5 6 11 13 14 12 Tenant Industry (1) % of Total U.S. Europe (2) Canada Mexico 1. Packaged Foods & Meats 9.0% 6.7% 2.2% – – 2. Food Retail 8.4% 0.4% 8.0% – – 3. Home Improvement Retail 5.9% 0.7% 5.3% – – 4. Automotive Retail 5.7% 2.4% 2.5% 0.8% – 5. Auto Parts & Equipment 5.0% 2.5% 1.2% 0.9% 0.5% 6. Education Services 4.2% 4.2% – – – 7. Air Freight & Logistics 4.0% 0.2% 3.8% – – 8. Pharmaceuticals 3.0% 0.8% – 2.2% – 9. Industrial Machinery 3.0% 1.7% 1.0% – 0.3% 10. Leisure Facilities 2.7% 2.7% – – – 11. Self-Storage REITs 2.6% 2.6% – – – 12. Metal, Glass & Plastic Containers 2.4% 2.0% 0.3% 0.2% – 13. Trading Companies & Distributors 2.3% 2.2% 0.2% – – 14. Building Products 2.3% 1.9% 0.4% 0.1% – 15. Environmental & Facilities Services 2.0% 2.0% – – – 16. Paper Products 1.8% 0.4% 1.5% – – 17. Other Specialty Retail 1.7% 1.7% – – – 18. Specialty Chemicals 1.7% 1.3% – 0.1% 0.2% 19. Construction Materials 1.5% 1.4% – 0.1% – 20. Diversified Support Services 1.3% 1.0% 0.4% – – 21. Food Distributors 1.3% 1.3% – – – 22. Construction Machinery 1.3% 0.3% 0.5% – 0.5% 23. Consumer Staples Merchandise Retail 1.2% 1.1% 0.1% – – 24. Commodity Chemicals 1.0% 1.0% – 0.0% – 25. Diversified Metals 1.0% 0.4% 0.6% – – Other (61 industries, each < 1% of ABR) 23.7% 18.4% 5.0% 0.2% 0.2% Total 100.0% 61.0% 32.7% 4.6% 1.7% Top 5 Industries Note: Portfolio information reflects pro rata ownership of net lease real estate assets as of September 30, 2026. Percentage metrics are based on total ABR. (1) Industry classification is based on the Global Industry Classification Standard (GICS) framework. (2) Includes 0.4% of ABR from Mauritius (“other”), which is outside of Europe. Broad Mix of Tenant Industries Industry diversification, cross-diversified by geography and tenant, reduces sector-specific risk and strengthens cash flow stability Auto Parts and Equipment Mostly large, tier 1 OEM names with critical facilities primarily located in North America with top exposures to TI Automotive (1.6%), Gestamp (0.4%) and Autokiniton (0.3%) 5% Packaged Foods & Meats Diverse mix of food producers in highly critical facilities primarily located in the U.S. with top exposures to Maker’s Pride (1.1%), Premium Brands (0.8%) and Greenyard (0.7%) 9% Food Retail Primarily cash & carry and grocery formats located in Europe and with top exposures to Metro (1.7%), Fortenova (1.7%) and Eroski (1.4%) 8% Home Improvement Retail Mostly retail DIY stores with some distribution centers primarily located in Europe with top exposures to OBI (1.6%), Senukai (1.4%) and Intergamma (0.9%) 6% Automotive Retail Primarily dealerships mostly located in Europe or Canada and parts retail stores in the U.S. with top exposures to Advance Auto (1.2%), Pendragon (1.1%) and Go Auto (0.8%) 6%
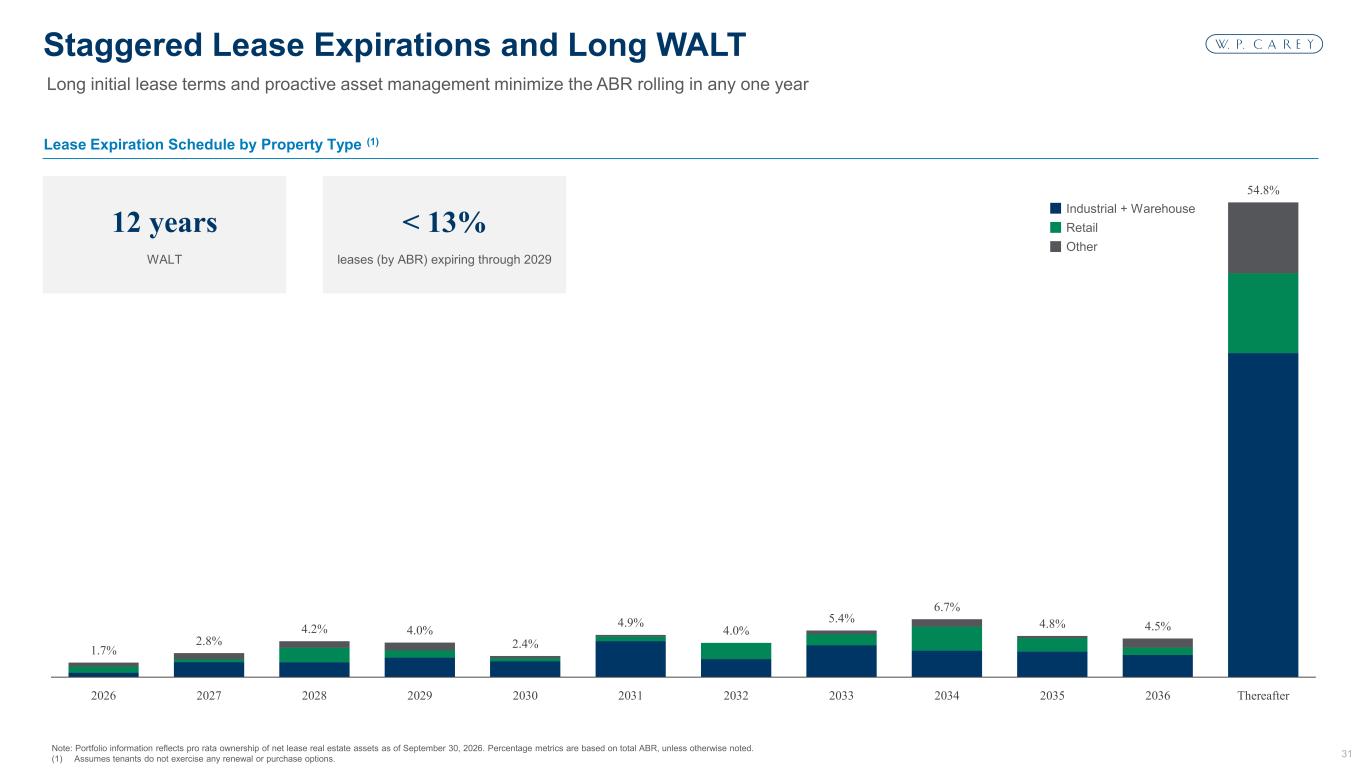
31 Hex #003666 Hex #007CBA Hex #80BEDD Hex #809BB3 Hex #CCD7E1 Hex #E7E6E6 Hex #F4F7FA Hex #BFBFBF Hex #7F7F7F Hex #55565A Hex #3F3F3F Hex #CCE5F1 Hex #D2D0E6 Hex #7773B5 1 2 3 7 8 4 9 10 5 6 11 13 14 12 1.7% 2.8% 4.2% 4.0% 2.4% 4.9% 4.0% 5.4% 6.7% 4.8% 4.5% 54.8% 2026 2027 2028 2029 2030 2031 2032 2033 2034 2035 2036 Thereafter Lease Expiration Schedule by Property Type (1) Note: Portfolio information reflects pro rata ownership of net lease real estate assets as of September 30, 2026. Percentage metrics are based on total ABR, unless otherwise noted. (1) Assumes tenants do not exercise any renewal or purchase options. Staggered Lease Expirations and Long WALT Long initial lease terms and proactive asset management minimize the ABR rolling in any one year Industrial + Warehouse Retail Other 12 years WALT < 13% leases (by ABR) expiring through 2029
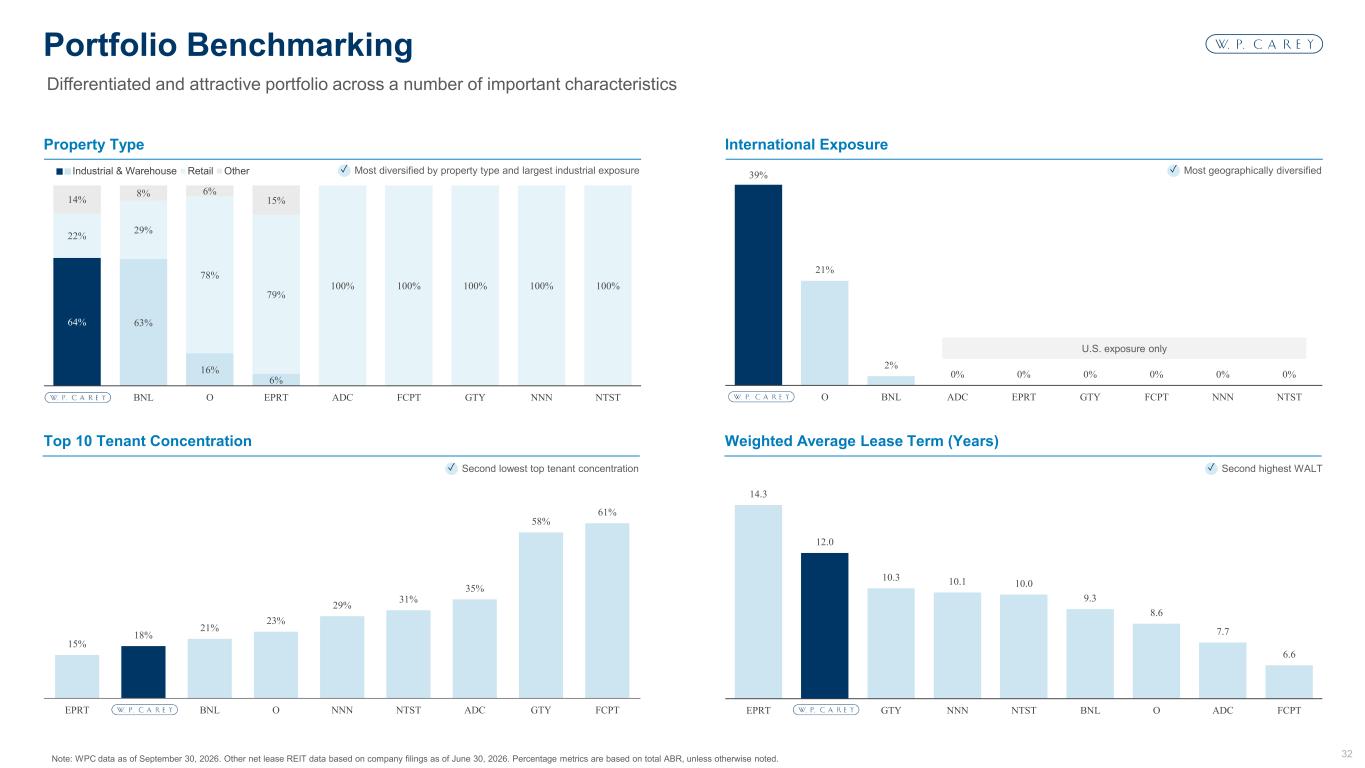
32 Hex #003666 Hex #007CBA Hex #80BEDD Hex #809BB3 Hex #CCD7E1 Hex #E7E6E6 Hex #F4F7FA Hex #BFBFBF Hex #7F7F7F Hex #55565A Hex #3F3F3F Hex #CCE5F1 Hex #D2D0E6 Hex #7773B5 1 2 3 7 8 4 9 10 5 6 11 13 14 12 Top 10 Tenant Concentration Weighted Average Lease Term (Years) Note: WPC data as of September 30, 2026. Other net lease REIT data based on company filings as of June 30, 2026. Percentage metrics are based on total ABR, unless otherwise noted. Portfolio Benchmarking Property Type International Exposure Differentiated and attractive portfolio across a number of important characteristics 39% 21% 2% 0% 0% 0% 0% 0% 0% O BNL ADC EPRT GTY FCPT NNN NTST 15% 18% 21% 23% 29% 31% 35% 58% 61% EPRT BNL O NNN NTST ADC GTY FCPT 14.3 12.0 10.3 10.1 10.0 9.3 8.6 7.7 6.6 EPRT GTY NNN NTST BNL O ADC FCPT 64% 63% 16% 6% 22% 29% 78% 79% 100% 100% 100% 100% 100% 14% 8% 6% 15% BNL O EPRT ADC FCPT GTY NNN NTST Industrial & Warehouse Retail Other Most diversified by property type and largest industrial exposure✓ U.S. exposure only Most geographically diversified✓ Second highest WALT✓Second lowest top tenant concentration✓
33 Hex #003666 Hex #007CBA Hex #80BEDD Hex #809BB3 Hex #CCD7E1 Hex #E7E6E6 Hex #F4F7FA Hex #BFBFBF Hex #7F7F7F Hex #55565A Hex #3F3F3F Hex #CCE5F1 Hex #D2D0E6 Hex #7773B5 1 2 3 7 8 4 9 10 5 6 11 13 14 12 Property: Fedrigoni Balance Sheet
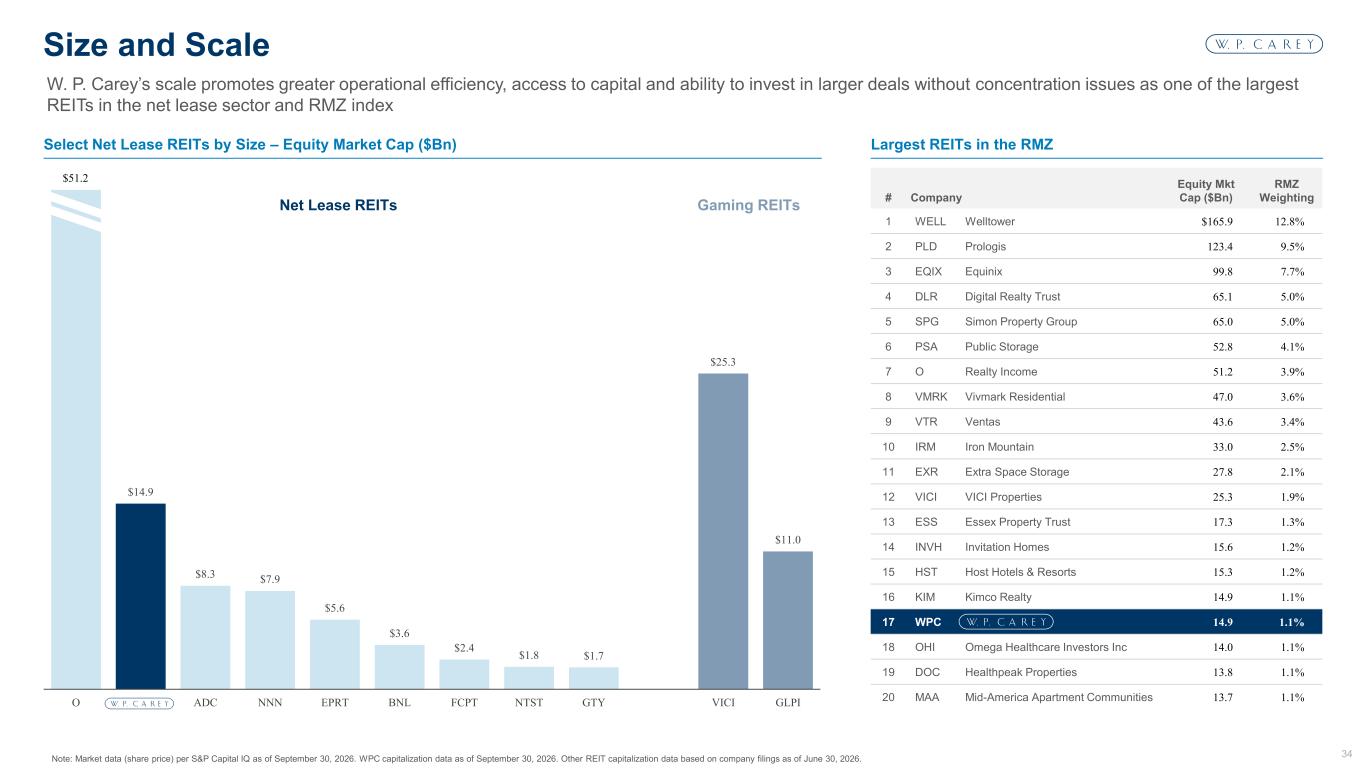
34 Hex #003666 Hex #007CBA Hex #80BEDD Hex #809BB3 Hex #CCD7E1 Hex #E7E6E6 Hex #F4F7FA Hex #BFBFBF Hex #7F7F7F Hex #55565A Hex #3F3F3F Hex #CCE5F1 Hex #D2D0E6 Hex #7773B5 1 2 3 7 8 4 9 10 5 6 11 13 14 12 Select Net Lease REITs by Size – Equity Market Cap ($Bn) Largest REITs in the RMZ Note: Market data (share price) per S&P Capital IQ as of September 30, 2026. WPC capitalization data as of September 30, 2026. Other REIT capitalization data based on company filings as of June 30, 2026. Size and Scale W. P. Carey’s scale promotes greater operational efficiency, access to capital and ability to invest in larger deals without concentration issues as one of the largest REITs in the net lease sector and RMZ index # Company Equity Mkt Cap ($Bn) RMZ Weighting 1 WELL Welltower $165.9 12.8% 2 PLD Prologis 123.4 9.5% 3 EQIX Equinix 99.8 7.7% 4 DLR Digital Realty Trust 65.1 5.0% 5 SPG Simon Property Group 65.0 5.0% 6 PSA Public Storage 52.8 4.1% 7 O Realty Income 51.2 3.9% 8 VMRK Vivmark Residential 47.0 3.6% 9 VTR Ventas 43.6 3.4% 10 IRM Iron Mountain 33.0 2.5% 11 EXR Extra Space Storage 27.8 2.1% 12 VICI VICI Properties 25.3 1.9% 13 ESS Essex Property Trust 17.3 1.3% 14 INVH Invitation Homes 15.6 1.2% 15 HST Host Hotels & Resorts 15.3 1.2% 16 KIM Kimco Realty 14.9 1.1% 17 WPC 14.9 1.1% 18 OHI Omega Healthcare Investors Inc 14.0 1.1% 19 DOC Healthpeak Properties 13.8 1.1% 20 MAA Mid-America Apartment Communities 13.7 1.1% $14.9 $8.3 $7.9 $5.6 $3.6 $2.4 $1.8 $1.7 $25.3 $11.0 O ADC NNN EPRT BNL FCPT NTST GTY VICI GLPI Gaming REITsNet Lease REITs $51.2
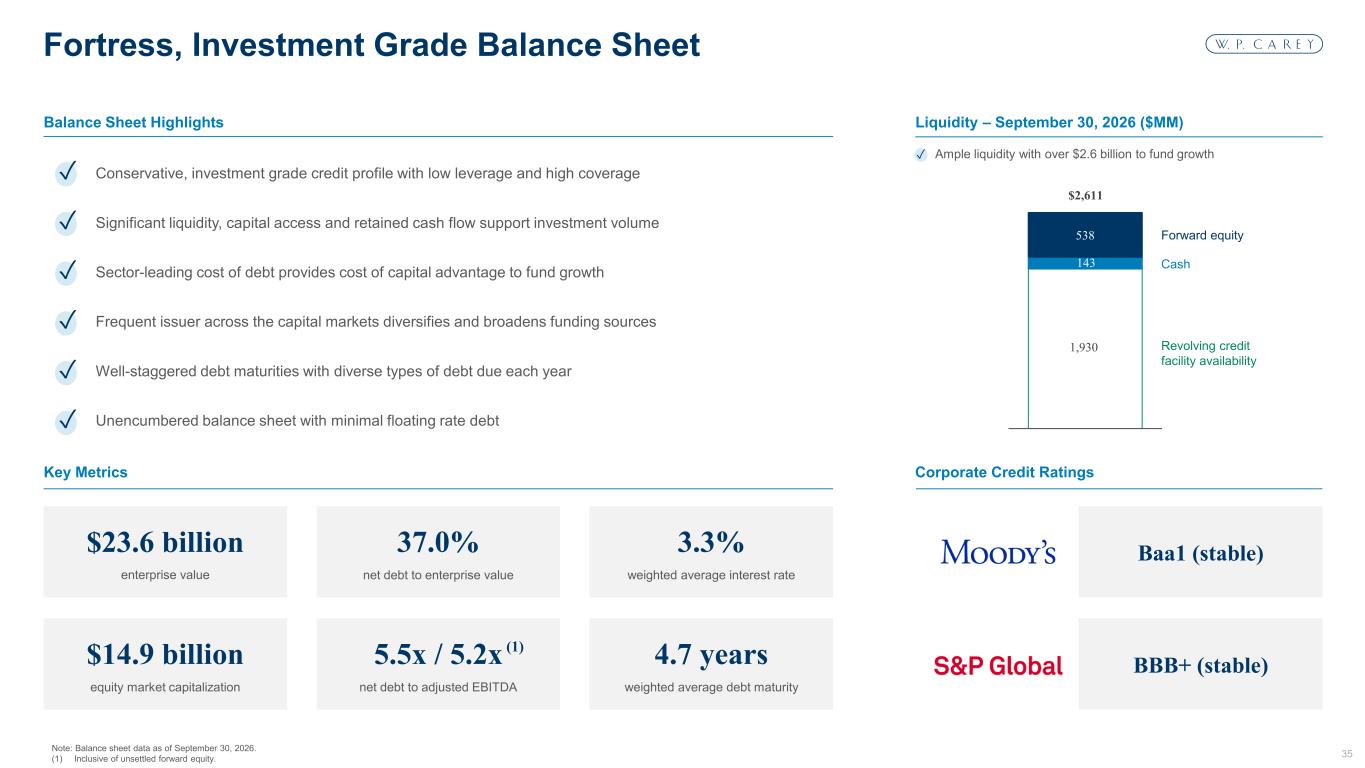
35 Hex #003666 Hex #007CBA Hex #80BEDD Hex #809BB3 Hex #CCD7E1 Hex #E7E6E6 Hex #F4F7FA Hex #BFBFBF Hex #7F7F7F Hex #55565A Hex #3F3F3F Hex #CCE5F1 Hex #D2D0E6 Hex #7773B5 1 2 3 7 8 4 9 10 5 6 11 13 14 12 Baa1 (stable) Balance Sheet Highlights Liquidity – September 30, 2026 ($MM) Note: Balance sheet data as of September 30, 2026. (1) Inclusive of unsettled forward equity. Fortress, Investment Grade Balance Sheet Conservative, investment grade credit profile with low leverage and high coverage Significant liquidity, capital access and retained cash flow support investment volume Sector-leading cost of debt provides cost of capital advantage to fund growth Frequent issuer across the capital markets diversifies and broadens funding sources Well-staggered debt maturities with diverse types of debt due each year Unencumbered balance sheet with minimal floating rate debt ✓ BBB+ (stable) Corporate Credit Ratings 1,930 143 538 $2,611 Forward equity Cash Revolving credit facility availability ✓ ✓ ✓ ✓ ✓ Key Metrics $23.6 billion enterprise value 37.0% net debt to enterprise value 3.3% weighted average interest rate $14.9 billion equity market capitalization 5.5x / 5.2x net debt to adjusted EBITDA 4.7 years weighted average debt maturity Ample liquidity with over $2.6 billion to fund growth✓ (1)
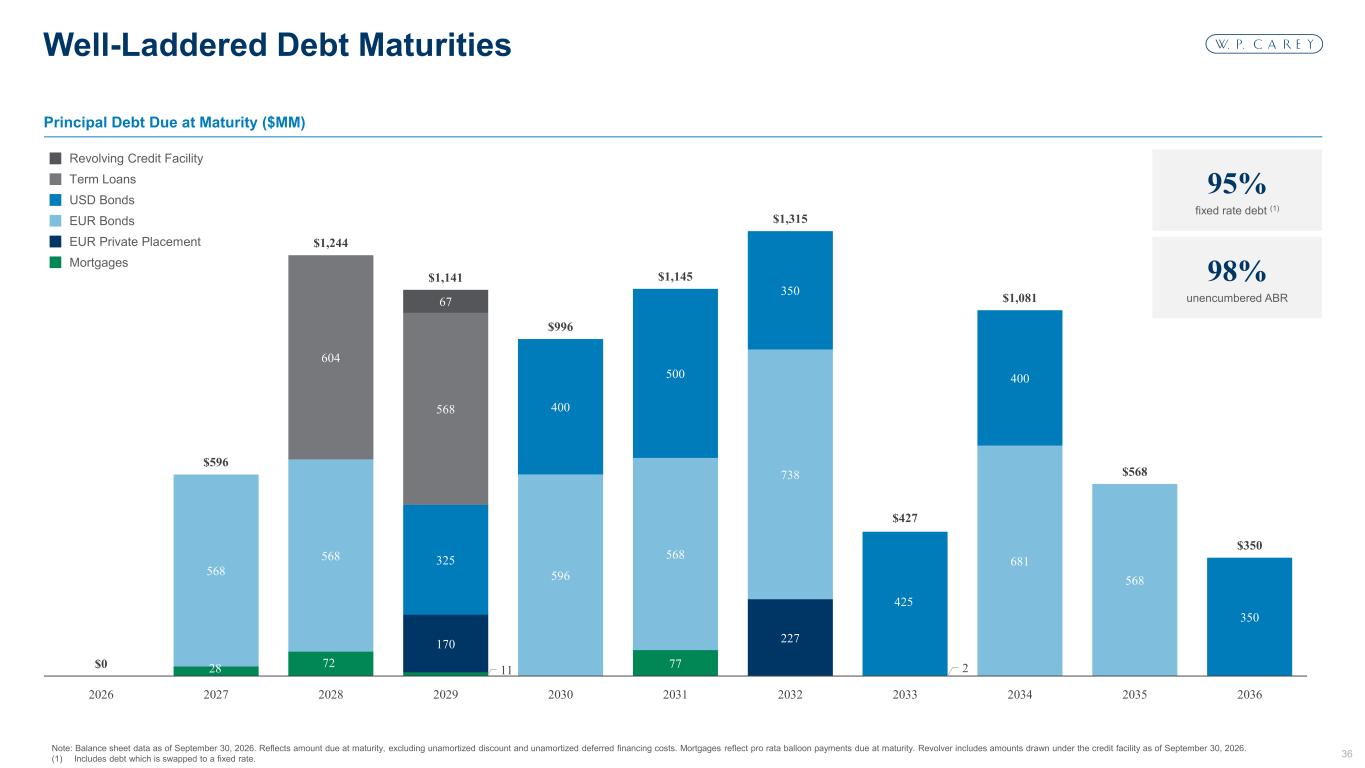
36 Hex #003666 Hex #007CBA Hex #80BEDD Hex #809BB3 Hex #CCD7E1 Hex #E7E6E6 Hex #F4F7FA Hex #BFBFBF Hex #7F7F7F Hex #55565A Hex #3F3F3F Hex #CCE5F1 Hex #D2D0E6 Hex #7773B5 1 2 3 7 8 4 9 10 5 6 11 13 14 12 28 72 11 77 2 170 227 568 568 596 568 738 681 568 325 400 500 350 425 400 350 604 568 67 $0 $596 $1,244 $1,141 $996 $1,145 $1,315 $427 $1,081 $568 $350 2026 2027 2028 2029 2030 2031 2032 2033 2034 2035 2036 Principal Debt Due at Maturity ($MM) Note: Balance sheet data as of September 30, 2026. Reflects amount due at maturity, excluding unamortized discount and unamortized deferred financing costs. Mortgages reflect pro rata balloon payments due at maturity. Revolver includes amounts drawn under the credit facility as of September 30, 2026. (1) Includes debt which is swapped to a fixed rate. Well-Laddered Debt Maturities Revolving Credit Facility Term Loans USD Bonds EUR Bonds EUR Private Placement Mortgages 95% fixed rate debt (1) 98% unencumbered ABR
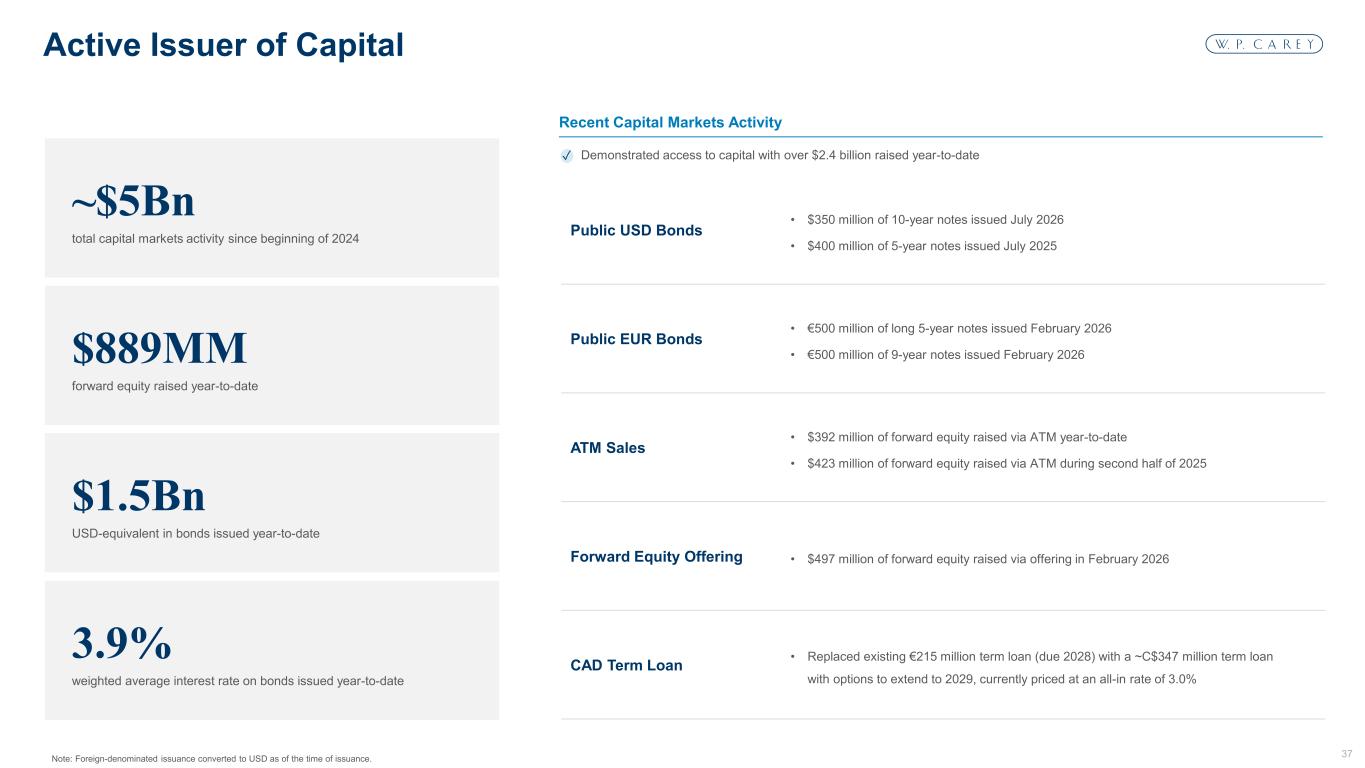
37 Hex #003666 Hex #007CBA Hex #80BEDD Hex #809BB3 Hex #CCD7E1 Hex #E7E6E6 Hex #F4F7FA Hex #BFBFBF Hex #7F7F7F Hex #55565A Hex #3F3F3F Hex #CCE5F1 Hex #D2D0E6 Hex #7773B5 1 2 3 7 8 4 9 10 5 6 11 13 14 12 ~$5Bn total capital markets activity since beginning of 2024 Note: Foreign-denominated issuance converted to USD as of the time of issuance. Active Issuer of Capital $889MM forward equity raised year-to-date $1.5Bn USD-equivalent in bonds issued year-to-date 3.9% weighted average interest rate on bonds issued year-to-date Recent Capital Markets Activity Demonstrated access to capital with over $2.4 billion raised year-to-date✓ Public USD Bonds • $350 million of 10-year notes issued July 2026 • $400 million of 5-year notes issued July 2025 Public EUR Bonds • €500 million of long 5-year notes issued February 2026 • €500 million of 9-year notes issued February 2026 ATM Sales • $392 million of forward equity raised via ATM year-to-date • $423 million of forward equity raised via ATM during second half of 2025 Forward Equity Offering • $497 million of forward equity raised via offering in February 2026 CAD Term Loan • Replaced existing €215 million term loan (due 2028) with a ~C$347 million term loan with options to extend to 2029, currently priced at an all-in rate of 3.0%
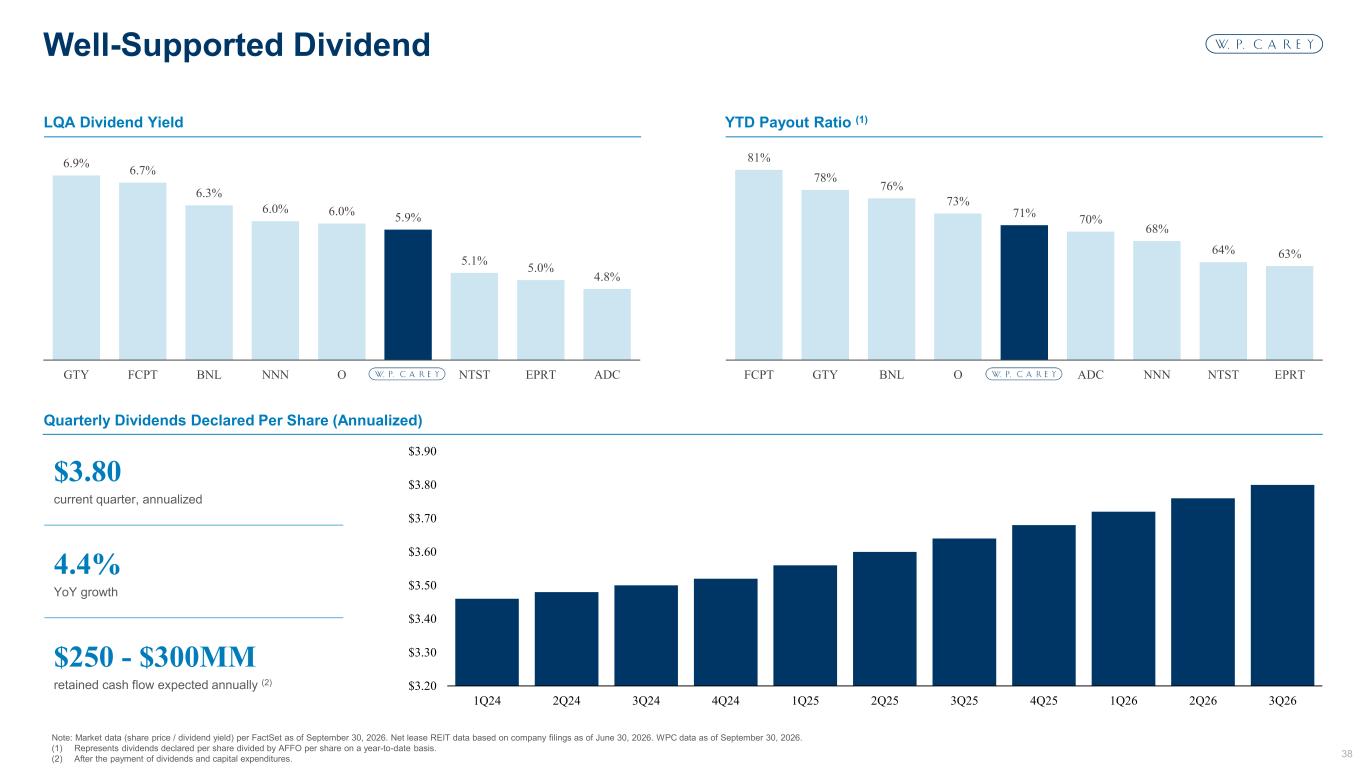
38 Hex #003666 Hex #007CBA Hex #80BEDD Hex #809BB3 Hex #CCD7E1 Hex #E7E6E6 Hex #F4F7FA Hex #BFBFBF Hex #7F7F7F Hex #55565A Hex #3F3F3F Hex #CCE5F1 Hex #D2D0E6 Hex #7773B5 1 2 3 7 8 4 9 10 5 6 11 13 14 12 LQA Dividend Yield YTD Payout Ratio (1) Quarterly Dividends Declared Per Share (Annualized) Note: Market data (share price / dividend yield) per FactSet as of September 30, 2026. Net lease REIT data based on company filings as of June 30, 2026. WPC data as of September 30, 2026. (1) Represents dividends declared per share divided by AFFO per share on a year-to-date basis. (2) After the payment of dividends and capital expenditures. Well-Supported Dividend 6.9% 6.7% 6.3% 6.0% 6.0% 5.9% 5.1% 5.0% 4.8% GTY FCPT BNL NNN O NTST EPRT ADC 81% 78% 76% 73% 71% 70% 68% 64% 63% FCPT GTY BNL O ADC NNN NTST EPRT $3.20 $3.30 $3.40 $3.50 $3.60 $3.70 $3.80 $3.90 1Q24 2Q24 3Q24 4Q24 1Q25 2Q25 3Q25 4Q25 1Q26 2Q26 3Q26 $250 - $300MM retained cash flow expected annually (2) 4.4% YoY growth $3.80 current quarter, annualized
39 Hex #003666 Hex #007CBA Hex #80BEDD Hex #809BB3 Hex #CCD7E1 Hex #E7E6E6 Hex #F4F7FA Hex #BFBFBF Hex #7F7F7F Hex #55565A Hex #3F3F3F Hex #CCE5F1 Hex #D2D0E6 Hex #7773B5 1 2 3 7 8 4 9 10 5 6 11 13 14 12 Property: Intergamma Case Studies
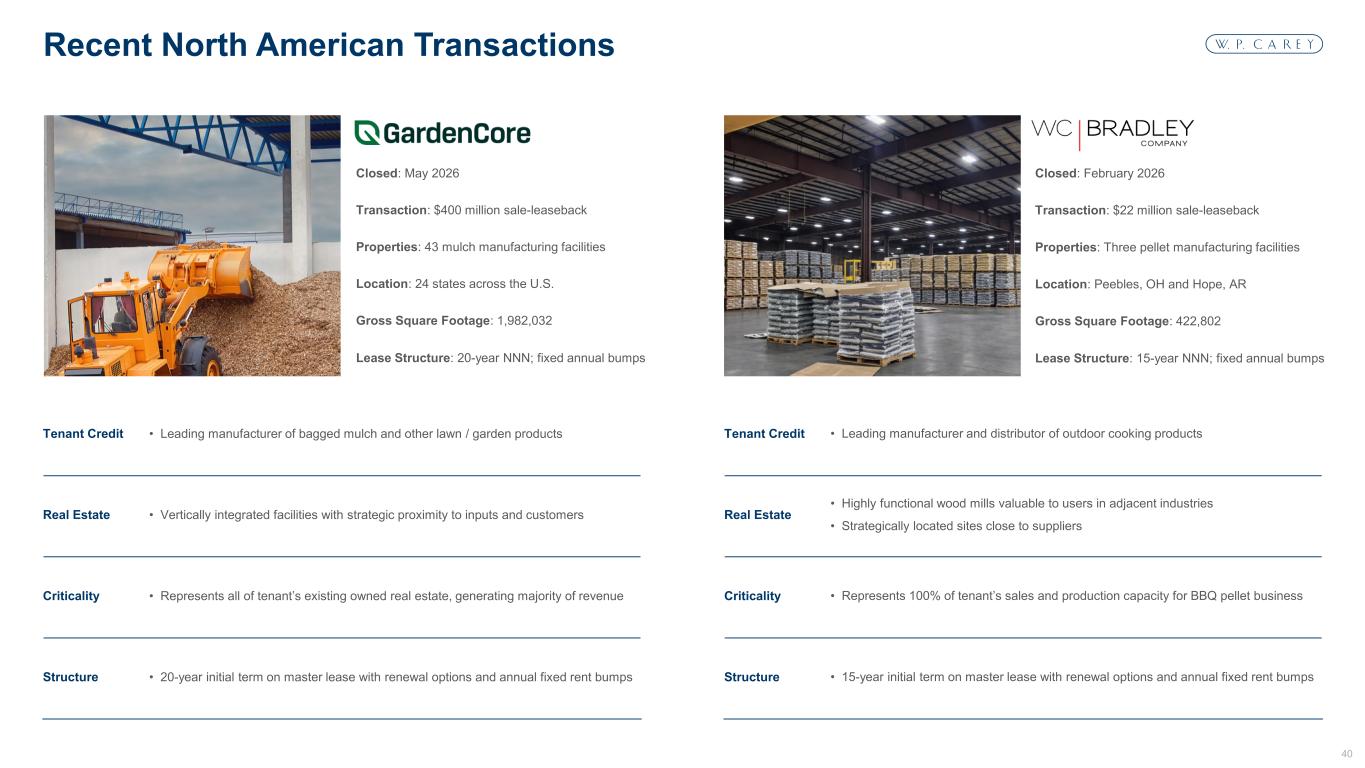
40 Hex #003666 Hex #007CBA Hex #80BEDD Hex #809BB3 Hex #CCD7E1 Hex #E7E6E6 Hex #F4F7FA Hex #BFBFBF Hex #7F7F7F Hex #55565A Hex #3F3F3F Hex #CCE5F1 Hex #D2D0E6 Hex #7773B5 1 2 3 7 8 4 9 10 5 6 11 13 14 12 Tenant Credit • Leading manufacturer of bagged mulch and other lawn / garden products Real Estate • Vertically integrated facilities with strategic proximity to inputs and customers Criticality • Represents all of tenant’s existing owned real estate, generating majority of revenue Structure • 20-year initial term on master lease with renewal options and annual fixed rent bumps Recent North American Transactions Closed: May 2026 Transaction: $400 million sale-leaseback Properties: 43 mulch manufacturing facilities Location: 24 states across the U.S. Gross Square Footage: 1,982,032 Lease Structure: 20-year NNN; fixed annual bumps Closed: February 2026 Transaction: $22 million sale-leaseback Properties: Three pellet manufacturing facilities Location: Peebles, OH and Hope, AR Gross Square Footage: 422,802 Lease Structure: 15-year NNN; fixed annual bumps Tenant Credit • Leading manufacturer and distributor of outdoor cooking products Real Estate • Highly functional wood mills valuable to users in adjacent industries • Strategically located sites close to suppliers Criticality • Represents 100% of tenant’s sales and production capacity for BBQ pellet business Structure • 15-year initial term on master lease with renewal options and annual fixed rent bumps
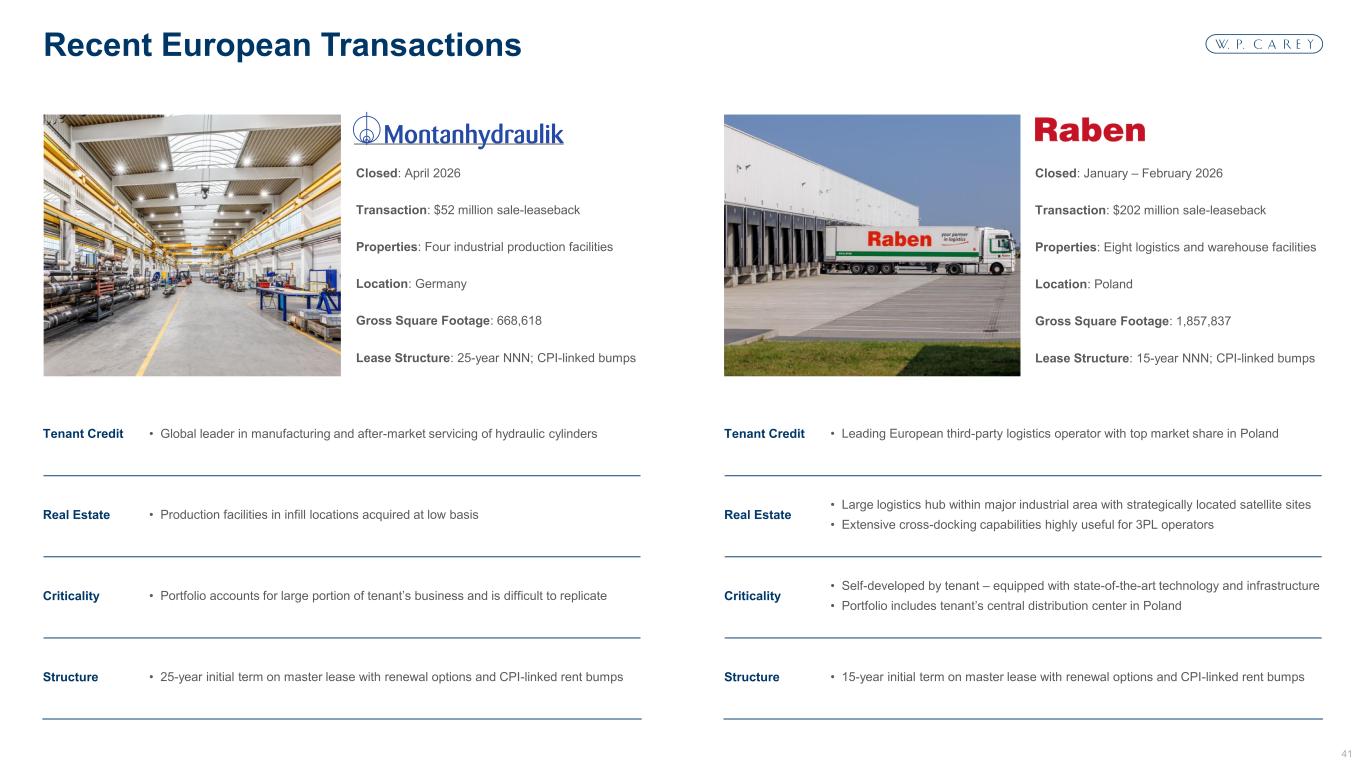
41 Hex #003666 Hex #007CBA Hex #80BEDD Hex #809BB3 Hex #CCD7E1 Hex #E7E6E6 Hex #F4F7FA Hex #BFBFBF Hex #7F7F7F Hex #55565A Hex #3F3F3F Hex #CCE5F1 Hex #D2D0E6 Hex #7773B5 1 2 3 7 8 4 9 10 5 6 11 13 14 12 Tenant Credit • Global leader in manufacturing and after-market servicing of hydraulic cylinders Real Estate • Production facilities in infill locations acquired at low basis Criticality • Portfolio accounts for large portion of tenant’s business and is difficult to replicate Structure • 25-year initial term on master lease with renewal options and CPI-linked rent bumps Recent European Transactions Closed: April 2026 Transaction: $52 million sale-leaseback Properties: Four industrial production facilities Location: Germany Gross Square Footage: 668,618 Lease Structure: 25-year NNN; CPI-linked bumps Closed: January – February 2026 Transaction: $202 million sale-leaseback Properties: Eight logistics and warehouse facilities Location: Poland Gross Square Footage: 1,857,837 Lease Structure: 15-year NNN; CPI-linked bumps Tenant Credit • Leading European third-party logistics operator with top market share in Poland Real Estate • Large logistics hub within major industrial area with strategically located satellite sites • Extensive cross-docking capabilities highly useful for 3PL operators Criticality • Self-developed by tenant – equipped with state-of-the-art technology and infrastructure • Portfolio includes tenant’s central distribution center in Poland Structure • 15-year initial term on master lease with renewal options and CPI-linked rent bumps
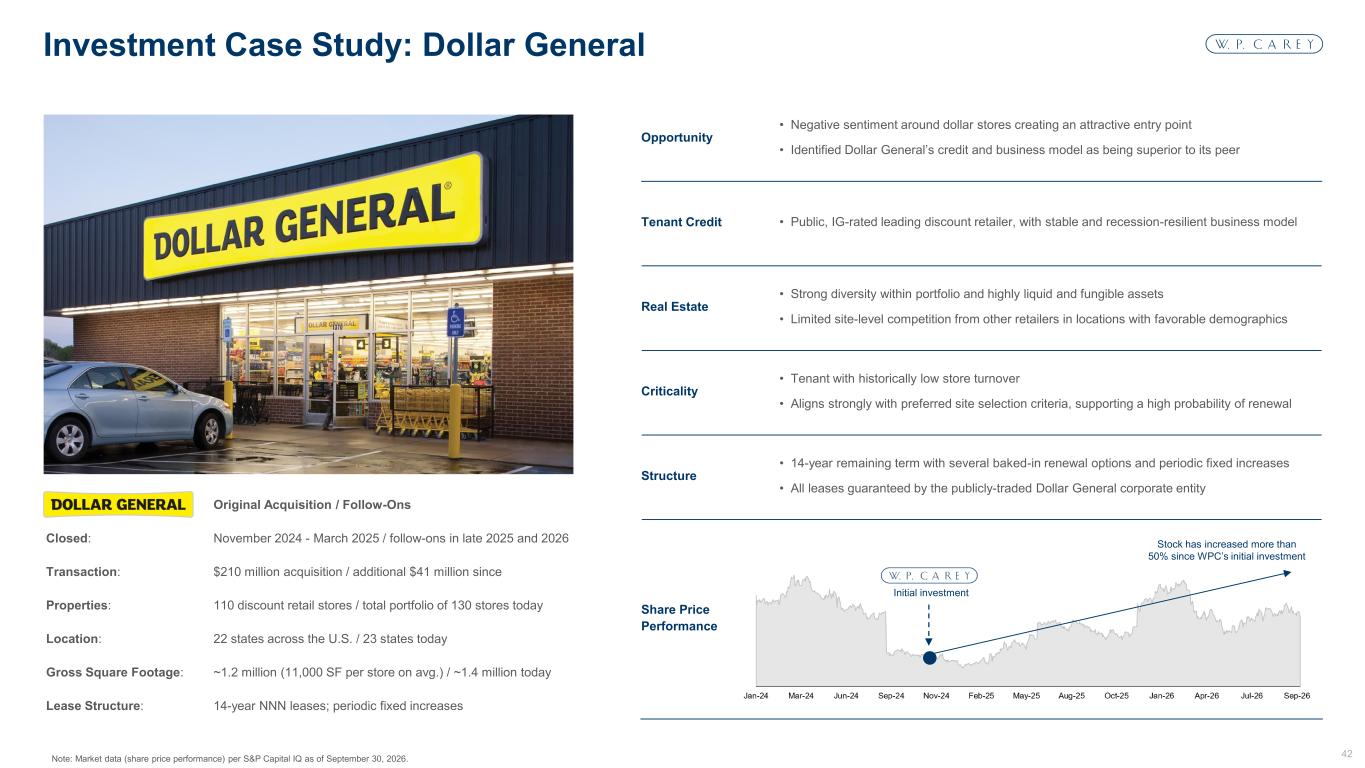
42 Hex #003666 Hex #007CBA Hex #80BEDD Hex #809BB3 Hex #CCD7E1 Hex #E7E6E6 Hex #F4F7FA Hex #BFBFBF Hex #7F7F7F Hex #55565A Hex #3F3F3F Hex #CCE5F1 Hex #D2D0E6 Hex #7773B5 1 2 3 7 8 4 9 10 5 6 11 13 14 12 Opportunity • Negative sentiment around dollar stores creating an attractive entry point • Identified Dollar General’s credit and business model as being superior to its peer Tenant Credit • Public, IG-rated leading discount retailer, with stable and recession-resilient business model Real Estate • Strong diversity within portfolio and highly liquid and fungible assets • Limited site-level competition from other retailers in locations with favorable demographics Criticality • Tenant with historically low store turnover • Aligns strongly with preferred site selection criteria, supporting a high probability of renewal Structure • 14-year remaining term with several baked-in renewal options and periodic fixed increases • All leases guaranteed by the publicly-traded Dollar General corporate entity Share Price Performance Note: Market data (share price performance) per S&P Capital IQ as of September 30, 2026. Investment Case Study: Dollar General Stock has increased more than 50% since WPC’s initial investment Initial investment Original Acquisition / Follow-Ons Closed: November 2024 - March 2025 / follow-ons in late 2025 and 2026 Transaction: $210 million acquisition / additional $41 million since Properties: 110 discount retail stores / total portfolio of 130 stores today Location: 22 states across the U.S. / 23 states today Gross Square Footage: ~1.2 million (11,000 SF per store on avg.) / ~1.4 million today Lease Structure: 14-year NNN leases; periodic fixed increases
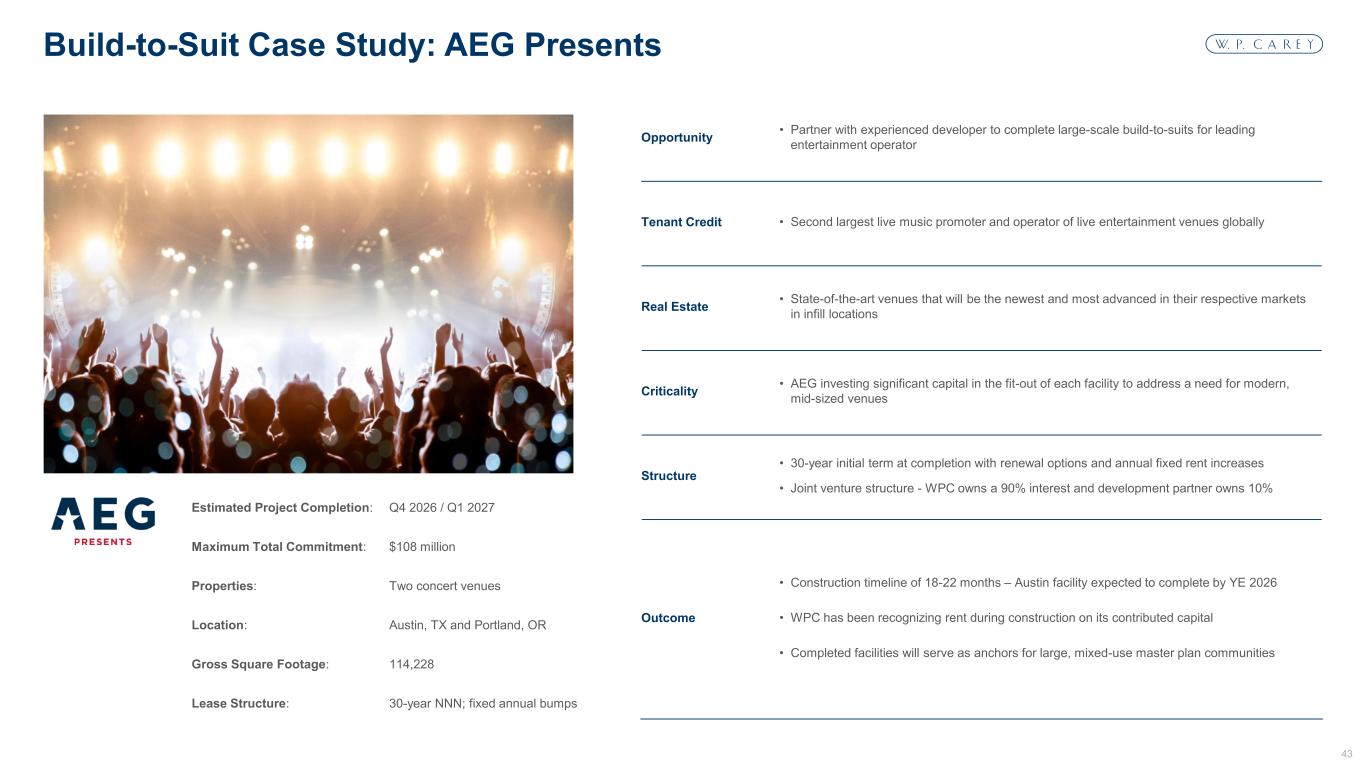
43 Hex #003666 Hex #007CBA Hex #80BEDD Hex #809BB3 Hex #CCD7E1 Hex #E7E6E6 Hex #F4F7FA Hex #BFBFBF Hex #7F7F7F Hex #55565A Hex #3F3F3F Hex #CCE5F1 Hex #D2D0E6 Hex #7773B5 1 2 3 7 8 4 9 10 5 6 11 13 14 12 Build-to-Suit Case Study: AEG Presents Estimated Project Completion: Q4 2026 / Q1 2027 Maximum Total Commitment: $108 million Properties: Two concert venues Location: Austin, TX and Portland, OR Gross Square Footage: 114,228 Lease Structure: 30-year NNN; fixed annual bumps Opportunity • Partner with experienced developer to complete large-scale build-to-suits for leading entertainment operator Tenant Credit • Second largest live music promoter and operator of live entertainment venues globally Real Estate • State-of-the-art venues that will be the newest and most advanced in their respective markets in infill locations Criticality • AEG investing significant capital in the fit-out of each facility to address a need for modern, mid-sized venues Structure • 30-year initial term at completion with renewal options and annual fixed rent increases • Joint venture structure - WPC owns a 90% interest and development partner owns 10% Outcome • Construction timeline of 18-22 months – Austin facility expected to complete by YE 2026 • WPC has been recognizing rent during construction on its contributed capital • Completed facilities will serve as anchors for large, mixed-use master plan communities
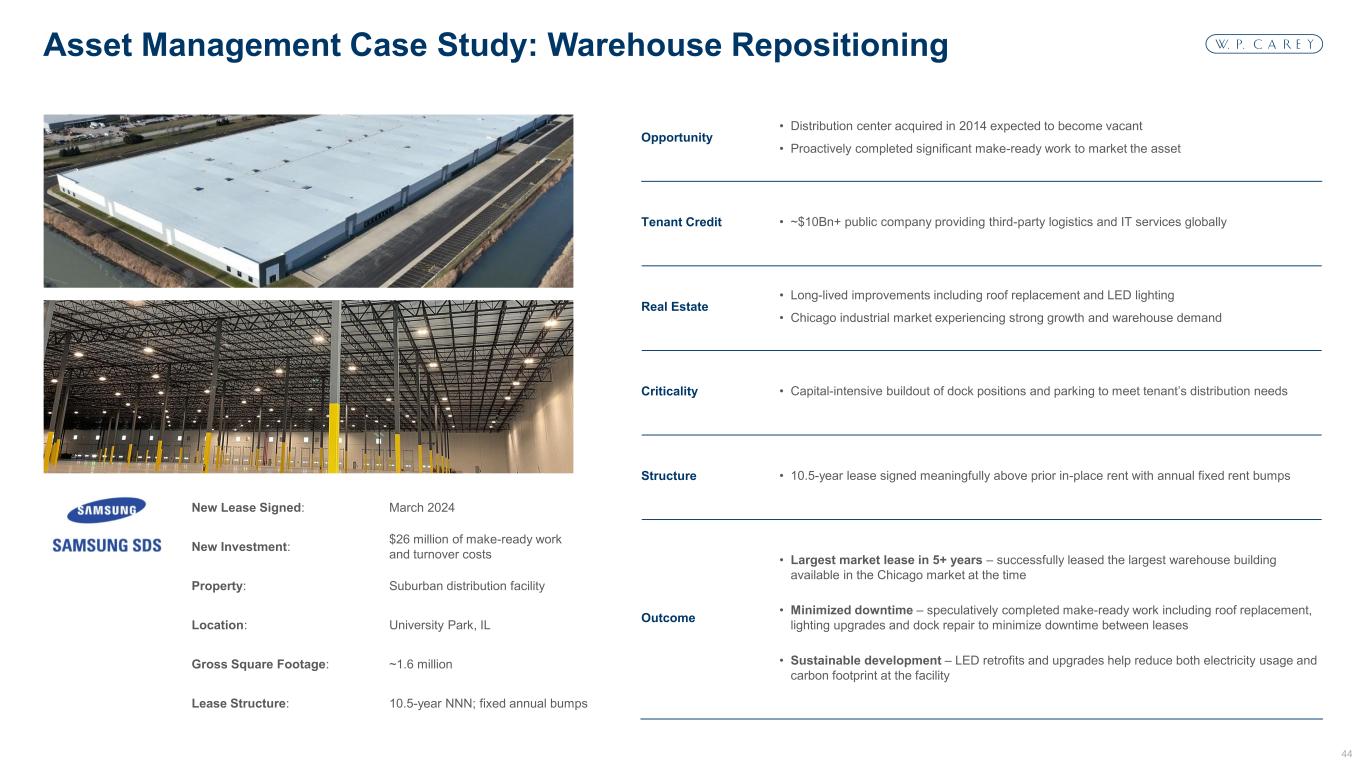
44 Hex #003666 Hex #007CBA Hex #80BEDD Hex #809BB3 Hex #CCD7E1 Hex #E7E6E6 Hex #F4F7FA Hex #BFBFBF Hex #7F7F7F Hex #55565A Hex #3F3F3F Hex #CCE5F1 Hex #D2D0E6 Hex #7773B5 1 2 3 7 8 4 9 10 5 6 11 13 14 12 Asset Management Case Study: Warehouse Repositioning New Lease Signed: March 2024 New Investment: $26 million of make-ready work and turnover costs Property: Suburban distribution facility Location: University Park, IL Gross Square Footage: ~1.6 million Lease Structure: 10.5-year NNN; fixed annual bumps Opportunity • Distribution center acquired in 2014 expected to become vacant • Proactively completed significant make-ready work to market the asset Tenant Credit • ~$10Bn+ public company providing third-party logistics and IT services globally Real Estate • Long-lived improvements including roof replacement and LED lighting • Chicago industrial market experiencing strong growth and warehouse demand Criticality • Capital-intensive buildout of dock positions and parking to meet tenant’s distribution needs Structure • 10.5-year lease signed meaningfully above prior in-place rent with annual fixed rent bumps Outcome • Largest market lease in 5+ years – successfully leased the largest warehouse building available in the Chicago market at the time • Minimized downtime – speculatively completed make-ready work including roof replacement, lighting upgrades and dock repair to minimize downtime between leases • Sustainable development – LED retrofits and upgrades help reduce both electricity usage and carbon footprint at the facility
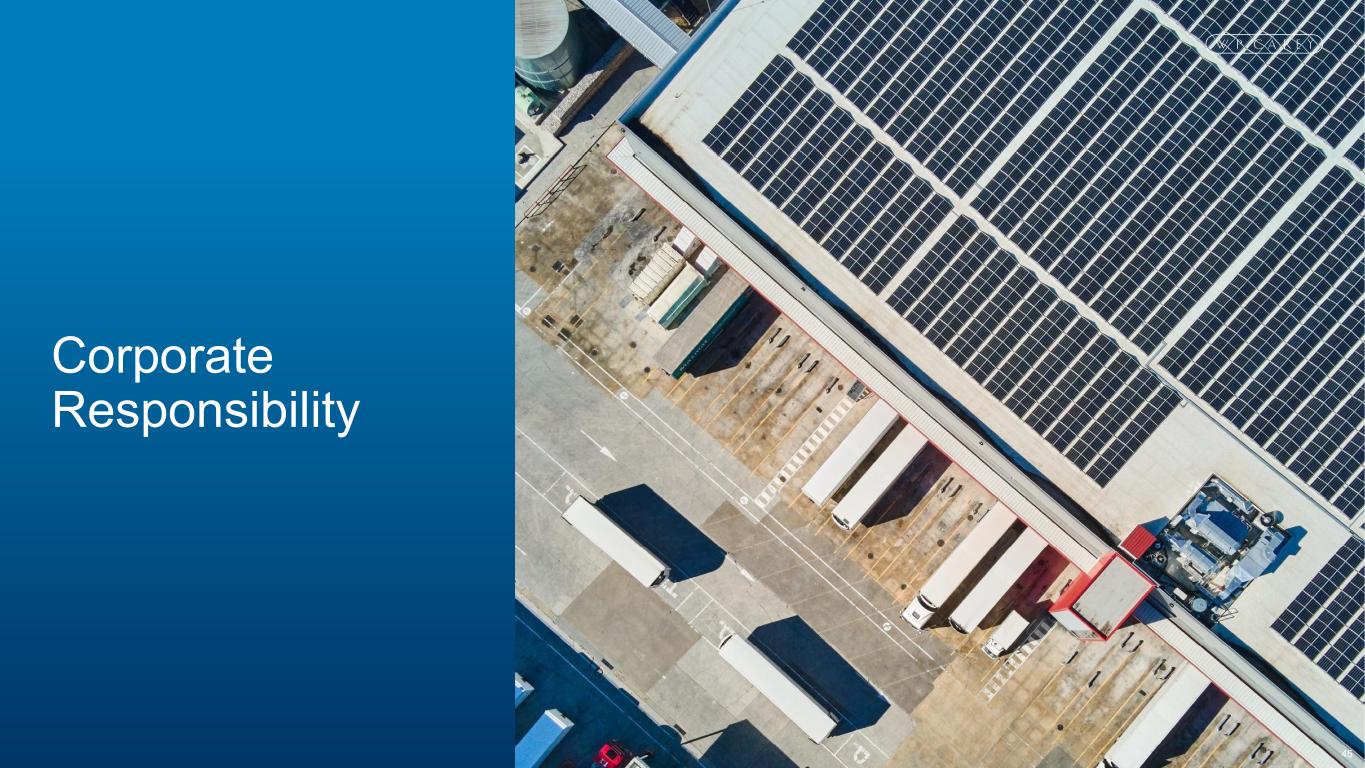
45 Hex #003666 Hex #007CBA Hex #80BEDD Hex #809BB3 Hex #CCD7E1 Hex #E7E6E6 Hex #F4F7FA Hex #BFBFBF Hex #7F7F7F Hex #55565A Hex #3F3F3F Hex #CCE5F1 Hex #D2D0E6 Hex #7773B5 1 2 3 7 8 4 9 10 5 6 11 13 14 12 Property: Sonae Corporate Responsibility
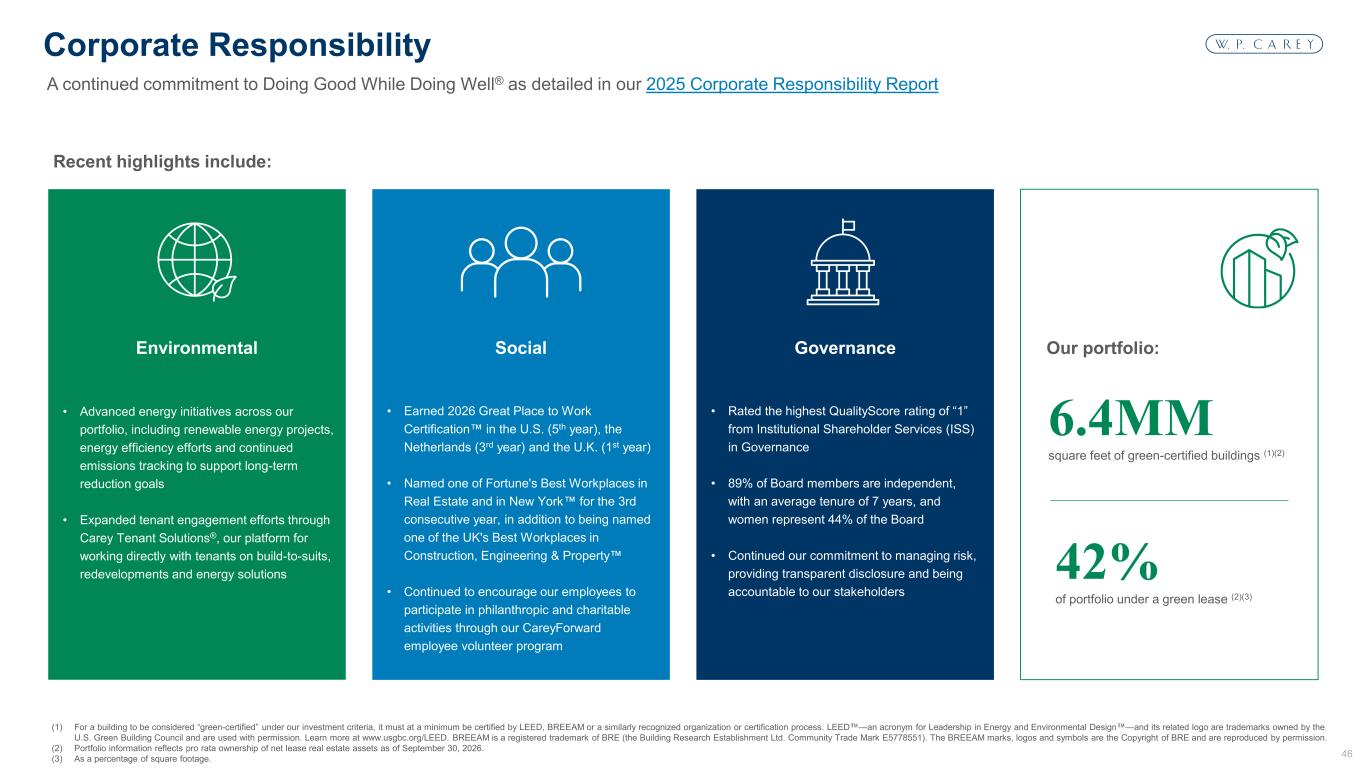
46 Hex #003666 Hex #007CBA Hex #80BEDD Hex #809BB3 Hex #CCD7E1 Hex #E7E6E6 Hex #F4F7FA Hex #BFBFBF Hex #7F7F7F Hex #55565A Hex #3F3F3F Hex #CCE5F1 Hex #D2D0E6 Hex #7773B5 1 2 3 7 8 4 9 10 5 6 11 13 14 12 (1) For a building to be considered “green-certified” under our investment criteria, it must at a minimum be certified by LEED, BREEAM or a similarly recognized organization or certification process. LEED —an acronym for Leadership in Energy and Environmental Design —and its related logo are trademarks owned by the U.S. Green Building Council and are used with permission. Learn more at www.usgbc.org/LEED. BREEAM is a registered trademark of BRE (the Building Research Establishment Ltd. Community Trade Mark E5778551). The BREEAM marks, logos and symbols are the Copyright of BRE and are reproduced by permission. (2) Portfolio information reflects pro rata ownership of net lease real estate assets as of September 30, 2026. (3) As a percentage of square footage. A continued commitment to Doing Good While Doing Well® as detailed in our 2025 Corporate Responsibility Report Corporate Responsibility Recent highlights include: Environmental Social Governance 6.4MM square feet of green-certified buildings (1)(2) 42% of portfolio under a green lease (2)(3) • Earned 2026 Great Place to Work Certification in the U.S. (5th year), the Netherlands (3rd year) and the U.K. (1st year) • Named one of Fortune's Best Workplaces in Real Estate and in New York for the 3rd consecutive year, in addition to being named one of the UK's Best Workplaces in Construction, Engineering & Property • Continued to encourage our employees to participate in philanthropic and charitable activities through our CareyForward employee volunteer program • Rated the highest QualityScore rating of “1” from Institutional Shareholder Services (ISS) in Governance • 89% of Board members are independent, with an average tenure of 7 years, and women represent 44% of the Board • Continued our commitment to managing risk, providing transparent disclosure and being accountable to our stakeholders • Advanced energy initiatives across our portfolio, including renewable energy projects, energy efficiency efforts and continued emissions tracking to support long-term reduction goals • Expanded tenant engagement efforts through Carey Tenant Solutions®, our platform for working directly with tenants on build-to-suits, redevelopments and energy solutions Our portfolio:
47 Hex #003666 Hex #007CBA Hex #80BEDD Hex #809BB3 Hex #CCD7E1 Hex #E7E6E6 Hex #F4F7FA Hex #BFBFBF Hex #7F7F7F Hex #55565A Hex #3F3F3F Hex #CCE5F1 Hex #D2D0E6 Hex #7773B5 1 2 3 7 8 4 9 10 5 6 11 13 14 12 The following non-GAAP financial measures are used in this presentation Disclosures Non-GAAP Financial Disclosures In the real estate industry, analysts and investors employ certain non-GAAP supplemental financial measures in order to facilitate meaningful comparisons between periods and among peer companies. Additionally, in the formulation of our goals and evaluation of the effectiveness of our strategies, we use certain non-GAAP measures defined by our management. We have included definitions of certain of these measures below. Our supplemental financial information and our Form 10-K for the year ended December 31, 2025, that we furnished and filed with the SEC on February 10, 2026, and February 11, 2026, respectively, provide additional information on our non-GAAP measures, including reconciliations to the most directly comparable GAAP measures. These materials are not incorporated by reference herein. AFFO Due to certain unique operating characteristics of real estate companies, as discussed below, NAREIT, an industry trade group, has promulgated a non-GAAP measure known as FFO, which we believe to be an appropriate supplemental measure, when used in addition to and in conjunction with results presented in accordance with GAAP, to reflect the operating performance of a REIT. The use of FFO is recommended by the REIT industry as a supplemental non-GAAP measure. FFO is not equivalent to, nor a substitute for, net income or loss as determined under GAAP. We modify the NAREIT computation of FFO to adjust GAAP net income for certain non-cash charges, such as amortization of real estate-related intangibles, deferred income tax benefits and expenses, straight-line rent and related reserves, other non- cash rent adjustments, non-cash allowance for credit losses on loans receivable and finance leases, stock-based compensation, non-cash environmental accretion expense, amortization of discounts and premiums on debt and amortization of deferred financing costs. Our assessment of our operations is focused on long-term sustainability and not on such non-cash items, which may cause short-term fluctuations in net income but have no impact on cash flows. Additionally, we exclude non-core income and expenses, such as gains or losses from extinguishment of debt, gains or losses on the mark-to-market fair value of equity securities, merger and acquisition expenses, spin-off expenses, and income and expenses associated with our captive insurance company. We also exclude realized and unrealized gains/losses on foreign currency exchange rate movements (other than those realized on the settlement of foreign currency derivatives), which are not considered fundamental attributes of our business plan and do not affect our overall long-term operating performance. We refer to our modified definition of FFO as AFFO. We exclude these items from GAAP net income to arrive at AFFO because they are not the primary drivers in our decision-making process and excluding these items provides investors with a view of our portfolio performance over time and makes it more comparable to other REITs. AFFO also reflects adjustments for unconsolidated partnerships and jointly owned investments. We use AFFO as one measure of our operating performance when we formulate corporate goals, evaluate the effectiveness of our strategies and determine executive compensation. We believe that AFFO is a useful supplemental measure for investors to consider because we believe it will help them better assess the sustainability of our operating performance without the potentially distorting impact of these short-term fluctuations. However, there are limits on the usefulness of AFFO to investors. For example, impairment charges and unrealized foreign currency exchange rate losses that we exclude may become actual realized losses upon the ultimate disposition of the properties in the form of lower cash proceeds or other considerations. We use our FFO and AFFO measures as supplemental financial measures of operating performance. We do not use our FFO and AFFO measures as, nor should they be considered to be, alternatives to net income computed under GAAP, alternatives to net cash provided by operating activities computed under GAAP, or indicators of our ability to fund our cash needs. Adjusted EBITDA We believe that EBITDA is a useful supplemental measure to investors and analysts for assessing the performance of our business because (i) it removes the impact of our capital structure from our operating results and (ii) it is helpful when comparing our operating performance to that of companies in our industry without regard to such items, which can vary substantially from company to company. Adjusted EBITDA as disclosed represents EBITDA modified to include other adjustments to GAAP net income for certain non-cash charges, such as impairments, non-cash rent adjustments and unrealized gains and losses from our hedging activity. Additionally, we exclude gains and losses on sale of real estate, which are not considered fundamental attributes of our business plans and do not affect our overall long-term operating performance. We exclude these items from adjusted EBITDA because they are not the primary drivers in our decision-making process. Adjusted EBITDA reflects adjustments for unconsolidated partnerships and jointly owned investments. Adjusted EBITDA is also modified to reflect the pro forma impact of our investment and disposition activity, assuming all activity occurred at the beginning of the applicable period. This includes adjustments to recurring revenue and expenses related to properties acquired or disposed of, and capital investments and commitments completed, during the applicable period. Our assessment of our operations is focused on long- term sustainability and not on such non-cash and non-core items, which may cause short-term fluctuations in net income but have no impact on cash flows. We believe that adjusted EBITDA is a useful supplemental measure and representation of the performance of our business to investors and analysts, although it does not represent net income that is computed in accordance with GAAP. Accordingly, adjusted EBITDA should not be considered an alternative to net income or an indicator of our financial performance. EBITDA and adjusted EBITDA as calculated by us may not be comparable to similarly titled measures of other companies.
48 Hex #003666 Hex #007CBA Hex #80BEDD Hex #809BB3 Hex #CCD7E1 Hex #E7E6E6 Hex #F4F7FA Hex #BFBFBF Hex #7F7F7F Hex #55565A Hex #3F3F3F Hex #CCE5F1 Hex #D2D0E6 Hex #7773B5 1 2 3 7 8 4 9 10 5 6 11 13 14 12 Other Metrics Pro Rata Metrics This presentation contains certain metrics prepared on a pro rata basis. We refer to these metrics as pro rata metrics. We have certain investments in which our economic ownership is less than 100%. On a full consolidation basis, we report 100% of the assets, liabilities, revenues and expenses of those investments that are deemed to be under our control or for which we are deemed to be the primary beneficiary, even if our ownership is less than 100%. Also, for all other jointly owned investments, which we do not control, we report our net investment and our net income or loss from that investment. On a pro rata basis, we generally present our proportionate share, based on our economic ownership of these jointly owned investments, of the assets, liabilities, revenues and expenses of those investments. Multiplying each of our jointly owned investments’ financial statement line items by our percentage ownership and adding or subtracting those amounts from our totals, as applicable, may not accurately depict the legal and economic implications of holding an ownership interest of less than 100% in our jointly owned investments. ABR ABR represents contractual minimum annualized base rent for our net-leased properties and reflects exchange rates as of September 30, 2026. If there is a rent abatement, we annualize the first monthly contractual base rent following the free rent period. ABR is not applicable to operating properties and is presented on a pro rata basis. Contractual Same-Store Rent Growth Same-store portfolio includes leases on our net leased properties that were continuously in place during a twelve-month period (from September 30, 2025 to September 30, 2026 for the current quarter). Excludes leases for properties that were acquired, sold or vacated, or were subject to lease renewals, extensions or modifications at any time that affected ABR during that period. For purposes of comparability, ABR is presented on a constant currency basis using exchange rates as of the last day of the period (September 30, 2026 for the current quarter). Net Debt / Net Debt – Inclusive of Unsettled Forward Equity Represents total pro rata debt outstanding (excluding unamortized discount and unamortized deferred financing costs) less consolidated cash and cash equivalents. Net debt – inclusive of unsettled forward equity reflects the impact of (i) shares of unsettled forward equity, as if they had been settled for cash and (ii) shares of unsettled “at-the-market” forward equity as of September 30, 2026, as if they had been settled for cash. Disclosures (cont’d)