Shareholder Report
Aug. 31, 2026
USD ($)
$ / shares
This report describes changes
to the Fund that occurred during the reporting period.
WHAT
WERE THE FUND COSTS FOR THE LAST YEAR? (based
on a hypothetical $10,000 investment)
|
Class
Name |
Costs
of a $10,000 investment
|
Costs
paid as a percentage of a $10,000
investment*
|
|
Class
A |
$108
|
1.02%
|
HOW
DID THE FUND PERFORM LAST YEAR AND WHAT AFFECTED ITS PERFORMANCE?
For the twelve months ended August
31, 2026, Class A shares of
Templeton Growth Fund Inc. returned 12.38%.
The Fund compares its performance
to the MSCI All Country World Index-NR, which returned 22.35% for the same period.
PERFORMANCE
HIGHLIGHTS
|
Top
contributors to performance: | |
|
↑
|
Stock
selection in the utilities and financials sectors and an underweight in the consumers staples sector contributed to relative performance
for the year. |
|
↑
|
Geographically,
stock selection in Japan and the U.K. contributed significantly to relative performance. |
|
↑
|
Samsung
Electronics, Taiwan Semiconductor Manufacturing, ASM International, Honeywell International and ING Groep were the
top five contributors to relative performance for the period. |
|
Top
detractors from performance: | |
|
↓
|
Stock
selection and an underweight in the information technology sector, stock selection and an overweight in the materials sector
and stock selection in the health care sector detracted from relative performance for the year. |
|
↓
|
Geographically,
stock selection in the U.S. was the most significant detractor. |
|
↓
|
Icon,
Nike, HDFC Bank, Intel Corp (underweight) and Intuit were the top five detractors from relative performance for the year.
|
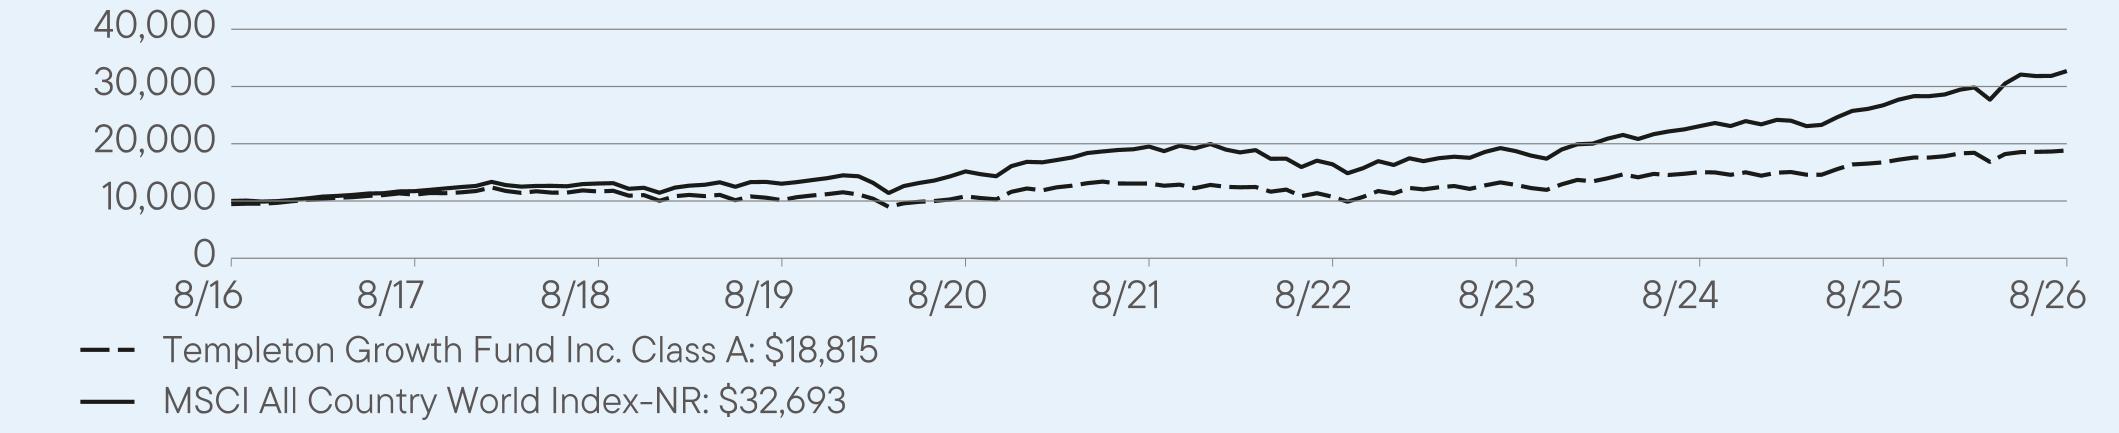
AVERAGE
ANNUAL TOTAL RETURNS (%) Period
Ended August 31, 2026
|
|
1
Year |
5
Year |
10
Year |
|
Class
A |
12.38
|
7.60
|
7.13
|
|
Class
A (with sales charge) |
6.20
|
6.39
|
6.52
|
|
MSCI
All Country World Index-NR |
22.35
|
10.89
|
12.58
|
For current month-end performance,
please call Franklin Templeton at (800)
DIAL BEN/342-5236 or visit
https://www.franklintempleton.com/investments/options/mutual-funds.
https://www.franklintempleton.com/investments/options/mutual-funds.
Important data provider notices
and terms available at www.franklintempletondatasources.com.
KEY
FUND STATISTICS (as
of August 31, 2026)
|
Total
Net Assets |
$9,155,620,861
|
|
Total
Number of Portfolio Holdings |
65
|
|
Total
Management Fee Paid |
$63,538,349
|
|
Portfolio
Turnover Rate |
82.19%
|
WHAT
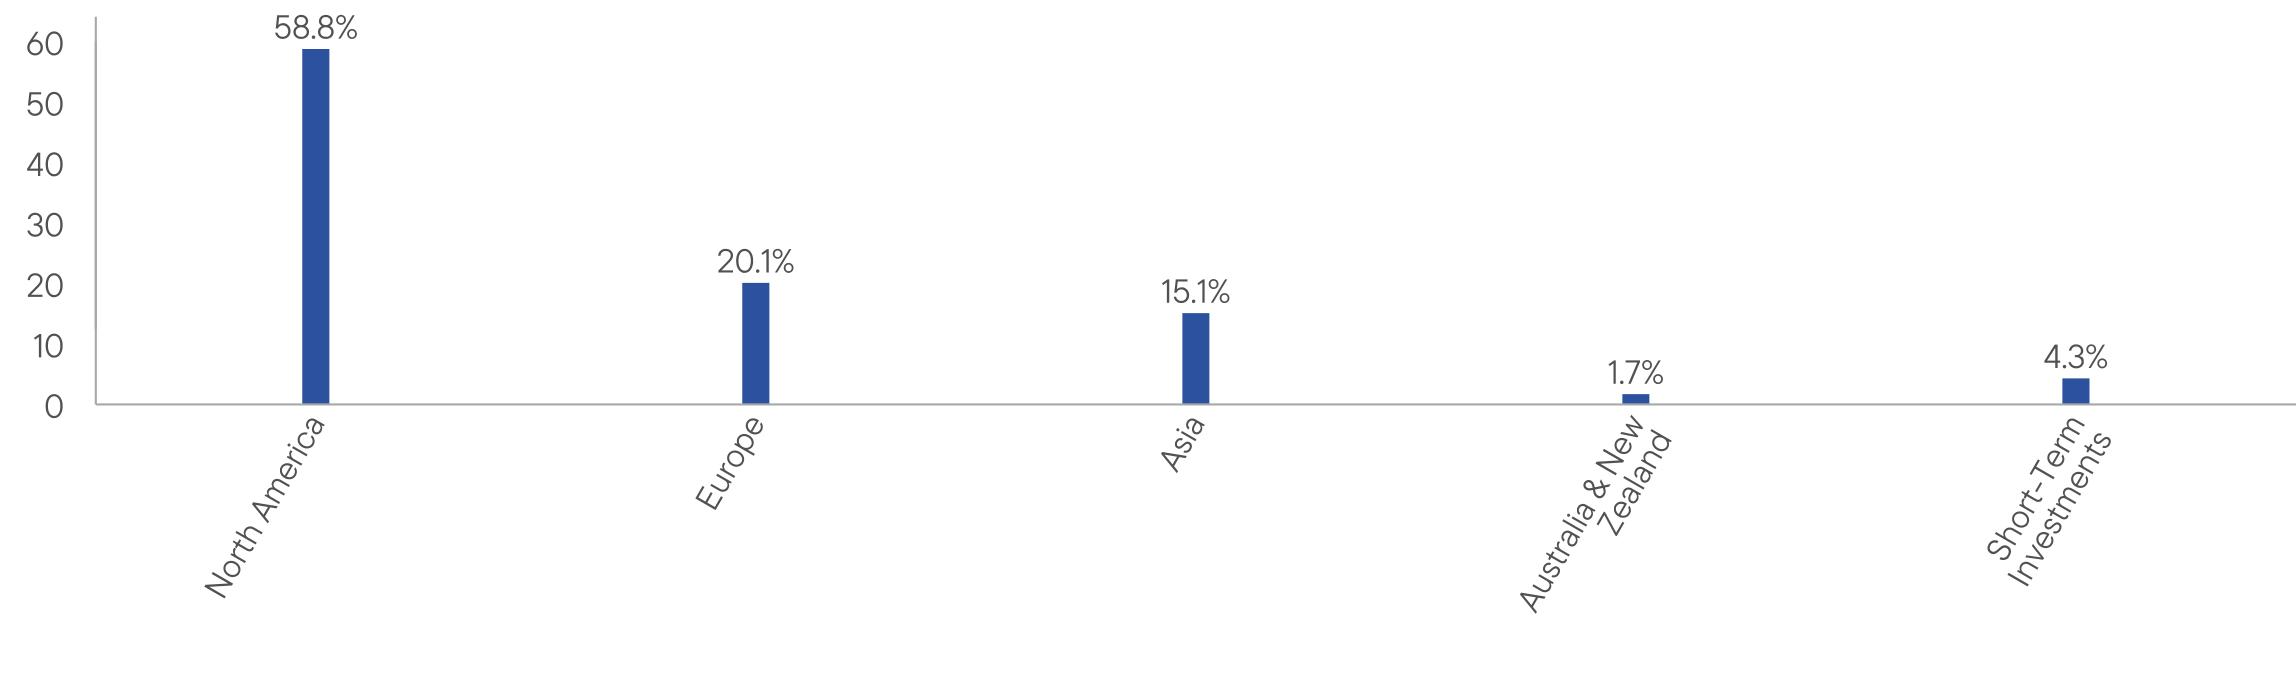
DID THE FUND INVEST IN? (as
of August 31, 2026)
Portfolio Composition*
(% of Total Investments)
HOW
HAS THE FUND CHANGED?
On
January 1, 2026, the Fund’s principal investment strategies were revised to reflect reduced exposure to investments in derivative
instruments and equity-linked
notes.
In
connection with these changes, principal risk disclosure regarding derivative instruments and equity-linked notes was removed from the
principal risks section of the prospectus.
This
is a summary of certain changes to the Fund since September
1, 2025. For
more complete information, you may review the Fund’s current
prospectus and any applicable supplements and the Fund’s next prospectus, which we expect to be available by January
1, 2027, at https://www.franklintempleton.com/regulatory-fund-documents
or upon request at (800)
DIAL BEN/342-5236
or prospectus.us.franklintempleton@fisglobal.com.
This report describes changes
to the Fund that occurred during the reporting period.
WHAT
WERE THE FUND COSTS FOR THE LAST YEAR? (based
on a hypothetical $10,000 investment)
|
Class
Name |
Costs
of a $10,000 investment
|
Costs
paid as a percentage of a $10,000
investment*
|
|
Class
C |
$187
|
1.77%
|
HOW
DID THE FUND PERFORM LAST YEAR AND WHAT AFFECTED ITS PERFORMANCE?
For the twelve months ended August
31, 2026, Class C shares of
Templeton Growth Fund Inc. returned 11.52%.
The Fund compares its performance
to the MSCI All Country World Index-NR, which returned 22.35% for the same period.
PERFORMANCE
HIGHLIGHTS
|
Top
contributors to performance: | |
|
↑
|
Stock
selection in the utilities and financials sectors and an underweight in the consumers staples sector contributed to relative performance
for the year. |
|
↑
|
Geographically,
stock selection in Japan and the U.K. contributed significantly to relative performance. |
|
↑
|
Samsung
Electronics, Taiwan Semiconductor Manufacturing, ASM International, Honeywell International and ING Groep were the
top five contributors to relative performance for the period. |
|
Top
detractors from performance: | |
|
↓
|
Stock
selection and an underweight in the information technology sector, stock selection and an overweight in the materials sector
and stock selection in the health care sector detracted from relative performance for the year. |
|
↓
|
Geographically,
stock selection in the U.S. was the most significant detractor. |
|
↓
|
Icon,
Nike, HDFC Bank, Intel Corp (underweight) and Intuit were the top five detractors from relative performance for the year.
|
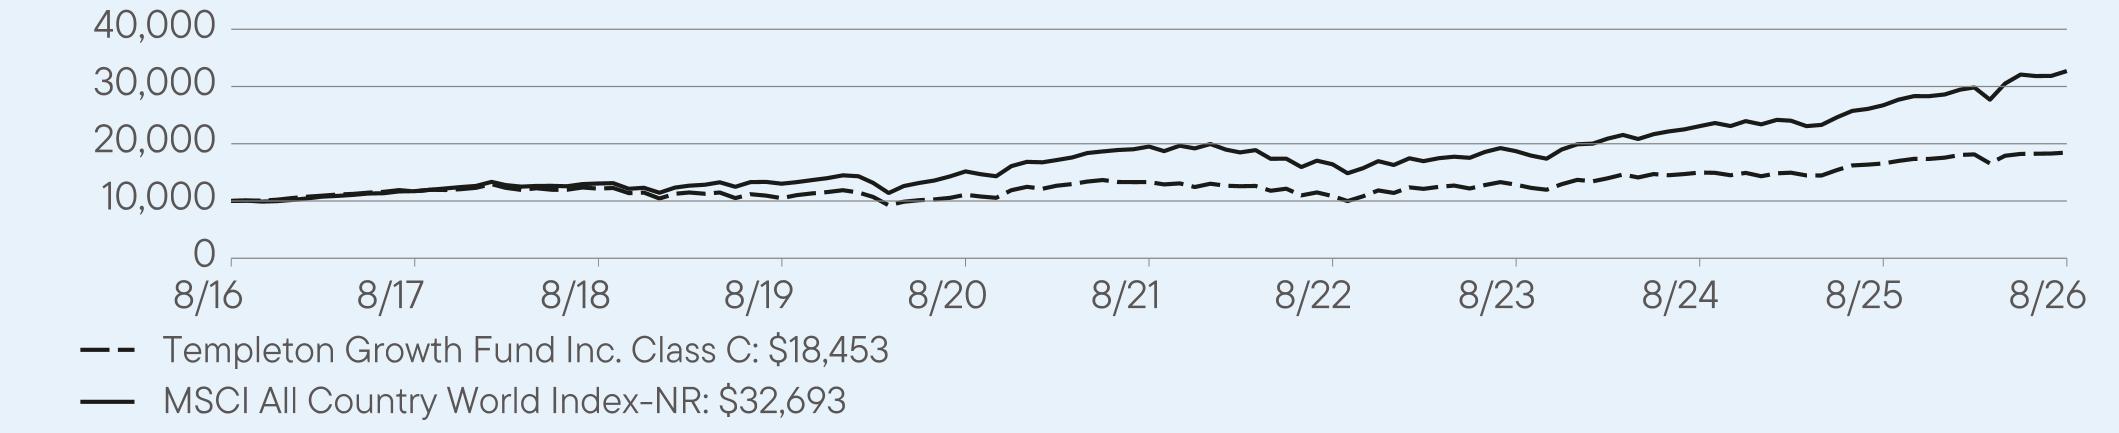
AVERAGE
ANNUAL TOTAL RETURNS (%) Period
Ended August 31, 2026
|
|
1
Year |
5
Year |
10
Year |
|
Class
C |
11.52
|
6.78
|
6.32
|
|
Class
C (with sales charge) |
10.54
|
6.78
|
6.32
|
|
MSCI
All Country World Index-NR |
22.35
|
10.89
|
12.58
|
For current month-end performance,
please call Franklin Templeton at (800)
DIAL BEN/342-5236 or visit
https://www.franklintempleton.com/investments/options/mutual-funds.
https://www.franklintempleton.com/investments/options/mutual-funds.
Important data provider notices
and terms available at www.franklintempletondatasources.com.
KEY
FUND STATISTICS (as
of August 31, 2026)
|
Total
Net Assets |
$9,155,620,861
|
|
Total
Number of Portfolio Holdings |
65
|
|
Total
Management Fee Paid |
$63,538,349
|
|
Portfolio
Turnover Rate |
82.19%
|
WHAT
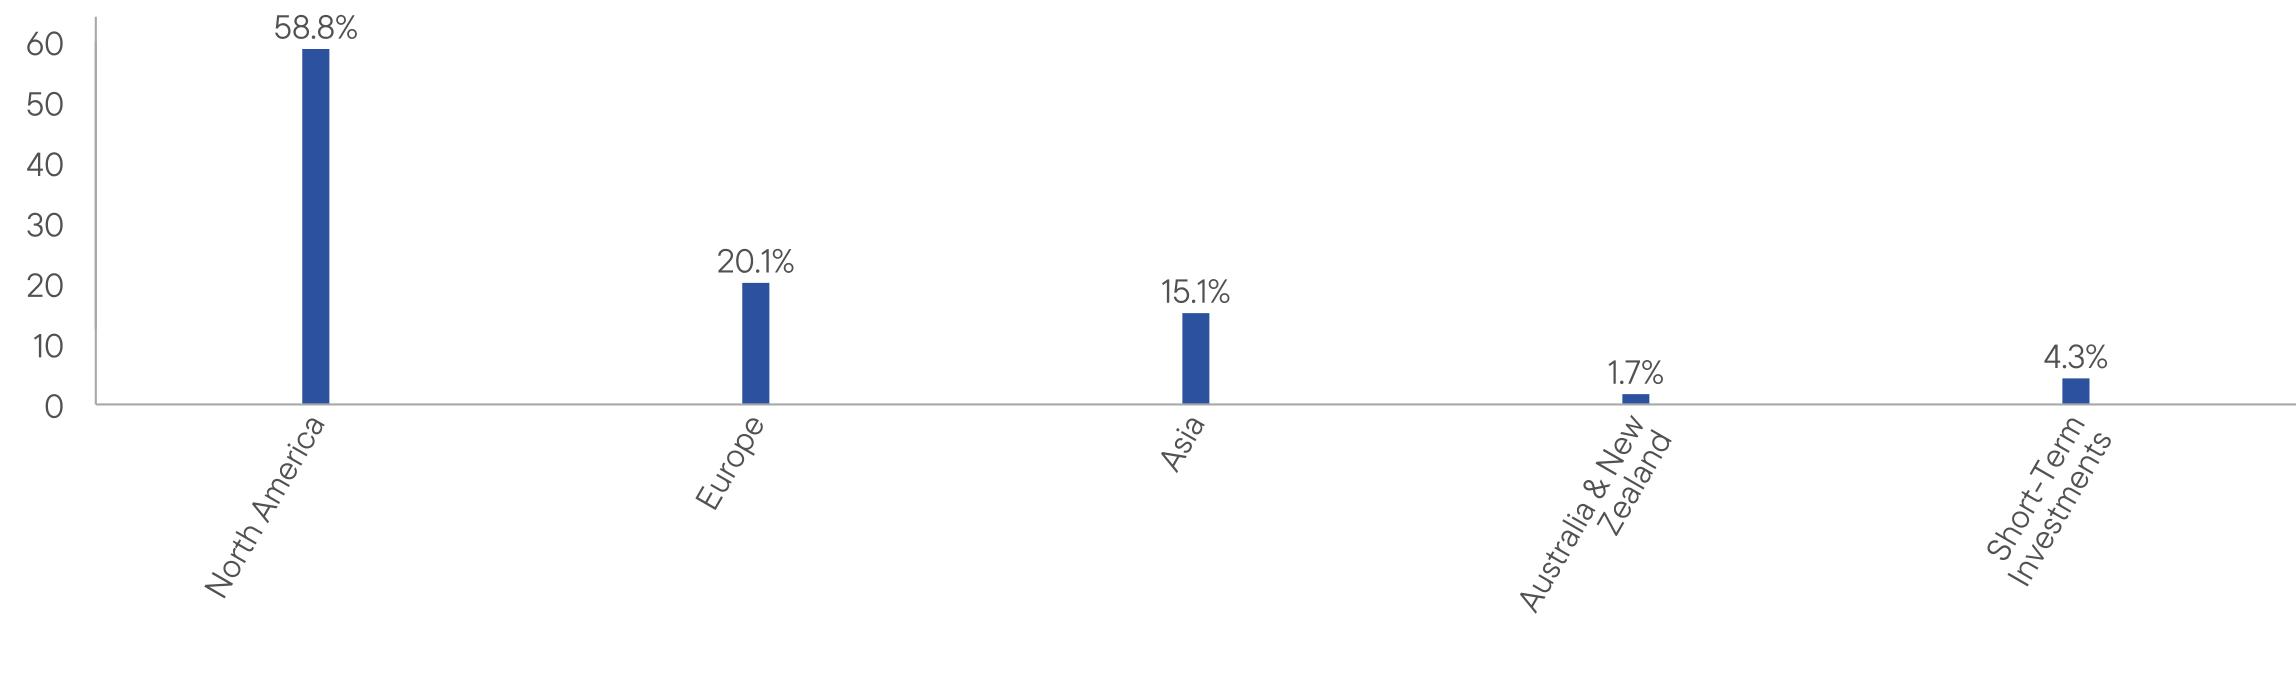
DID THE FUND INVEST IN? (as
of August 31, 2026)
Portfolio Composition*
(% of Total Investments)
HOW
HAS THE FUND CHANGED?
On
January 1, 2026, the Fund’s principal investment strategies were revised to reflect reduced exposure to investments in derivative
instruments and equity-linked
notes.
In
connection with these changes, principal risk disclosure regarding derivative instruments and equity-linked notes was removed from the
principal risks section of the prospectus.
This
is a summary of certain changes to the Fund since September
1, 2025. For
more complete information, you may review the Fund’s current
prospectus and any applicable supplements and the Fund’s next prospectus, which we expect to be available by January
1, 2027, at https://www.franklintempleton.com/regulatory-fund-documents
or upon request at (800)
DIAL BEN/342-5236
or prospectus.us.franklintempleton@fisglobal.com.
This report describes changes
to the Fund that occurred during the reporting period.
WHAT
WERE THE FUND COSTS FOR THE LAST YEAR? (based
on a hypothetical $10,000 investment)
|
Class
Name |
Costs
of a $10,000 investment
|
Costs
paid as a percentage of a $10,000
investment*
|
|
Class
R |
$135
|
1.27%
|
HOW
DID THE FUND PERFORM LAST YEAR AND WHAT AFFECTED ITS PERFORMANCE?
For the twelve months ended August
31, 2026, Class R shares of
Templeton Growth Fund Inc. returned 12.05%.
The Fund compares its performance
to the MSCI All Country World Index-NR, which returned 22.35% for the same period.
PERFORMANCE
HIGHLIGHTS
|
Top
contributors to performance: | |
|
↑
|
Stock
selection in the utilities and financials sectors and an underweight in the consumers staples sector contributed to relative performance
for the year. |
|
↑
|
Geographically,
stock selection in Japan and the U.K. contributed significantly to relative performance. |
|
↑
|
Samsung
Electronics, Taiwan Semiconductor Manufacturing, ASM International, Honeywell International and ING Groep were the
top five contributors to relative performance for the period. |
|
Top
detractors from performance: | |
|
↓
|
Stock
selection and an underweight in the information technology sector, stock selection and an overweight in the materials sector
and stock selection in the health care sector detracted from relative performance for the year. |
|
↓
|
Geographically,
stock selection in the U.S. was the most significant detractor. |
|
↓
|
Icon,
Nike, HDFC Bank, Intel Corp (underweight) and Intuit were the top five detractors from relative performance for the year.
|
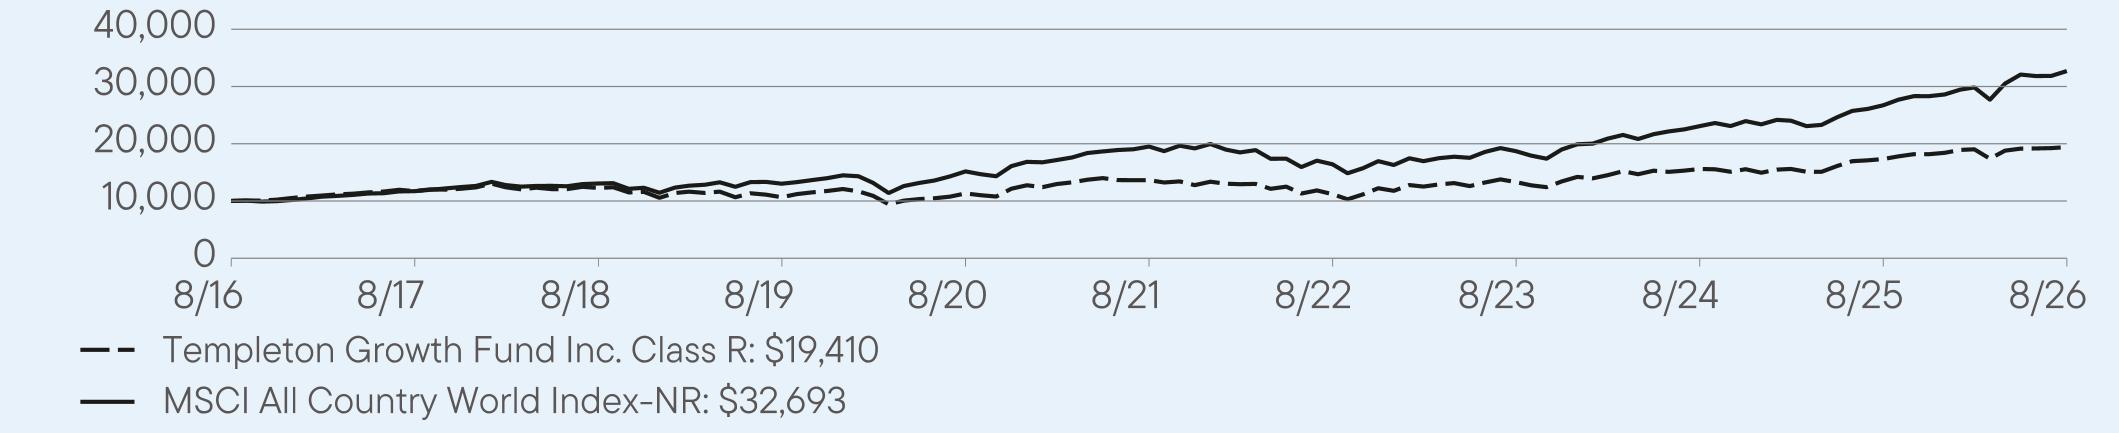
AVERAGE
ANNUAL TOTAL RETURNS (%) Period
Ended August 31, 2026
|
|
1
Year |
5
Year |
10
Year |
|
Class
R |
12.05
|
7.32
|
6.86
|
|
MSCI
All Country World Index-NR |
22.35
|
10.89
|
12.58
|
For current month-end performance,
please call Franklin Templeton at (800)
DIAL BEN/342-5236 or visit
https://www.franklintempleton.com/investments/options/mutual-funds.
https://www.franklintempleton.com/investments/options/mutual-funds.
Important data provider notices
and terms available at www.franklintempletondatasources.com.
KEY
FUND STATISTICS (as
of August 31, 2026)
|
Total
Net Assets |
$9,155,620,861
|
|
Total
Number of Portfolio Holdings |
65
|
|
Total
Management Fee Paid |
$63,538,349
|
|
Portfolio
Turnover Rate |
82.19%
|
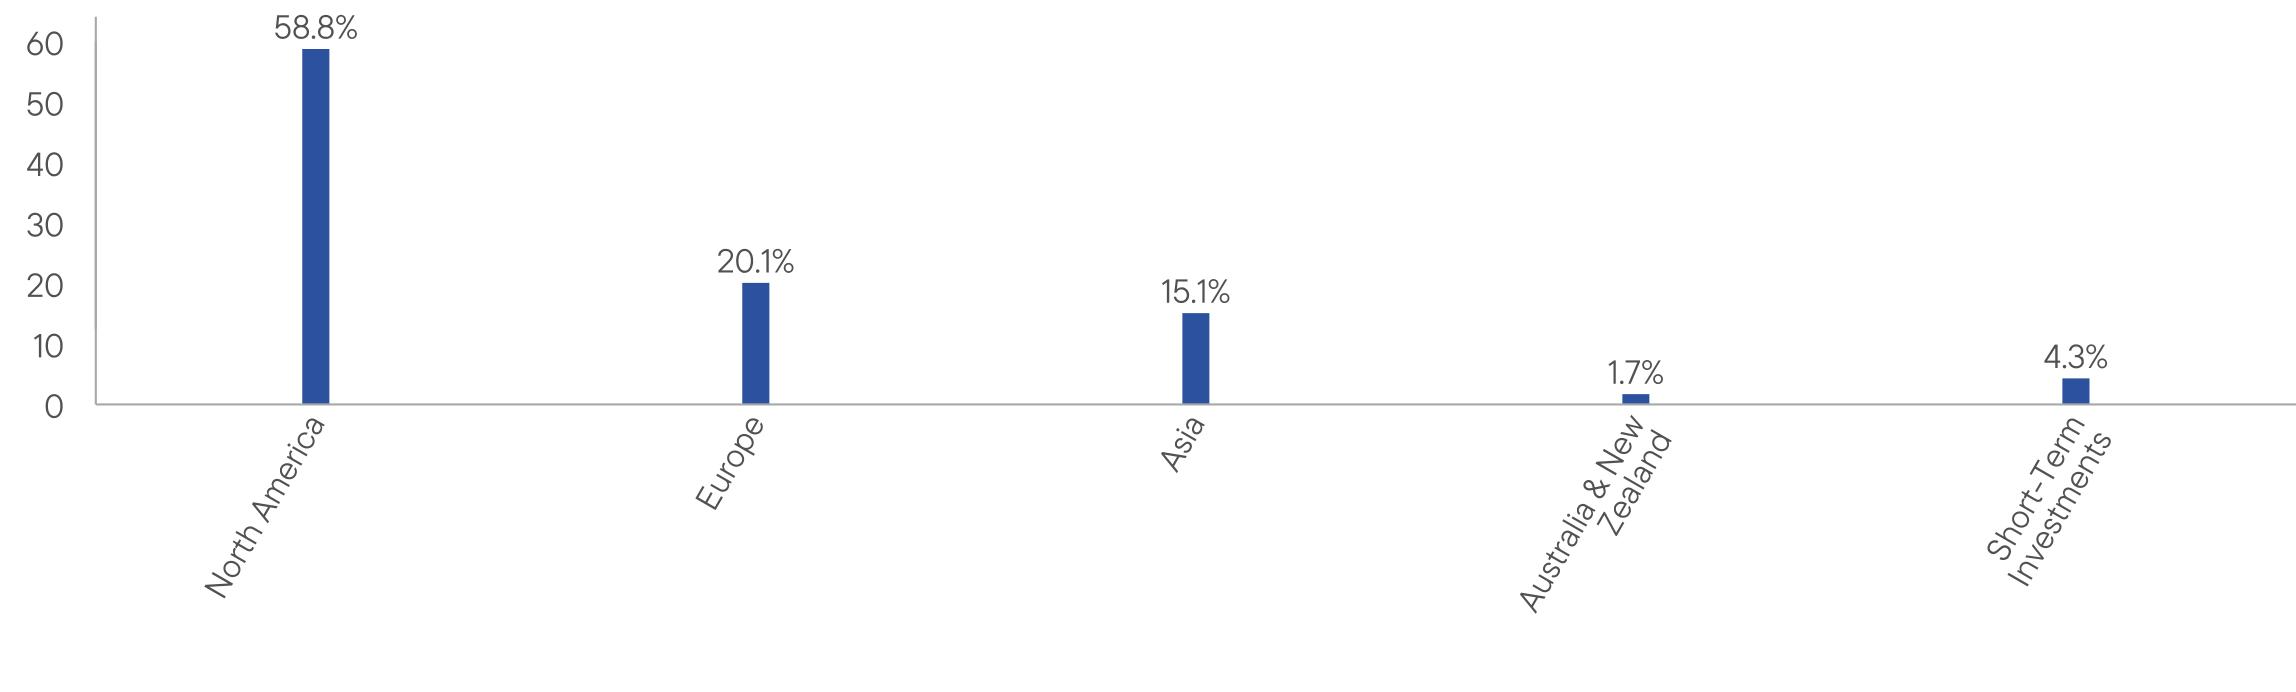
WHAT
DID THE FUND INVEST IN? (as
of August 31, 2026)
Portfolio Composition*
(% of Total Investments)
HOW
HAS THE FUND CHANGED?
On
January 1, 2026, the Fund’s principal investment strategies were revised to reflect reduced exposure to investments in derivative
instruments and equity-linked
notes.
In
connection with these changes, principal risk disclosure regarding derivative instruments and equity-linked notes was removed from the
principal risks section of the prospectus.
This
is a summary of certain changes to the Fund since September
1, 2025. For
more complete information, you may review the Fund’s current
prospectus and any applicable supplements and the Fund’s next prospectus, which we expect to be available by January
1, 2027, at https://www.franklintempleton.com/regulatory-fund-documents
or upon request at (800)
DIAL BEN/342-5236
or prospectus.us.franklintempleton@fisglobal.com.
This report describes changes
to the Fund that occurred during the reporting period.
WHAT
WERE THE FUND COSTS FOR THE LAST YEAR? (based
on a hypothetical $10,000 investment)
|
Class
Name |
Costs
of a $10,000 investment
|
Costs
paid as a percentage of a $10,000
investment*
|
|
Class
R6 |
$78
|
0.73%
|
HOW
DID THE FUND PERFORM LAST YEAR AND WHAT AFFECTED ITS PERFORMANCE?
For the twelve months ended August
31, 2026, Class R6 shares of
Templeton Growth Fund Inc. returned 12.67%.
The Fund compares its performance
to the MSCI All Country World Index-NR, which returned 22.35% for the same period.
PERFORMANCE
HIGHLIGHTS
|
Top
contributors to performance: | |
|
↑
|
Stock
selection in the utilities and financials sectors and an underweight in the consumers staples sector contributed to relative performance
for the year. |
|
↑
|
Geographically,
stock selection in Japan and the U.K. contributed significantly to relative performance. |
|
↑
|
Samsung
Electronics, Taiwan Semiconductor Manufacturing, ASM International, Honeywell International and ING Groep were the
top five contributors to relative performance for the period. |
|
Top
detractors from performance: | |
|
↓
|
Stock
selection and an underweight in the information technology sector, stock selection and an overweight in the materials sector
and stock selection in the health care sector detracted from relative performance for the year. |
|
↓
|
Geographically,
stock selection in the U.S. was the most significant detractor. |
|
↓
|
Icon,
Nike, HDFC Bank, Intel Corp (underweight) and Intuit were the top five detractors from relative performance for the year.
|
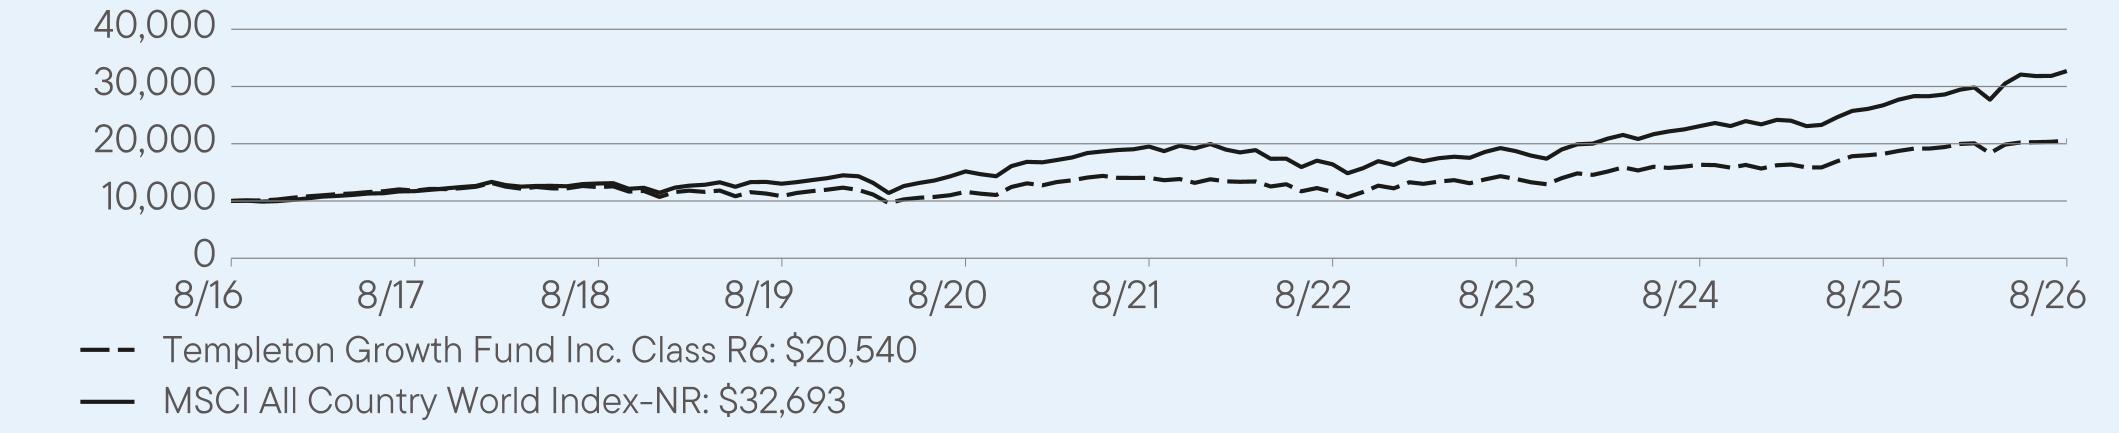
AVERAGE
ANNUAL TOTAL RETURNS (%) Period
Ended August 31, 2026
|
|
1
Year |
5
Year |
10
Year |
|
Class
R6 |
12.67
|
7.91
|
7.46
|
|
MSCI
All Country World Index-NR |
22.35
|
10.89
|
12.58
|
For current month-end performance,
please call Franklin Templeton at (800)
DIAL BEN/342-5236 or visit
https://www.franklintempleton.com/investments/options/mutual-funds.
https://www.franklintempleton.com/investments/options/mutual-funds.
Important data provider notices
and terms available at www.franklintempletondatasources.com.
KEY
FUND STATISTICS (as
of August 31, 2026)
|
Total
Net Assets |
$9,155,620,861
|
|
Total
Number of Portfolio Holdings |
65
|
|
Total
Management Fee Paid |
$63,538,349
|
|
Portfolio
Turnover Rate |
82.19%
|
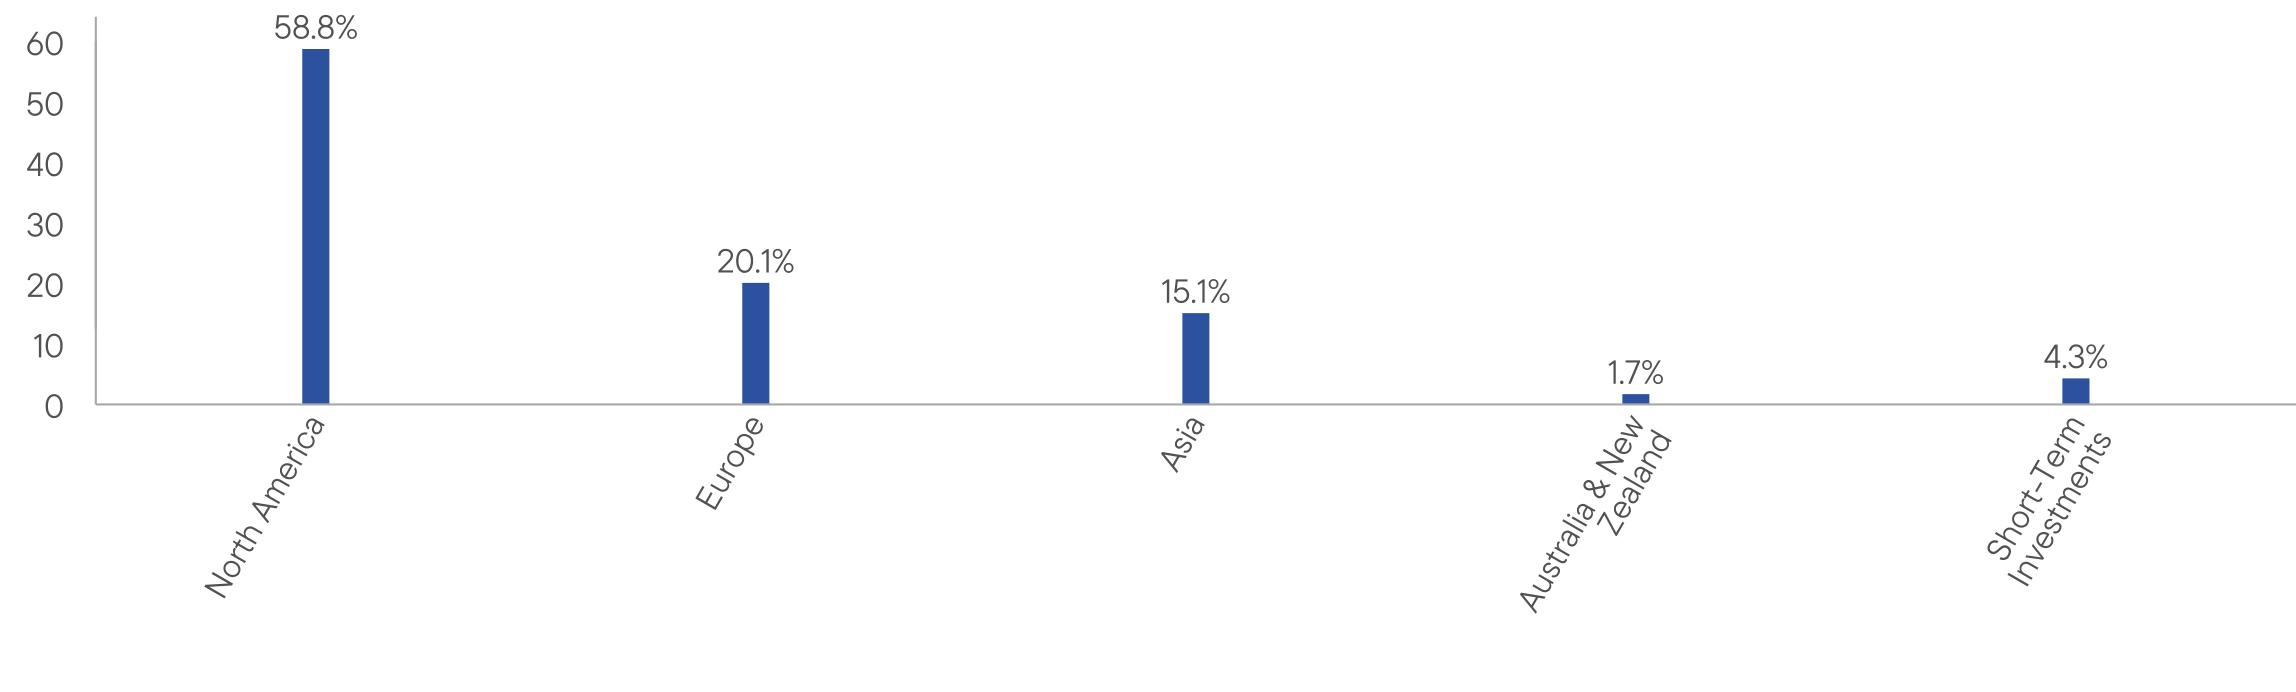
WHAT
DID THE FUND INVEST IN? (as
of August 31, 2026)
Portfolio Composition*
(% of Total Investments)
HOW
HAS THE FUND CHANGED?
On
January 1, 2026, the Fund’s principal investment strategies were revised to reflect reduced exposure to investments in derivative
instruments and equity-linked
notes.
In
connection with these changes, principal risk disclosure regarding derivative instruments and equity-linked notes was removed from the
principal risks section of the prospectus.
This
is a summary of certain changes to the Fund since September
1, 2025. For
more complete information, you may review the Fund’s current
prospectus and any applicable supplements and the Fund’s next prospectus, which we expect to be available by January
1, 2027, at https://www.franklintempleton.com/regulatory-fund-documents
or upon request at (800)
DIAL BEN/342-5236
or prospectus.us.franklintempleton@fisglobal.com.
This report describes changes
to the Fund that occurred during the reporting period.
WHAT
WERE THE FUND COSTS FOR THE LAST YEAR? (based
on a hypothetical $10,000 investment)
|
Class
Name |
Costs
of a $10,000 investment
|
Costs
paid as a percentage of a $10,000
investment*
|
|
Advisor
Class |
$82
|
0.77%
|
HOW
DID THE FUND PERFORM LAST YEAR AND WHAT AFFECTED ITS PERFORMANCE?
For the twelve months ended August
31, 2026, Advisor Class shares
of Templeton Growth Fund Inc. returned 12.64%.
The Fund compares its performance
to the MSCI All Country World Index-NR, which returned 22.35% for the same period.
PERFORMANCE
HIGHLIGHTS
|
Top
contributors to performance: | |
|
↑
|
Stock
selection in the utilities and financials sectors and an underweight in the consumers staples sector contributed to relative performance
for the year. |
|
↑
|
Geographically,
stock selection in Japan and the U.K. contributed significantly to relative performance. |
|
↑
|
Samsung
Electronics, Taiwan Semiconductor Manufacturing, ASM International, Honeywell International and ING Groep were the
top five contributors to relative performance for the period. |
|
Top
detractors from performance: | |
|
↓
|
Stock
selection and an underweight in the information technology sector, stock selection and an overweight in the materials sector
and stock selection in the health care sector detracted from relative performance for the year. |
|
↓
|
Geographically,
stock selection in the U.S. was the most significant detractor. |
|
↓
|
Icon,
Nike, HDFC Bank, Intel Corp (underweight) and Intuit were the top five detractors from relative performance for the year.
|
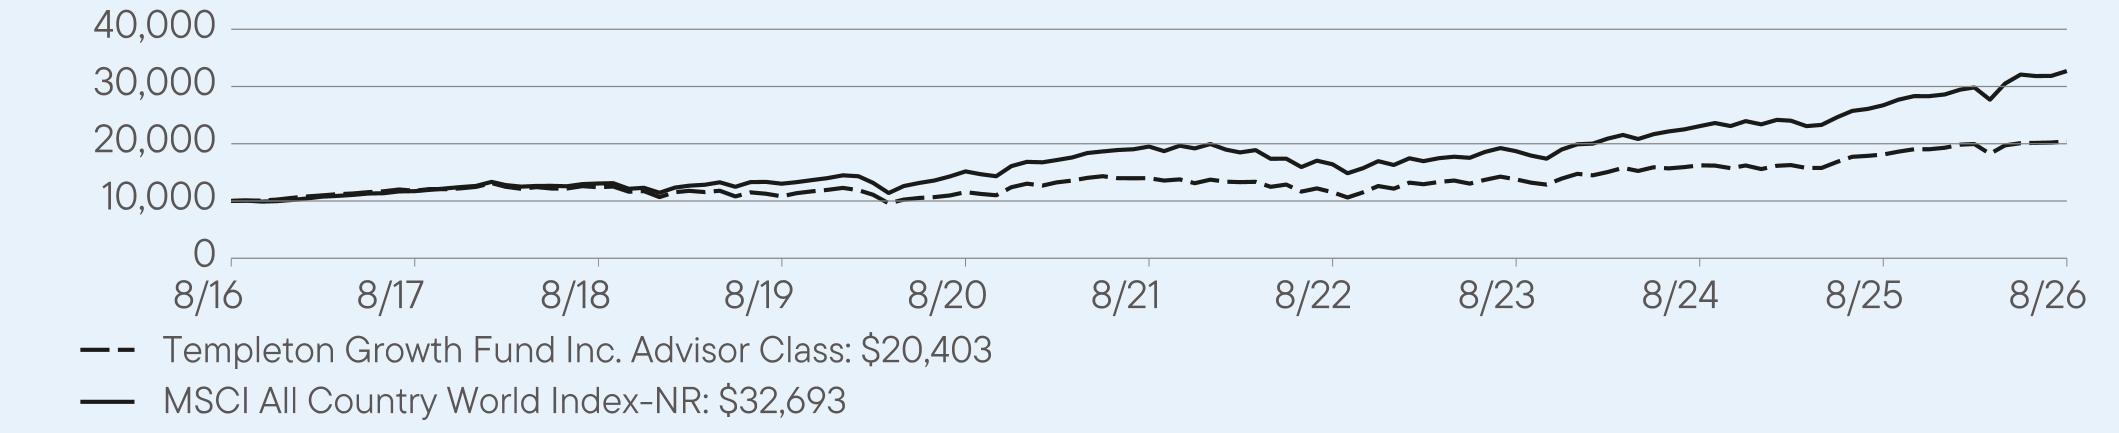
AVERAGE
ANNUAL TOTAL RETURNS (%) Period
Ended August 31, 2026
|
|
1
Year |
5
Year |
10
Year |
|
Advisor
Class |
12.64
|
7.86
|
7.39
|
|
MSCI
All Country World Index-NR |
22.35
|
10.89
|
12.58
|
For current month-end performance,
please call Franklin Templeton at (800)
DIAL BEN/342-5236 or visit
https://www.franklintempleton.com/investments/options/mutual-funds.
https://www.franklintempleton.com/investments/options/mutual-funds.
Important data provider notices
and terms available at www.franklintempletondatasources.com.
KEY
FUND STATISTICS (as
of August 31, 2026)
|
Total
Net Assets |
$9,155,620,861
|
|
Total
Number of Portfolio Holdings |
65
|
|
Total
Management Fee Paid |
$63,538,349
|
|
Portfolio
Turnover Rate |
82.19%
|
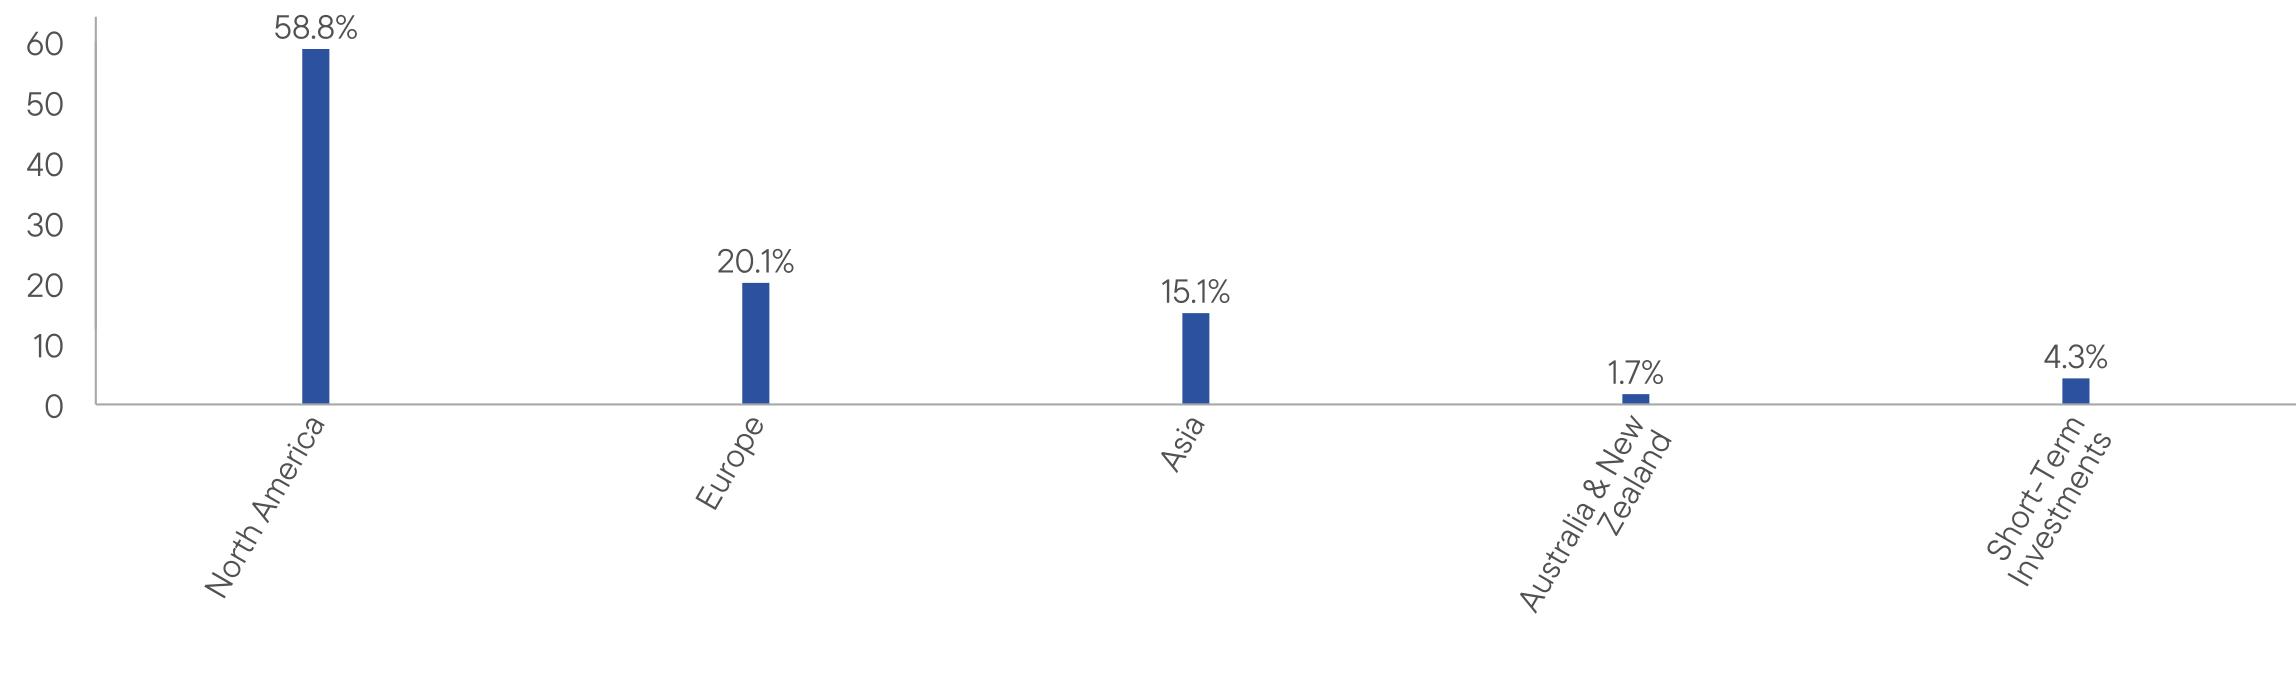
WHAT
DID THE FUND INVEST IN? (as
of August 31, 2026)
Portfolio Composition*
(% of Total Investments)
HOW
HAS THE FUND CHANGED?
On
January 1, 2026, the Fund’s principal investment strategies were revised to reflect reduced exposure to investments in derivative
instruments and equity-linked
notes.
In
connection with these changes, principal risk disclosure regarding derivative instruments and equity-linked notes was removed from the
principal risks section of the prospectus.
This
is a summary of certain changes to the Fund since September
1, 2025. For
more complete information, you may review the Fund’s current
prospectus and any applicable supplements and the Fund’s next prospectus, which we expect to be available by January
1, 2027, at https://www.franklintempleton.com/regulatory-fund-documents
or upon request at (800)
DIAL BEN/342-5236
or prospectus.us.franklintempleton@fisglobal.com.
| [1] |
|
||
| [2] |
|
||
| [3] |
|
||
| [4] |
|
||
| [5] |
|
||
| [6] |
|
||
| [7] |
|
||
| [8] |
|
||
| [9] |
|
||
| [10] |
|