Exhibit D
Description of
The Republic of Argentina
October 27, 2026
TABLE OF CONTENTS
| PAGE | ||
| Defined Terms and Certain Conventions |
D-2 | |
| Recent Developments |
D-6 | |
| Presentation of Statistical and Other Information |
D-17 | |
| Forward-Looking Statements |
D-18 | |
| Data Dissemination |
D-19 | |
| Summary |
D-20 | |
| The Republic of Argentina |
D-21 | |
| The Argentine Economy |
D-30 | |
| Balance Of Payments |
D-63 | |
| Monetary System |
D-84 | |
| Public Sector Finances |
D-113 | |
| Public Sector Debt |
D-143 |
DEFINED TERMS AND CERTAIN CONVENTIONS
Certain Defined Terms
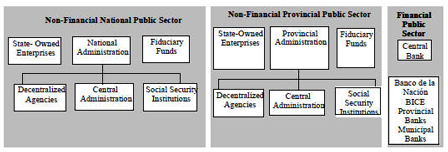
All references in this Annual Report to “Argentina” or the “Republic” are to the Republic of Argentina, and to the “Government” are to the non-financial sector of the federal government of Argentina, excluding the Central Bank, Banco de la Nación Argentina and Banco de Inversión y Comercio Exterior (Foreign Investment and Trade Bank, or “BICE”).
The terms set forth below have the following meanings for purposes of this Annual Report:
| | “2005 Debt Exchange” refers to the restructuring and exchange of public debt that had been in default since the end of 2001 undertaken by the Government between January and May of 2005. |
| | “2010 Debt Exchange” refers to the restructuring and exchange of public debt that had been in default since the end of 2001 undertaken by the Government between April and December 2010. |
| | “2020 Debt Exchanges” refers to the restructurings and exchanges of public debt denominated in foreign currency and governed by foreign and local law undertaken by the Government between April and September 2020. |
| | “ALADI” refers to the Asociación Latinoamericana de Integración (Latin American Integration Association). |
| | “BADLAR” rate is an average rate published by the Central Bank based on a survey of financial institutions in Argentina regarding the nominal annual interest rate in peso-denominated time deposits of more than Ps.1.0 million from 30 to 35 days. |
| | “CAF” refers to Corporación Andina de Fomento (Andean Promotion Corporation); |
| | “Consumer Price Index,” or “CPI,” is an index calculated on a weighted basket of consumer goods and services. References in this Annual Report to “National CPI” refers to CPI figures that the INDEC began publishing in July 2017 based on a survey conducted by INDEC and several provincial statistical offices in 39 urban areas encompassing each of the Republic’s provinces. Results are not reported by the provinces, but on a national level and for six statistical regions: the Greater Buenos Aires Metropolitan area, the Cuyo region, the Northeast region, the Northwest region, the Central (Pampeana) Region and the Southern (Patagonia) region. |
| | “defaulted debt” or “debt in default” as of any given date refers to all of Argentina’s public indebtedness on which Argentina is not paying principal or interest as of such date, plus any past due principal and interest payments calculated at contractual rates. |
| | “FONPLATA” refers to the Fondo Financiero para el Desarrollo de la Cuenca del Plata (Financial Fund for the Development of the River Plate Basin). |
| | “GAFISUD” refers to the Financial Action Task Force on Money Laundering in South America. |
| | “Gross domestic product” or “GDP” means the total value of final products and services produced in Argentina during the relevant period. |
| | “IMF” refers to the International Monetary Fund. |
| | “IADB” refers to the Inter-American Development Bank. |
| | “non-performing debt” refers to public indebtedness of Argentina that was formally subject to the moratorium declared by the Government in December 2001, other than Untendered Debt. Argentina’s non-performing debt encompasses all public debt on which Argentina is in default as of any given date (other than Untendered Debt), including past due principal and interest payments calculated at contractual rates. Non-performing debt also includes the following: |
| (i) | certain debt obligations on which the Government has continued to make payments on a case-by-case basis (such as in cases of extreme necessity (e.g., for senior citizens 75 years of age or older) or when the provision of essential services is threatened), despite being formally subject to the suspension of debt payments; and |
| (ii) | certain obligations that resulted from the advance payment of tax obligations by certain companies. These advance tax payments gave rise to claims against the Government for the amount of the payment. The Government considers these claims additional public indebtedness of Argentina and they are treated as such in the Government’s accounts. These claims, however, are discharged when the tax obligation that gave rise to the advanced payment actually becomes payable, at which time the tax obligation is cancelled. Accordingly, although formally subject to the suspension of payments, the Government’s obligations in respect of these claims are not in default. |
D-2
| | “Settlement Proposal” refers to the proposal, published by the Republic on February 5, 2016, to settle all claims on Untendered Debt not otherwise time-barred, including bonds in litigation in the United States and elsewhere. See “Public Sector Debt—Legal Proceedings—The Settlement.” |
| | “TAMAR” refers to a rate calculated based on fixed-term deposits of Ps.1 billion or more, maturing in 30 to 35 days. The minimum amount of deposits eligible for calculation will be updated on an annual basis. |
| | “Untendered Debt” means, with respect to data included herein through 2016, defaulted debt in respect of securities that were eligible for, but not tendered in, the 2005 Debt Exchange and the 2010 Debt Exchange and have not been settled since February 5, 2016. References to Untendered Debt in this Annual Report do not constitute, and shall not be read or construed to constitute a waiver of any defenses available to the Republic with respect to the enforcement of any claim thereunder. See “Preservation of Defenses.” The Republic has not offered to pay time-barred claims on principal or interest. See “Public Sector Debt—Legal Proceedings.” Any amounts of Untendered Debt set forth in this Annual Report have been defined in this Annual Report to include unpaid principal plus accrued and unpaid interest at contractual rates through December 31, 2025, including penalty or default interest. In settling outstanding disputes with holdout creditors pursuant to the Settlement Proposal, the Republic took into consideration interest accrued after the originally scheduled maturity of each defaulted series of securities (other than time-barred interest), as well as default interest. |
| | “WTO” refers to the World Trade Organization. |
For purposes of this Annual Report, the following terms, which refer to various public debt instruments and other debt instruments issued by the Central Bank, have the meanings set forth below:
| | “2017 Globals”: U.S. dollar-denominated global bonds issued in the international capital markets pursuant to the 2010 Debt Exchange. |
| | “2035 GDP-Linked Securities”: Long-term government treasury securities denominated in U.S. dollars, euros, Japanese yen and pesos, issued in the international capital markets pursuant to the 2005 Debt Exchange and the 2010 Debt Exchange. |
| | “2045 Quasi-Par Bonds”: Peso-denominated long-term government treasury bonds issued in the international capital markets pursuant to the 2005 Debt Exchange. |
| | “Bocones”: Bonds issued by the Republic to restructure its obligations to pensioners and suppliers and to settle reparations of members of family of victims of the military dictatorship. |
| | “Bonacs,” “Bonads,” “Boncers,” “Bontes,” “Botapos” and “BONCAP”: Bonds issued by the Republic for general purposes. Except for the Bonads, which are denominated in U.S. dollars and payable in pesos (dollar-linked), the remaining bonds are denominated in pesos. |
| | “Bonares”: Bonds issued by the Republic for general purposes of the Government and in exchange for CER-index linked bonds. |
| | “Bonares USD”: Fixed-rate bonds issued in U.S. dollars by the Republic for general purposes. |
| | “Bonar Dual”: Bonds issued by the Republic for general purposes of the Government denominated in U.S. dollars but payable in pesos. Upon maturity, the Republic is required to pay the higher of (i) the principal amount outstanding in U.S. dollars converted into pesos at the exchange rate applicable as of the issuance date, plus capitalized accrued interest in pesos at a rate determined on the issuance date, and (ii) the principal amount outstanding in U.S. dollars plus capitalized accrued interest at a U.S. dollar interest rate, converted into pesos at the exchange rate applicable as of the maturity date. |
| | “Bonos Duales”: Bonds issued by the Republic denominated and payable in pesos, the principal of which is adjusted by reference to the higher of (i) the TAMAR rate or a fixed rate, or (ii) the CER or the TAMAR rate, as applicable. The term also includes a bond denominated in U.S. dollars but payable in pesos, the principal of which is adjusted by reference to the higher of the exchange rate or the TAMAR rate. |
| | “Bopreal” U.S. dollar-denominated bonds issued by the Central Bank to provide predictability for payments associated with the stock of commercial debt accumulated by importers up to December 12, 2023. |
| | “Global”: U.S. dollar-denominated global bonds issued in the international capital markets pursuant to the 2020 Debt Exchanges. |
| | “Lebacs”: Short-term notes issued by the Central Bank mainly peso-denominated. |
| | “Lecaps”: Peso-denominated notes issued by the Ministry of Economy. |
D-3
| | “Lecer”: Peso-denominated, inflation-adjusted notes issued by the Ministry of Economy. |
| | “LEFIs”: Liquidity notes issued by the Central Bank to absorb excess liquidity, denominated in pesos and with a one-year maturity. |
| | “Lelink”: Peso-denominated notes pegged to the U.S. dollar issued by the Ministry of Economy. |
| | “Leliqs”: Liquidity notes issued by the Central Bank, denominated in pesos and with a 28-day maturity. Leliqs are offered twice a week and may only be purchased by banking entities for their own portfolio. |
| | “Lelite”: Short term peso-denominated notes, subscribed exclusively by mutual funds. |
| | “Letes”: U.S. dollar-denominated Treasury notes issued by the Republic for general purposes of the Government. |
| | “National Guaranteed Loans”: Tax-secured loans that the Republic exchanged for previously outstanding bonds as part of a voluntary debt offers that took place in 2001. Holders of National Guaranteed Loans retained the right to recover their original bonds upon default. |
| | “Nobacs”: Peso-denominated medium-term notes issued by the Central Bank. |
| | “Notaliqs”: Peso-denominated, floating rate liquidity notes issued by the Central Bank, with a 182-day average maturity. |
Preservation of Defenses
Nothing in this Annual Report, or in any communication from the Republic, constitutes an acknowledgment or admission of the existence of any claim or any liability of the Republic to pay that claim or an acknowledgment that any ability to bring proceedings in any jurisdiction in respect of such claim or any limitation period relating thereto has been revived or reinstated, or an express or implied promise to pay any such claim (or part thereof). Whether or not a claim exists, the Republic may in its sole discretion and only if written notice to that effect is received from a duly authorized officer of the Republic, attribute a value to such claim for purposes of the Republic’s Settlement Proposal or for any other purpose. All defenses available to the Republic relating to any applicable statute of limitations or otherwise are expressly preserved for all purposes. This Annual Report may not be relied upon as evidence of the Republic’s agreement that a claim exists, or of the Republic’s willingness, ability or obligation to pay any claim. Any attribution of any value to any claim for purposes of the Republic’s Settlement Proposal or for any other purpose will not be considered an acknowledgment of the existence or validity of that claim and any consideration given by or on behalf of the Republic to the proponent of that claim will be consideration only for the agreement by the proponent of that claim to cease all actions or proceedings in respect of that claim and to irrevocably assign and transfer to the Republic all rights, if any, with respect to such claim and to undertake to complete any and all formalities or requirements necessary to ensure that if such claim existed neither the proponent nor any successor or assignee of the proponent (other than the Republic) is able to evidence or allege such claim to remain in existence or to be a liability of the Republic.
Exchange Rates
The Republic publishes most of its economic indicators and other statistics in pesos. The peso floated freely with limited intervention by the Central Bank between January 2016 and August 2019. During this period, the peso lost 77.9% of its value compared to the U.S. dollar, from Ps.13.65 per U.S.$1.00 on January 1, 2016 to Ps.59.1 per U.S.$1.00 on August 30, 2019. During 2019 alone, the peso lost 36.9% of its value compared to the U.S. dollar. In September 2019, the Central Bank imposed restrictions on foreign exchange transactions, which were tightened between October and December 2019. See “Monetary System—Foreign Exchange and International Reserves—Foreign Exchange.” During 2025, the peso lost 29.3% of its value vis-à-vis the U.S. dollar and, on December 31, 2025, the exchange rate was Ps.1,459.4 to U.S.$1.00. As of October 22, 2026, the peso-dollar reference exchange rate was Ps.1,527.85 to U.S.$1.00.
The Central Bank maintains an exchange rate management policy aimed at consolidating the gradual process of lowering the inflation rate. In addition, the Central Bank seeks to maintain the real exchange rate at a competitive level to accumulate reserves and maintain a trade surplus.
D-4
The following table sets forth the annual high, low, average and period-end “reference” exchange rates for the periods indicated, expressed in pesos per U.S. dollar and not adjusted for inflation. There can be no assurance that the peso will not depreciate or appreciate in the future. The Federal Reserve Bank of New York does not report a noon buying rate for pesos.
| Exchange rates(1) | ||||||||||||||||
| High | Low | Average(2) | Period end | |||||||||||||
| Year ended December 31, |
||||||||||||||||
| 2020 |
84.15 | 59.82 | 70.59 | 84.15 | ||||||||||||
| 2021 |
102.75 | 84.70 | 95.16 | 102.75 | ||||||||||||
| 2022 |
177.13 | 103.04 | 130.81 | 177.13 | ||||||||||||
| 2023 |
808.48 | 178.14 | 295.21 | 808.48 | ||||||||||||
| 2024 |
1,032.50 | 810.65 | 916.25 | 1,032.50 | ||||||||||||
| 2025 |
1,487.08 | 1,030.50 | 1,244.26 | 1,459.42 | ||||||||||||
| 2026 |
||||||||||||||||
| January |
1,472.73 | 1,427.03 | 1,449.33 | 1,472.73 | ||||||||||||
| February |
1,451.70 | 1,367.24 | 1,409.66 | 1,451.70 | ||||||||||||
| March |
1,418.28 | 1,370.29 | 1,396.34 | 1,418.28 | ||||||||||||
| April |
1,412.99 | 1,352.98 | 1,381.45 | 1,412.99 | ||||||||||||
| May |
1,411.41 | 1,386.29 | 1,397.24 | 1,411.41 | ||||||||||||
| June |
1,483.02 | 1,421.47 | 1,450.27 | 1,483.02 | ||||||||||||
| July |
1,499.84 | 1,474.74 | 1,487.00 | 1,499.84 | ||||||||||||
| August |
1,514.16 | 1,488.70 | 1,499.96 | 1,514.16 | ||||||||||||
| September |
1,528.76 | 1,506.68 | 1,513.89 | 1,528.76 | ||||||||||||
| (1) | Central Bank reference exchange rates (Communication A 3500 of Central Bank). |
| (2) | Average of daily closing quotes. |
Source:Central Bank.
Currency conversions, including conversions of pesos into U.S. dollars, are included for the convenience of the reader only and should not be construed as a representation that the amounts in question have been, could have been or could be converted into any particular denomination, at any particular rate or at all.
D-5
RECENT DEVELOPMENTS
The information contained in this section supplements the information about the Republic corresponding to the headings below that are contained in this Annual Report. This information is not necessarily indicative of the Argentine economy or fiscal results for the full year or any other period. You should read the following discussion of recent developments together with the more detailed information appearing elsewhere in this Annual Report.
THE ARGENTINE ECONOMY
Hydrocarbon Production
On July 20, 2026, the Government issued Resolution No. 166/2026, which established a new procedure for the export of liquid hydrocarbons and their derivatives and created a registry of export transactions. The new procedure eliminated the requirement that exporters first offer the relevant products for sale in the domestic market and replaced the prior authorization regime with a notification procedure pursuant to which the Secretariat of Energy may object to an export, in whole or in part, on technical or economic grounds related to security of domestic supply. The new procedure applies to certain crude oil, gasoline, gasoil, propane, butane and liquefied petroleum gas products. Resolution No. 166/2026 also consolidated the applicable export rules into a single regulatory framework and repealed certain prior regulations governing the export of liquid hydrocarbons and their derivatives.
Role of the State in the Economy
Energy sector reforms
During 2026, the Government continued implementing measures aimed at increasing private sector participation and competition in the energy sector. On January 27, 2026, the Government announced a new framework pursuant to which private operators would be responsible for the importation and commercialization of liquefied natural gas (“LNG”), activities previously conducted primarily by Energía Argentina S.A. (“ENARSA”). Under the new framework, access to the available re-gasification capacity at the Escobar terminal is to be awarded through a competitive bidding process, with the successful bidder responsible for importing LNG, re-gasifying it and injecting the resulting natural gas into the transportation system for supply to gas distribution companies and electricity generators. The Government also implemented measures to reallocate capacity in the natural gas transportation system to reflect the increasing concentration of natural gas production in the Neuquén Basin, particularly in the Vaca Muerta formation. These measures are aimed at ensuring supply, promoting orderly price formation through competition, and moving toward a more transparent market.
On September 25, 2026, the Government issued Resolution No. 264/2026 establishing the Régimen de Demandas Extratendenciales (Extra-Trend Demand Regime, or “XDEM”) within the Mercado Eléctrico Mayorista (Wholesale Electricity Market, or “MEM”). The XDEM requires new large-scale electricity consumers, including data centers and mining projects, to secure additional energy and generation capacity to support their consumption without affecting the security of supply to existing users. The regime applies to new or incremental demand representing at least 0.5% of the average demand of the MEM (approximately 80 MW). Projects subject to the XDEM are required to cover at least 80% of their monthly electricity consumption through contracts for new generation and to secure firm capacity equal to 100% of their maximum demand, or 115% in the case of data centers. Each project may select the technology and supplier from which it obtains such energy and capacity, including through on-site generation. In the event of insufficient supply, existing users are given priority over large-scale consumers that do not have sufficient generation capacity to support their demand.
In October 2026, in response to increased volatility in international energy prices resulting from the ongoing conflict in the Middle East, the Government extended and increased certain subsidies for residential electricity and natural gas users under the Régimen de Subsidios Energéticos Focalizados (Targeted Energy Subsidy Regime, or “SEF”). For residential electricity users eligible under the SEF, the Government maintained the subsidized base consumption level at 200 kWh per month and an additional extraordinary subsidy of 25%. For eligible natural gas and propane gas users, the Government extended for an additional month a general subsidy of 50%, which had previously been scheduled to expire in October 2026, and maintained an additional extraordinary subsidy of 24.25%. As a result of these measures, eligible users received an aggregate 75% discount on the applicable energy component of their consumption. The Government estimates that average electricity and natural gas bills increased by 1.64% and 2.24%, respectively, in October 2026.
D-6
Incentive Regime for Large Investments
On February 18, 2026, the Government issued Decree No. 105/2026 extending the period to apply for the Régimen de Incentivo para Grandes Inversiones (Incentive Regime for Large Investments or “RIGI”) to July 8, 2027. The extension is intended to facilitate the development and implementation of large-scale investment projects that, due to their complexity, require longer development periods. Decree No. 105/2026 also expanded the scope of the RIGI to include projects involving the exploitation and production of new onshore liquid and gaseous hydrocarbon developments within the oil and gas sector, subject to a minimum investment requirement of U.S.$600 million. In addition, the decree amended certain provisions governing the implementation of the RIGI, clarifying the requirements applicable to expansions of existing businesses and establishing mechanisms intended to ensure that RIGI benefits apply only to qualifying new investments and not to pre-existing operations.
In May 2026, the Government announced a proposed incentive regime for large investments in new industries, referred to as the “Super RIGI,” which is intended to supplement the RIGI by providing enhanced tax and customs benefits for investments in certain new industrial activities. The proposed regime contemplates, among other benefits: (i) a 15% corporate income tax rate, compared to 25% under the RIGI; (ii) accelerated depreciation of qualifying investments, consisting of 60% in the first year and 20% in each of the following two years; (iii) an exemption from export duties; and (iv) an exemption from import duties on goods required for the implementation of qualifying projects. The proposed regime is intended to apply to certain industries and value chains that are not currently developed in Argentina, including lithium processing and battery manufacturing, green or low-emission hydrogen, onshore LNG, small and medium modular nuclear reactors, solar panels and wind turbines, electric vehicles, new petrochemical products, aerospace products, uranium processing, industrial products derived from fishing and certain fertilizers. On June 24, 2026, the Chamber of Deputies approved the proposed regime. As of the date of this Annual Report, the bill was under review by the Senate.
Privatization Policy
During 2026, the Government continued implementing the privatization program authorized pursuant to Law No. 27,742. In May 2026, the Government completed the sale of its entire equity interest in Compañía Inversora en Transmisión Eléctrica Citelec S.A. (“CITELEC”), the controlling shareholder of Compañía de Transporte de Energía Eléctrica en Alta Tensión Transener S.A. (“Transener”), to Genneia S.A. and Edison Transmisión S.A. for U.S.$356 million pursuant to a national and international public tender. Transener operates more than 12,600 km of 500 kV transmission lines that are part of the Sistema Argentino de Interconexión (Argentine Interconnection System, or “SADI”).
In May 2026, the Government launched a national and international public tender for the sale and transfer of its 90% equity interest in Agua y Saneamientos Argentinos S.A. (“AySA”). The remaining 10% equity interest is expected to continue to be held by AySA employees through an employee share ownership program. The tender contemplates the selection of a strategic operator with experience in the provision of drinking water and sanitation services.
The Government continued the privatization of Intercargo S.A.U. (“Intercargo”), which provides airport ground-handling services, through a national and international public tender for the sale of the Government’s entire equity interest in the company.
On August 20, 2026, as part of the privatization process of Belgrano Cargas y Logística S.A., the Government launched a national and international public tender for the 50-year concession of the Belgrano, San Martín and Urquiza freight railway lines, comprising approximately 7,600 km of railway infrastructure across 16 provinces. The concessions contemplate mandatory investment plans, including certain mandatory works during the first five years of the concessions. The tender also provides that investments in qualifying railway infrastructure may be eligible for benefits under the RIGI. The railway infrastructure and underlying land will remain under ownership by the Government.
The Government also continued the concession process for certain road corridors previously operated by Corredores Viales S.A. In September 2026, as part of the privatization of certain assets and activities of ENARSA, the Government issued Decree No. 1,107/2026 authorizing the sale, through a public tender, of ENARSA’s 65.01% equity interest in the Manuel Belgrano thermoelectric power plant and its 68.83% equity interest in the José de San Martín thermoelectric power plant. The decree also authorized the Government to proceed with the privatization of the Guillermo Brown thermoelectric power plant following completion of the administrative process relating to the termination of the applicable trust.
D-7
Poverty and Income Distribution
INDEC’s assessment of its essential goods and services basket indicates that a standard family required Ps.1,605,497.35 to gain access to the essential goods and services basket in August 2026, compared to Ps.1,160,780.04 in August 2025.
According to INDEC, in August 2026, the essential food basket for households stood at Ps.726,469.38, compared to Ps.520,529.16 in August 2025.
Employment and Labor
Wages and Labor Productivity
In October 2026, the minimum monthly wage stood at Ps.391,200, representing an increase of 16.8% compared to Ps.334,800 in October 2025.
In the first semester of 2026, the minimum annual income subject to income tax was Ps.5.2 million.
International Reserves
As of September 30, 2026, the gross international reserve assets of the Central Bank totaled U.S.$46.1 billion, compared to U.S.$41.1 billion as of December 31, 2025. This increase in gross international reserves was mainly due to higher purchase levels during 2026. See “Monetary System—Monetary Policy.”
MONETARY SYSTEM
Monetary Policy
In 2026, the Central Bank implemented a re-monetization phase designed to restore price stability and support sustainable economic growth. The principal elements of this phase include:
| | Exchange Rate Floating Band. On September 30, 2026, the Central Bank set the exchange rate band at the Mercado Libre de Cambios (“MLC”) between Ps.724,28 and Ps.1,919.40 per U.S. dollar. The lower and upper values of the band adjust monthly in line with the two-month lag inflation rate. |
| | Monetary Base and Reserve Accumulation. The Central Bank expects the monetary base to reach 4.8% of GDP by December 2026. As demand for pesos increases, the Central Bank intends to accommodate such demand, in part, through purchases of foreign currency, which would increase both the monetary base and international reserves. The Central Bank estimates that an increase in demand for pesos equivalent to one percentage point of GDP could support approximately U.S.$17 billion in foreign currency purchases, depending on the availability of foreign currency in the market. This estimate assumes that the resulting expansion of the monetary base would not be offset by sustained sterilization operations. |
Under the current framework, the daily reserve accumulation program execution amount is tied to 5% of the exchange market daily volume, and the Central Bank may purchase in blocks to maintain market functionality and stability. These operations are conducted through open market operations of Lecaps and repos, while encouraging financial institutions to invest excess liquidity in instruments with maturities longer than one day and positive real interest rates.
| | Reserve Requirements. The institution pursues gradual adjustments of reserve requirements on banks as a key point for monetary equilibrium, in line with price stability and recovery of the financial intermediation sector. A monetary contractive approach applies as long the observed inflation remains above the international one. On April, 16, the daily minimal cash requirement was set on 65%, whereas the minimum and maximum term of the public bonds used as part of such integration, previously 60 to 760 days, were eliminated. |
D-8
| | Reverse Repo Operations. On January 7, 2026, the Central Bank entered into a U.S.$3 billion reverse repo with six international banks at an interest rate equal to SOFR plus an average spread of 400 basis points, representing an annual rate of 7.4% for a 372-day term. The operation, which was oversubscribed by approximately 50% of the offered amount, was collateralized by Bonares 2035 and 2038 and is intended to strengthen international reserves. |
In July 2026, the Central Bank cancelled U.S.$6 billion of existing repos due in 2026 and 2027 and settled new repos and total return swaps for that amount with ten international banks, due in September 2028, at an interest rate of SOFR plus 400 basis points. This measure strengthened the foreign currency liquidity position and improved predictability of flows.
| | Central Bank Balance Sheet. On May 14, 2026, the Central Bank announced that it would put Ps.24.400 billion of its 2025 profits at the Treasury’s disposal as part of the ongoing balance sheet cleansing process. Of this amount, Ps.18.400 billion are expected to be applied to repurchase nontransferable notes in the Central Bank’s portfolio, which implies a 3.3% reduction of the Treasury debt-to-GDP ratio. The remaining Ps.6,000 billion are expected to be constituted as deposits at the Central Bank. |
| | Credit Policy. On June 11, 2026, the Central Bank expanded access to U.S. dollar-denominated credit to include enterprises that do not generate income in that currency, provided there are sufficient guarantees to back up the operation, such as dollarized assets. |
| | Fiscal Innocence Law. Following the enactment of the Ley de Inocencia Fiscal (Fiscal Innocence Law, Law No. 27,799) on January 2, 2026, the Central Bank published additional guidance in connection with such law in February 2026, which included: |
| | Under a risk-based approach and consistent with anti-money laundering regulations, holding foreign currency in cash is not considered illegal, taking into account the financial institution’s customer profile, the economic reasonableness of the transaction and the existence of other concurrent warning indicators, if any. |
| | Anti-money laundering regulations do not prohibit cash deposits, regardless of the amount. |
| | Information about the source of funds is not required at a teller’s counter as a prerequisite for a deposit, provided that the depositor and account holder are identified as required by regulation when the amount exceeds 40 minimum wages. |
| | Mutual Funds. The Comisión Nacional de Valores (National Securities Commission or “CNV”) temporarily suspended open mutual funds (fondos comunes de inversión abiertos or “FCIAs”) that plan to invest more than 25% of their net assets in assets negotiable abroad or of foreign origin. This measure affects both new funds and new subscriptions to existing funds, in order to evaluate the fiscal impact of such assets. Further, the CNV and Central Bank allowed for the flexibilization of specified dollar liquidity operations for brokerage firms and financial agents, enabling them to rebuild their net foreign currency position while maintaining financing in pesos. |
| | China Swap Agreement. The Central Bank renewed the bilateral swap agreement with the People’s Bank of China, for a total amount of RMB 130 billion, with a five-year term, two years longer than in previous agreements. |
| | Central Bank Charter Reform. In July 2026, the Government submitted a bill to Congress to amend the Charter of the Central Bank. The bill establishes the preservation of the value of the currency as the primary and fundamental mission of the Central Bank, modifies key aspects of its institutional design, and introduces changes to the mechanisms for the removal of its authorities. In addition, the bill prohibits the financing of the National Treasury through temporary advances, eliminates mechanisms for the transfer of reserves, and limits the distribution of expected profits. The bill seeks to regulate the interaction between the Central Bank and the National Treasury, prohibiting monetary authority financing of the Government in order to avoid monetary expansions not backed by greater money demand. As a transitional measure, profits may be distributed according to the current criterion, provided they are used to settle outstanding balances of temporary advances and non-transferable bills. This measure is intended to complete the process of removing non-realizable items from the Central Bank’s balance sheet, thereby strengthening its capacity to preserve the value of the currency. As of the date of this Annual Report, the bill was under review by Congress. |
| | Foreign Currency Credit Expansion. In August 2026, the Government and the Central Bank implemented measures aimed at increasing the availability of financing for private investment. Through Decree No. 736/2026 and Communication “A” 8467, the authorities broadened the permitted uses of foreign-currency deposits within the domestic financial system, with the objective of channeling a larger share of dollar-denominated funding toward private-sector investment. |
D-9
| | Mortgage Lending Program. On August 26, 2026, the Government announced a fixed-term deposit auction program earmarked for mortgage lending to individuals for the purchase, construction or remodeling of their first home. The program provides for a total of Ps.2,000 billion in fixed-term deposits in financial institutions, denominated in pesos and linked to Unidades de Valor Adquisitivo (Purchasing Power Units or “UVA”), which are units of account adjusted daily based on the CER coefficient and are used for mortgage lending. |
| | Each auction is capped at Ps.200 billion, with a maximum limit to be offered by financial institutions of 20% of the total auction amount, and a maximum period for funds application of 90 consecutive days from the date of deposit. |
| | Successful bidder institutions may only offer credits to their clients at a maximum interest rate of UVA plus 7.50%, with a minimum repayment period of 15 years, and may not exceed an equivalent amount of 150,000 UVAs for each credit. |
Central Bank Balance Sheet
The following table sets forth information on the Central Bank’s balance sheet as of the dates specified.
Central Bank Balance Sheet(1)
(in millions of pesos, unless otherwise specified)
| As of September 30, | ||||||||
| 2025 | 2026 | |||||||
| Assets |
||||||||
| International reserves: |
||||||||
| Gold |
10,425,677 | 12,500,428 | ||||||
| Foreign currency |
31,891,196 | 31,909,851 | ||||||
| Placements of foreign currency |
13,423,496 | 25,413,208 | ||||||
| Other(2) |
(566,530 | ) | 121,670 | |||||
|
|
|
|
|
|||||
| Total international reserves(3) |
55,173,839 | 69,945,156 | ||||||
|
|
|
|
|
|||||
| Public bonds(4)(5) |
90,779,664 | 110,673,686 | ||||||
| Credits to: |
||||||||
| Government (temporary advances)(5) |
2,987,379 | 3,040,489 | ||||||
| Financial system |
10,996 | 30,671 | ||||||
| International organizations(6) |
7,917,012 | 9,183,691 | ||||||
| Other assets(7)(8) |
17,008,020 | 3,569,234 | ||||||
|
|
|
|
|
|||||
| Total assets |
173,876,909 | 196,442,927 | ||||||
|
|
|
|
|
|||||
| Liabilities |
||||||||
| Monetary Base: |
||||||||
| Currency in circulation(9) |
23,619,271 | 28,738,458 | ||||||
| Current accounts in pesos(10) |
18,676,341 | 18,170,960 | ||||||
|
|
|
|
|
|||||
| Total monetary base |
42,295,612 | 46,909,419 | ||||||
|
|
|
|
|
|||||
| Deposits: |
||||||||
| Government deposits |
14,242,526 | 9,696,696 | ||||||
| Other deposits |
39,378,667 | 20,186,477 | ||||||
|
|
|
|
|
|||||
| Total deposits |
53,621,193 | 29,883,174 | ||||||
|
|
|
|
|
|||||
| Obligation to international organizations |
170,707 | 186,380 | ||||||
| Central Bank notes: |
||||||||
| Notes issued in foreign currency |
18,508,984 | 7,566,022 | ||||||
| Notes issued in pesos |
283,640 | 237,190 | ||||||
|
|
|
|
|
|||||
| Total Central Bank notes(11) |
18,792,588 | 7,803,213 | ||||||
| Other liabilities |
27,781,370 | 54,604,281 | ||||||
|
|
|
|
|
|||||
| Total liabilities |
142,661,470 | 139,386,466 | ||||||
|
|
|
|
|
|||||
| Net assets |
31,215,439 | 57,056,462 | ||||||
|
|
|
|
|
|||||
| Memorandum items: |
||||||||
| International reserves (in millions of U.S. dollars) |
U.S.$ | 40,374 | U.S.$ | 46,092 | ||||
| Exchange rate Ps./U.S.$(12) |
1,366.58 | 1,517.52 | ||||||
| (1) | The information included for each period on this table is based on the balance sheet presented by the Central Bank for the last day of each week of the year. |
| (2) | Includes net results of transactions under a Reciprocal Credit Agreement with ALADI. |
| (3) | Includes short-term foreign-currency denominated bonds and foreign currency-denominated deposits. |
| (4) | Includes a 1990 consolidated Treasury note, IMF obligations and others. |
| (5) | Starting in 2024, the accounting valuation of Treasury Notes issued in U.S. dollars and temporary advances to the Government is based on the recovery value on an amortized costs basis. |
| (6) | Includes transfers to international organizations from Government accounts and transfers to the Government from the IMF. |
| (7) | Includes transition accounts and others. |
| (8) | Resulting from the addition of the amounts of derivatives on international reserves and multilateral credit agreements. |
| (9) | Includes cash in vaults at banks. |
| (10) | Includes bank reserves in pesos at Central Bank. |
| (11) | Includes Nobacs and Leliqs. |
| (12) | Exchange rate used by the Central Bank to publish its balance sheet. |
Source: Central Bank.
D-10
Inflation
The table below sets forth the wholesale price index (“WPI”) and National CPI for the periods indicated:
| National CPI | WPI | |||||||
| 2026 |
||||||||
| January |
2.9 | % | 1.7 | % | ||||
| February |
2.9 | % | 1.0 | % | ||||
| March |
3.4 | % | 3.4 | % | ||||
| April |
2.6 | % | 5.2 | % | ||||
| May |
2.1 | % | 2.5 | % | ||||
| June |
1.9 | % | 1.1 | % | ||||
| July |
2.1 | % | 0.8 | % | ||||
| August |
1.7 | % | 2.1 | % | ||||
| September |
1.9 | % | 3.2 | % | ||||
Sources: INDEC and Ministry of Economy.
In September 2026, year-on-year inflation stood at 33.4%.
Foreign Exchange and International Reserves
Foreign Exchange Regulations
On April 9, 2026, the Central Bank introduced additional foreign exchange regulations requiring individuals transferring foreign currency abroad to submit a sworn statement committing not to purchase foreign currency-denominated securities during the subsequent 90 calendar days.
PUBLIC SECTOR FINANCES
During the eight-month period ended August 31, 2026, the primary fiscal result increased to a surplus of Ps.12.3 billion from a surplus of Ps.11.0 billion for the same period in 2025. Total revenues increased by 27.6% to Ps.112.4 billion from Ps.88.1 billion, while primary expenditures (excluding interest payments) increased by 29.8% to Ps.100.1 billion from Ps.77.1 billion.
The Budget
On September 15, 2026, the Executive Power submitted to Congress the draft bill of the national budget for the fiscal year ending December 31, 2027 (the “2027 Budget”). The 2027 Budget includes the following macroeconomic assumptions for 2027: (i) real GDP growth of 4.0%, (ii) a nominal exchange rate of Ps.1,847.6 per U.S. dollar as of December 2027, and (iii) year-on-year inflation of 18.0%. For the National Administration, the 2027 Budget projects total revenues of Ps.198,964,940.7 million (14% of GDP), primary expenditures of Ps.183,605,147.4 million (13% of GDP) and total expenditures of Ps.198,718,199.7 million (14% of GDP), which would result in a primary surplus of Ps.15,359,793.3 million (1.1% of GDP) and a financial surplus of Ps.246,741.0 million (equivalent to a balanced financial result in terms of GDP). As of the date of this Annual Report, the 2027 Budget was under review by Congress.
D-11
Tax Revenues
Composition of Tax Revenues
During the eight-month period ended August 31, 2026, tax revenues totaled Ps.103 billion, equivalent to a 26.4% annual increase, mainly due to an increase in social security contributions, VAT and income taxes.
Tax Relief Measures under the Milei Administration
In January 2026, ARCA implemented the Régimen Simplificado de Ganancias (Simplified Income Tax System) representing a significant reform to income tax administration. Under this system, ARCA pre-determines the taxpayer’s tax liability based on issued invoices and deductible expenses, disregarding personal expenditures and total assets changes. The income tax affidavit is considered correct a priori and can only be questioned by ARCA if irregularities exceed 15% and there is evident proof to support such determination. In addition, the prescription period for legal claims against taxpayers was shortened from 5 to 3 years. Tax payers with an annual income over Ps.1,000 million (after VAT) or a total estate of over Ps.10,000 million (including assets inside and outside Argentina) are not eligible for the simplified system.
In March 2026, the Government announced that rental income obtained from residential properties for rent or sale would be exempt 100% from income tax payments, whereas previously only 10% of this value could be applied for deduction.
Value Added Tax
In April 2026, the Government decreased the VAT rate from 27% to 10.5% for users of electricity for irrigation, with the objective of lowering agricultural producers’ costs.
Internal Taxes
In March 2026, internal taxes on insurance, cellular and digital telephony services, luxury items, motor vehicles and engines, recreational or sports boats and aircraft were eliminated.
Taxes on Foreign Trade
During 2026, the Government adopted measures to reduce export and import duties applicable to certain products. Effective January 15, 2026, the Government reduced to 0% the Derecho de Importación Extrazona (Extra-Zone Import Duty, or “DIE”) applicable to imported smartphones and certain portable cellular telephones, completing the reduction from 16% to 8% implemented in 2025. The Government also continued the zero-DIE regime for certain electric, hybrid, hydrogen-powered and other vehicles using alternative propulsion technologies, subject to an annual quota. Further, in January 2026 the Government expanded the scope of vehicles eligible under the regime and provided that unused portions of the annual quota may be carried over to the following year. In September 2026, the Government further amended the regime by increasing the maximum FOB value of qualifying fully electric vehicles to U.S.$35,000 per unit and of qualifying conventional and plug-in hybrid vehicles to U.S.$18,000 per unit, while maintaining the U.S.$16,000 maximum FOB value for qualifying mild-hybrid vehicles.
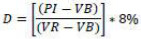
On January 28, 2026, the Government issued Decree No. 59/2026 establishing a separate export duty regime for crude oil produced from conventional reservoirs. Under the new regime, the Ministry of Economy publishes the ICE Brent first-line international price on the last working day of each month, calculated as the average of the last five quotations published by Platts Crude Marketwire under the title “Futures Settlements.” The export duty rates are as follows:
| | if the international price per barrel of crude oil and fuel is less than or equal to U.S.$65.0, the applicable export duty is 0%; |
| | if the international price per barrel of crude oil and fuel is higher than or equal to U.S.$80.0, the applicable export duty is 8%; and |
| | if the international price per barrel of crude oil and fuel is higher than U.S.$65.0 and lower than U.S.$80.0, the export duty is calculated according to the following formula: D = (PI - VB)/(VR - VB) x 8, where D is export duty, PI is international price, VB is the base value (equal to U.S.$65.0) and VR is the reference value (equal to U.S.$80.0). |
On May 21, 2026, the Government announced further reductions in export duties on wheat and barley (from 7.5% to 5.5%), effective June 2026. In addition, the Government announced that, starting January 2027 and subject to tax collection levels, export duties on soy will be gradually reduced between a quarter and half point monthly until 2028. The Government also announced reductions in export duties on the automotive, petrochemical and machinery industries.
D-12
On June 3, 2026, the Government issued Decree No. 423/2026, which reduced export duties on wheat and barley and their derivatives by two percentage points and established a schedule for the progressive reduction, between January 2027 and December 2028, of export duties applicable to soybeans, corn, sunflower, sorghum and certain related products.
Effective July 1, 2026, the Government reduced export duties to 0% on chemical, steel, aluminum, copper, zinc, tin, other industrial metals and part of the automotive production. In addition, a progressive scheme of reductions was set for specific petrochemical products (benzene, toluene and methanol), plastics and resins (polyethylene, polypropylene and PVC), certain fertilizers and rubber. These products are scheduled to have their export duties reduced from 3.0 – 4.5%to 0% by June 2027.
PUBLIC SECTOR DEBT
Overview
As of August 31, 2026, gross public debt totaled U.S.$484.9 billion, an increase of 6.6% compared to December 31, 2025, of which 0.02% (U.S.$106 million) was non-performing (excluding Untendered Debt). CER-indexed linked debt and local currency-denominated debt accounted for 48.7% of the total performing gross public debt, while foreign currency-denominated debt accounted for 51.3%.
As of September 30, 2026, the Ministry of Economy conducted 28 tender offers, including issues of securities within the short-term bills program, long-term bonds (including CER-indexed linked and dollar-linked bonds), as well as liability management transactions that extended the average maturity of short-term debt. As of August 31, 2026, the stock of short-term bills (Ledes, Lecer and Lecap) amounted to U.S.$42.8 billion –which include accrued capitalization– compared to U.S.$54.1 billion as of December 31, 2025.
New Non-transferable Treasury bills
On June 25, 2026, the Ministry of Economy authorized the issuance of a U.S. dollar-denominated non-transferable Treasury bill in an aggregate original principal amount of U.S.$3.9 million, due on June 30, 2031, for the Central Bank, at par and with a bullet repayment at maturity. The applicable rate of this Treasury bill is one-year Term SOFR plus 0.71513%, less 1 percentage point, payable semi-annually.
Debt rating
Global rating agencies upgraded Argentina’s sovereign debt rating. In June 2026, Fitch upgraded Argentina’s long-term local and foreign currency issuer default ratings from “CCC+“ to “B-,” with a stable outlook. In July 2026, Moody’s upgraded Argentina’s long-term issuer rating from “Caa1” to “B3” for both local and foreign currency, and revised its outlook from “stable” to “positive.”
Debt Owed to Financial Institutions
IMF
During the first eight months of 2026, the IMF disbursed a total amount of U.S.$1.0 billion to the Republic.
IBRD
During the first eight months of 2026, the IBRD disbursed a total amount of U.S.$166 million to the Republic.
IADB
During the first eight months of 2026, the IADB disbursed a total amount of U.S.$305 million to the Republic.
CAF
During the first eight months of 2026, the CAF disbursed a total amount of U.S.$704 million to the Republic.
D-13
Legal Proceedings
The Settlement
As of October 8, 2026, agreements in principle have been executed with holders of approximately 87% of the nominal amount of Untendered Debt outstanding as of December 31, 2015 (including in the calculation claims that the Republic considers time-barred and for which no agreements have been entered into).
As of October 8, 2026, payments to settling creditors had resulted in the dismissal of claims in the United States for an aggregate nominal amount of approximately U.S.$3.75 billion, plus interest, and the satisfaction of judgments in the amount of approximately U.S.$5.83 billion. Additional claimants in the U.S. District Court for the Southern District of New York (the “New York District Court”) have entered into settlement agreements, upon payment of the amounts contemplated in such settlements, the claims are to be dismissed.
As of October 8, 2026, the Republic has settled with holders of German law governed bonds for a nominal amount of 750.1 million.
In July 2026, the Republic completed settlements with the remaining judgment creditors holding Untendered Debt claims against the Republic in the United States—the Attestor Plaintiffs and Bainbridge—resolving all of their outstanding claims and judgments. Definitive agreements were signed on April 1, 2026. Following receipt of the necessary Congressional approvals, on July 29, 2026, the parties filed stipulations of dismissal with prejudice and notices of satisfaction of judgment with the New York District Court. On August 6, 2026, the New York District Court entered orders dismissing those actions with prejudice, acknowledging full satisfaction of the judgments, and closing the cases. Dismissal of these cases additionally resulted in dismissal of the Turnover Order appeal noted above in relation to the plaintiff with a judgment issued in December 2020, as well as the “me-too” turnover motions and the motion for turnover relating to Banco de la Nación Argentina and Aerolíneas Argentinas, and the cases that were granted summary judgment in August 2024.
Individual litigation in the United States
As of October 8, 2026, 9 actions involving bonds defaulted in 2001 with an alleged nominal amount of approximately U.S.$49.65 million were pending in the New York District Court. Judgments for a total value of approximately U.S.$71.27 million have been entered in actions involving bonds with a nominal amount of approximately U.S.$44.13 million.
On March 9, 2026, in the case where a group of plaintiffs sought over U.S.$35.8 million in principal, the Second Circuit affirmed in part and vacated in part the New York District Court’s dismissal of the case. The Second Circuit affirmed the dismissal of certain bond claims as time-barred, while reversing the decision of the New York District Court on other bond claims. This decision reduced the principal claim by this group of plaintiffs to approximately U.S.$5.5 million. The plaintiffs’ petition for rehearing and rehearing en banc was denied on April 9, 2026, and the case returned to the New York District Court on the remaining bond claims. On June 12, 2026, the Republic filed its Answer. On July 1, 2026, the plaintiffs filed a petition for a writ of certiorari to the United States Supreme Court, which was docketed on July 16, 2026. On July 30, 2026, the New York District Court stayed proceedings pending the Supreme Court’s resolution of the petition. On October 5, 2026, the U.S. Supreme Court denied the plaintiffs’ petition for a writ of certiorari.
GDP warrant litigation
In the December 2023 action, following the September 29, 2025 partial motion-to-dismiss ruling and the Republic’s answer, on May 5, 2026, the New York District Court entered a scheduling order providing for fact discovery through July 6, 2027 and expert discovery through January 11, 2028. The action is proceeding in discovery.
On January 14, 2026, the same group of plaintiffs as in the six coordinated U.S. GDP-linked warrants actions for the year 2013 filed a new complaint in the New York District Court based on purported ownership of 2005 and 2010 GDP-linked warrants, seeking approximately U.S.$1.3 billion for non-payment of amounts allegedly due under such GDP-linked warrants for the year 2013, plus interest. On March 16, 2026, the Republic moved to dismiss. That motion has been fully briefed and remains pending.
On March 13, 2026, the claimants in the GDP-linked warrants proceedings in the United Kingdom filed an application in the High Court of England seeking specific performance against the Republic in respect of the production of GPD data in 1993 year of base prices for the years 2014 and following, and an order for payment by the Republic of the payment amount due in respect of each of the years 2014 to 2024 for which the payment conditions were met. On July 10, 2026, the Republic filed its grounds in opposition to the application. Disclosure is expected to be completed by December 18, 2026, fact witness evidence is expected be completed by April 2, 2027, and expert evidence is expected to be completed by September 10, 2027. The application is listed for a merits hearing from November 17 through November 30, 2027.
D-14
In the action filed on June 23, 2025 in the D.C. District Court to enforce the final U.K. GDP-warrant money judgment, the Republic moved to dismiss for lack of jurisdiction on February 2, 2026. That motion has been fully briefed and remains pending.
Litigation in Germany
As of October 8, 2026, final judgments entered for a total amount of approximately 121 million in principal plus interest and costs in suits on Untendered Debt brought against Argentina in Germany remain unsettled, while claims seeking approximately 2.2 million in principal on defaulted debt, plus interest, have been filed in Germany although no final judgment has yet been rendered.
Litigation in Spain
As of October 8, 2026, three plaintiffs have brought enforcement actions against the Republic in Spain. The total amount sought to be enforced against the Republic across those three cases is approximately 452 million. All three cases are currently being briefed.
ICSID Arbitration
As of October 8, 2026, there were (i) seven final outstanding ICSID awards against Argentina totaling U.S.$832.5 million, (ii) two ICSID awards against Argentina for U.S.$833.5 million pending annulment requested by Argentina, and (iii) six ongoing ICSID proceedings against Argentina, with claims totaling U.S.$15.2 billion. All amounts are approximate and refer to principal, excluding interest and costs.
In the August 24, 2021 D.C. action, on July 21, 2026, the D.C. Circuit affirmed the district court’s judgment. The Republic’s petition for rehearing and rehearing en banc was denied on September 3, 2026. On September 25, 2026, the D.C. District Court granted the creditor’s motion for an order under 28 U.C.S. § 1610(c). The Republic’s deadline to file a petition for a writ of certiorari before the Supreme Court is December 2, 2026. Separately, on September 16, 2026, the award creditor registered the judgment in the Southern District of New York, and obtained an abstract of judgment on September 29, 2026.
In the September 20, 2021 D.C. action, the appeal remains held in abeyance pending the above appeal of the August 24, 2021 action. The D.C. Circuit continued the stay on September 1, 2026, and on October 15, 2026, the D.C. Circuit granted the parties’ joint motion to continue the abeyance pending the Supreme Court’s disposition of the Republic’s forthcoming certiorari petition noted above.
In the U.K. set-aside proceedings of the registration order issued on January 14, 2025, the stay of the Republic’s set-aside application was lifted on April 3, 2026 following the U.K. Supreme Court’s decision in the two separate appeals. A hearing on the set-aside application is scheduled for May 18–19, 2027.
In the August 4, 2025 D.C. action, the Republic filed its answer to the petition and a motion to stay the proceeding on October 13, 2026.
On April 23, 2026, another plaintiff filed an action in the D.C. District Court, seeking enforcement of an arbitral award issued against the Republic under the ICSID Convention. The plaintiff seeks a judgment of approximately U.S.$40.0 million in principal, plus interest and costs. On October 15, 2026, the D.C. District Court granted the parties’ joint motion to hold the Republic’s response in abeyance pending the Supreme Court’s disposition of the Republic’s forthcoming certiorari petition in the August 24, 2021 D.C. action noted above.
Other Arbitration
As of October 8, 2026, there were (i) two final outstanding UNCITRAL awards against Argentina totaling U.S.$7.5 million, (ii) one ICC award for U.S.$67.1 million against Argentina and one UNCITRAL award for U.S.$9.7 million against Argentina pending annulment requested by Argentina, and (iii) three suspended ICC proceedings with claims totaling U.S.$585.3 million.
All amounts described above are approximate and refer to principal, excluding interest and costs.
On March 31, 2026, a claimant filed an enforcement action in the D.C. District Court to enforce a 2024 UNCITRAL award. The plaintiff seeks a judgment of approximately U.S.$208 million. On August 10, 2026 the Republic moved to dismiss for lack of jurisdiction or, alternatively, to adjourn pending an ongoing set-aside appeal before the Court of Appeal of The Hague. The plaintiff filed its opposition on September 24, 2026 and the Republic’s reply is due on October 27, 2026. In a parallel U.K. recognition action, on June 3, 2026, the English High Court granted the claimant leave to recognize and enforce the same award. The Republic has until November 11, 2026 to apply to set the order aside.
D-15
Other Non-Creditor Litigation in the U.S.
On March 27, 2026, the Second Circuit issued its opinion reversing the New York District Court’s entry of the approximately U.S.$16.1 billion judgment for the Petersen and Eton Park Entities on their breach-of-contract claims against the Republic, affirming the dismissal of the promissory-estoppel claims against the Republic and YPF, affirming the grant of judgment for YPF, and remanding for further proceedings consistent with the Second Circuit’s opinion. The Second Circuit held in abeyance the turnover and post-judgment enforcement appeals pending resolution of any rehearing or cert petitions. The Petersen and Eton Park Entities’ petition for rehearing en banc was denied on June 2, 2026 and the mandate was issued on June 10, 2026. On September 10, 2026, the parties jointly submitted to the New York District Court a proposed form of final judgment consistent with the Second Circuit’s mandate. On September 30, 2026, the Petersen and Eton Park Entities filed a petition for a writ of certiorari before the Supreme Court.
D-16
PRESENTATION OF STATISTICAL AND OTHER INFORMATION
All annual information presented in this Annual Report is based upon January 1 to December 31 periods, unless otherwise indicated. Totals in some tables in this Annual Report may differ from the sum of the individual items in those tables due to rounding.
Unless otherwise stated, prices and figures are stated in current values of the currency presented, and references in this Annual Report to “pesos,” “Ps.” and “ARP” are to Argentine pesos, references to “U.S. dollars” and “U.S.$” are to the currency of the United States of America, references to “euros,” “” and “EUR” are to the currency of the European Union, references to “CHF” are to Swiss francs and references to “JPY” are to Japanese yens.
Information in this Annual Report that is identified as being derived from a publication of the Republic or one of its respective agencies or instrumentalities is included as public official statements made on the authority of the Republic. Certain statistical information included in this Annual Report is preliminary and is subject to change, completion or amendment.
National Public Accounts
Historically, transfers from the Central Bank and the FGS to the Government were recorded as current fiscal revenue under “other non-tax revenue.” Starting in 2016 (and on a pro forma basis for 2015), the Government classifies income generated by the Central Bank and the FGS as financial revenue that does not form part of the calculation of the primary fiscal balance. See “Public Sector Finances—Introduction.”
Certain Methodologies
CER and CVS. Certain data included in this Annual Report has been adjusted for inflation based on the Coeficiente de Estabilización de Referencia (Stabilization Coefficient, or “CER”), or the Coeficiente de Variación Salarial (“CVS”). CERs are units of account whose value in pesos is indexed to the CPI designated to be used by the Government. The nominal amount of a CER-based financial instrument is converted to a CER-adjusted amount and interest on the financial instrument is calculated on the CER-adjusted balance. CVSs are units of account whose value in pesos is determined based on changes in an index of public and private sector wages. The nominal amount of a CVS-based financial instrument is converted to a CVS-adjusted amount and interest on the financial instrument is calculated on the CVS-adjusted balance. Adjustments and payments on the Republic’s debt indexed to the CER and CVS are not subject to restatement or revision.
Exports. Exports are calculated based upon (i) for purposes of foreign trade, statistics reported to Argentine customs upon departure of goods from Argentina on a FOB basis and (ii) for purposes of the balance of payments accounts, statistics collected on a FOB basis.
Imports. Imports are calculated based upon (i) for purposes of foreign trade, statistics reported to Argentine customs upon entry of goods into Argentina on a cost, insurance and freight included basis (“CIF basis”) and (ii) for purposes of the balance of payments accounts, statistics collected on a free on board (“FOB basis”) at a given departure location.
Inflation. The rate of inflation or inflation rate provides an aggregate measure of the rate of change in the prices of goods and services in the economy. The inflation rate is generally measured by the rate of change in the CPI between two periods unless otherwise specified. The annual percentage rate of change in the CPI as of a particular date is calculated by comparing the index as of that date against the index as of the date twelve months prior. The CPI in Argentina is calculated by INDEC.
Underemployment rate. Underemployment rate represents the percentage of Argentina’s labor force that has worked fewer than 35 hours during the week preceding the date of measurement and seeks to work more.
Unemployment rate. Unemployment rate represents the percentage of Argentina’s labor force that has not worked a minimum of one hour with remuneration or 15 hours without remuneration during the week preceding the date of measurement. The “labor force” refers to the sum of the population in major urban centers across Argentina that has worked a minimum of one hour with remuneration or 15 hours without remuneration during the week preceding the date of measurement plus the population that is unemployed but actively seeking employment.
Balance of Payments. Since 2017, balance of payments statistics are prepared based on the classification criteria set forth in the sixth edition of the Balance of Payments and International Investment Position Manual of the International Monetary Fund (IMF). See “Balance of Payments—Overview.”
D-17
FORWARD-LOOKING STATEMENTS
This Annual Report contains forward looking statements. Forward looking statements are statements that are not historical facts, including statements about the Republic’s current beliefs, estimates, expectations and projections, including those reflected in the budget bills submitted to Congress. While these forward-looking statements might have been reasonable when formulated, they are subject to certain risks and uncertainties, including the potential effects of current events that are not reasonably foreseeable or known at this time, and could cause actual results to differ materially from those contemplated by the relevant forward-looking statements. Accordingly, the Republic gives no assurance that actual events will not differ materially from the information included in this Annual Report. Forward-looking statements speak only as of the date they are made. The Republic undertakes no obligation to update any of them in light of new information or future events.
Forward-looking statements involve inherent risks and uncertainties. A number of important factors could cause actual results to differ materially from those contained in any forward-looking statement. The information contained in this Annual Report identifies important factors that could cause such differences. Such factors include, but are not limited to:
| | adverse domestic factors, such as: |
| | increases in inflation; |
| | increases in domestic interest rates; |
| | national or international public health events, including the outbreak of pandemics or contagious diseases, and the potential impact on the economy and the government finances; and |
| | exchange rate volatility, any of which could lead to lower economic growth or a decrease in Argentina’s international reserves; |
| | adverse external factors, such as: |
| | declines in foreign investment, which could deprive the Argentine economy of capital needed for economic growth; |
| | changes in international prices (including commodity prices) and high international interest rates, either of which could increase Argentina’s current account deficit and budgetary expenses; and |
| | recession or low economic growth in Argentina’s trading partners, which could decrease exports from Argentina and the country’s international competitiveness, induce a contraction of the Argentine economy and, indirectly, reduce tax revenues and other public sector revenues and adversely affect the country’s fiscal accounts; |
| | other adverse factors, such as: |
| | climatic events; |
| | the outbreak of military hostilities, including the military conflict involving Russia and Ukraine, the conflict in Gaza and disruptions to shipping operations in the Red Sea, and political uncertainty; and |
| | adverse outcomes in ongoing litigation and arbitration proceedings in several jurisdictions that may lead to new judgments and awards against Argentina. |
D-18
DATA DISSEMINATION
Argentina subscribes to the Special Data Dissemination Standard (“SDDS”) of the IMF, which is designed to improve the timeliness and quality of information of subscribing member countries. The SDDS requires subscribing member countries to provide schedules indicating, in advance, the date on which data will be released (the so-called “Advance Release Calendar”). For Argentina, precise dates or “no-later-than-dates” for the release of data under the SDDS are disseminated in advance through the Advance Release Calendar, which is published on the Internet under the International Monetary Fund’s Dissemination Standards Bulletin Board. Summary methodologies of all metadata to enhance transparency of statistical compilation are also provided on the Internet under the International Monetary Fund’s Dissemination Standards Bulletin Board. The Internet website is located at http://dsbb.imf.org. The Republic, the Government nor any agents acting on behalf of the Republic or the Government in connection with this Annual Report accepts any responsibility for information included on that website, and its contents are not intended to be incorporated by reference into this Annual Report.
D-19
SUMMARY
Selected Economic Information
(in billions of pesos unless otherwise indicated)
| 2021 | 2022 | 2023 | 2024 | 2025 | ||||||||||||||||
| THE ECONOMY: |
||||||||||||||||||||
| Real GDP (in billions of 2004 pesos) |
Ps. | 689.8 | Ps. | 731.3 | Ps. | 717.8 | Ps. | 708.0 | Ps. | 739.7 | ||||||||||
| Rate of change from prior year |
10.4 | % | 6.0 | % | (1.9 | )% | (1.4 | )% | 4.5 | % | ||||||||||
| Nominal GDP |
46,219.1 | 82,810.1 | 193,946.2 | 584,377.0 | 850,239.8 | |||||||||||||||
| Nominal GDP per capita (in thousands of U.S. dollars) |
U.S.$ | 10.6 | U.S.$ | 13.8 | U.S.$ | 14.2 | U.S.$ | 13.8 | U.S.$ | 14.7 | ||||||||||
| Inflation (as measured by INDEC) |
50.9 | % | 94.8 | % | 211.4 | % | 117.8 | % | 31.5 | % | ||||||||||
| Unemployment rate |
7.0 | % | 6.3 | % | 5.7 | % | 6.4 | % | 7.5 | % | ||||||||||
| Population(1) |
45.8 | 46.1 | 46.2 | 46.3 | 46.4 | |||||||||||||||
| BALANCE OF PAYMENTS (in billions of U.S. dollars): |
||||||||||||||||||||
| Current account |
U.S.$ | 6.6 | U.S.$ | (4.0 | ) | U.S.$ | (22.4 | ) | U.S.$ | 5.9 | U.S.$ | (7.8 | ) | |||||||
| Of which: |
||||||||||||||||||||
| Imports of goods |
59.3 | 76.4 | 69.8 | 57.4 | 71.8 | |||||||||||||||
| Exports of goods |
78.0 | 88.8 | 67.1 | 79.8 | 87.2 | |||||||||||||||
| Capital account |
0.3 | 0.2 | 0.2 | 0.3 | 0.5 | |||||||||||||||
| Financial account |
4.5 | (7.4 | ) | (25.5 | ) | 2.3 | (12.0 | ) | ||||||||||||
| Errors and omissions |
(2.4 | ) | (3.7 | ) | (3.8 | ) | (3.8 | ) | (4.7 | ) | ||||||||||
| Change in gross international reserves deposited in the Central Bank |
(0.1 | ) | 6.9 | (21.7 | ) | 6.1 | 7.2 | |||||||||||||
| Gross international reserves deposited in the Central Bank |
39.7 | 44.6 | 23.1 | 29.6 | 41.1 | |||||||||||||||
| PUBLIC FINANCE: |
||||||||||||||||||||
| Revenues |
8,516.4 | 14,523.0 | 31,115.9 | 95,489.6 | 132,314.2 | |||||||||||||||
| As a % of GDP |
18.4 | % | 17.5 | % | 16.0 | % | 16.3 | % | 15.6 | % | ||||||||||
| Primary Expenditures |
9,496.6 | 16.182.8 | 36,280.5 | 85,083.8 | 120,545.1 | |||||||||||||||
| As a % of GDP |
20.5 | % | 19.6 | % | 18.7 | % | 14.6 | % | 14.2 | % | ||||||||||
| Primary fiscal balance |
(980 | ) | (1,659.7 | ) | (5,164 | ) | 10,405.8 | 11,769.2 | ||||||||||||
| As a % of GDP |
(2.1 | )% | (2.0 | )% | (2.7 | ) | 1.8 | % | 1.4 | % | ||||||||||
| Overall fiscal balance |
(1,664.5 | ) | (3,152.8 | ) | (8,418.5 | ) | 1,764.8 | 1,453.8 | ||||||||||||
| As a % of GDP |
(3.6 | )% | (3.8 | )% | (4.4 | )% | 0.3 | % | 0.2 | % | ||||||||||
| PUBLIC DEBT (including arrears) (in billions of U.S. dollars): |
||||||||||||||||||||
| Peso-denominated debt |
U.S.$ | 107.9 | U.S.$ | 131.2 | U.S.$ | 103.8 | U.S.$ | 209.3 | U.S.$ | 191.0 | ||||||||||
| Foreign-currency denominated debt |
255.4 | 265.4 | 266.9 | 257.7 | 264.1 | |||||||||||||||
|
|
|
|
|
|
|
|
|
|
|
|||||||||||
| Total gross public debt |
U.S.$ | 363.2 | U.S.$ | 396.6 | U.S.$ | 370.7 | U.S.$ | 466.9 | U.S.$ | 455.1 | ||||||||||
|
|
|
|
|
|
|
|
|
|
|
|||||||||||
| Total gross debt (including arrears and Untendered Debt) as a % of GDP |
80.8 | % | 84.8 | % | 154.5 | % | 82.5 | % | 78.1 | % | ||||||||||
|
|
|
|
|
|
|
|
|
|
|
|||||||||||
| Total gross debt (including arrears and Untendered Debt) as a % of Government revenues |
397.2 | % | 464.9 | % | 927.2 | % | 491.9 | % | 491.7 | % | ||||||||||
|
|
|
|
|
|
|
|
|
|
|
|||||||||||
| (1) | In millions. INDEC projections based on the census conducted in 2010. For 2025, information is based on provisional results from the census conducted in 2022. As of the date of this Annual Report, INDEC estimates a total population of 46.5 million. |
Source: INDEC and Ministry of Economy.
D-20
THE REPUBLIC OF ARGENTINA
Map of Argentina
Territory and Population
The Republic of Argentina consists of 23 provinces and the City of Buenos Aires. Located in the southeastern region of South America, Argentina is the second largest country in Latin America and the eighth globally in terms of territory, covering approximately 3.8 million square kilometers (1.5 million square miles), including territorial claims in the Antarctic region (covering approximately 970,000 square kilometers) and to certain south Atlantic islands (covering approximately 5,000 square kilometers), excluding the recently recognized extension by Argentina’s sovereign rights in the South Atlantic Ocean. See “—Foreign Affairs and International Organizations—The Malvinas Sovereignty Dispute” and “—Foreign Affairs and International Organizations—Continental Shelf.”
The most densely inhabited areas and the main agricultural regions of the country are located on the wide temperate belt that stretches across central Argentina. The country’s population as of 2022 was an estimated 45.9 million, based on information from the most recent census conducted on such year. During the period from 2010 to 2022, Argentina’s population grew at an estimated average annual rate of 0.9%, based on information from the 2022 census.
D-21
Based on information from the 2022 census, as of 2022, approximately 30.4% of the population (13.9 million people) lived in the City of Buenos Aires and the heavily populated urban area surrounding the City of Buenos Aires, known as the Greater Buenos Aires Area. As of 2010, approximately 98.1% of the population over the age of 10 and older was literate.
The table below sets forth comparative gross national income (“GNI”) figures and selected other comparative statistics using the most recent year for which such comparative information is available.
Population
| Argentina | Brazil | Chile | Colombia | Mexico | Peru | United States |
||||||||||||||||||||||
| Per capita GNI(1) |
U.S.$ | 14,650 | U.S.$ | 10,550 | U.S.$ | 16,960 | U.S.$ | 7,900 | U.S.$ | 13,730 | U.S.$ | 8,430 | U.S.$ | 88,810 | ||||||||||||||
| Life expectancy (in years)(2) |
77.5 | 76.0 | 81.4 | 77.9 | 75.3 | 77.9 | 78.9 | |||||||||||||||||||||
| Infant mortality (% of live births)(2) |
0.80 | % | 1.23 | % | 0.58 | % | 1.05 | % | 1.21 | % | 1.10 | % | 0.55 | % | ||||||||||||||
| Adult literacy rate (% of population age 15 or older)(3) |
98.10 | % | 94.74 | % | 96.40 | % | 95.34 | % | 95.55 | % | 93.66 | % | n.a. | |||||||||||||||
| (1) | Data as of 2025. |
| (2) | Data as of 2024. |
| (3) | Data as of 2024, except for Argentina (2010, percentage of population age 10 or older) and Chile (2017). |
n.a. = not available.
Source: World Bank World Development Indicators and INDEC.
Government
The Argentine Constitution, first adopted in 1853, provides for a tripartite system of government divided into an executive branch headed by the President, a legislative branch consisting of a bicameral Congress, and a judicial branch headed by the Supreme Court of Justice. The Constitution was last amended in 1994. Each province and the City of Buenos Aires has its own constitution and the people of each province elect a governor and legislators who are independent from the Government. The Government may directly intervene in the administration of the provincial governments in certain emergency situations, including, to secure the republican form of government and in the case of foreign invasions.
Executive Branch
The president and vice president are directly elected for a four-year term, may serve for a maximum of two consecutive terms and may be re-elected after one term out of office. The president oversees the administration of the country and has the power to veto laws in whole or in part. Congress may override a presidential veto by a two-thirds majority vote in each chamber. The Jefatura de Gabinete de Ministros (Office of the Chief of the Cabinet of Ministers) is responsible for the administration of the country and prepares the Government’s annual budget, which is subject to congressional approval. The president chooses the chief of the Cabinet of Ministers, who may be removed by the vote of an absolute majority of both houses of Congress. All references in this Annual Report to the “Executive Power” are to the executive branch as described herein.
Congress
Congress is composed of the Senate and the Chamber of Deputies.
The Senate. There are a total of 72 senate seats, with three for each province and three for the City of Buenos Aires. Of the three senators from each district, two represent the party receiving the most votes in that district, and the third represents the party receiving the second-most votes. Senators are elected by popular vote to serve for six-year terms. Elections are held for one-third of the senate seats every two years. The last Senate elections were held in October 2025.
The Chamber of Deputies. The Chamber of Deputies consists of 257 seats, which are allocated in proportion to each district’s population. Deputies are elected by popular vote to serve four-year terms. Elections for half of the seats are held every two years. The last elections for seats in the Chamber of Deputies were held in October 2025.
D-22
Judicial System
The judicial system is composed of federal and provincial trial courts, courts of appeal and the Supreme Court of Justice (“Supreme Court”) which has up to five justices.
The Consejo de la Magistratura (“Judicial Council”) consists of an independent panel of lawyers, representatives of the judiciary, legislators, a representative of the executive branch and an academic. This body oversees the administration of the judicial branch, the initiation of impeachment proceedings against judges other than Supreme Court justices and the selection of judges. The Jurado de Enjuiciamiento (Jury of Prosecution) decides proceedings initiated by the Judicial Council to remove judges.
The president appoints all Supreme Court justices subject to Senate approval. All federal court judges are also appointed by the president subject to Senate approval, but they must be selected from a list of individuals submitted by the Judicial Council. Supreme Court justices and all federal court judges are subject to a mandatory retirement age of 75. All judicial appointments must be approved by two-thirds of the Senate. Pursuant to a presidential decree, candidates’ identities and certain additional information are published, and the executive branch provides for a period of public comment on each nomination before it is submitted to the Senate.
As of the date of this Annual Report, the Supreme Court had three confirmed sitting justices. Mr. Rosatti assumed as Chief Justice on October 1, 2021.
Recent Political History
Argentina has been under uninterrupted civilian rule since 1983, when the last military government came to an end due to poor economic management and the loss of a brief war with the United Kingdom over the Islas Malvinas. In 1983, Raúl Alfonsín was elected president. In 1989, Raúl Alfonsín was succeeded as president by Carlos Menem, who was re-elected in 1995 to a four-year term following the 1994 constitutional amendments that reduced the presidential term to four years from six.
After a decade of relative stability, Argentina faced an unprecedented social, economic and political crisis beginning in 2001 and 2002. See “The Argentine Economy—Background and Recent Economic History.” During this crisis, Argentina’s economy contracted significantly and poverty and unemployment reached record levels. The administration of President Fernando de la Rúa, who took office in December 1999, was unable to restore economic growth and during the second half of 2001, the deepening economic recession fueled rising social unrest.
Ongoing widespread riots and protests forced President de la Rúa and his entire cabinet to resign on December 19 and 20, 2001. Between December 2001 and January 2002, Congress appointed four successive presidents pursuant to the Constitution, including Eduardo Duhalde, who called for elections to be held on April 27, 2003, prior to the scheduled expiration of his term. Néstor Kirchner, former governor of the province of Santa Cruz, was elected and sworn in as president on May 25, 2003. President Kirchner’s term expired on December 10, 2007.
On October 28, 2007, Cristina E. Fernández de Kirchner, from the Frente para la Victoria (Front for Victory) faction of the Peronist Party and President Kirchner’s wife, was elected president. On October 23, 2011, President Fernández de Kirchner was re-elected for a second four-year term, which ended on December 10, 2015.
On November 22, 2015, Mauricio Macri, the candidate from the Cambiemos alliance, was elected president for a four-year term, which ended on December 10, 2019.
On October 27, 2019, Mr. Alberto Fernández, the candidate from the Frente de Todos coalition, was elected president for a four-year term, which ended on December 10, 2023.
Mr. Javier Milei was elected president in the national presidential elections that took place in Argentina on October 22, 2023, for the first rounds, and November 19, 2023, for the run-off election. Mr. Javier Milei obtained approximately 55.65% of the votes in the run-off and took office on December 11, 2023.
D-23
Political Parties
The following are Argentina’s main national political coalitions:
| | La Libertad Avanza (Freedom Moves Forward), a party formed by President Milei for the October 2021 congressional elections. |
| | Union por la Patria (Union for the Motherland), a coalition of several parties, including primarily: |
| | Partido Justicialista (“PJ”), or Peronist Party, founded by President Juan D. Perón in the 1940s, which includes the following factions: |
| | Unidad Ciudadana (Citizen’s Union), formerly Frente para la Victoria (Front for Victory) and Frente de Todos (Front for All); and |
| | Frente Renovador (Renewal Front, or “FR”), founded in 2013 as a split-off from the PJ. For the 2015 presidential elections, the FR and the former governor of the province of Córdoba, Juan Manuel de la Sota, formed the Unidos por una Nueva Alternativa (“UNA”) coalition. |
| | Unión Propuesta Republicana (Republican Proposal Union, or “PRO”), a political alliance that emerged in Argentina in 2007 composed of the following parties: Propuesta Republicana (Republican Proposal) (formerly Compromiso para el Cambio), Unión del Centro Democrático (UCeDé) (Union of the Democratic Center), Recrear para el Crecimiento (Recreating for Growth), Partido Federal (Federal Party), Unión Celeste y Blanco (Blue and White Union), Partido Popular Cristiano Bonaerense (Christian People’s Party of Buenos Aires) and Partido Nuevo Buenos Aires (New Buenos Aires Party). |
| | Unión Cívica Radical (Radical Civic Union, or “UCR”). |
Juntos por el Cambio, formerly Cambiemos, an alliance formed by the PRO, Radical Civic Union and Coalición Cívica (Civic Coalition, or “CC”), which participated in the 2023 election, split during 2024. This led to a shift in the relationship of political forces in Congress and allowed the ruling party to enter into certain parliamentary agreements with certain sectors of the PRO and the Radical Civic Union to advance its legislative agenda.
In addition, certain provincial political parties, such as Innovacón Federal (Federal Innovation) and Encuentro Federal, have an important representation in Congress, although they are in a context of parliamentary minority.
On October 22, 2023, presidential elections took place in Argentina and, in November 19, 2023, there was a run-off presidential election. Mr. Javier Milei obtained approximately 55.65% of the votes in the run-off and took office on December 11, 2023, followed by Sergio Massa (Frente de Todos), who obtained 44.35% of the votes.
On February 20, 2025, the Senate approved the suspension of the 2025 Elecciones Primarias Abiertas Simultáneas y Obligatorias (Simultaneous and Mandatory Open Primary Elections or “PASO”). As a result, in the 2025 congressional elections each political party was responsible for selecting its candidates independently.
On October 26, 2025, congressional elections were held in Argentina. Candidates of La Libertad Avanza obtained 35 seats in the Chamber of Deputies and ten seats in the Senate (for a total of 107 and 24 seats, respectively), Unión Por la Patria obtained one seat in the Chamber of Deputies and lost six seats in the Senate (for a total of 99 and 28 seats, respectively), and the rest of the political parties lost, in the aggregate, 36 seats in the Chamber of Deputies and four seats in the Senate (for a total of 51 and 20 seats, respectively).
The Milei administration assumed office without a majority in either house of Congress and, therefore, had been operating by building consensus with other political parties. However, since the last congressional elections, La Libertad Avanza, when taken together with allied political parties, has had a majority in the Chamber of Deputies (together with the support of legislative allies), allowing it to further its objective of reducing the public sector deficit, including in matters relating to the pension system and the education budget, among others.
D-24
The following table shows the party composition of the Chamber of Deputies and Senate following the elections in the years specified.
| Chamber of Deputies(1) | Senate(2) | |||||||||||||||||||||||
| 2021 | 2023 | 2025 | 2021 | 2023 | 2025 | |||||||||||||||||||
| Party: |
||||||||||||||||||||||||
| La Libertad Avanza |
2 | 38 | 107 | — | 7 | 24 | ||||||||||||||||||
| Unión Por la Patria (formerly Frente de Todos)(3) |
118 | 105 | 99 | 35 | 33 | 28 | ||||||||||||||||||
| Others(4) |
137 | 114 | 51 | 37 | 32 | 20 | ||||||||||||||||||
|
|
|
|
|
|
|
|
|
|
|
|
|
|||||||||||||
| Total |
257 | 257 | 257 | 72 | 72 | 72 | ||||||||||||||||||
|
|
|
|
|
|
|
|
|
|
|
|
|
|||||||||||||
| (1) | Composition of the Chamber of Deputies as of December 10 of each year specified, the date on which the deputies elected during such year took office. |
| (2) | Composition of the Senate as of December 10 of each year specified. |
| (3) | In the 2021 elections, the Frente Renovador began to form part of the Bloque Frente de Todos. In the 2023 elections, the bloc participated as Unión por la Patria. |
| (4) | Includes UCR, PRO and other registered parties, including those represented by one legislator each, and certain local political parties of the provinces. |
Source: Senate and Chamber of Deputies of Argentina.
The next simultaneous and mandatory primary elections and the national presidential and congressional elections are scheduled for October 2027.
Foreign Affairs and International Organizations
Argentina maintains diplomatic relations with a variety of countries and is a member of several international organizations. Argentina is a charter member of the United Nations, a founding member of the Organization of American States (“OAS”), and a member of the following international organizations, among others:
| | the International Monetary Fund; |
| | the World Bank Group; |
| | the International Finance Corporation; |
| | the IADB; |
| | the CAF; |
| | the FONPLATA; |
| | the Central American Bank for Economic Integration; |
| | the International Fund for Agricultural Development; |
| | the WTO; |
| | the International Labor Organization; |
| | the Financial Action Task Force and the GAFISUD; |
| | the International Association of Insurance Supervisors; |
| | the International Organization of Securities Commissions; |
| | the World Customs Organization; and |
| | the ALADI. |
G-20
Argentina has been a member of the G-20, an informal forum that promotes discussion between developed and emerging-market countries on key issues related to the global economy, since it was established in 1999. The G-20 is a key forum for international economic cooperation among its members.
D-25
Bilateral Investment Treaties (“BITs”)
Argentina is a party to 49 BITs currently in force and to a trade agreement with Chile, which includes an investment chapter with an investor-state dispute settlement mechanism. Following the 2001/2002 crisis and the underlying measures adopted by the Government to address the crisis, several arbitration proceedings have been brought by investors against Argentina before the International Centre for Settlement of Investment Disputes (“ICSID”), in accordance with ICSID Arbitration Rules and UNCITRAL Rules, and before the Permanent Court of Arbitration, under various BITs. As of the date of this Annual Report, most of these cases had either been decided or settled. See “Public Sector Debt—Legal Proceedings—ICSID Arbitration” and “—Other Arbitration.”
The Financial Stability Board
The Financial Stability Board (“FSB”) is an international body that monitors and makes recommendations about the global financial system. The FSB seeks to strengthen financial systems and increase the stability of international financial markets; it does so by coordinating with its members’ national financial authorities and international standard-setting bodies as they work toward developing strong regulatory, supervisory and other financial sector policies to promote international financial stability. The FSB aims to foster a level playing field by encouraging consistent implementation of these policies across sectors and jurisdictions. Argentina has been a member of the FSB since its creation in 2009, represented by the Central Bank.
G-24
Argentina has been a member of the Group of Twenty-Four since the Intergovernmental Group of Twenty-Four on International Monetary Affairs and Development (G-24) was established in 1971. The purpose of the group is to coordinate the position of developing countries on monetary and development issues, particularly issues on the agendas of the IMF Committee and the Development Committee, and to ensure increased representation and participation of developing countries in negotiations on international monetary system reform.
NATO
On April 18, 2024, the Republic formally requested to join the North Atlantic Treaty Organization (“NATO”) as a global partner. If granted, this status would provide the Republic with enhanced political and security cooperation with NATO members and access to NATO’s expertise in areas such as defense capacity, training and education, without requiring that the Republic participates in collective military actions.
MERCOSUR
Argentina is a founding member of the Southern Common Market (“MERCOSUR”), established in March 1991 with Brazil, Paraguay and Uruguay as full members or the “Member States” under the Asunción Treaty. In July 2012, Argentina, Brazil and Uruguay admitted the Republic of Venezuela as a full member of MERCOSUR, and in December 2013, Paraguay acknowledged Venezuela’s status as a full member. On December 2, 2016, Venezuela’s status as a full member was temporarily suspended by the other Member States, after it was considered to have failed to implement MERCOSUR regulations in the established four-year period, in accordance with the undertakings assumed in 2012 in connection with its admission to MERCOSUR. On August 5, 2017, the founding members suspended Venezuela in furtherance of MERCOSUR’s democratic clause (Ushuaia Protocol). On August 7, 2024, the Protocol of Accession of Bolivia to MERCOSUR became effective, making it a “member State” and providing the country with a four-year period to gradually adopt MERCOSUR’s regulations. Bolivia’s participation in the institutional structure of MERCOSUR will be gradual, following the principle of equal rights and obligations. Chile, Colombia, Ecuador, Guyana, Panama, Peru and Suriname are “Associate States” of MERCOSUR.
Under the Asunción Treaty, the founding members of MERCOSUR pledged:
| (1) | to establish a common market with free movement of goods, services and factors of production by eliminating or significantly reducing, in some cases over a period of years, import duties, tariffs and other barriers to trade among members; |
| (2) | to establish common external tariffs for trade with non-members, and |
| (3) | to adopt a common trade policy towards third countries and blocs. |
With the aim of transforming the region into a customs union, in December 1994, the founding members of MERCOSUR agreed to implement a common external tariff (“CET”). The CET regime took effect on January 1, 1995 and consists of 17 tariff levels as of the date of this Annual Report. In 2022, the structure and categories of the CET were updated. However, through special import regimes such as the National List of Exceptions (“NLE”) and the regimes for capital goods (“BK”) and information technology and telecommunications goods (“BIT”), each Member State may temporarily exclude certain products from the CET and apply differentiated tariff levels. In 2021, the NLE, BK and BIT regimes were extended until 2030. On July 20, 2022, MERCOSUR members agreed to reduce the CET for certain goods by 10%.
D-26
MERCOSUR Member States have not yet fully harmonized technical regulations as well as national trade regimes in order to advance in a policy of no border controls.
MERCOSUR has created regional bodies and institutions that aim to further develop the integration process between its members, encompassing several areas, such as energy, transport, communications, education, health, social development, justice, security, science and technology. MERCOSUR residents also benefit from special residency and work permit regimes within the territory of members of the bloc and associated states.
In December 2019, MERCOSUR members entered into a “Trade Facilitation Agreement” to streamline and simplify intra-regional trade and level the playing field conditions regarding products originating outside of MERCOSUR. Brazil ratified the agreement in October 2024, followed by Argentina in December 2025. As of the date of this Annual Report, Paraguay and Uruguay had not yet ratified the agreement. The agreement is currently in force between Argentina and Brazil.
In June 2023, MERCOSUR Member States approved a new MERCOSUR Rules of Origin Regime (“ROM”), which entered into force in July 2024. The new regime modernized and simplified the rules applicable to intra-MERCOSUR trade by updating origin requirements and allowing exporters and producers to issue declarations of origin.
In 2025, MERCOSUR Member States agreed to authorize an increase of up to 50 additional tariff lines per member under the NLE to the common external tariff. The measure subsequently entered into force in October 2026. This initiative seeks to provide temporary flexibility to address productive asymmetries and input shortages while the review of the CET remains ongoing.
During the reporting period, MERCOSUR Member States also advanced several initiatives aimed at strengthening economic integration within the bloc, including updated commitments and disciplines on trade in services, the implementation of the MERCOSUR Protocol on Government Procurement, and measures to facilitate and modernize intra-regional trade.
On December 7, 2023, MERCOSUR and Singapore signed a free trade agreement. As of the date of this Annual Report, the agreement had been approved by Congress and was undergoing the procedures required for its entry into force. On December 6, 2024, (i) MERCOSUR concluded negotiations for an association agreement with the European Union, including a free trade area and commitments in political dialogue and cooperation and (ii) MERCOSUR and Panama signed an economic partnership agreement. The MERCOSUR-European Union agreements were signed on January 17, 2026, and the Interim Trade Agreement has been provisionally applied since May 1, 2026. The implementation process of the agreement is already well advanced. The first meetings of the Committee and the Trade Council are expected to take place in November and December 2026, respectively. On September 16, 2025, MERCOSUR signed a comprehensive free trade agreement with the EFTA States which, as of the date of this Annual Report, was undergoing the procedures required for parliamentary approval in Argentina.
As of the date of this Annual Report, Argentina is engaged in active trade negotiations with Canada and the United Arab Emirates, and has launched negotiations for a Preferential Trade Agreement with Vietnam. MERCOSUR and India are also pursuing a process aimed at deepening the existing preferential trade agreement. In addition, MERCOSUR and El Salvador have agreed on terms of reference for the negotiation of a trade agreement, with the first negotiating round yet to be scheduled. Further, MERCOSUR and Japan are working on the terms of reference for a Free Trade Agreement.
For recent information on MERCOSUR, see “Recent Developments—Foreign Affairs and International Organizations—MERCOSUR.”
BRIC’s Bloc
On June 1, 2023, the President of the New Development Bank formally informed the Minister of Economy that the BRIC’s Board is willing to evaluate the integration of several countries as new members, including Argentina. In August 2023, the BRIC’s Board agreed to invite Argentina to join the bloc. In December 2023, the Government formally informed that, at this instance, the incorporation of the Republic as a full member of the BRIC block as of January 1, 2024, was not considered appropriate.
Asian Infrastructure Investment Bank
In June 2017, Argentina applied to become a member of the Asian Infrastructure Investment Bank (“AIIB”), which has as its purpose financing energy, transport and telecommunications projects involving its members. The subscription of Asian Infrastructure Investment Bank’s shares was approved by Congress in November 2020 and Argentina was admitted as a non-regional member on March 30, 2021. As of the date of this Annual Report, Argentina was not negotiating any financing projects as an AIIB member.
D-27
United States Military Financing
On April 18, 2024, the U.S. Government announced a U.S.$40 million foreign military financing grant to Argentina, aimed at enabling key U.S. allies to purchase U.S. weaponry and supporting the Republic in equipping and modernizing its military forces, through the purchase of F-16 supersonic fighter jets.
United States – Agreement on Reciprocal Trade and Investment
On February 5, 2026, Argentina and the United States signed the Reciprocal Trade and Investment Agreement, which had been announced on November 13, 2025.
Pursuant to the Reciprocal Trade and Investment Agreement (i) the United States will eliminate tariffs on 1,675 Argentine products across a wide range of productive sectors, and (ii) the Republic will eliminate tariffs on 221 tariff lines (covering items such as machinery, transport equipment, medical devices, and chemical products), reduce tariffs to 2% on another 20 lines (primarily auto parts), and grant quotas for vehicles, meat, and other agricultural products.
This agreement incorporates provisions for investment financing, non-tariff barriers, digital trade and technology, rules of origin, labor, environment, intellectual property, among others.
As of the date of this Annual Report, the agreement awaited submission to Congress for its corresponding treatment.
United States—Framework Agreement on Critical Minerals
On February 4, 2026, Argentina and the United States signed a framework agreement to ensure the security and resilience of critical minerals supply chains. The agreement establishes a partnership aimed at accelerating the development of secure, diversified, and resilient supply chains that are essential to technological innovation, industrial competitiveness, and national defense.
Agreements with China
In February 2022, the Republic and China entered into a memorandum of understanding within the framework of the Silk Road Economic Belt and the 21st Century Maritime Silk Road Initiative. The Belt and Road Initiative aims to boost cooperation and connectivity between countries through both land and oceanic routes. The initiative seeks to develop a platform to stimulate trade and investment, market integration and economic cooperation between regions. In the medium term, this memorandum intends to boost bilateral trade in goods and services, and increase investments for the productive sector and for the development of technological capabilities.
In addition to the memorandum on the Silk Belt and Road Initiative, the Republic and China entered into thirteen different inter-institutional cooperation documents relating to different matters, including green development, digital economy, space development, technology and innovation, education and university cooperation, agriculture, earth sciences, public media and nuclear energy.
In June 2023, the “Cooperation Plan for the joint promotion of the Silk Road Economic Belt and the 21st Century Maritime Silk Road” was signed. In October 2023, the Republic and China entered into a Memorandum of Understanding for the Establishment of a Working Group for the Joint Promotion of the Belt and Road Initiative and the implementation of the Cooperation Plan.
Pursuant to the memorandum, the financing for strategic infrastructure projects in Argentina will consist of two tranches: one for projects agreed upon during the fifth meeting of the Strategic Dialogue for Economic Cooperation and Coordination (DECCE) held in January 2022, which has already been approved and a second tranche for projects included in the List of Priority Projects and Tasks of the Belt and Road Initiative Cooperation Plan, signed on June 2, 2023.
On November 26, 2024, the “Agreement between the Argentine Republic and the People’s Republic of China for the Elimination of Double Taxation with Respect to Income and Wealth Taxes and the Prevention of Tax Evasion and Avoidance and its Protocol,” signed in Buenos Aires on December 2, 2018, entered into force.
D-28
The Question of the Malvinas Islands
After taking office in December 2023, the Milei administration reaffirmed Argentina’s constitutional mandate for the recovery of the full exercise of sovereignty over the Malvinas, South Georgias and South Sandwich Islands and the surrounding maritime areas by peaceful means and respecting the way of life of the islands’ inhabitants.
The Republic reaffirms its legitimate sovereignty rights over the Malvinas, South Georgias and South Sandwich Islands and the surrounding maritime areas, which are an integral part of its national territory and are under illegitimate British occupation since 1833.
The United Nations has recognized the existence of a sovereignty dispute between the Republic and the United Kingdom of Great Britain and Northern Ireland regarding the “Question of the Malvinas Islands” through General Assembly resolution 2065 (XX) and subsequent resolutions, which call upon both parties to solve the dispute through direct negotiations in order to reach a peaceful solution to the problem. The Question of the Malvinas Islands has been defined by the UN as a special and particular colonial situation which differs from most others, where the principle of self-determination does not apply nor has ever been recognized to be applicable by any of the UN resolutions on the matter. Furthermore, many regional and international organizations have reiterated the importance of Argentina and the United Kingdom complying with the provisions of Resolution 31/49 of the General Assembly, which reiterates its requests to the Governments of Argentina and the United Kingdom of Great Britain and Northern Ireland to expedite the negotiations concerning the dispute over sovereignty and calls upon both parties to refrain from taking decisions that would imply introducing unilateral modifications into the situation while the negotiation process is pending.
The Republic has shown a constructive stance and willingness to achieve, through negotiations, a peaceful and definitive solution to this anachronistic colonial situation. As of the date of this Annual Report, the United Kingdom had not accepted to resume negotiations towards a peaceful resolution of the sovereignty dispute over the Malvinas, South Georgias and South Sandwich Islands, and the surrounding maritime areas.
Continental Shelf
On April 21, 2009, the Republic submitted the outer limit of its continental shelf to the United Nations Commission on the Limits of the Continental Shelf (CLCS), a technical body created by the United Nations Convention on the Law of the Sea (UNCLOS), based in New York.
Argentina conducted in-depth and thorough scientific and technical tasks, which allowed it to determine the outer limit of its continental shelf. This work provides certainty about the geographical extent of its sovereign rights over the resources in the seabed and subsoil along more than 1,785,000 km2 of Argentine continental shelf beyond 200 nautical miles, which are added to the approximately 4,898,000 km2 located between the baselines and 200 nautical miles.
On March 11, 2016 and on March 17, 2017, the CLCS adopted by consensus the recommendations on the Argentine submission regarding the outer limit of its continental shelf. In compliance with the provisions of Annex I of the Rules of Procedure of the CLCS, the Republic reported the existence of a sovereignty dispute over the Malvinas, South Georgias and South Sandwich Islands, and the surrounding maritime areas. Consequently, the CLCS –in accordance with Annex I of its Rules of Procedure– decided to defer its consideration of the outer limit of the continental shelf in that area. The CLCS has also decided to defer its consideration of the continental shelf within the sector governed by the Antarctic Treaty regime. By deferring its consideration on the area surrounding the Malvinas, South Georgias and South Sandwich Islands, the Commission acknowledged the existence of a sovereignty dispute between Argentina and the United Kingdom.
On August 4, 2020, Congress unanimously enacted legislation delimiting the outer limit of the Argentine continental shelf on the basis of the recommendations of the CLCS and on the basis of the Republic’s submission before the CLCS.
D-29
THE ARGENTINE ECONOMY
Background and Recent Economic History
Background
In the late 1800s and early 1900s, Argentina enjoyed a period of great prosperity, with per capita GDP rising to the level of many Western European countries. During this period of growth, Argentina’s economy relied heavily on sustained international demand for its agricultural commodity exports.
The onset of the Great Depression and World War II, however, brought dramatic changes in the Argentine economy as a decline in world trade deprived the country of its main source of revenue. The Government responded to these developments with a major shift in economic policy, adopting a model of state-led capitalism and import-substitution, and increasing state intervention in the economy.
Beginning in the 1940s, the Government nationalized many basic industries and services and raised import barriers in a bid to make Argentina self-sufficient in industry and agriculture and to shelter its economy from foreign competition. Government involvement in sectors ranging from oil and electricity to telecommunications and financial services became significant.
Although in the 1950s a new era of worldwide prosperity began, the Government’s role in the economy remained significant and Argentina experienced relatively low growth in comparison with other developing countries.
While manufacturing had become the largest component of the economy by the mid-1970s, the country’s exports continued to be dominated by agricultural products. During this period, the Argentine economy grew continuously at substandard levels.
In 1976, the de facto Government began to shift away from the import-substitution model, lowering import barriers and liberalizing restrictions on foreign borrowings. The adoption of a crawling-peg exchange rate regime by the Central Bank induced appreciation of the peso and incurrence of external indebtedness by the public and private sectors between 1977 and 1981.
From 1981 through 1990, economic growth was undermined by political instability, large subsidies of state-owned enterprises, high inflation, periodic depreciations of the currency, an inefficient tax collection system, and inefficient production. The average annual real GDP contraction for this period was 0.7%. The Government financed its fiscal deficits during this period primarily through Central Bank credit and loans from foreign bilateral and multilateral creditors. The increase in Central Bank credit to the Government resulted in unchecked increases in the money supply that led to high levels of inflation. From 1981 through 1990, average annual inflation was 876.0%. Additionally, in 1982 the Government defaulted on its external debt.
During the 1980s, the Government adopted several economic plans in an effort to stabilize the economy. While these plans achieved some initial success, they ultimately failed to increase productivity and competitiveness in the economy. These factors, combined with high levels of inflation, frequent changes in Government policy and financial market instability, prevented the Argentine economy from achieving real growth.
Liberalization of the Economy. In mid-1989, the second democratically elected government since the restoration of democracy in 1983, led by President Menem, inherited an economy suffering from hyperinflation and in deep recession. Relations with external creditors were strained, commercial bank debts had been subjected to two restructurings and were again accumulating past-due interest, IMF and World Bank programs had lapsed and payments to the World Bank and the IADB were frequently late. The immediate objectives of the Menem administration were to stabilize prices and improve relations with external creditors.
Following several unsuccessful efforts to stabilize the economy and end hyperinflation, the Menem administration adopted an economic program that sought to liberalize the economy and impose monetary discipline. The new economic program, which came to be known as the Convertibility Regime, was anchored on the Convertibility Law of 1991 and related measures. Its principal features were the following:
| | a fixed exchange rate regime that pegged the peso to the U.S. dollar and tied the monetary base to international reserves, limiting the Central Bank’s monetary policy tools; |
| | privatization, deregulation and trade liberalization programs; and |
| | the improvement of relations with external creditors (including by refinancing a substantial portion of the Government’s debt with private creditors through the Brady restructuring in 1992). |
The Convertibility Regime and the Government’s free-market initiatives temporarily achieved price stability, increased the efficiency and productivity of the Argentine economy and attracted significant foreign investment. Real GDP grew 9.1% in 1991 and 7.9% in 1992. From 1993 through 1998, real GDP grew at an average annual rate of 4.8%, despite a 2.8% contraction in 1995 largely attributable to the capital flight triggered by the Mexican financial crisis of 1994.
D-30
The Convertibility Regime, however, had significant shortcomings, including the following:
| | Inflexible monetary policy. By stripping the Central Bank of its monetary discretion, the Convertibility Regime limited the use of monetary policy to stimulate the economy in response to downturns in economic activity. |
| | Dependence on foreign capital. Any sharp reduction of foreign capital inflows, often triggered by factors beyond the Government’s control, threatened untimely contractions of the money supply. Argentina’s dependence on foreign capital was heightened by the opening of the Argentine economy to foreign trade, which resulted in significant trade deficits, and by the Government’s recurring fiscal deficits, which were heavily financed with foreign capital. |
| | Vulnerability to external shocks. The dependence on foreign capital, coupled with the lifting of state controls on capital flows, made the Argentine economy vulnerable to external shocks. |
| | Over-reliance on certain economic sectors. As a result of the real appreciation of the peso and the peso’s peg to the U.S. dollar, economic growth during this period was driven by the services sector, and in particular the financial and public services sectors, with production-based manufacturing and industrial sectors lagging behind. In addition, any contribution from the agricultural sector from increased volume of production was offset by declining international commodity prices. |
| | Rising unemployment. Despite economic growth, the relative slow growth in labor intensive sectors such as construction and manufacturing increased unemployment levels. |
The shortcomings of the Convertibility Regime became evident during the economic downturn triggered by the Mexican financial crisis of 1994. The collapse of Mexico’s crawling-peg exchange rate undermined investors’ confidence in emerging markets and raised doubts about the sustainability of the Convertibility Regime. This loss of confidence triggered a sharp reduction in net capital inflows, which turned into net capital outflows in 1995, causing a liquidity crisis in the Argentine banking system. As a result, Argentina experienced its first economic contraction since the Convertibility Regime had been implemented.
Following the Mexican crisis, Argentina’s economy resumed the levels of growth it had recorded in the first half of the 1990s. From 1996 through 1998, GDP increased at an annual average rate of 5.8%. However, the Government relied heavily on borrowings, first from external sources and ultimately from the local banking system and the newly-organized private pension funds, to finance the deficit. Beginning in the last quarter of 1997, external factors, including regional financial crises in Asia and Russia, rising U.S. interest rates and falling commodity prices, caused the capital flows to turn negative, economic activity to decline sharply, ultimately precipitating the economic crisis of 2001.
The Crisis and Beginning of Recovery: 2001 and 2002
During the last six months of 2001, the growing perception that a devaluation of the peso was imminent triggered a massive run on bank deposits and a significant acceleration of capital flight from the Argentine economy. Total deposits in the Argentine banking system fell by 20.3% in the last six months of 2001 and the Central Bank’s international reserves fell by 42.1% in the same period.
In a last bid to safeguard the Convertibility Regime and avert the collapse of the banking sector, in December 2001, the Government imposed strict per-person, per-month limits on bank withdrawals (known as the corralito), effectively limiting the ability of depositors to withdraw approximately U.S.$60 billion in peso and dollar demand deposits from the financial system. It also imposed strict foreign exchange restrictions in Argentina. Shortly thereafter, the Government announced that it would defer interest and principal payments on a substantial portion of the Government’s debt.
Massive social unrest led to the early resignation of President de la Rúa’s administration and triggered a political crisis that culminated with the designation of Mr. Eduardo Duhalde as president in January 2002. Congress passed the Public Emergency and Reform Law of 2002 (the “Public Emergency Law”) which formally terminated the parity between the peso and the U.S. dollar and brought the Convertibility Regime to an end. Through the enactment of the Public Emergency Law and a series of decrees, the Duhalde administration took the following measures:
| | ratified the suspension of payments of Argentina’s sovereign debt except for debt with multilateral credit agencies; |
| | eliminated the dual exchange rate system adopted immediately following the end of the Convertibility Regime and replaced it with a single exchange rate that allowed the value of the peso to float against other currencies, resulting in a 240.1% increase in the U.S. dollar-peso exchange rate in 2002; |
D-31
| | ordered the “asymmetric” conversion into pesos (known as “pesification”) of certain U.S. dollar-denominated assets and liabilities at the following exchange rates: Ps.1.00 per U.S.$1.00 for private sector debt (individual and corporate U.S. dollar-denominated debt) with financial institutions and other creditors, Ps.1.40 per U.S.$1.00 for all U.S. dollar-denominated public sector debt instruments in the portfolios of national and provincial financial institutions’ portfolios and Ps.1.40 per U.S.$1.00 for all U.S. dollar-denominated bank deposits; |
| | amended the charter of the Central Bank to allow it to print currency, make certain short-term advances to the Government and act as a lender of last resort to financial institutions experiencing liquidity difficulties; and |
| | imposed further restrictions on bank withdrawals until December 2002, which effectively froze all term deposits and subjected them to mandatory restructuring. |
Additionally, further restrictions on foreign exchange transactions were introduced in 2002, including:
| | limits on the amount of U.S. dollars that could be withdrawn per month from bank accounts; |
| | limits on transfers of foreign currency outside of Argentina; and |
| | restrictions on foreign trade transactions. |
The economic crisis peaked during the first six months of 2002. During this period, economic activity collapsed with the largest contraction in the level of economic activity in Argentine history, fiscal revenues fell, inflation rose significantly and the financial system’s liquidity crisis worsened. In addition to the controls over the foreign exchange market, the Government imposed mandatory repatriation of export proceeds. Strict foreign exchange controls, together with a significant surplus in the country’s trade balance, ensured a supply of foreign currency to the market and resulted in the appreciation of the peso in the second half of the year.
By the middle of 2002, the policy of combining the sale of international reserves with the tightening of controls over the foreign exchange market and capital movements succeeded in stabilizing the peso. As the domestic currency stabilized, inflationary pressures declined. This, combined with the expansion of the monetary base, permitted a gradual stabilization of interest rates, which had sharply increased following the end of the Convertibility Regime.
During the last six months of 2002, real GDP contraction had slowed to 6.7%, as compared to the last six months of 2001, and Argentina recorded a U.S.$5.0 billion surplus in its current account. As of December 31, 2002:
| | the peso had appreciated to Ps.3.36 per dollar, compared to a low of Ps.3.87 on June 26, 2002; |
| | inflation, as measured by INDEC, was 8.0% for the six month period ended December 31, 2002, compared to 30.5% for the six-month period ended June 30, 2002. In 2002, inflation, as measured by INDEC was 40.9% and as measured by the WPI was 118.0%, compared to the more than 240.1% loss in the value of the peso when compared to the U.S. dollar during that year; and |
| | the Central Bank’s international reserves had increased to U.S.$10.5 billion, from U.S.$9.6 billion on June 30, 2002. |
Despite the improvement in economic conditions during the last six months of 2002, overall GDP declined 10.9% for the year compared to 2001.
To prevent the continued appreciation of the peso, the Central Bank eased certain of the foreign exchange restrictions imposed between November 2002 and January 2003. The improved economic conditions, in particular the reduction in capital flight from the Argentine economy, also allowed the Government to begin lifting restrictions on bank withdrawals in November 2002.
By the end of 2002, the economy seemed to have bottomed out from the crisis and the recession that began in 1998. However, the recovery was set against extremely depressed levels of economic activity, similar to those of the early 1990s. In addition, the recovery was the result of a set of economic policies aimed mainly at managing the crisis, but failed to include structural reforms needed to generate sustainable long-term economic growth. In December 2002, poverty levels stood at 42.3% of the households and 54.3% of the population.
2003-2007
The economic recovery that began in the last six months of 2002 continued during 2003, with GDP growing by 8.8% in 2003. This improvement was primarily a result of a growth in demand for Argentine exports, increased domestic production spurred by improved consumer and investor confidence and the substitution of imported products with domestic products. During 2003, quasi-currencies (treasury bonds issued by the Argentine provinces during the economic crisis) were withdrawn from circulation and restrictions on bank deposits were lifted. In the same year, renewed confidence in the financial system was evidenced by a 24.0% increase in nominal terms in total bank deposits.
D-32
During this period, the Government anchored it policies on three pillars:
| | the gradual recovery of real wages; |
| | the use of fiscal policy to enhance the growth of domestic markets and domestic consumption and promote wealth distribution taking advantage of the rising export commodity prices; and |
| | the use of multiple exchange rates and pricing regulations to redirect extraordinary export revenues with a view to developing local industrial capacity. |
As a result of the combination of policies, the Argentine economy grew continuously in 2004, 2005, 2006 and 2007 at rates of 9.0% (representing the rate of change from 2003 to 2004, calculated using data published by INDEC prior to June 29, 2016), 8.9%, 8.1% and 9.0%, respectively. During this period, the gross international reserves of the Central Bank increased to U.S.$46.2 billion as of December 31, 2007, compared to U.S.$14.1 billion as of December 31, 2003. The Kirchner administration’s fiscal and trade policies generated a fiscal surplus (mainly through an increase in tax collections contributed by a tax on exports) as well as a trade surplus. Inflationary pressures increased in 2007 and through mid-2008 as a result of growing demand and continued supply constraints.
2008-2015
Commencing in 2008, the Government continued, and over time expanded, the economic policies initiated after the 2001 crisis, including fiscal and monetary policies aimed at maintaining economic growth rates, as well as price controls, tariff limits, subsidies and export taxes.
The strong economic rebound experienced by Argentina between 2003 and 2007 began to fade during the first half of 2008. In March 2008, the introduction of additional variable export taxes on agricultural products intended to be assessed on gains generated by increases in international prices of certain export commodities sparked a five-month conflict with farmers that brought important sectors of the economy in certain regions of the country to a standstill. Argentina experienced episodes of bank deposit withdrawals and capital outflows in 2008. The Central Bank raised interest rates to limit capital outflows from Argentina just as the economic downturn set in, which, in turn, exacerbated the downturn in the economy. By the third quarter of 2008, the Argentine economy began to experience a downturn that was aggravated by the escalation of the global financial crisis. In November 2008, Congress approved a law reforming the private pension system in Argentina, under which the assets held by private pension funds, including equity interests in a wide range of listed companies, were transferred to a separate fund as part of a new public system administered by ANSES. Among other policy objectives, the measure sought to direct domestic savings to the financing of domestic economic activity and investment, as an alternative to international markets during a critical period.
Argentina’s economy, like that of many other countries, was affected by the global financial crisis. Real GDP contracted by 10% between the fourth quarter of 2008 and the first quarter of 2009. By mid-2009, public finances had rapidly deteriorated, with public expenditures growing at double the pace of revenue during the first half of the year as the Government sought to limit the effects of the recession. Although economic activity began to recover during the fourth quarter of 2009 due, in large part, to growth in industrial activity, public finances continued to weaken. Extraordinary revenue, including social security contributions and public transfers from government agencies such as the Central Bank and ANSES, played a key role in supporting the 19% rise in total public sector revenue in 2009, with resources channeled to the extension of two anti-poverty programs—a family allowance for formal sector workers earning less than a monthly threshold and income support for informal sector workers and the unemployed, among other measures. In late 2009, the Government decreed that certain foreign reserves held by the Central Bank would be made available for external debt payments.
Inflationary pressures rose in early 2010, and the Central Bank provided financing to the Government to cover a portion of the fiscal deficit. At the same time, the economy began to show signs of recovery, as industrial output increased. The Argentine economy grew by 10.1% in 2010, reaching the highest growth level since 2005. In contrast, the current account deteriorated during 2010, with the current-account surplus falling from U.S.$8.2 billion in 2009 to a deficit of U.S.$1.5 billion in 2010, as the trade surplus, a key source of foreign currency, narrowed by more than 20% in 2010.
In June 2010, the Government conducted the 2010 Debt Exchange to restructure Untendered Debt, with an acceptance rate of 81%. Although approximately 92% of Argentina’s debt defaulted in 2001 was restructured through the 2005 and 2010 Debt Exchanges, an aggregate principal amount of approximately U.S.$6.1 billion of Untendered Debt remained outstanding following these debt restructuring initiatives and litigation with the holdout creditors continued.
Starting in 2011, Argentina’s economy evidenced structural constraints adversely affecting its balance of payments. The demands for imported parts by the automobile industry and the electronic products industry in Tierra del Fuego, increasing demand for imported capital goods, the need to service foreign debt, and continued remittances by residents to non-residents strained the Central Bank’s international reserves. In addition, the growing economy encountered energy supply constraints, which were result of under-investment by the oil and gas industry and lead to Government-arranged imports of energy to avoid a deceleration of economic activity. A decision was made to recover the initiative in a vital sector of the economy which lead to the approval by Congress, in May 2012, of the administration’s bill to expropriate 51% of the shares of the country’s largest oil company, YPF S.A. (“YPF”), which was majority-owned by Spain’s Repsol S.A. (“Repsol”). Between 2008 and 2011, subsidies to the energy and transport sectors had increased by 156%, while the energy foreign trade deficit grew.
D-33
The Central Bank continued its expansionary monetary policy in 2011, particularly through its purchases of foreign currency and lending to the Treasury. The Central Bank additionally continued its sterilization efforts to support the peso through the issuance of Central Bank notes (Lebacs and Nobacs). The public sector recorded a deficit of Ps.30.7 billion in 2011 (1.4% of GDP) compared to a public-sector surplus of Ps.3.1 billion in 2010 (0.2% of GDP).
The Government introduced a series of capital and foreign-exchange controls during the fourth quarter of 2011 intended to reduce capital outflows. During the 12-month period ending in December 2011, capital outflows were estimated to have reached U.S.$25 billion, or nearly half of the Central Bank’s foreign reserves at the beginning of the year. As a result, demand for U.S. dollars increased, leading to an increase in the gap between the official and unofficial exchange rates.
Argentina also began to experience energy shortages in 2011, following years of limited investment in the energy sector, as well as the electricity and natural gas tariff-freeze maintained since 2002 as part of the Government’s emergency measures.
In April 2012, the Government announced an amendment to the Central Bank’s charter, which increased its discretion in policymaking and provided the Government with additional tools to intervene in the financial system, including in pursuit of its new aim of promoting economic growth with social equity.
In mid-2012, restrictions on the purchase of foreign currency were introduced. The Government’s attempts to shore up foreign reserves were primarily driven by its dual goals of accumulating U.S. dollars to service its external debt obligations and maintaining a buffer to avoid a currency run in the event of a deterioration of global market conditions or sharp slowdown of domestic economic activity.
There was a marked deceleration of economic activity in 2012, as real GDP contracted by 1.0%, compared to an expansion of 6.0% in 2011. During 2012, the primary fiscal balance fell sharply to a deficit of Ps.4.4 billion –the first deficit since 1996– from a surplus of Ps.4.9 billion in 2011, as expansionary fiscal policies that relied in part on Central Bank financing failed to prevent an economic slowdown and a decrease in tax revenue growth. The overall fiscal deficit represented an estimated 2.1% of GDP in 2012.
In June 2013, the Government announced an increase in social transfers through two programs providing child allowances to households based on certain income thresholds. In an ongoing attempt to stem inflation, in June 2013, the Government announced price freezes that covered approximately 500 products (including food, beverages, cleaning products and toiletries) for an initial three-month period, which was subsequently extended through a series of price freezes into 2014. The economy recovered growth in 2013, as real GDP grew 2.4% compared to the previous year.
In January 2014, the Central Bank allowed the peso to lose 8.2% of its value compared to the U.S. dollar in one day—the largest correction to occur in a single day since the 2001-2002 crisis– as international reserves fell below U.S.$30 billion. Shortly thereafter, the Government announced an easing of certain foreign-exchange controls. In an effort to tame inflation, the Government also launched the Precios Cuidados program in January 2014, which established price controls on a broad range of basic household and other products.
The Government took steps to regain access to the international financial market, including the negotiation of an agreement with the Paris Club (concluded in May 2016) and settlements with foreign investors that had obtained arbitral awards following the measures adopted during 2001/2002 economic crisis and the settlement with Repsol. These initiatives were not sufficient. In June 2014, an order of the New York District Court in the on-going litigation with hold out creditors of pre-2001 bonds prevented the Government from making payments to holders of certain of its bonds issued pursuant to the 2005 and 2010 Debt Exchanges (the “2005 and 2010 Exchange Bonds”) under New York law. This event prevented Argentina from regaining access to the international capital markets, thereby increasing the risk of a balance-of-payment crisis.
A trend in declining industrial output that began in the third quarter of 2013 continued through 2014, as the country’s manufacturing, mining and utilities sectors faced an erosion of consumer and business confidence, social unrest, continued high inflation, increased pressure on the currency, and waning demand from Argentina’s biggest export market, Brazil. In 2014, total expenditure growth outpaced revenue growth, primarily as a result of an increase in the Government’s social benefit and pension payments. As a result, the overall fiscal deficit rose to Ps.109.7 billion, representing a 70% increase compared to 2013. In total, primary spending rose by 41.8%, with transfers to the private sector, particularly in the form of energy subsidies and social aid, driving this expansion. Real GDP contracted by 2.5% in 2014.
D-34
With global capital markets closed to Argentina, a trade surplus fueled by high international commodity prices remained the main source of foreign currency reserves for the Central Bank for over a decade. However, exports were undermined in 2014 by a decrease in external competitiveness, falling commodity prices and an economic slowdown in Brazil, Argentina’s primary market for manufactured exports. In total, export earnings fell by 10% in 2014, and the trade surplus narrowed to U.S.$6.0 billion. Capital inflows during 2014, including through currency swap agreements entered into by the Central Bank with the People’s Bank of China, increased international reserves.
Continued growth in public sector spending contributed to a modest recovery of the Argentine economy beginning in the first quarter of 2015. Despite a deceleration of inflation, monetary expansion accelerated in the first half of 2015. During 2015, the monetary supply rose by 30.2%, compared to a 20.5% increase in 2014. The difference between 2014 and 2015 reflected a change in the Central Bank’s sterilization policy: in 2014, the Central Bank sterilized Ps.94.6 billion and raised interest rates on Lebacs, whereas sterilization fell significantly to Ps.8.7 billion during 2015 as a decrease in the Lebac rate reduced investments by the financial system in Central Bank notes. Seeking to boost consumption, in July 2015, the minimum wage was increased by 31.4%—the first major increase since September 2014.
By mid-2015, China had become an important trading partner (as Argentina’s second-largest export destination after Brazil) and source of foreign exchange. As a result, the depreciation of the Renminbi led the Government to tighten further foreign-exchange controls in August 2015, with a view to protecting its international reserves and avoiding a currency crisis.
2015-2019
Following the change of administration in December 10, 2015, the Government sought to overcome Argentina’s fiscal and balance of payments constraints announcing and implementing economic and policy reforms intended to enhance sustainable development, ensuring macroeconomic stability through fiscal balance, increasing trade with third countries and strengthening the Central Bank. These measures included foreign trade and foreign exchange reforms, financial and fiscal policy measures, energy sector reforms, measures intended to address certain socio-economic needs and increase the productivity and competitiveness of the Argentine economy.
The 28.6% depreciation of the peso in December 2015 and the elimination of all foreign exchange controls ultimately lead to an increase in inflation, which ended 2016 with an annual rate of increase in the WPI of 36.6%, while real GDP contracted by 2.1%. During 2017, the economy recovered and real GDP grew by 2.8%. The peso remained relatively stable and inflation decreased to 24.8% (compared to a target of 17% set by the Central Bank). The increasing tension between the expressed objective of reducing inflation by tightening monetary policies and the desire to promote economic growth was resolved by the Government in favor of relaxing monetary policies and increasing the inflation target by 5% to 15% for 2018. Holders of financial instruments denominated in pesos, including a significant amount of non-resident investors, divested their holdings in favor of foreign currency assets, which were transferred overseas.
In addition, during this period, the Government reduced trade barriers by eliminating export duties on key sectors, lowering soybean export taxes from 35% to 30%, removing most industrial export duties, and abolishing import duties on computers and related products in 2017. See, however, “—Factors Affecting the Argentine Economy in 2018 and 2019 and Measures Adopted in Response.” The Government also eliminated the restrictions on access to the foreign exchange market and all foreign exchange restrictions, including certain currency controls introduced in prior years, which lead to an increase in the vulnerability in the financial account. See “—Factors Affecting the Argentine Economy in 2018 and 2019 and Measures Adopted in Response.” In September 2019, the Central Bank re-introduced restrictions on foreign currency transactions. See “Monetary System—Foreign Exchange and International Reserves—Foreign Exchange.”
During these years, the Government relied heavily on foreign financing. Between January 1, 2016 and December 31, 2018, the Government raised financing in the international market through the issuance of global bonds and a series of sale and repurchase transactions.
The Government’s main initiatives with regard to fiscal policy between 2016 and 2017 included (i) a pension reform in 2016 (see “Public Sector Finances—Social Security—Retiree Programs and Ley de Reforma Previsional (Pension Reform Law)”), (ii) a tax reform in 2017, intended to eliminate certain loopholes and inefficiencies of the Argentine tax regime, diminish evasion, increase the coverage of income tax as applied to individuals and encourage investment while sustaining Argentina’s medium- and long-term efforts aimed at restoring fiscal balance (see “Public Sector Finances—Tax Regime”) and (iii) an agreement in 2017 known as the Consenso Fiscal (the “2017 Fiscal Consensus”) with the 22 provinces and the City of Buenos Aires that included a commitment to lowering distortive taxes by 1.5% of GDP over a five year period (2018-2022), a waiver by the 23 signatories of lawsuits against the federal government and a certain compensations to the province of Buenos Aires in exchange for the elimination of the recurrent federal government contributions to the Fondo del Conurbano Bonaerense (Greater Buenos Aires Area Fund).
D-35
To alleviate the impact of adverse conditions on certain social sectors, the Government adopted various measures granting relief to the lower income segments of the population as well as programs to enhance opportunities to complete studies and gain training in a variety of fields.
In addition, during these years, the Government implemented several measures aimed at increasing the productivity, competitiveness and transparency of the Argentine economy.
Factors Affecting the Argentine Economy in 2018 and 2019 and Measures Adopted in Response
During the first five months of 2018, the Argentine economy was affected by a severe drought that led to a sharp decline in agricultural production and export revenue, while world energy prices increased and global access to financing became tighter through the appreciation of the U.S dollar and an upward shift in the U.S. yield curve. These factors negatively affected the peso, which lost 25.6% of its value vis-à-vis the U.S. dollar between January 2 and May 31, 2018, generated market concerns regarding the Central Bank’s ability to roll-over its short–term debt and resulted in a marked increase in Argentina’s sovereign risk premium. Argentina’s fiscal imbalances, its dependence on foreign revenues to cover its fiscal deficit, and rigidities that have historically limited the ability of the economy to absorb and adapt to external factors, added to the severity of the economic downturn and undermined investor confidence. Between January and June 2018, the international reserves of the Central Bank decreased by approximately U.S.$15.4 billion.
In June 2018, the Government announced a 36-month precautionary Stand-By Arrangement (the “SBA”) with the IMF and other financing agreements with multilateral organizations. See “—Agreements with the IMF.” In spite of the SBA, inflation did not abate, net international reserves continued to decrease, the current account deficit remained high and other program targets were not met. In August 2018, after the peso lost 21.3% of its value vis-à-vis the U.S. dollar over a period of 20 days, the Government requested (i) an augmentation of access under the SBA, (ii) a front-loading of access into 2018-2019 (instead of 2020-2021) and (iii) that the domestic counterpart of the access drawn under the SBA be made available to support budget needs.
In furtherance of the program agreed with the IMF, the Government announced a series of measures aimed at achieving a primary fiscal balance in 2019 and a primary fiscal surplus in 2020 and to reorganize the public administration. The measures announced included a combination of initiatives to reduce public sector expenditures and initiatives to increase public sector revenues.
The Central Bank, in turn, tightened its monetary policies by raising interest rates and decelerating monetary growth while allowing the peso to float freely within a non-intervention zone. See “—Monetary System—Monetary Policy.”
During 2019, the recession that had begun in the second quarter of 2018 continued. In 2019, GDP contracted by 2.1%. Further, the Central Bank’s gross international reserves decreased to U.S.$44.8 billion as of December 31, 2019 (a U.S.$20.9 billion decrease compared to gross international reserves as of December 31, 2018). This decrease is mainly explained by an outflow of Argentine portfolio investments held by non-residents in Argentina and the acquisition of foreign financial assets by Argentine residents, which accumulated U.S.$31.2 billion in 2019.
Notwithstanding the continued and strong contraction in economic activity, inflation accelerated during 2019, reaching 53.8% year-on-year in December 2019. In addition, poverty and extreme poverty levels increased to 35.5% and 8.0% of the population, respectively, in the second half of 2019.
Agreements with the IMF
On June 7, 2018, Argentina’s then Ministry of Economy, the Central Bank and the IMF staff reached an understanding on the terms of the SBA for disbursements totaling approximately U.S.$50 billion, which was approved by the IMF’s Executive Board on June 20, 2018. The SBA was intended to provide support to the Macri administration’s economic program. On June 22, 2018 the Government made a first drawing of approximately U.S.$15 billion under the SBA.
Following the execution of the SBA, in August 2018, Argentina faced an unexpected bout of volatility affecting emerging markets generally. On October 26, 2018, in light of the adjustments to fiscal and monetary policies announced by the Government and the Central Bank, the IMF’s Executive Board allowed the Government to draw the equivalent of U.S.$5.7 billion, bringing total disbursements since June 2018 to approximately U.S.$20.6 billion, approved an augmentation of the SBA increasing total assets to approximately U.S.$57.1 billion for the duration of the program through 2021 and the front loading of the disbursements. Under the revised SBA, IMF resources for Argentina in 2018-19 increased by U.S.$18.9 billion.
D-36
IMF disbursements for the remainder of 2018 more than doubled compared to the original IMF-supported program, to a total of U.S.$13.4 billion (in addition to the U.S.$15 billion disbursed in June 2018). The resources available in the program were not expected to be treated as precautionary and the Government’s request made in 2018 that the IMF financing be used for budget support was granted. Between January 1 and July 10, 2019, the Government drew U.S.$16.2 billion under the SBA, with the last disbursement taking place on July 2019. On September 22, 2021, Argentina repaid the first principal installment under the SBA of U.S.$1.9 billion.
On March 25, 2022, the Republic signed a 30-month Extended Fund Facility agreement (“EFF”) with the IMF for 31.9 billion SDRs (approximately U.S.$44 billion) to refinance the SBA. See “Public Sector Debt—Debt Owed to Financial Institutions—IMF.”
2020-2023
In 2020, the Government introduced a series of measures to address a public emergency in economic, financial, fiscal, administrative, pensions, tariff, energy, health and social matters. However, the Government’s efforts were laregely derailed with the outbreak of the COVID-19 pandemic.
In 2020 and 2021, Argentina adopted several measures in response to the COVID-19 pandemic aimed at preventing mass contagion and overcrowding of Argentine health service facilities, which include:
| | The imposition of nation-wide mandatory lockdown. |
| | Stronger surveillance of Argentine borders and mandatory isolation of persons with suspected or confirmed cases of COVID-19; closure of activities with high concentration of persons; school closures; and promotion of home office policies in the public and private sector, among others. |
| | The acquisition of COVID-19 vaccines. |
Simultaneously, the Government implemented several stimulus measures to mitigate the economic effects of the abovementioned measures, including measures involving direct transfers, partial payment of private sector wages, interest rate subsidies for loan lines, credit injection, guarantees for companies taking loans from the financial system and tax reductions and exemptions, among others. In 2020, the fiscal and financial package implemented by the federal non-financial public sector to mitigate the effects of the COVID-19 pandemic represented an amount equal to approximately 6.5% of GDP, of which 3/4 pertains to measures that have an impact on the Government’s finances and 1/4 is accounted for by measures related to credit lines.
Further, the Government provided additional resources to the provinces to help them mitigate the effects of COVID-19. The measures included contributions from the Treasury amounting to Ps.67.2 million in the aggregate and other transfers for Ps.53.1 million in the aggregate. In addition, financial assistance through the Fondo Fiduciario para el Desarrollo Provincial (Provincial Development Trust Fund) amounted to 0.3% of GDP, or Ps.70.3 million. As for credit injection measures, the non-financial public sector made a range of subsidized and guaranteed credit lines available for an amount equal to approximately 2.0% of GDP.
During 2021, the Government implemented several measures to protect employment, strengthen the health system, promote social inclusion and sustain the income of households and companies that were particularly affected by the second wave of the COVID-19 pandemic. The fiscal and financial package implemented in 2021 by the federal non-financial public sector to mitigate the effects of the second wave of COVID-19 pandemic represented an amount equal to approximately 1.8% of GDP (or approximately Ps.820 million) and included expenditures related to (i) the purchase of COVID-19 vaccines; (ii) contributions to lower income groups; (iii) programs aimed at assisting companies that experienced financial distress; and (iv) promoting demand for tourism services.
In 2022 and 2023, the Government focused its policies on promoting a sustainable growth of the economy, generating employment, strengthening conditions to reduce inflation and increasing minimum monthly wages. In addition, the Government introduced a series of measures aimed at increasing reserves and investments in the Republic, including (i) a special foreign exchange rate for soybean producers to liquidate soybean exports, (ii) an agreement with the automobile industry for the implementation of a mechanism whereby companies that increased exports paid zero pay export duties for the portion corresponding to the increment, (iii) a project to develop offshore gas in the coasts of the province of Tierra del Fuego, with private investments amounting to U.S.$700 million, (iv) the commencement of infrastructure projects aimed at doubling the transportation capacity of the Vaca Muerta-Bahía Blanca pipeline, including the conclusion of the construction of the Néstor Kirchner Gas Pipeline connecting the provinces of Neuquén and Buenos Aires (see “—Role of the State in the Economy—Energy Sector Reforms”), and (v) the granting of Ps.30.0 billion in credits aimed at boosting investments in SMEs that provide services in the Vaca Muerta region.
D-37
The Milei Administration
The Milei administration took office with the objectives of lowering inflation, increasing employment levels and real income, and creating a sustained improvement in the quality of life of the population.
With the objective of reducing public sector deficit, the Milei administration implemented an economic program focused on rationalizing public sector spending, prioritizing social policies, improving public safety and modernizing the public administration. The Government’s economic program is anchored on two pillars: (i) guaranteeing macroeconomic stability and reducing bureaucracy, and (ii) simplifying trade and other economic transactions. The first pillar is focused on guaranteeing financial equilibrium in the non-financial public sector and eliminating the need to finance the public sector deficits through net indebtedness or monetary issuance, and is intended to be achieved through measures aimed at permanently reducing expenditures and imposing temporary tax increases. The second pillar is focused on the implementation of measures and reforms aimed at promoting productive development through the integration of Argentina’s economy to the global markets and an increase in levels of transparency and competitiveness. In this regard, the Government implemented (i) foreign trade measures, aimed at reducing import costs, boosting exports, facilitating transactions, eliminating import permits, reducing import tariffs and taxes, and simplifying non-tariff measures and procedures; and (ii) domestic trade measures, with the objective of normalizing trade, promoting competition, protecting consumers, eliminating price and quantity controls, simplifying domestic trade, modernizing antitrust regulations, improving means of payment, promoting self-regulation, and updating standards and controls on fair trade.
The measures adopted by the Government included: (i) the reduction of subsidies in the transport and energy sectors, aimed at improving the allocation of funds to benefit vulnerable groups, (ii) a reduction in transfers to the Provinces, administrative costs, and the financing of media advertisements, (iii) a reorganization of the public administration, which entailed a reduction in the number of public ministries, a reduction in the number of public administration employees, and the elimination of transfers to state-owned enterprises, (iv) an increase in the budget for public security and defense, (v) the implementation of a new formula for updating social security payments, (vi) an increase in the transfers allocated to social programs, including the Asignación Universal por Hijo (Universal Child Allowance or “AUH”), Prestación Alimentar (Food Provision) and Plan 1.000 días (1,000 Days Plan), (vii) the elimination of certain fiduciary funds, such as the Fondo Fiduciario para el Desarrollo de la Generación Distribuida de Energías Renovables (Trust Fund for the Development of Distributed Generation of Renewable Energies), Fondo Fiduciario Nacional de Agroindustria (National Agroindustry Trust Fund), Fondo Estabilizador del Trigo Argentino (Argentine Wheat Stabilizing Fund), Fondo para la Recuperación de la Actividad Ovina (Fund for the Recovery of Sheep Activity) and Fondo de Cobertura Universal de Salud (Universal Health Coverage Fund) and (viii) the implementation of structural reforms under Law No. 27,742, which include (a) the establishment of the RIGI, aimed at providing tax and regulatory stability for 30 years, tax and customs incentives, and free availability of foreign currency for large-scale strategic projects in key sectors (such as forestry, tourism, infrastructure, mining, technology, steelmaking, energy, and hydrocarbons); and (b) the modernization and flexibilization of labor legislation, through the simplification of employee registration, the elimination of penalties for unregistered employment, the extension of the probation period, and the creation of alternative severance pay schemes upon employment termination.
Pursuant to Law No. 27,742, on July 7, 2025, the Government announced the creation of the Ente Nacional Regulador del Gas y la Electricidad (National Gas and Electricity Regulatory Agency), thereby unifying the functions of the Ente Nacional Regulador del Gas (National Gas Regulatory Authority or “ENARGAS”) and the Ente Nacional Regulador de la Electricidad (National Electricity Regulatory Authority or “ENRE”), with the objective of optimizing public resources, allowing for the elimination of duplicated structures, facilitating coordination between both energy units and modernizing the energy sector.
Gross Domestic Product
GDP is a measure of the total value of final products and services produced in a country. Nominal GDP measures the total value of final production in current prices. Real GDP measures the total value of final production in constant prices of a particular year, thus allowing historical GDP comparisons that exclude the effects of inflation. Argentina’s real GDP figures are measured in pesos and are based on constant 2004 prices, as revised in the INDEC Report. Among other adjustments, in calculating GDP for 2004, INDEC made changes to the composition of GDP that resulted in an upward adjustment of approximately 8.4% for that year. In calculating real GDP for subsequent years based on the revised GDP for 2004, INDEC used deflators that are consistent with its revised methodology to calculate inflation.
The information set forth below in this section has been derived from statistics included in the INDEC Report.
D-38
The following table sets forth the evolution of nominal GDP and per capita GDP for the periods specified, at current prices.
Evolution of Nominal GDP and Per Capita GDP
(at current prices)
| 2021 | 2022 | 2023 | 2024(3) | 2025(3) | ||||||||||||||||
| Nominal GDP (in millions of pesos)(1) |
Ps. | 46,219,084 | Ps. | 82,810,045 | Ps. | 193,946,179 | Ps. | 584,377,011 | Ps. | 850,239,798 | ||||||||||
| GDP (in millions of U.S. dollars)(1) |
U.S.$ | 486,176 | U.S.$ | 634,402 | U.S.$ | 655,786 | U.S.$ | 637,868 | U.S.$ | 683,286 | ||||||||||
| Per capita GDP(1) |
U.S.$ | 10,613 | U.S.$ | 13,751 | U.S.$ | 14,190 | U.S.$ | 13,776 | U.S.$ | 14,730 | ||||||||||
| Peso / U.S. dollar exchange rate(2) |
95.1 | 130.5 | 295.7 | 916.1 | 1,244.3 | |||||||||||||||
| (1) | GDP figures in this table are expressed in nominal terms. Since population figures based on the census conducted in 2022 are preliminary, information in this table was calculated using INDEC’s population projections based on the 2010 census. |
| (2) | Average nominal exchange rate for the period specified. |
| (3) | Preliminary data. |
Source: INDEC and Ministry of Economy.
D-39
The following tables set forth information on Argentina’s real GDP, by expenditure, for the periods specified, at constant 2004 prices.
Composition of Real GDP by Expenditure
(in millions of pesos, at constant 2004 prices)
| 2021 | 2022 | 2023 | 2024(1) | 2025(1) | ||||||||||||||||
| Consumption: |
||||||||||||||||||||
| Public sector consumption |
Ps. | 95,249 | Ps. | 97,885 | Ps. | 100,131 | Ps. | 97,096 | Ps. | 97,462 | ||||||||||
| Private consumption |
475,166 | 520,146 | 525,281 | 510,224 | 553,934 | |||||||||||||||
|
|
|
|
|
|
|
|
|
|
|
|||||||||||
| Total consumption |
570,415 | 618,031 | 625,412 | 607,320 | 651,396 | |||||||||||||||
| Gross investment |
138,930 | 153,452 | 149,644 | 123,410 | 143,418 | |||||||||||||||
| Exports of goods and services |
144,470 | 151,053 | 135,848 | 164,061 | 177,396 | |||||||||||||||
| Imports of goods and services |
164,392 | 193,219 | 197,495 | 176,914 | 226,465 | |||||||||||||||
|
|
|
|
|
|
|
|
|
|
|
|||||||||||
| Net exports/(imports) |
(19,922 | ) | (42,166 | ) | (61,647 | ) | (12,853 | ) | (49,069 | ) | ||||||||||
| Changes in inventories |
387 | 2,025 | 4,398 | 1,152 | 4,203 | |||||||||||||||
| Statistical discrepancy |
— | — | — | (11,042 | ) | (10,219 | ) | |||||||||||||
|
|
|
|
|
|
|
|
|
|
|
|||||||||||
| Valuable Objects(2) |
— | — | — | — | — | |||||||||||||||
|
|
|
|
|
|
|
|
|
|
|
|||||||||||
| Real GDP |
Ps. | 689,810 | Ps. | 731,342 | Ps. | 717,806 | Ps. | 707,988 | Ps. | 739,729 | ||||||||||
|
|
|
|
|
|
|
|
|
|
|
|||||||||||
| (1) | Preliminary data. |
| (2) | Includes goods of considerable value that are not primarily used for production or consumption purposes, but are maintained over time as value deposits, including stones and precious metals and jewelry. |
Source: INDEC and Ministry of Economy.
Composition of Real GDP by Expenditure
(as % of total real GDP, at constant 2004 prices)
| 2021 | 2022 | 2023 | 2024(1) | 2025(1) | ||||||||||||||||
| Consumption: |
||||||||||||||||||||
| Public sector consumption |
13.8 | % | 13.4 | % | 13.9 | % | 13.7 | % | 13.2 | % | ||||||||||
| Private consumption |
68.9 | 71.1 | 73.2 | 72.1 | 74.9 | |||||||||||||||
|
|
|
|
|
|
|
|
|
|
|
|||||||||||
| Total consumption |
82.7 | 84.5 | 87.1 | 85.6 | 88.1 | |||||||||||||||
| Gross investment |
20.1 | 21.0 | 20.8 | 17.4 | 19.4 | |||||||||||||||
| Exports of goods and services |
20.9 | 20.7 | 18.9 | 23.2 | 24.0 | |||||||||||||||
| Imports of goods and services |
23.8 | 26.4 | 27.5 | 25.0 | 30.6 | |||||||||||||||
|
|
|
|
|
|
|
|
|
|
|
|||||||||||
| Net exports/(imports) |
(2.9 | ) | (5.8 | ) | (8.6 | ) | (1.8 | ) | (6.6 | ) | ||||||||||
| Changes in inventories |
0.1 | 0.3 | 0.6 | 0.2 | 0.6 | |||||||||||||||
| Statistical discrepancy |
— | — | — | (1.6 | ) | (1.4 | ) | |||||||||||||
|
|
|
|
|
|
|
|
|
|
|
|||||||||||
| Valuable Objects(2) |
— | — | — | — | — | |||||||||||||||
|
|
|
|
|
|
|
|
|
|
|
|||||||||||
| Real GDP |
100.0 | % | 100.0 | % | 100.0 | % | 100.0 | % | 100.0 | % | ||||||||||
|
|
|
|
|
|
|
|
|
|
|
|||||||||||
| (1) | Preliminary data. |
| (2) | Includes goods of considerable value that are not primarily used for production or consumption purposes, but are maintained over time as value deposits, including stones and precious metals and jewelry. |
Source: INDEC and Ministry of Economy.
D-40
Evolution of Real GDP by Expenditure
(% change from previous year, at constant 2004 prices)
| 2021 | 2022 | 2023 | 2024(1) (1) | 2025(1) (1) | ||||||||||||||||
| Consumption: |
||||||||||||||||||||
| Public sector consumption |
7.1 | % | 2.8 | % | 2.3 | % | (3.0 | )% | 0.4 | % | ||||||||||
| Private consumption |
9.5 | 9.5 | 1.0 | (2.9 | ) | 8.6 | ||||||||||||||
|
|
|
|
|
|
|
|
|
|
|
|||||||||||
| Total consumption |
9.1 | 8.3 | 1.2 | (2.9 | ) | 7.3 | ||||||||||||||
| Gross investment |
34.0 | 10.5 | (2.5 | ) | (17.5 | ) | 16.2 | |||||||||||||
| Exports of goods and services |
8.5 | 4.6 | (10.1 | ) | 20.8 | 8.1 | ||||||||||||||
| Imports of goods and services |
18.6 | 17.5 | 2.2 | (10.4 | ) | 28.0 | ||||||||||||||
|
|
|
|
|
|
|
|
|
|
|
|||||||||||
| Net exports/(imports) |
265.6 | 111.7 | 42.6 | (79.2 | ) | 281.8 | ||||||||||||||
| Changes in inventories |
(88.6 | ) | 423.3 | 117.2 | (73.8 | ) | 264.7 | |||||||||||||
| Statistical discrepancy |
— | — | — | — | (7.5 | ) | ||||||||||||||
|
|
|
|
|
|
|
|
|
|
|
|||||||||||
| Real GDP |
10.4 | % | 6.0 | % | (1.9 | )% | (1.4 | )% | 4.5 | % | ||||||||||
|
|
|
|
|
|
|
|
|
|
|
|||||||||||
| (1) | Preliminary data. |
Source: INDEC and Ministry of Economy.
The following tables set forth information on Argentina’s gross investment, by expenditure, for the periods indicated, at constant 2004 prices.
Composition of Gross Investment
(in millions of pesos, at constant 2004 prices)
| 2021 | 2022 | 2023 | 2024(3) | 2025(3) | ||||||||||||||||
| Natural Resources and others(1) |
Ps. | 1,038 | Ps. | 1,153 | Ps. | 1,638 | Ps. | 1,838 | Ps. | 2,002 | ||||||||||
| Durable equipment for production |
||||||||||||||||||||
| Machinery and equipment: |
||||||||||||||||||||
| National |
25,234 | 27,771 | 26,788 | 21,902 | 22,571 | |||||||||||||||
| Imported |
36,316 | 44,703 | 39,573 | 32,486 | 44,413 | |||||||||||||||
|
|
|
|
|
|
|
|
|
|
|
|||||||||||
| Total |
61,550 | 72,474 | 66,361 | 54,389 | 66,984 | |||||||||||||||
| Transport products |
||||||||||||||||||||
| National |
10,976 | 12,084 | 14,650 | 12,366 | 13,691 | |||||||||||||||
| Imported |
3,646 | 3,401 | 3,095 | 4,315 | 8,470 | |||||||||||||||
|
|
|
|
|
|
|
|
|
|
|
|||||||||||
| Total |
14,622 | 15,485 | 17,745 | 16,681 | 22,162 | |||||||||||||||
| Total durable equipment for production |
76,172 | 87,959 | 84,106 | 71,069 | 89,145 | |||||||||||||||
| Construction(2) |
61,719 | 64,340 | 63,899 | 50,503 | 52,271 | |||||||||||||||
|
|
|
|
|
|
|
|
|
|
|
|||||||||||
| Total gross investment |
Ps. | 138,930 | Ps. | 153,452 | Ps. | 149,644 | Ps. | 123,410 | Ps. | 143,418 | ||||||||||
|
|
|
|
|
|
|
|
|
|
|
|||||||||||
| (1) | Includes research and development and cultivated biological resources. |
| (2) | Includes mining exploration. |
| (3) | Preliminary data. |
Source: INDEC and Ministry of Economy.
D-41
Composition of Gross Investment
(as % of total Gross Investment, at constant 2004 prices)
| 2021 | 2022 | 2023 | 2024(3) | 2025(3) | ||||||||||||||||
| Natural Resources and others(1) |
0.7 | % | 0.8 | % | 1.1 | % | 1.5 | % | 1.4 | % | ||||||||||
| Durable equipment for production |
||||||||||||||||||||
| Machinery and equipment: |
||||||||||||||||||||
| National |
18.2 | 18.1 | 17.9 | 17.7 | 15.7 | |||||||||||||||
| Imported |
26.1 | 29.1 | 26.4 | 26.3 | 31.0 | |||||||||||||||
|
|
|
|
|
|
|
|
|
|
|
|||||||||||
| Total |
44.3 | 47.2 | 44.3 | 44.1 | 46.7 | |||||||||||||||
|
|
|
|
|
|
|
|
|
|
|
|||||||||||
| Transport products |
||||||||||||||||||||
| National |
7.9 | 7.9 | 9.8 | 10.0 | 9.5 | |||||||||||||||
| Imported |
2.6 | 2.2 | 2.1 | 3.5 | 5.9 | |||||||||||||||
|
|
|
|
|
|
|
|
|
|
|
|||||||||||
| Total |
10.5 | 10.1 | 11.9 | 13.5 | 15.5 | |||||||||||||||
| Total durable equipment for production |
54.8 | 57.3 | 56.2 | 57.6 | 62.2 | |||||||||||||||
| Construction(2) |
44.4 | 41.9 | 42.7 | 40.9 | 36.4 | |||||||||||||||
|
|
|
|
|
|
|
|
|
|
|
|||||||||||
| Total gross investment |
100.0 | % | 100.0 | % | 100.0 | % | 100.0 | % | 100.0 | % | ||||||||||
|
|
|
|
|
|
|
|
|
|
|
|||||||||||
| (1) | Includes research and development and cultivated biological resources. |
| (2) | Includes mining exploration. |
| (3) | Preliminary data. |
Source: INDEC and Ministry of Economy.
Evolution of Gross Investment
(% change from previous year, at constant 2004 prices)
| 2021 | 2022 | 2023 | 2024(3) | 2025(3) | ||||||||||||||||
| Natural Resources and others(1) |
17.1 | % | 11.1 | % | 42.0 | % | 12.2 | % | 8.9 | % | ||||||||||
| Durable equipment for production |
||||||||||||||||||||
| Machinery and equipment: |
||||||||||||||||||||
| National |
34.9 | 10.1 | (3.5 | ) | (18.2 | ) | 3.1 | |||||||||||||
| Imported |
34.0 | 23.1 | (11.5 | ) | (17.9 | ) | 36.7 | |||||||||||||
|
|
|
|
|
|
|
|
|
|
|
|||||||||||
| Total |
34.4 | 17.7 | (8.4 | ) | (18.0 | ) | 23.2 | |||||||||||||
|
|
|
|
|
|
|
|
|
|
|
|||||||||||
| Transport products |
||||||||||||||||||||
| National |
56.0 | 10.1 | 21.2 | (15.6 | ) | 10.7 | ||||||||||||||
| Imported |
13.7 | (6.7 | ) | (9.0 | ) | 39.4 | 96.3 | |||||||||||||
|
|
|
|
|
|
|
|
|
|
|
|||||||||||
| Total |
42.7 | 5.9 | 14.6 | (6.0 | ) | 32.9 | ||||||||||||||
| Total durable equipment for production |
35.9 | 15.5 | (4.4 | ) | (15.5 | ) | 25.4 | |||||||||||||
| Construction(2) |
32.1 | 4.2 | (0.7 | ) | (21.0 | ) | 3.5 | |||||||||||||
|
|
|
|
|
|
|
|
|
|
|
|||||||||||
| Total gross investment |
34.0 | % | 10.5 | % | (2.5 | )% | (17.5 | )% | 16.2 | % | ||||||||||
|
|
|
|
|
|
|
|
|
|
|
|||||||||||
| (1) | Includes research and development and cultivated biological resources. |
| (2) | Includes mining exploration. |
| (3) | Preliminary data. |
Source: INDEC and Ministry of Economy
D-42
Principal Sectors of the Economy
The following tables set forth the composition of Argentina’s real GDP by economic sector for the periods specified.
Real GDP by Sector
(in millions of pesos, at constant 2004 prices)
| 2021 | 2022 | 2023 | 2024(3) | 2025(3) | ||||||||||||||||
| Primary production: |
||||||||||||||||||||
| Agriculture, livestock, game and forestry |
Ps. | 50,706 | Ps. | 48,480 | Ps. | 36,658 | Ps. | 48,459 | Ps. | 51,908 | ||||||||||
| Fishing |
2,402 | 2,459 | 2,358 | 2,642 | 2,327 | |||||||||||||||
| Mining and extractives (including petroleum and gas) |
21,149 | 23,752 | 25,735 | 27,651 | 29,876 | |||||||||||||||
|
|
|
|
|
|
|
|
|
|
|
|||||||||||
| Total primary production |
74,256 | 74,691 | 64,751 | 78,752 | 84,111 | |||||||||||||||
| Secondary production: |
||||||||||||||||||||
| Manufacturing |
115,785 | 121,259 | 118,776 | 108,241 | 109,207 | |||||||||||||||
| Construction |
21,210 | 22,469 | 22,673 | 18,664 | 19,442 | |||||||||||||||
| Electricity, gas and water |
12,684 | 13,024 | 12,933 | 12,947 | 13,035 | |||||||||||||||
|
|
|
|
|
|
|
|
|
|
|
|||||||||||
| Total secondary production |
149,679 | 156,751 | 154,383 | 139,852 | 141,684 | |||||||||||||||
|
|
|
|
|
|
|
|
|
|
|
|||||||||||
| Services: |
||||||||||||||||||||
| Transportation, storage and communications |
50,415 | 54,410 | 53,986 | 54,406 | 55,544 | |||||||||||||||
| Trade, hotels and restaurants |
97,858 | 105,826 | 106,566 | 100,203 | 104,480 | |||||||||||||||
| Financial, real estate, business and rental services |
101,863 | 105,678 | 106,236 | 104,972 | 113,795 | |||||||||||||||
| Public administration, education, health, social and personal services |
98,486 | 103,423 | 105,580 | 104,726 | 104,416 | |||||||||||||||
| Domestic services(1) |
3,697 | 4,038 | 4,086 | 4,087 | 4,068 | |||||||||||||||
|
|
|
|
|
|
|
|
|
|
|
|||||||||||
| Total services |
352,319 | 373,374 | 376,455 | 368,394 | 382,302 | |||||||||||||||
|
|
|
|
|
|
|
|
|
|
|
|||||||||||
| Plus import duties(2) |
113,555 | 126,526 | 122,217 | 120,990 | 131,632 | |||||||||||||||
|
|
|
|
|
|
|
|
|
|
|
|||||||||||
| Total real GDP |
Ps. | 689,810 | Ps. | 731,342 | Ps. | 717,806 | Ps. | 707,988 | Ps. | 739,729 | ||||||||||
|
|
|
|
|
|
|
|
|
|
|
|||||||||||
| (1) | Includes services completed by domestic workers including caretakers, domestic servants and private drivers. |
| (2) | The production figures in this table do not include duties assessed on imports used in production, which must be taken into account for purposes of determining real GDP. Import duties for purposes of determining real GDP are recorded under this line item. |
| (3) | Preliminary data. |
Source: INDEC and Ministry of Economy.
D-43
Real GDP by Sector
(as a % of real GDP, at constant 2004 prices)
| 2021 | 2022 | 2023 | 2024(3) | 2025(3) | ||||||||||||||||
| Primary production: |
||||||||||||||||||||
| Agriculture, livestock, game and forestry |
7.4 | % | 6.6 | % | 5.1 | % | 6.8 | % | 7.0 | % | ||||||||||
| Fishing |
0.3 | 0.3 | 0.3 | 0.4 | 0.3 | |||||||||||||||
| Mining and extractives (including petroleum and gas) |
3.1 | 3.2 | 3.6 | 3.9 | 4.0 | |||||||||||||||
|
|
|
|
|
|
|
|
|
|
|
|||||||||||
| Total primary production |
10.8 | 10.2 | 9.0 | 11.1 | 11.4 | |||||||||||||||
|
|
|
|
|
|
|
|
|
|
|
|||||||||||
| Secondary production: |
||||||||||||||||||||
| Manufacturing |
16.8 | 16.6 | 16.5 | 15.3 | 14.8 | |||||||||||||||
| Construction |
3.1 | 3.1 | 3.2 | 2.6 | 2.6 | |||||||||||||||
| Electricity, gas and water |
1.8 | 1.8 | 1.8 | 1.8 | 1.8 | |||||||||||||||
|
|
|
|
|
|
|
|
|
|
|
|||||||||||
| Total secondary production |
21.7 | 21.4 | 21.5 | 19.8 | 19.2 | |||||||||||||||
|
|
|
|
|
|
|
|
|
|
|
|||||||||||
| Services: |
||||||||||||||||||||
| Transportation, storage and communication |
7.3 | 7.4 | 7.5 | 7.7 | 7.5 | |||||||||||||||
| Trade, hotels and restaurants |
14.2 | 14.5 | 14.8 | 14.2 | 14.1 | |||||||||||||||
| Financial, real estate, business and rental services |
14.8 | 14.4 | 14.8 | 14.8 | 15.4 | |||||||||||||||
| Public administration, education, health, social and personal services |
14.3 | 14.1 | 14.7 | 14.8 | 14.1 | |||||||||||||||
| Domestic services(1) |
0.5 | 0.6 | 0.6 | 0.6 | 0.5 | |||||||||||||||
|
|
|
|
|
|
|
|
|
|
|
|||||||||||
| Total services |
51.1 | 51.1 | 52.4 | 52.0 | 51.7 | |||||||||||||||
|
|
|
|
|
|
|
|
|
|
|
|||||||||||
| Plus import duties(2) |
16.5 | 17.3 | 17.0 | 17.1 | 17.8 | |||||||||||||||
|
|
|
|
|
|
|
|
|
|
|
|||||||||||
| Total real GDP |
100.0 | % | 100.0 | % | 100.0 | % | 100.0 | % | 100.0 | % | ||||||||||
|
|
|
|
|
|
|
|
|
|
|
|||||||||||
| (1) | Includes services completed by domestic workers including caretakers, domestic servants and private chauffeurs. |
| (2) | The production figures in this table do not include duties assessed on imports used in production, which must be taken into account for purposes of determining real GDP. Import duties for purposes of determining real GDP are recorded under this line item. |
| (3) | Preliminary data. |
Source: INDEC and Ministry of Economy.
D-44
Real GDP Growth by Sector
(% change from previous year, at constant 2004 prices)
| 2021 | 2022 | 2023 | 2024(3) | 2025(3) | ||||||||||||||||
| Primary production: |
||||||||||||||||||||
| Agriculture, livestock, game and forestry |
1.2 | % | (4.4 | )% | (24.4 | )% | 32.2 | % | 7.1 | % | ||||||||||
| Fishing |
19.1 | 2.4 | (4.1 | ) | 12.0 | (11.9 | ) | |||||||||||||
| Mining and extractives (including petroleum and gas) |
9.5 | 12.3 | 8.3 | 7.4 | 8.0 | |||||||||||||||
|
|
|
|
|
|
|
|
|
|
|
|||||||||||
| Total primary production |
3.9 | 0.6 | (13.3 | ) | 21.6 | 6.8 | ||||||||||||||
|
|
|
|
|
|
|
|
|
|
|
|||||||||||
| Secondary production: |
||||||||||||||||||||
| Manufacturing |
15.8 | 4.7 | (2.0 | ) | (8.9 | ) | 0.9 | |||||||||||||
| Construction |
29.1 | 5.9 | 0.9 | (17.7 | ) | 4.2 | ||||||||||||||
| Electricity, gas and water |
3.3 | 2.7 | (0.7 | ) | 0.1 | 0.7 | ||||||||||||||
|
|
|
|
|
|
|
|
|
|
|
|||||||||||
| Total secondary production |
16.3 | 4.7 | (1.5 | ) | (9.4 | ) | 1.3 | |||||||||||||
|
|
|
|
|
|
|
|
|
|
|
|||||||||||
| Services: |
||||||||||||||||||||
| Transportation, storage and communication |
7.0 | 7.9 | (0.8 | ) | 0.8 | 2.1 | ||||||||||||||
| Trade, hotels and restaurants |
14.5 | 8.1 | 0.7 | (6.0 | ) | 4.3 | ||||||||||||||
| Financial, real estate, business and rental services |
6.7 | 3.7 | 0.5 | (1.2 | ) | 8.4 | ||||||||||||||
| Public administration, education, health, social and personal services |
9.5 | 5.0 | 2.1 | (0.8 | ) | (0.3 | ) | |||||||||||||
| Domestic services(1) |
4.2 | 9.2 | 1.2 | — | (0.5 | ) | ||||||||||||||
|
|
|
|
|
|
|
|
|
|
|
|||||||||||
| Total services |
9.6 | 6.0 | 0.8 | (2.1 | ) | 3.8 | ||||||||||||||
|
|
|
|
|
|
|
|
|
|
|
|||||||||||
| Plus import duties less adjustment for banking service(2) |
10.4 | 11.4 | (3.4 | ) | (1.0 | ) | 8.8 | |||||||||||||
|
|
|
|
|
|
|
|
|
|
|
|||||||||||
| Total real GDP |
10.4 | % | 6.0 | % | (1.9 | )% | (1.4 | )% | 4.5 | % | ||||||||||
|
|
|
|
|
|
|
|
|
|
|
|||||||||||
| (1) | Includes services completed by domestic workers including caretakers, domestic servants and private chauffeurs. |
| (2) | The production figures in this table do not include duties assessed on imports used in production, which must be taken into account for purposes of determining real GDP. Import duties for purposes of determining real GDP are recorded under this line item. |
| (3) | Preliminary data. |
Source: INDEC and Ministry of Economy.
In 2021, real GDP increased by 10.4%. This expansion was the result of a 9.1% increase in total consumption and a 34.0% increase in gross investment, while exports of goods and services increased by 8.5% and imports of goods and services increased by 18.6%, resulting in a 265.6% increase in net imports. The primary production sector increased by 3.9%, mainly due to a 9.5% increase in mining and extractives. The secondary sector grew by 16.3%, mainly due to a 29.1% increase in construction and a 15.8% increase in manufacturing. The services sector increased by 9.6%, mainly as a result of a 14.5% increase in the trade, hotels and restaurants sector, a 9.5% increase in the public administration sector and a 6.7% increase in financial, real estate, business and rental sector.
In 2022, real GDP increased by 6.0%. This expansion was the result of an 8.3% increase in total consumption and a 10.5% increase in gross investment, while exports of goods and services increased by 4.6% and imports of goods and services increased by 17.5%, resulting in a 111.7% increase in net imports. The primary production sector increased by 0.6%, mainly due to a 12.3% increase in mining and extractives. The secondary sector grew by 4.7%, mainly due to a 4.7% increase in manufacturing and a 5.9% increase in construction. The services sector increased by 6.0 %, mainly as a result of an 8.1% increase in the trade, hotels and restaurants sector, a 7.9% increase in the transportation, storage and communication sector and a 5.0% increase in the public administration, education, health, social and personal services sector.
In 2023, real GDP decreased by 1.9%. This contraction was the result of a 1.1% increase in total consumption and a 2.0% decrease in gross investment, while exports of goods and services decreased by 9.5% and imports of goods and services increased by 1.9%, resulting in a 42.6% increase in net imports. The primary production sector decreased by 13.3%, mainly due to a 24.2% decrease in agriculture and livestock, which was partially offset by an 8.3% increase in mining and extractives. The secondary sector contracted by 1.5%, mainly due to a 2.0% decrease in manufacturing and a 0.9% increase in construction. The services sector increased by 0.8%, mainly as a result of a 2.2% increase in the public administration, education, health, social and personal services sector, a 0.7% increase in the trade, hotels and restaurants sector, and a 0.5% increase in financial, real estate, business and rental sector, which was partially offset by a 0.8% decrease in the transportation, storage and communication sector.
D-45
In 2024, real GDP decreased by 1.3%. This contraction was the result of a 3.1% decrease in total consumption and a 17.2% decrease in gross investment, while exports of goods and services increased by 19.8% and imports of goods and services decreased by 10.2%, resulting in a 78.4 % decrease in net imports. The primary production sector increased by 21.5%, mainly due to a 32.3% increase in the agriculture, livestock, game and forestry sector. The secondary sector contracted by 9.4%, mainly due to a 8.8% decrease in manufacturing and a 17.5% decrease in construction. The services sector decreased by 2.1%, mainly as a result of a 5.9% decrease in the trade, hotels and restaurants sector, a 1.3% decrease in the financial, real estate, business and rental sector, and a 0.6% decrease in the public administration, education, health, social and personal services sector, which was partially offset by a 0.8% increase in the transportation, storage and communication sector.
In 2025, real GDP increased by 4.5%. This growth was the result of a 7.3% increase in total consumption and a 16.2% increase in gross investment, while exports of goods and services increased by 8.1% and imports of goods and services increased by 28.0%, resulting in a 281.8% increase in net imports. The primary production sector increased by 6.8%, mainly due to an 8.0% increase in the mines and quarries exploitation sector and a 7.1% increase in agriculture, livestock, game and forestry sector. The secondary sector grew by 1.3%, mainly due to a 4.2% increase in construction and a 0.9% increase in the manufacturing sector. The services sector increased by 3.8%, mainly as a result of a 4.3% increase in the trade, hotels and restaurants sector, an 8.4% increase in the financial, real estate, business and rental sector, and a 2.1% increase in the transportation, storage and communication sector, which was partially offset by a 0.3% decrease in the public administration, education, health, social and personal services sector.
Primary Production
In 2021, total primary sector production increased by 3.9% compared to 2020, mainly driven by a 9.5% increase in mining and extractives, primarily due to a greater dynamism in the oil and gas sector. In 2022, total primary sector production increased by 0.6% compared to 2021, mainly driven by a 12.3% increase in mining and extractives, primarily due to a greater dynamism in the oil and gas sector. In 2023, total primary sector production decreased by 13.3% compared to 2022, mainly driven by a 24.2% decrease in agriculture, livestock, game and forestry. In 2024, total primary sector production increased by 21.5% compared to 2022, mainly driven by a 32.3% increase in agriculture, livestock, game and forestry sector. In 2025, total primary sector production increased by 6.8% compared to 2024, mainly driven by an 8.0% increase in the mines and quarries exploitation sector and a 7.1% increase in the agriculture, livestock, game and forestry sector.
Agriculture, Livestock, Game and Forestry
Argentina relies on its domestic supply for virtually all agricultural and livestock products, and is a major exporter of primary products, including cereals, grains, meat and fish. Crop production consists primarily of soy, corn and wheat. During the 2024 to 2025 season, soy, corn, and wheat production represented 36.3%, 36.7% and 13.1% of total agricultural production, respectively. During 2021, 2022, 2023, 2024 and 2025, Argentina’s agriculture, livestock, game, forestry, fishing and extractives sector accounted for 10.8%, 10.2%, 9.0%, 11.1% and 11.4% of real GDP, respectively.
In 2024, the agriculture, livestock, game and forestry sector grew by 32.3% compared to 2023, mainly due to the impact of the drought affecting the 2023/2024 harvest season and the effects of avian influenza. In the 2023/2024 harvest season, harvested cereals, oilseeds and industrial crops totaled 138.5 million tons, representing a 45.9% increase when compared to the 2022/2023 harvest season.
In 2025, the agriculture, livestock, game and forestry sector grew by 7.1% compared to 2024, mainly due to a higher agricultural output. In the 2024/2025 harvest season, harvested cereals, oilseeds and industrial crops totaled 140.8 million tons, representing a 1.7% increase when compared to the 2023/2024 harvest season.
Mining and Extractives (Including Oil and Gas Production)
The mining and extractives sector consists primarily of precious and semi-precious metals, coal, petroleum and gas exploration and production. Historically, mining activity in Argentina has represented a small part of the economy, accounting for 3.1%, 3.2%, 3.6%, 3.9% and 4.0% of real GDP in 2021, 2022, 2023, 2024 and 2025, respectively.
Argentina is the largest producer of natural gas and the second largest producer of crude oil in South and Central America, based on 2025 production, according to the 2026 edition of the Energy Institute Statistical Review of World Energy, published in June 2026. As of December 31, 2025, YPF held interests in 78 oil and gas fields in Argentina and, in association with private partners, was also engaged in projects relating to the exploration and development of unconventional resources, including shale oil and gas, primarily in the Vaca Muerta formation located in the provinces of Neuquén and Río Negro. See “Role of the State in the Economy—Oil and Gas Industry.”
D-46
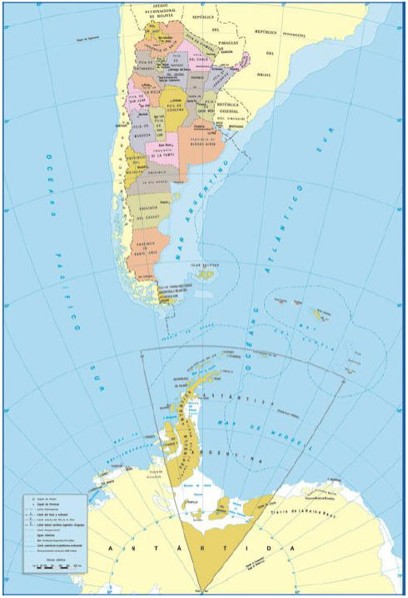
Secondary Production
Manufacturing
Argentina’s manufacturing sector primarily consists of the production of food and beverages, chemical products and substances, common metals, rubber and plastic products, motor vehicles, trailers and semi-trailers and apparel. The 2001-2002 economic crisis that severely affected Argentina—with GDP contracting 10.9% in 2002—had a significant adverse effect on this sector. The adoption of import-substitution policies commencing in 2002 contributed to the growth of this sector during the following years. Between 2003 and 2008, economic growth was also fueled by growth of the manufacturing sector, which became competitive due to the effects of the depreciation of the peso and investments aimed at stimulating production. Industrial products, such as chemical products, planes and ships, and agricultural products, such as crops and livestock, also contributed to increasing exports during this period. Argentina’s manufacturing sector, however, is significantly exposed to fluctuations in the cost of capital, which in turn are affected by the Government’s fiscal and monetary policies. In recent years, the manufacturing sector has been adversely affected by Argentina’s unstable macroeconomic environment. In 2025, the manufacturing sector accounted for 14.8% of real GDP.
During 2021, the manufacturing sector grew by 15.8% compared to 2020. This increase was primarily driven by:
| | a 14.3% increase in common metals; |
| | a 13.9% increase in machinery and equipment; |
| | a 9.6% increase in motor vehicles, trailers and semi-trailers; and |
| | a 12.3% increase in food and beverages. |
All manufacturing activities increased during 2021, except for the furniture and mattress industry.
During 2022, the manufacturing sector grew by 4.7% compared to 2021. This increase was primarily driven by:
| | a 17.7% increase in machinery and equipment; |
| | a 17.4% increase in food and beverages; |
| | a 13.2% increase in chemical products; and |
| | a 10.3% increase in motor vehicles, trailers and semi-trailers. |
This increase was partially offset by a 3.8% decrease in wood and cork products.
During 2023, the manufacturing sector contracted by 2.0% compared to 2022. This decrease was primarily driven by:
| | a 48.4% decrease in food and beverages; |
| | a 22.3% decrease in machinery and equipment; and |
| | a 23.8% decrease in chemical products. |
This decrease was partially offset by an 8.6% increase in products derived from oil refining, and a 6.6% increase in wearing apparel.
During 2024, the manufacturing sector contracted by 8.9% compared to 2023. This decrease was primarily driven by:
| | a 15.2% decrease in common metals; |
| | a 14.2% decrease in non-metallic products; and |
| | a 14.1% decrease in machinery and equipment. |
This decrease was partially offset by a 1.1% increase in food and beverages and a 0.7% increase in products derived from oil refining
During 2025, the manufacturing sector grew by 0.9% compared to 2024. This increase was primarily driven by:
| | a 54.0% increase in food and beverages; |
| | a 38.6% increase in the furniture and mattress industry; and |
| | a 24.5% increase in machinery and equipment. |
D-47
This increase was partially offset by a 43.9% decrease in fabricated metal products (except machinery and equipment), a 28.9% decrease in leather and footwear, a 20.7% decrease in rubber and plastics products, and a 13.6% decrease in textiles, among others.
Construction
The Argentine economy shows a strong correlation between the evolution of real GDP and the construction sector, which primarily consists of residential projects.
In 2021, the level of activity in the construction sector increased by 29.1% compared to 2020. In 2021, the construction sector accounted for 3.1% of real GDP.
In 2022, the level of activity in the construction sector increased by 5.9% compared to 2021. In 2022, the construction sector accounted for 3.1% of real GDP.
In 2023, the level of activity in the construction sector increased by 0.9% compared to 2022. In 2023, the construction sector accounted for 3.2% of real GDP.
In 2024, the level of activity in the construction sector decreased by 17.7% compared to 2023. In 2024, the construction sector accounted for 2.6% of real GDP.
In 2025, the level of activity in the construction sector increased by 4.2% compared to 2024. In 2025, the construction sector accounted for 2.6% of real GDP.
Electricity, Gas and Water
Electricity in Argentina is primarily produced from combined cycle (which uses both gas and steam turbines to produce electricity) and hydroelectric sources, with supplemental generation from gas, coal and nuclear plants. The electricity, gas and water sector represents a small fraction of the Argentine economy, accounting for 1.8% of real GDP in 2025.
The electricity, gas and water sector increased by 3.3% and 2.7% in 2021 and 2022, respectively, decreased by 0.7% in 2023, remained relatively stable in 2024, and increased by 0.7 in 2025, in each case as compared to the previous year. Between 2021 and 2023, Argentina relied in part on fuel imports to meet excess consumption needs. In 2024 and 2025, Argentina recorded significant energy trade surpluses, supported by increased domestic oil and gas production, particularly from the Vaca Muerta formation, and a substantial reduction in fuel and gas imports.
D-48
The following table sets forth information on Argentina’s electricity sector for the periods specified.
Principal Economic Indicators of the Electricity Sector
(in GW/hr, unless otherwise specified)
| 2021 | 2022 | 2023 | 2024(1) | 2025(1) | ||||||||||||||||
| Production of electricity sector |
||||||||||||||||||||
| Thermal |
90,074 | 81,751 | 73,020 | 75,388 | 75,225 | |||||||||||||||
| Hydraulic |
24,116 | 30,186 | 39,332 | 33,424 | 30,144 | |||||||||||||||
| Nuclear |
10,170 | 7,469 | 8,963 | 10,449 | 10,761 | |||||||||||||||
|
|
|
|
|
|
|
|
|
|
|
|||||||||||
| Wind-Solar |
17,437 | 19,340 | 20,086 | 22,877 | 26,663 | |||||||||||||||
|
|
|
|
|
|
|
|
|
|
|
|||||||||||
| Imports(2) |
819 | 6,310 | 6,241 | 4,654 | 4,304 | |||||||||||||||
|
|
|
|
|
|
|
|
|
|
|
|||||||||||
| Total generation |
142,616 | 145,057 | 147,641 | 146,792 | 147,096 | |||||||||||||||
|
|
|
|
|
|
|
|
|
|
|
|||||||||||
| Demand by economic sector |
||||||||||||||||||||
| Industrial |
36,451 | 37,098 | 36,674 | 36,204 | 36,396 | |||||||||||||||
| Residential |
60,786 | 63,157 | 65,296 | 65,591 | 66,363 | |||||||||||||||
| Commercial |
36,640 | 38,520 | 38,907 | 38,913 | 38,493 | |||||||||||||||
|
|
|
|
|
|
|
|
|
|
|
|||||||||||
| Exports |
3,850 | 31 | 98 | 970 | 509 | |||||||||||||||
|
|
|
|
|
|
|
|
|
|
|
|||||||||||
| Loss in consumption and others |
4,889 | 6,250 | 6,660 | 5,602 | 5,335 | |||||||||||||||
|
|
|
|
|
|
|
|
|
|
|
|||||||||||
| Total demand |
142,616 | 145,057 | 147,641 | 146,792 | 147,096 | |||||||||||||||
|
|
|
|
|
|
|
|
|
|
|
|||||||||||
| (1) | Preliminary data. |
| (2) | Imports, primarily from Uruguay, to meet domestic demand in excess of domestic production. |
Source: INDEC and Ministry of Economy.
The following table sets forth the imports and exports of fuel and energy for the periods specified.
Exports and Imports of Fuel and Energy
(in millions of U.S. dollars, unless otherwise specified)
| 2021 | 2022 | 2023 | 2024(1) | 2025 | ||||||||||||||||
| Total FOB exports |
U.S.$ | 77,934 | U.S.$ | 88,703 | U.S.$ | 66,956 | U.S.$ | 79,703 | U.S.$ | 87,111 | ||||||||||
|
|
|
|
|
|
|
|
|
|
|
|||||||||||
| Fuel and energy |
5,284 | 8,589 | 7,929 | 9,717 | 11,100 | |||||||||||||||
| As a % of total FOB exports |
6.8 | % | 9.7 | % | 11.8 | % | 12.2 | % | 12.7 | % | ||||||||||
| Change from previous year |
47.0 | % | 62.6 | % | (7.7 | )% | 22.6 | % | 14.2 | % | ||||||||||
| Total CIF imports |
U.S.$ | 63,184 | U.S.$ | 81,740 | U.S.$ | 73,816 | U.S.$ | 60,776 | U.S.$ | 75,791 | ||||||||||
|
|
|
|
|
|
|
|
|
|
|
|||||||||||
| Fuel and energy |
5,843 | 12,975 | 7,887 | 3,987 | 3,271 | |||||||||||||||
| As a % of total CIF imports |
9.2 | % | 15.9 | % | 10.7 | % | 6.6 | % | 4.3 | % | ||||||||||
| Change from previous year |
121.3 | % | 122.1 | % | (39.2 | )% | (49.4 | )% | (18.0 | )% | ||||||||||
|
|
|
|
|
|
|
|
|
|
|
|||||||||||
| Net (imports) exports of fuel and energy |
U.S.$ | (560 | ) | U.S.$ | (4,386) | U.S.$ | 41 | U.S.$ | 5,730 | U.S.$ | 7,829 | |||||||||
|
|
|
|
|
|
|
|
|
|
|
|||||||||||
| (1) | Preliminary data. |
Source: INDEC and Ministry of Economy.
In 2024, exports of fuel and energy increased by 22.6%, while their imports decreased by 49.4% compared to 2023. In 2025, exports of fuel and energy increased by 14.2%, while their imports decreased by 18.0% compared to 2024.
D-49
Evolution of Exports and Imports of Fuel and Energy
(% change in volume from previous year)
| 2021 | 2022 | 2023(1) | 2024(1) | 2025(1) | ||||||||||||||||
| Change in volume of exports |
(14.9 | )% | 12.6 | % | 14.6 | % | 29.3 | % | 28.8 | % | ||||||||||
| Change in volume of imports |
68.1 | % | 22.9 | % | (23.3 | )% | (40.1 | )% | (2.6 | )% | ||||||||||
| (1) | Preliminary data. |
Source: INDEC and Ministry of Economy.
Services
The services sector represents the largest portion of the Argentine economy, accounting for 51.1% in 2021 and 2022, 52.4% in 2023, 52.0% in 2024 and 51.7% in 2025.
The following tables set forth the composition and growth of the services sector for the periods specified.
Composition of Services Sector
(in millions of pesos, at constant 2004 prices)
| 2021 | 2022 | 2023 | 2024(2) | 2025(2) | ||||||||||||||||
| Wholesale and retail trade and repairs |
Ps. | 90,360 | Ps. | 95,782 | Ps. | 95,936 | Ps. | 89,008 | Ps. | 92,346 | ||||||||||
| Transportation, storage and communication services |
50,415 | 54,410 | 53,986 | 54,406 | 55,544 | |||||||||||||||
| Real estate, business and rental services |
76,616 | 80,408 | 81,660 | 81,416 | 84,346 | |||||||||||||||
| Education, Social and health services |
51,169 | 52,640 | 53,682 | 53,821 | 53,877 | |||||||||||||||
| Financial services |
25,246 | 25,270 | 24,576 | 23,556 | 29,449 | |||||||||||||||
| Other community, social and personal services |
14,565 | 15,847 | 16,186 | 15,656 | 15,720 | |||||||||||||||
| Public administration |
32,753 | 34,936 | 35,713 | 35,249 | 34,818 | |||||||||||||||
| Hotels and restaurants |
7,498 | 10,044 | 10,631 | 11,196 | 12,134 | |||||||||||||||
| Domestic Services(1) |
3,697 | 4,038 | 4,086 | 4,087 | 4,068 | |||||||||||||||
|
|
|
|
|
|
|
|
|
|
|
|||||||||||
| Total |
Ps. | 352,319 | Ps. | 373,374 | Ps. | 376,455 | Ps. | 368,394 | Ps. | 382,302 | ||||||||||
|
|
|
|
|
|
|
|
|
|
|
|||||||||||
| (1) | Includes services completed by domestics workers including caretakers, domestic servants and private drivers. |
| (2) | Preliminary data. |
Source: INDEC and Ministry of Economy.
Growth of Services Sector
(% change from prior year, at constant 2004 prices)
| 2021 | 2022 | 2023 | 2024(2) | 2025(2) | ||||||||||||||||
| Wholesale and retail trade and repairs |
13.5 | % | 6.0 | % | 0.2 | % | (7.2 | )% | 3.8 | % | ||||||||||
| Transportation, storage and communication services |
7.0 | 7.9 | (0.8 | ) | 0.8 | 2.1 | ||||||||||||||
| Real estate, business and rental services |
8.9 | 4.9 | 1.6 | (0.3 | ) | 3.6 | ||||||||||||||
| Education, Social and health services |
6.8 | 2.9 | 2.0 | 0.3 | 0.1 | |||||||||||||||
| Financial services |
0.6 | 0.1 | (2.7 | ) | (4.1 | ) | 25.0 | |||||||||||||
| Other community, social and personal services |
33.0 | 8.8 | 2.1 | (3.3 | ) | 0.4 | ||||||||||||||
| Public administration |
5.4 | 6.7 | 2.2 | (1.3 | ) | (1.2 | ) | |||||||||||||
| Hotels and restaurants |
28.2 | 34.0 | 5.8 | 5.3 | 8.4 | |||||||||||||||
| Domestic services(1) |
4.2 | 9.2 | 1.2 | — | (0.5 | ) | ||||||||||||||
|
|
|
|
|
|
|
|
|
|
|
|||||||||||
| Total |
9.6 | % | 6.0 | % | 0.8 | % | (2.1 | )% | 3.8 | % | ||||||||||
|
|
|
|
|
|
|
|
|
|
|
|||||||||||
| (1) | Includes services completed by domestics workers including caretakers, domestic servants and private drivers. |
| (2) | Preliminary data. |
Source: INDEC and Ministry of Economy.
D-50
In 2021, the services sector increased by 9.6% compared to 2020. This increase was primarily driven by a 13.5% increase in wholesale and retail trade and repair services, an 8.9% increase in real estate, business and rental services, a 7.0% increase in transportation, storage and communication services and a 33.0% increase in other community, social and personal services. The financial services sector increased by 0.6% compared to 2020.
In 2022, the services sector increased by 6.0% compared to 2021. This increase was primarily driven by a 6.0% increase in wholesale and retail trade and repair services, a 4.9% increase in real estate, business and rental services, a 7.9% increase in transportation, storage and communication services, a 9.2% increase in domestic services and a 34.0% increase in hotels and restaurants. The financial services sector increased by 0.1% compared to 2021.
In 2023, the services sector increased by 0.8% compared to 2022. This increase was primarily driven by a 1.6% increase in real estate, business and rental services and a 2.0% increase in education, social and health services real estate. The financial services sector decreased by 2.7% compared to 2022.
In 2024, the services sector decreased by 2.1% compared to 2023. This decrease was primarily driven by a 7.2% decrease in wholesale and retail trade and repair services, a 1.3% decrease in public administration services and a 0.3% decrease in real estate, business and rental services. The financial services sector decreased by 4.1% compared to 2023.
In 2025, the services sector increased by 3.8% compared to 2024. This increase was primarily driven by an 8.4% increase in hotels and restaurants, a 3.8% increase in wholesale and retail trade and repair services and a 3.6% increase in real estate, business and rental services. The financial services sector increased by 25.0% compared to 2024.
Telecommunications
The telecommunications sector has grown since 2001. Much of this growth has resulted from a substantial increase in the use of mobile communications, which have become increasingly common in Argentina as more affordable cellular phone plans have become available and consumers’ purchasing power has improved.
In September 2020, the Government adopted the Plan Conectar (Connect Plan) to reduce the digital gap, extend ICT service access, and expand broadband nationwide through the efficient use of national and provincial infrastructure. Under the Connect Plan, progress was made in the development of (i) the ARSAT-SG1 geostationary satellite, the first electric propulsion satellite built in Argentina, and (ii) the ARSAT-SG2 satellite, aimed at increasing internet traffic flexibility, expanding capacity, and enhancing ARSAT’s international competitiveness. Further, investments were made to expand the storage and cybersecurity capacity of ARSAT’s national data center, alongside IADB-financed programs to enhance broadband speed and coverage nationwide.
In 2024, the Ente Nacional de Comunicaciones (National Communications Entity or “ENACOM”) authorized the use of certain foreign satellite-based internet providers in the country, which resulted in a 1,400% increase in satellite internet connections from 3,400 users in September 2023 to 46,000 users in September 2024. Further, on April 10, 2024, the Government repealed Decree No. 690/20. Such repeal (i) removed the ability of the Government to regulate the prices of telecommunications services such as mobile telephony, internet, and cable television, (ii) allowed service providers to set prices and (iii) promoted the entry of new competitors to the market.
In 2025, ENACOM continued to implement reforms to the telecommunications market. In particular, ENACOM reduced the maximum spectrum accumulation limit for the Servicio de Telecomunicaciones Fiables e Inteligentes (Reliable and Intelligent Telecommunications Service), used to provide 5G services, from 200 MHz to 150 MHz per licensee for each area of operation. According to ENACOM, this measure is expected to (i) promote market competition, (ii) improve equity in spectrum allocation and (iii) maintain service quality, given the efficiency levels achievable under current 5G technology. Further, ENACOM announced that as of June 2025, satellite internet access increased significantly as a result of the entry into the country of new non-geostationary satellite providers.
Role of the State in the Economy
State-Owned and State-Controlled Entities
The Government carries out certain functions through state-owned and state-controlled enterprises, each of which is a separate legal entity, including the following:
| | Aerolíneas Argentinas S.A. (“Aerolíneas Argentinas”), the country’s largest airline; |
D-51
| | Banco de la Nación Argentina (“Banco Nación”), a state-controlled financial institution; |
| | Banco de Inversión y Comercio Exterior S.A. (“BICE”); |
| | Agua y Saneamientos Argentinos S.A. (“AYSA”), which provides essential services of potable water and sanitation; |
| | Correo Oficial de la República Argentina (“Correo Argentino”), the national postal service; |
| | Energía Argentina S.A. (“ENARSA”), a state-controlled energy company; |
| | Belgrano Cargas y Logística S.A. (“Belgrano Cargas”), a state-controlled freight railway Company; |
| | Sociedad Operadora Ferroviaria S.E. (“SOFSE”), the state-owned railway passenger operator; and |
| | YPF, an Argentine energy company. |
State Involvement in the Economy
Following the crisis of 2001 to 2002, between 2003 and 2023, the Government reversed a number of measures implemented during the 1990s to deregulate the economy and reduce government intervention. The Government re-introduced several state controls, most notably the following:
| | the absorption and replacement of the former private pension system for a public “pay as you go” pension system, as well as the transfer of all resources previously administered by the private pension funds, including equity interests in a wide range of listed companies, to the FGS to be administered by ANSES; |
| | direct involvement in the oil and gas industry through the creation of ENARSA, the enactment of the Hydrocarbons Law (defined below) and the expropriation of 51% of the shares of YPF; |
| | increased regulation of utility companies; |
| | the revocation of concessions for certain public services (including several railway lines and water services); |
| | restrictions on capital transfers and other monetary transactions (see “Monetary System—Regulation of the Financial Sector”); |
| | continued price controls on transportation and agricultural and energy products (see “—Gross Domestic Product—Primary Production”); |
| | export tariffs on agricultural products (see “Balance of Payments— Current Account—Trade Regulation”); |
| | subsidies to the energy and transportation sectors; and |
| | export regulations (see “Balance of Payments—Current Account—Trade Regulation”). |
In December 2008, Congress approved a law declaring that the shares of Aerolíneas Argentinas, its affiliate Líneas Aéreas Cielos del Sur S.A. (“Austral”) and their subsidiaries, Optar S.A., Jet Paq S.A. and Aerohandling S.A. were “of public interest” and therefore subject to expropriation in accordance with Law No. 21,499 (the “Argentine Expropriation Law”). Under the valuation guidelines established in the Argentine Expropriation Law, the Tribunal de Tasaciones de la Nación (National Valuation Tribunal), estimated that these entities had an aggregate negative value approximately ranging between U.S.$602.0 million and U.S.$872.0 million. For a discussion of related arbitration proceedings, see “Public Sector Debt—Legal Proceedings—ICSID Arbitration.”
Since assuming office in December 2023, and with the objective of reducing public sector deficit, the Milei administration implemented an economic program focused on rationalizing public sector spending that reverted to some extent the measures described above. See ““The Argentine Economy—The Milei Administration.”
D-52
Oil and Gas Industry
Transfers on account of subsidies to the energy sector totaled Ps.1,050.8 billion in 2021, Ps.1,657 billion in 2022, Ps.2,951.7 billion in 2023, Ps.6,484.1 billion in 2024 and Ps.5,712.0 billion in 2025.
The following table shows the proved reserves of petroleum and natural gas in Argentina as of the dates specified.
Proved Reserves
| 2021 | 2022 | 2023 | 2024 | 2025 | ||||||||||||||||
| Crude oil(1) |
451,231 | 465,424 | 477,270 | 491,836 | 624,718 | |||||||||||||||
| Natural gas(2) |
415,988 | 451,763 | 487,472 | 546,272 | 583,219 | |||||||||||||||
| (1) | In thousands of cubic meters. |
| (2) | In millions of cubic meters. |
Source: Ministry of Energy and Mining.
In 2025, hydrocarbon production in Argentina reached its highest level in more than 20 years, as reforms set forth in the Ley de Bases in 2024 continued to advance, including (i) further progress toward opening the sector to international trade, (ii) the authorization of free imports and exports of hydrocarbons, and (iii) further progress toward market-based pricing in the domestic market, without government intervention in price determination.
In April 2025, a 525 km private oil pipeline, representing an investment of approximately U.S.$1.4 billion, was inaugurated, connecting the Vaca Muerta formation with Puerto Rosales. The project increased oil transport capacity, created approximately 2,400 new jobs, is expected to contribute approximately U.S.$8 billion to Argentina’s trade balance and increased daily oil exports by approximately 35,000 barrels.
Energy sector reforms
In early 2004, Argentina began to experience energy shortages, which initially let to a decrease of natural gas and other energy exports but over time affected the entire Argentine economy. Since then, the Government has adopted multiple measures to improve infrastructure and increase installed power generation capacity.
In 2015, the Government took various actions designed to ensure the supply of electricity to the country. The measures adopted by the Government aimed at increasing energy generation by tendering thermal and renewable energy projects and creating a free market for renewable energies. Between 2017 and 2021, 37 new thermal projects for a total of 4,507 MWs became operative, and four projects for a total of 456 MWs were under construction as of the date of this Annual Report.
Further, as a result of tender offers, between 2017 and 2022, 100 new renewable energy projects became operative and 32 projects for 954 MWs started commercial operations in the free market. As of the date of this Annual Report, 73 projects for a total of 1,525 MWs were under development, distributed in 19 of the 23 provinces.
Together with the measures designed to increase supply, the Government sought to increase tariffs with a view to eliminating subsidies. These later set of measures suffered judicial challenge and were initially delayed in their implementation. Ultimately, the effectiveness of these measures was further undermined by the impact of the continued depreciation of the peso. Finally, the Government sought to reduce the burden of energy subsidies mainly for the Greater Buenos Aires region on the federal budget by transferring the responsibility and cost of these measures to the provincial governments.
With respect to natural gas, in 2012, the Government launched “Gas Plans” to promote gas production, whereby the production of “new” gas above the decline rate of the fields was paid at U.S.$7.5/MBTU. After a transitional period involving regulation of wellhead prices, commencing in 2018, the negotiation of prices between distribution companies and domestic producers of natural gas and intermediaries is free.
In November 2020, the Government announced a plan aimed at ensuring that the level of gas production is adequate to supply the increased summer demand (the “Plan GasAr”). The program is implemented through contracts between producers, distributors and CAMMESA, with prices determined via auctions organized by the Secretariat of Energy, and includes a four-year term (extendable, with longer terms for offshore projects) and minimum supply commitments supported by producer investment plans. It also provides preferential export conditions, allows partial government subsidies to mitigate end-user costs, and contemplates mechanisms to facilitate repatriation of investments and servicing of foreign financing. In addition, the Plan GasAr contemplates various sanctions for failures by participating entities to fulfill their commitments.
During 2022, the construction of the Perito Moreno Gas Pipeline (formerly, the Néstor Kirchner Gas Pipeline) connecting the provinces of Neuquén and Buenos Aires made headway. The gas pipeline was originally designed to:
| | increase gas transportation capacity from the Vaca Muerta formation to the main consumption centers in the country by 11 million m3 per day; |
D-53
| | increase gas supply to end-users and power generation plants that supply the Buenos Aires Metropolitan area; |
| | replace fuel imports by U.S.$2.2 billion per year, decreasing foreign currency demand; and |
| | increase direct and indirect employment and support the development of suppliers. |
Operations of the gas pipeline started in July 2023. In October 2024, the pipeline’s transportation capacity stood at 21 million m3 per day. In October 2025, the Government awarded Transportadora de Gas del Sur (TGS) the privately financed expansion of the pipeline, which is expected to increase the pipeline’s transportation capacity to 35 million m³ per day by 2027. In May 2026, the project was approved under the RIGI, with an estimated investment of U.S.$550 million. According to TGS’ estimates, the expansion is expected to improve the trade balance by more than U.S.$700 million per year and to generate fiscal savings of approximately U.S.$450 million per year, by replacing imports of LNG and liquid fuels used for power generation.
In August 2022, the Government implemented a tariff segmentation scheme aimed at organizing electricity and gas subsidies based on the economic capacity of each household. The scheme foresees the creation of a registry for households in need of subsidies. With the objective of achieving reasonable and fair tariffs for the prices of electricity, gas, and water, the scheme divides households into three groups, and reduces existing subsidies depending on the income group to which each household corresponds to.
In September 2022, due to the increases in natural gas production, particularly in the Neuquén Basin, and the increase in transportation capacity after the construction of the Perito Moreno Gas Pipeline, the Government announced the extension of Plan GasAr until 2028.
In December 2023, through the enactment of Decree No. 55/2023, the Government declared a state of emergency for Argentina’s national energy sector, covering electricity generation, transportation, and distribution, as well as natural gas transportation and distribution until the end of 2024, which was subsequently extended until July 9, 2026 by Decrees No. 1023/24 and 370/25. This measure aimed to ensure the continuous provision of these essential services under appropriate technical and economic conditions for both service providers and users. Decree No. 70/2023 extended the emergency to broader economic, financial, and social matters until December 31, 2025, in response to the severe economic crisis in Argentina.
In 2024, to stabilize the energy sector, tariff adjustments were implemented by the Secretariat of Energy, with temporary postponements during mid-2024 to support the disinflation process, including measures to reform the energy sector, focusing on adjusting subsidies in line with Decree No. 332/2022, which established user segmentation based on income. In addition, through the enactment of Decree No. 465/2024, the Government modified the subsidy regime and introduced a transition period until the end of 2024, which was subsequently extended until July 9, 2026 by Decree No. 370/25. The new regime is aimed at moving from a generalized subsidy regime to one targeting vulnerable users, by reducing overlapping subsidies while gradually passing real energy prices to end-users, particularly those in middle- and low-income categories. The transition to the new regime involved a segmentation of users for cost-related tariff adjustments, limits in subsidized energy consumption and the elimination of the automatic inclusion of users in subsidy registries, among others.
In 2025, the Government commenced a regularization process of the wholesale power market, which included the following measures:
| | Debt Regularization: the Government implemented a debt regularization plan with the distribution companies and cooperatives that were indebted to the wholesale electricity market administration company (CAMMESA). |
| | Power Transmission: the Government introduced the Plan Nacional de Ampliación del Transporte Eléctrico (National Power Transmission Expansion Plan), financed by the private sector, and successfully launched two calls for proposals (tenders) to incorporate battery energy storage systems at critical nodes. |
| | Concessions: in December 2025, the Government signed 30-year concession and share transfer agreements for the Comahue hydroelectric dams, following a national and international public tender with eight participating bidders. The process generated proceeds of approximately U.S.$707 million, which were collected in January 2026, when the new operators took possession of the facilities. The concessionaires also committed to modernization and refurbishment works estimated at approximately U.S.$400 million. Further, progress was made on the privatization of ENARSA, and the regulation of the ENARGAS. |
| | Energy Subsidies: the Government introduced a new targeted scheme focused on vulnerable groups using a geolocation tool to remove the benefit from users living in high-income areas of the northern and southern Buenos Aires Metropolitan Area. |
D-54
| | Energy Storage: the Government launched a public tender for the AMBA I project, as well as the Alma SADI call, to incorporate battery energy storage systems at critical nodes across the Northwest (NOA), Northeast (NEA), Central, Litoral, Cuyo, and Buenos Aires regions (excluding AMBA), for a total capacity of 700 MW. |
| | Privatization: the Government sold its participation in Citelec, the controlling company of Transener and launched a tender to assign the Los Nihuiles hydroelectric system concession. |
During 2021, the year-on-year increase in the price of energy in the wholesale electricity market for end-users totaled 14% (Ps.2,448/MWh on average as of December 31, 2021 compared to Ps.2,154/MWh as of December 31, 2020 on average), while the increase in the price of natural gas for residential end-users was 14% (Ps.205/MMBtu on average as of December 31, 2021 compared to Ps.180/MMBtu on average as of December 31, 2020).
During 2022, the year-on-year increase in the price of energy in the wholesale electricity market for end-users totaled 90% (Ps.4,652/MWh on average as of December 31, 2022 compared to Ps.2,448/MWh as of December 31, 2021 on average), while the increase in the price of natural gas for residential end-users was 82% (Ps.373/MMBtu on average as of December 31, 2022 compared to Ps.205/MMBtu on average as of December 31, 2021).
During 2023, the year-on-year increase in the price of energy in the wholesale electricity market for end-users totaled 115% (Ps.10,025/MWh on average as of December 31, 2023 compared to Ps.4,652/MWh as of December 31, 2022 on average), while the decrease in the price of natural gas for residential end-users was 68% (U.S.$0.75/MMBtu on average as of December 31, 2023 compared to U.S.$2.35/MMBtu on average as of December 31, 2022), mainly as a result of the increase in the exchange rate.
During 2024, the year-on-year increase in the price of energy in the wholesale electricity market for end-users totaled 345% (Ps.44,568/MWh on average as of December 31, 2024 compared to Ps.10,025/MWh as of December 31, 2023 on average), while the increase in the price of natural gas for residential end-users was 2.53% (U.S.$2.00/MMBtu on average as of December 31, 2024 compared to U.S.$1.95/MMBtu on average as of December 31, 2023), mainly as a result of the increase in the exchange rate.
During 2025, the year-on-year increase in the price of energy in the wholesale electricity market for end-users totaled 49% (Ps.66,266/MWh on average as of December 31, 2025 compared to Ps.44,568/MWh as of December 31, 2024 on average), while the increase in the price of natural gas for residential end-users was 22% (U.S.$2.45/MMBtu on average as of December 31, 2025 compared to U.S.$2.00/MMBtu on average as of December 31, 2024), mainly as a result of the reduction of the discount percentages applicable to residential users under the segmentation scheme in force at the time, together with a greater pass-through of costs to demand.
Incentive Regime for Large Investments
On July 8, 2024, the Government issued Law No. 27,742, approving the RIGI, which is aimed at providing predictability, legal certainty and setting clear rules for the development of large investments, particularly those with export potential, and therefore boosting employment and growth. The RIGI seeks to develop investments in strategic sectors such as oil and gas, mining, renewable energies, forestry, steel, technology, infrastructure and tourism. To qualify for the regime, several requirements must be met, including a minimum investment of U.S.$200 million and the submission of both an application and a detailed investment plan. Each project is subject to approval by an evaluation committee responsible for reviewing applications to join the RIGI.
On January 8, 2025, the Government approved the first project under the RIGI, consisting of a 305-megawatt photovoltaic park by YPF Energía Eléctrica (“YPF Luz”) in the province of Mendoza, which will generate an investment of U.S.$211 million.
Within the framework of the RIGI, in May 2025, one of the world’s largest mineral reserves was found in the province of San Juan by the mining companies Lundin Mining and BHP. With an estimated production of 13 million tons of copper, the reserve is expected to produce approximately 32 million ounces of gold and 659 million ounces of silver.
In addition, as part of the RIGI, a producer of steel products (Sidersa) has announced its intention to invest U.S.$286 million to build a state-of-the-art steel factory, which is expected to create more than 300 direct jobs and 4,000 indirect jobs. The steel factory is the first industrial project to enter the RIGI framework and part of the 14 projects already approved as part of the RIGI framework, amounting to a total investment of approximately U.S.$16.2 billion.
Privatization Policy
The Milei administration has advanced its privatization and restructuring efforts involving several state-owned companies across various industries, as permitted by Law No. 27,742, which authorized the total or partial privatization of certain companies wholly or majority owned by the State. This privatization initiative is part of the Milei administration’s broader goal of reducing government spending, modernizing the public sector, and promoting a leaner and more efficient public administration.
D-55
In February 2025, the Government enacted a decree converting Banco Nación into a state-controlled joint-stock limited company, marking the initial step toward its potential privatization. Despite this structural change, as of the date of this Annual Report, the Argentine state retained ownership of 99.9% of Banco Nación’s share capital, with the remaining 0.1% held by the Banco Nación Foundation.
In 2025, the Government initiated the privatization process of AySA, a public company dedicated to providing water and sewer services. The Government is considering incorporating private capital through the transfer of 90% of shares of AySA. The proposed scheme combines a national and international public tender to select a strategic operator and an initial public offering of AySA’s shares. The plan provides for the participation of employees as shareholders through an employee share ownership program, which is expected to amount to 10% of the share capital. The privatization process is expected to be regulated and monitored by the CNV to ensure its transparency. Further, in 2025, the Government also initiated the privatization process of Belgrano Cargas y Logística S.A.
Employment and Labor
Unemployment and Underemployment
INDEC prepares a series of indices used to measure the social, demographic and economic characteristics of the Argentine population based on data generally collected in the Permanent Household Survey (Encuesta Permanente de Hogares, or “EPH”).
D-56
The following table sets forth employment figures for the periods indicated.
Employment and Unemployment Rates(1)
| Fourth quarter of 2021 |
Fourth quarter of 2022 |
Fourth quarter of 2023 |
Fourth quarter of 2024 |
Fourth quarter of 2025 |
||||||||||||||||
| Greater Buenos Aires Area: |
||||||||||||||||||||
| Labor force rate(2) |
47.6 | % | 48.3 | % | 49.4 | % | 49.9 | % | 49.3 | % | ||||||||||
| Employment rate(3) |
44.1 | 45.0 | 46.2 | 46.4 | 45.1 | |||||||||||||||
| Unemployment rate(4) |
7.4 | 7.0 | 6.5 | 7.1 | 8.6 | |||||||||||||||
| Underemployment rate(5) |
11.6 | 10.4 | 10.2 | 11.3 | 11.1 | |||||||||||||||
| Major interior cities:(1) |
||||||||||||||||||||
| Labor force rate(2) |
46.0 | 46.8 | 47.6 | 47.5 | 47.8 | |||||||||||||||
| Employment rate(3) |
43.0 | 44.2 | 45.3 | 44.8 | 44.8 | |||||||||||||||
| Unemployment rate(4) |
6.4 | 5.5 | 4.8 | 5.7 | 6.2 | |||||||||||||||
| Underemployment rate(5) |
12.7 | 11.5 | 10.8 | 11.3 | 11.7 | |||||||||||||||
| Total urban: |
||||||||||||||||||||
| Labor force rate(2) |
46.9 | 47.6 | 48.6 | 48.8 | 48.6 | |||||||||||||||
| Employment rate(3) |
43.6 | 44.6 | 45.8 | 45.7 | 45.0 | |||||||||||||||
| Unemployment rate(4) |
7.0 | 6.3 | 5.7 | 6.4 | 7.5 | |||||||||||||||
| Underemployment rate(5) |
12.1 | % | 10.9 | % | 10.5 | % | 11.3 | % | 11.3 | % | ||||||||||
| (1) | Figures are based on 31 major cities. The current methodology to measure EPH is applied to every major city except Rawson, Trelew, San Nicolás, Villa Constitución, Concordia, Gran Paraná, Gran Mendoza, Gran Resistencia, Gran San Juan, La Rioja, Santiago del Estero, La Banda, which are not covered under the current methodology due to resource constraints in such cities. |
| (2) | The labor force consists of the sum of the employed population and the population that is unemployed but actively seeking employment. |
| (3) | Employed population as a percentage of the labor force. To be considered employed, a person above the minimum age requirement must have worked a minimum of (i) one hour with remuneration, or (ii) 15 hours without remuneration during the week preceding the date of measurement. |
| (4) | Unemployed population as a percentage of the labor force. The unemployed population does not include the underemployed population. |
| (5) | Underemployed population as a percentage of the labor force. Workers are considered underemployed if they work fewer than 35 hours per week and wish to work more. |
Source: INDEC and Ministry of Economy
The Informal Economy
Argentina’s economy has an informal segment composed primarily of employees not registered with Argentina’s social security system but conducting legitimate businesses. Because of its nature, the informal segment of Argentina’s economy cannot be readily tracked through statistical information or other reliable data activities.
Activities include small businesses, usually those owned by individuals and families, that produce and exchange legal goods and services but may not have the appropriate business permits, report their tax liability, comply with labor regulations or have legal guarantees in place for suppliers and end users. As of the fourth quarter of 2025, the Ministry of Economy (based on INDEC’s EPH) estimates that the informal economy employed 36.3% of the total labor force compared to 33.3% as of the fourth quarter of 2021.
D-57
The following table provides the estimated percentage of workers in Argentina’s formal and informal economies for the periods specified.
Formal and Informal Economies(1)
(% of total)
| Fourth quarter of 2021 |
Fourth quarter of 2022 |
Fourth quarter of 2023 |
Fourth quarter of 2024 |
Fourth quarter of 2025 |
||||||||||||||||
| Formal |
66.7 | % | 64.5 | % | 64.3 | % | 63.9 | % | 63.7 | % | ||||||||||
| Informal |
33.3 | % | 35.5 | % | 35.7 | % | 36.1 | % | 36.3 | % | ||||||||||
|
|
|
|
|
|
|
|
|
|
|
|||||||||||
| Total |
100.0 | % | 100.0 | % | 100.0 | % | 100.0 | % | 100.0 | % | ||||||||||
|
|
|
|
|
|
|
|
|
|
|
|||||||||||
| (1) | Figures presented here do not include participants in the Heads of Households Program and individuals under the age of 18. |
Source: INDEC and Ministry of Economy.
The following table sets forth private sector employment data by economic sector for the periods specified.
Employment
(% by economic sector)(1)
| 2021 | 2022 | 2023(2) | 2024 | 2025 | ||||||||||||||||
| Primary production: |
||||||||||||||||||||
| Agriculture, livestock, fisheries and forestry |
5.8 | % | 5.5 | % | 5.2 | % | 5.5 | % | 5.5 | % | ||||||||||
| Mining and extractives (including petroleum and gas) |
1.4 | 1.4 | 1.4 | 1.5 | 1.4 | |||||||||||||||
|
|
|
|
|
|
|
|
|
|
|
|||||||||||
| Total primary production |
7.2 | 6.9 | 6.7 | 7.0 | 6.9 | |||||||||||||||
|
|
|
|
|
|
|
|
|
|
|
|||||||||||
| Secondary production: |
||||||||||||||||||||
| Manufacturing |
18.7 | 18.7 | 18.7 | 18.7 | 18.4 | |||||||||||||||
| Construction |
6.1 | 6.8 | 7.0 | 5.9 | 5.9 | |||||||||||||||
| Electricity, gas and water |
1.2 | 1.1 | 1.1 | 1.1 | 1.1 | |||||||||||||||
|
|
|
|
|
|
|
|
|
|
|
|||||||||||
| Total secondary production |
26.0 | 26.6 | 26.8 | 25.7 | 25.5 | |||||||||||||||
|
|
|
|
|
|
|
|
|
|
|
|||||||||||
| Trade |
17.9 | 18.0 | 18.4 | 18.9 | 19.3 | |||||||||||||||
| Services |
48.9 | 48.6 | 48.2 | 48.4 | 48.3 | |||||||||||||||
|
|
|
|
|
|
|
|
|
|
|
|||||||||||
| Total |
100.0 | % | 100.0 | % | 100.0 | % | 100.0 | % | 100.0 | % | ||||||||||
|
|
|
|
|
|
|
|
|
|
|
|||||||||||
| (1) | Annual average for each year indicated. |
Source: INDEC and Ministry of Economy.
Labor Regulation
Labor unions in Argentina exercise significant influence in the collective bargaining process. Both local and federal unions have staged various strikes in recent years to protest for salary increases. Strikes and demonstrations tend to have brief but significant impacts on transportation, and succeed in bringing production in various sectors of the economy to a temporary halt, in most cases for periods of only a few days.
Labor Reform
On February 2026, Congress enacted the Labor Modernization Law (Law No. 27,802). The law is aimed at modernizing the regulatory framework, reducing bureaucratic processes and addressing regulatory rigidities that were considered to have constrained formal employment growth. The legislation seeks to, among others:
| | Centralized Labor Registration System: establish a centralized, digital labor registration system administered by the general administration of public revenues entity (ARCA, previously known as AFIP). No additional registrations may be required by other governmental authorities. This measure is aimed at eliminating administrative duplication and reducing compliance costs for employers. |
D-58
| | Procedural Modernization and Operational Flexibility: modernize administrative procedures through digitalization of processes and registrations, and the elimination of unnecessary formalities. These reforms seek to reduce reliance on paper-based documentation, redundant certifications and multiple registrations with different governmental agencies. The law also introduced greater flexibility in working hours through hour-banking and other scheduling arrangements. |
| | Labor Formalization Incentives and Promotion Program: establish explicit incentives for labor formalization through the Régimen de Promoción del Empleo Registrado (Registered Employment Promotion Program), allowing for the regularization of existing employment relationships prior to the law’s enactment. Principal benefits include: (i) condonation of labor and social security fines, sanctions and infractions, (ii) extinguishment of criminal tax liability related to unregistered employment and (iii) removal from the Registro Público de Empleadores con Sanciones Laborales (Registry of Employers with Labor Sanctions or “REPSAL”). |
| | Labor Assistance Fund: create the Fondo de Asistencia Laboral (Labor Assistance Fund) a mandatory mechanism designed to assist private-sector employers in pre-funding statutory severance payments by accumulating resources in individual accounts through monthly contributions (1.0% for large companies and 2.5% for MSMEs), channeled through ARCA. |
| | Collective Bargaining Agreement Reforms: reconfiguration of the collective bargaining agreement system, including limitations on the effectiveness of an agreement upon its expiration of the an agreement, allowing only for certain clauses to remain in effect until execution of a new agreement. The law contemplates mechanisms allowing the administrative labor authority to suspend the effects of certain collective bargaining agreement provisions when their application generated severe economic distortions, subject to specific conditions and safeguards. Such measures may not affect minimum legal rights or constitutional guarantees. |
Wages and Labor Productivity
The Ministry of Employment and Social Security, through the Wage Council, sets a single minimum wage annually for all sectors of the economy, based on macroeconomic indicators such as GDP growth and inflation. The minimum monthly wage for public and private employees was increased by 55.4% in 2021, 93.6% in 2022, 151.8% in 2023, 79.3% in 2024 and 19.7% in 2025, in each case as compared to the previous year and considering data as of December of each year.
The following table provides the average monthly minimum nominal wage of Argentine employees, including estimates for those employed in the informal economy, for the years specified.
Average Monthly Minimum Nominal Wage
(in current pesos)
| For the year ended December 31, |
Average Monthly Minimum Wage |
Average Cost of Basic Basket (1) |
Average Monthly Minimum Wage (as a % of Average Cost of Basic Basket) |
|||||||||
| 2021 |
26,533 | 66,510 | 40 | % | ||||||||
| 2022 |
45,034 | 112,395 | 40 | % | ||||||||
| 2023 |
102,126 | 272,513 | 37 | % | ||||||||
| 2024 |
236,339 | 869,286 | 27 | % | ||||||||
| 2025 |
312,266 | 1,150,651 | 27 | % | ||||||||
| (1) | Average cost of a basket of essential goods and services for a “reference” family used to define the poverty line. A “reference” family is considered a family of four: two adults, one male, age 35, and one female, age 31, and two children, ages 6 and 8. |
Source: Ministry of Employment and Social Security and Ministry of Economy.
D-59
The following table provides the percentage change in the nominal wage of Argentine employees for the years specified.
Nominal Wage
(% change from prior year)
| Private Sector | Public Sector |
Total | ||||||||||||||
| Formal | Informal | |||||||||||||||
| December 2021 |
55.3 | 40.5 | 58.7 | 53.4 | ||||||||||||
| December 2022 |
93.8 | 65.4 | 99.4 | 90.4 | ||||||||||||
| December 2023 |
165.8 | 115.3 | 148.6 | 152.7 | ||||||||||||
| December 2024 |
147.5 | % | 196.7 | % | 119.3 | % | 145.5 | % | ||||||||
| December 2025 |
28.7 | % | 87.9 | % | 28.9 | % | 38.2 | % | ||||||||
Source: Ministry of Economy, based on information provided by INDEC.
Poverty and Income Distribution
The measurement of poverty is based on a basket of goods and services (consisting primarily of food, clothing, transportation, health care, housing and education), which is considered the minimum necessary to sustain an individual. “Essential goods and services” in the basket that the Government has subsidized include natural gas, electricity, bus transportation and suburban and urban mass transportation, rail transportation, subway transportation, fuel and education.
In the second half of 2021, 27.9% of Argentina’s households and 37.3% of the population stood below the poverty line, while 6.1% of the households and 8.2% of the population stood below the extreme poverty line.
In the second half of 2022, 29.6% of Argentina’s households and 39.2% of the population stood below the poverty line, while 6.2% of the households and 8.1% of the population stood below the extreme poverty line.
In the second half of 2023, 31.8% of Argentina’s households and 41.7% of the population stood below the poverty line, while 8.7% of the households and 11.9% of the population stood below the extreme poverty line.
In the second half of 2024, 28.6% of Argentina’s households and 38.1% of the population stood below the poverty line, while 6.4% of the households and 8.2% of the population stood below the extreme poverty line.
In the second half of 2025, 21.0% of Argentina’s households and 28.2% of the population stood below the poverty line, while 4.8% of the households and 6.3% of the population stood below the extreme poverty line.
The following table sets forth the poverty levels in Argentina:
Poverty (1)
(% of population)
| Second half of |
Households | Population | ||||||
| 2021 |
27.9 | 37.3 | ||||||
| 2022 |
29.6 | 39.2 | ||||||
| 2023 |
31.8 | 41.7 | ||||||
| 2024 |
28.6 | % | 38.1 | % | ||||
| 2025 |
21.0 | % | 28.2 | % | ||||
| (1) | The poverty line is based on the estimated cost of a basket of essential goods and services during a given period, which varies depending on the characteristics of each individual and each household. For instance, men between the ages of 30 and 60 who earned less than Ps.423,531.80 per month during December 2025 lived below the poverty line. For households, a family of four (two adults, one male age 35 and one female age 31, and two children ages 6 and 8) that earned in total less than Ps.1,308,713.26 per month during December 2025 lived below the poverty line. |
Source: INDEC and Ministry of Economy.
D-60
INDEC’s assessment of the essential goods and services basket for the Greater Buenos Aires area indicated that a standard family required Ps.1,308,713.26 to gain access to the essential goods and services basket in December 2025, compared to Ps.1,024,435.21 in December 2024.
According to INDEC, in December 2025, the essential food basket for households stood at Ps.589,510.48, compared to Ps.449,313.69 in December 2024.
From the fourth quarter of 2021 to the fourth quarter of 2025, the top 10% of the population in Argentina, in terms of annual income, increased their contribution to the total national income by approximately 2.7 percentage points, while the top 20% of the population in Argentina, in terms of annual income, increased their contribution to the total national income by 2.4 percentage points. During the same period, the bottom 40% of the population’s contribution to the total national income decreased their contribution by 1.1%.
In the fourth quarter of 2025, the top 10% of the population in Argentina accounted for 32.7% of total national income, the top 20% of the population accounted for 48.9% of total national income and the bottom 40% of the population accounted for 13.9% of the total national income.
The table below sets forth figures on the distribution of income as of the dates specified.
Evolution of Income Distribution
(% of total national income)
| Fourth quarter of | ||||||||||||||||||||
| Income group |
2021 | 2022 | 2023 | 2024 | 2025 | |||||||||||||||
| Lowest 40% |
15.0 | % | 15.0 | % | 13.9 | % | 13.9 | % | 13.9 | % | ||||||||||
| Next 20% |
15.6 | 15.4 | 14.7 | 14.7 | 15.0 | |||||||||||||||
| Next 20% |
23.0 | 22.7 | 22.7 | 23.1 | 22.2 | |||||||||||||||
| Highest 20% |
46.5 | 47.0 | 48.7 | 48.4 | 48.9 | |||||||||||||||
| Highest 10% |
30.0 | % | 30.2 | % | 32.1 | % | 32.0 | % | 32.7 | % | ||||||||||
Source: INDEC and Ministry of Economy.
Environment
Beginning in 2002, Argentina has initiated various measures to regulate, monitor and improve environmental standards. The majority of these measures require industrial companies to meet increasingly stringent safety standards.
In 2002, Argentina enacted the Ley General de Medioambiente (General Environment Law), ratifying the formation of the Consejo Federal de Medioambiente (Federal Environmental Council), responsible for the creation of a comprehensive environmental policy, the coordination of regional and national programs and strategies for environmental management, the formulation of policies for the sustainable use of environmental resources, the promotion of economic development and growth planning, the supervision of and conduct environmental impact studies, the establishment of environmental standards, and for carrying out comparative studies and managing the international financing of environmental projects. In addition, as a member of the Kyoto Protocol, Argentina has implemented various regulations aimed at curbing greenhouse gas emissions.
Measures enacted to strengthen monitoring and enforcement to ensure compliance with environmental standards include the following:
| | Law No. 26,011, which was enacted in 2007, approved the Stockholm Agreement relating to persistent organic contaminants; |
| | the Proyecto de Desarrollo Sustentable de la Cuenca Matanza – Riachuelo (Cuenca Matanza – Riachuelo Sustainable Development Program) earmarks a portion of its funds for use in purchasing computing equipment to strengthen the Autoridad de Cuenca Matanza Riachuelo (Cuenca Matanza Riachuelo Authority) under the supervision of the Secretaría de Ambiente y Desarrollo Sustentable de la Jefatura de Gabinete de Ministros (Department for Environmental and Sustainable Development of the Cabinet of Ministers). In March 2016, the Government signed an agreement with the World Bank to finance the Cuenca Matanza – Riachuelo Sustainable Development Program for a total cost of approximately U.S.$1 billion; |
D-61
| | Proyecto Nacional para la Gestión Integral de los Residuos Sólidos Urbanos (National Project for the Management of Urban Solid Waste) is the first national project aimed at implementing solutions to waste problems through sustainable measures. The project provides technical and financial assistance for the development of infrastructure and related systems as an incentive for provinces and municipalities to develop their own plans and comprehensive management systems; |
| | Unidad de Medio Ambiente (Environmental Unit) supports sustainable industrial development in Argentina by promoting environmental factors as a means of improving efficiency and competitiveness; |
| | El Fondo integral para el Desarrollo Regional (FONDER) finances the development of productive activities and services focused on the needs of medium- small- and micro- enterprises (“MSMEs”) and sectors with the aim of promoting job creation, increasing exports and developing local markets; and |
| | In June 2021, Congress enacted Law No. 27,621 establishing environmental education at all grade levels to raise awareness on the importance of environmental protection. |
| | During 2024, the Government strengthened the Fondo Nacional Para el Enriquecimiento y la Conservacion de los Bosques Nativos (National Fund for the Enrichment and Conservation of Native Forests) through the approval of 203 management and conservation plans. In addition, the Government increased the capacity of the Servicio Nacional de Manejo del Fuego (National Fire Management Service) by allowing for the training of 2,390 technicians and firefighters in 19 provinces, deploying aircraft, and preparing technical reports to anticipate critical situations and plan strategic responses. |
D-62
BALANCE OF PAYMENTS
Overview
Since June 2017, the Republic reports balance of payments statistics pursuant to a methodology based on the classification criteria set forth in the sixth edition of the Balance of Payments and International Investment Position Manual of the International Monetary Fund (IMF).
Balance of payments accounts are used to record the value of the transactions carried out between a country’s residents and the rest of the world. Argentina’s balance of payments is comprised of three accounts:
| | the current account, which reflects a broad measure of the country’s international trade (goods and services), primary income (retribution for the temporary use of labor, financial resources or non-produced nonfinancial assets) and secondary income (current transfers for goods and investment income) between residents and non-residents; |
| | the capital account, which shows credit and debit entries for non-produced, non-financial assets as well as capital transfers between residents and non-residents; and |
| | the financial account, which registers net acquisition and disposal of financial assets and liabilities between residents and non-residents. |
In 2025, the Republic’s current account registered a deficit of U.S.$7.8 billion, compared to a surplus of U.S.$5.9 billion in 2024. This deficit increase was primarily due to (i) a decrease in the trade of goods surplus from U.S.$22.4 billion in 2024 to U.S.$15.4 billion in 2025, and (ii) a U.S.$6.7 billion increase in the trade of services deficit, from U.S.$4.9 billion in 2024 to U.S.$11.6 billion in 2025.
In 2025, the Republic’s capital account registered a U.S.$454.1 million surplus, representing a U.S.$176.5 million increase from the U.S.$277.6 million surplus recorded in 2024, mainly due to an increase in the sale of non-financial assets.
In 2025, the Republic’s financial account registered net inflows of U.S.$12.0 billion, mainly driven by a net inflow of U.S.$19.5 billion in the other investments account.
The following table sets forth information on the Republic’s balance of payments for the periods specified.
Balance of Payments
(in millions of U.S. dollars)
| 2021 | 2022 | 2023 | 2024 | 2025 | ||||||||||||||||
| Current account |
U.S.$ | 6,625 | U.S.$ | (3,964 | ) | U.S.$ | (22,355 | ) | U.S.$ | 5,891 | U.S.$ | (7,788 | ) | |||||||
| Trade of Goods and Services |
14,995 | 5,642 | (9,134 | ) | 17,466 | 3,758 | ||||||||||||||
| Goods(1) |
18,695 | 12,417 | (2,757 | ) | 22,404 | 15,359 | ||||||||||||||
| Credit |
77,987 | 88,771 | 67,092 | 79,760 | 87,152 | |||||||||||||||
| Debit |
59,291 | 76,355 | 69,849 | 57,356 | 71,793 | |||||||||||||||
| Services(2) |
(3,700 | ) | (6,775 | ) | (6,376 | ) | (4,938 | ) | (11,601 | ) | ||||||||||
| Credit |
9,589 | 14,416 | 16,320 | 17,116 | 18,341 | |||||||||||||||
| Debit |
13,289 | 21,191 | 22,697 | 22,054 | 29,942 | |||||||||||||||
| Primary Income (Earnings) |
(9,773 | ) | (11,577 | ) | (15,301 | ) | (13,820 | ) | (14,079 | ) | ||||||||||
| Employee Compensation |
(120 | ) | (95 | ) | (135 | ) | (96 | ) | (98 | ) | ||||||||||
| Investment Earnings |
(9,653 | ) | (11,482 | ) | (15,167 | ) | (13,724 | ) | (13,981 | ) | ||||||||||
| Direct Investment |
(4,976 | ) | (6,118 | ) | (9,238 | ) | (8,199 | ) | (7,245 | ) | ||||||||||
| Portfolio Investments |
(1,392 | ) | (2,064 | ) | (1,986 | ) | (1,768 | ) | (2,669 | ) | ||||||||||
| Other Investments |
(3,291 | ) | (3,465 | ) | (4,296 | ) | (4,017 | ) | (4,400 | ) | ||||||||||
| Reserve Assets |
6 | 166 | 354 | 260 | 332 | |||||||||||||||
| Secondary Income (Current Transfers) |
1,402 | 1,971 | 2,080 | 2,246 | 2,532 | |||||||||||||||
| Capital Account |
253 | 192 | 190 | 278 | 454 | |||||||||||||||
| Net external financial needs |
6,878 | (3,773 | ) | (22,164 | ) | 6,169 | (7,334 | ) | ||||||||||||
| Financial Account |
4,502 | (7,437 | ) | (25,914 | ) | 2,319 | (12,003 | ) | ||||||||||||
| Central Bank |
(4,432 | ) | 6,920 | (20,825 | ) | 6,690 | 3,196 | |||||||||||||
| Reserves |
(106 | ) | 6,920 | (21,675 | ) | 6,093 | 7,221 | |||||||||||||
| Liabilities |
4,326 | — | (850 | ) | (597 | ) | 4,025 | |||||||||||||
| Deposit-Collecting Entities |
(1,610 | ) | (2,253 | ) | (4,850 | ) | 77 | (7,492 | ) | |||||||||||
| Government |
5,533 | (5,671 | ) | 4,510 | 3,176 | (20,304 | ) | |||||||||||||
| Other Sectors |
5,011 | (6,432 | ) | (4,749 | ) | (7,625 | ) | 12,596 | ||||||||||||
| Net Errors and Omissions |
(2,376 | ) | (3,665 | ) | (3,750 | ) | (3,850 | ) | (4,669 | ) | ||||||||||
| Memorandum Item |
||||||||||||||||||||
| Transactions of Reserve Assets Change |
(106 | ) | 6,920 | (21,675 | ) | 6,093 | 7,221 | |||||||||||||
| Central Bank International Reserve Variation |
275 | 4,936 | (21,525 | ) | 6,567 | 11,455 | ||||||||||||||
| Exchange Rate Adjustment |
U.S.$ | 381 | U.S.$ | (1,984 | ) | U.S.$ | 150 | U.S.$ | 473 | U.S.$ | 4,233 | |||||||||
| (1) | Goods are calculated on a FOB basis. |
| (2) | Includes import and export freight and insurance. |
Source: INDEC and Ministry of Economy.
D-63
Current Account
The Republic’s current account is comprised of the merchandise trade balance, trade in services, primary income (compensation of personnel and revenue from investment) and secondary income (current transfers). The current account registered deficits for the years 2022, 2023 and 2025, and a surplus in 2021 and 2024.
The most important drivers of the current account deficits in 2022, 2023 and 2025 were:
| | deficits in the primary income account, mainly due to interest and dividend payments; and |
| | deficits in the trade of services account, mainly due to deficits related to freight and passenger transportation, tourism and royalties. |
The main driver of the current account surplus in 2021 and 2024 was the surplus in the trade of goods account.
In 2021, the current account registered a U.S.$6.6 billion surplus, compared to the U.S.$2.7 billion surplus in 2020. This variation in the current account balance was mainly due to a U.S.$4.1 billion increase in the trade of goods account, a U.S.$2.7 billion decrease in portfolio investment outflows and a U.S.$0.5 billion decrease in other investment outflows. The trade of goods and services account registered a U.S.$15.0 billion surplus in 2021 compared to a U.S.$12.1 billion surplus in 2020. This increase in surplus was primarily driven by a U.S.$23.0 billion increase in the exports of goods account.
In 2022, the current account registered a U.S.$4.0 billion deficit, compared to a U.S.$6.6 billion surplus in 2021. This variation in the current account balance was mainly due to a U.S.$6.3 billion decrease in the trade of goods account, a U.S.$3.1 billion decrease in the trade of services account and a U.S.$1.1 billion increase in direct investment outflows. The trade of goods and services account registered a U.S.$5.6 billion surplus in 2022 compared to a U.S.$15.0 billion surplus in 2021. This decrease in surplus was primarily driven by a U.S.$17.0 billion increase in the import of goods account and a U.S.$7.9 billion increase in the import of services account.
In 2023, the current account registered a U.S.$22.4 billion deficit, compared to a U.S.$4.0 billion deficit in 2022. This variation in the current account balance was mainly due to a U.S.$14.8 billion decrease in the trade of goods account, a U.S.$3.7 billion increase in investment earnings outflows, a U.S.$0.8 billion increase in other investment outflows and a U.S.$3.1 billion increase in direct investment outflows. The trade of goods and services account registered a U.S.$9.1 billion deficit in 2023 compared to a U.S.$5.6 billion surplus in 2022. This variation in the trade of goods and services account balance was primarily driven by a U.S.$21.7 billion decrease in the export of goods account, which was partially offset by a U.S.$6.5 billion decrease in the import of goods account.
In 2024, the current account registered a U.S.$5.9 billion surplus, compared to a U.S.$22.4 billion deficit in 2023. This variation in the current account balance was mainly due to a U.S.$25.2 billion increase in the trade of goods account, a U.S.$1.4 billion increase in the trade of services account and a U.S.$1.0 billion decrease in direct investment outflows. The trade of goods and services account registered a U.S.$17.5 billion surplus in 2024 compared to a U.S.$9.1 billion deficit in 2023. This variation was primarily driven by a U.S.$12.7 billion increase in the export of goods account and a U.S.$12.5 billion decrease in the import of goods account.
D-64
In 2025, the current account registered a U.S.$7.8 billion deficit, compared to a U.S.$5.9 billion surplus in 2024. This variation in the current account balance was mainly due to a U.S.$7.0 billion decrease in the trade of goods account, a U.S.$6.7 billion decrease in the trade of services account and a U.S.$0.9 billion increase in portfolio investment outflows. The trade of goods and services account registered a U.S.$3.8 billion surplus in 2025 compared to a U.S.$17.5 billion surplus in 2024. This decrease in surplus was primarily driven by a U.S.$14.4 billion increase in the imports of goods account and a U.S.$7.9 billion increase in the import of services account.
Trade of Goods
Exports
In 2021, exports of goods totaled U.S.$78 billion, representing a 42% increase as compared to 2020, primarily due to a 12.8% increase in volumes exported and a 25.8% increase in prices.
In 2021:
| | exports of primary products increased by 34.6%. This increase resulted from a 5.4% increase in volumes exported and a 27.7% increase in prices; |
| | exports of manufactured goods of agricultural origin increased by 42.0%. This increase resulted from a 11.6% increase in volumes exported and a 27.2% increase in prices; |
| | exports of manufactured goods of industrial origin increased by 49.9%. This increase resulted from a 32.7% increase in volumes exported and a 12.8% increase in prices; and |
| | exports of fuel and energy increased by 46.3%. This increase resulted from a 71.8% increase in prices, which was partially offset by a 14.9% decrease in volumes exported. |
In 2022, exports of goods totaled U.S.$88.8 billion, representing a 13.8% increase as compared to 2021, primarily due to a 16.1% increase in prices, which was partially offset by a 1.9% decrease in volumes exported.
In 2022:
| | exports of primary products increased by 9.2%. This increase resulted from a 12.4% increase in prices, which was partially offset by a 2.9% decrease in volumes exported; |
| | exports of manufactured goods of agricultural origin increased by 7.2%. This increase resulted from a 16.8% increase in prices, which was partially offset by an 8.2% decrease in volumes exported; |
| | exports of manufactured goods of industrial origin increased by 15.9%. This increase resulted from a 3.9% increase in volumes exported and a 11.5% increase in prices; and |
| | exports of fuel and energy increased by 64.7%. This increase resulted from a 46.3% increase in prices and a 12.6% increase in volumes exported. |
In 2023, exports of goods totaled U.S.$67.1 billion, representing a 24.5% decrease as compared to 2022, primarily due to a 9.5% decrease in prices and a 16.6% decrease in volumes exported.
In 2023:
| | exports of primary products decreased by 39.4%. This decrease resulted from a 5.8% decrease in prices and a 35.7% decrease in volumes exported; |
| | exports of manufactured goods of agricultural origin decreased by 27.9%. This decrease resulted from a 12.1% decrease in prices and an 18.1% decrease in volumes exported; |
| | exports of manufactured goods of industrial origin decreased by 10.5%. This decrease resulted from a 4.2% decrease in volumes exported and a 6.6% decrease in prices; and |
| | exports of fuel and energy decreased by 7.7%. This decrease resulted from a 19.5% decrease in prices, which was partially offset by a 14.6% increase in volumes exported. |
D-65
In 2024, exports of goods totaled U.S.$79.8 billion, representing a 19.0% increase as compared to 2023, primarily due to a 26.4% increase in volumes exported, which was partially offset by a 5.8% decrease in prices.
In 2024:
| | exports of primary products increased by 26.6%. This increase resulted from a 40.4% increase in volumes exported, which was partially offset by a 9.9% decrease in prices; |
| | exports of manufactured goods of agricultural origin increased by 24.0%. This increase resulted from a 38.9% increase in volumes exported, which was partially offset by a 10.7% decrease in prices; |
| | exports of manufactured goods of industrial origin increased by 6.6%. This increase resulted from a 5.0% increase in volumes exported and a 1.5% increase in prices; and |
| | exports of fuel and energy increased by 22.6%. This increase resulted from a 29.3% increase in volumes exported, which was partially offset by a 5.2% decrease in prices. |
In 2025, exports of goods totaled U.S.$87.1 billion, representing a 9.3% increase as compared to 2024, primarily due to a 10.0% increase in volumes exported, which was partially offset by a 0.7% decrease in prices.
In 2025:
| | exports of primary products increased by 21.2%. This increase resulted from a 25.1% increase in volumes exported, which was partially offset by a 3.1% decrease in prices; |
| | exports of manufactured goods of agricultural origin increased by 2.7%. This increase resulted from a 3.8% increase in volumes exported, which was partially offset by a 1.0% decrease in prices; |
| | exports of manufactured goods of industrial origin increased by 6.1%. This increase resulted from a 6.8% increase in prices, which was partially offset by a 0.7% decrease in volumes exported; and |
| | exports of fuel and energy increased by 14.2%. This increase resulted from a 28.8% increase in volumes exported, which was partially offset by an 11.3% decrease in prices. |
D-66
The following tables set forth information on Argentina’s export products for the periods specified.
Exports by Groups of Products (1)
(in millions of U.S. dollars)
| 2021 | 2022(3) | 2023(3) | 2024(3) | 2025(3) | ||||||||||||||||
| Primary products: |
||||||||||||||||||||
| Cereal |
U.S.$ | 13,645 | U.S.$ | 15,551 | U.S.$ | 8,657 | U.S.$ | 10,834 | U.S.$ | 11,229 | ||||||||||
| Seeds and oilseeds |
3,884 | 4,349 | 2,099 | 3,188 | 6,201 | |||||||||||||||
| Fish and raw seafood |
1,721 | 1,544 | 1,488 | 1,698 | 1,768 | |||||||||||||||
| Fruits |
627 | 496 | 501 | 570 | 638 | |||||||||||||||
| Vegetables |
669 | 635 | 547 | 592 | 663 | |||||||||||||||
| Copper |
397 | 310 | 431 | 531 | 748 | |||||||||||||||
| Tobacco |
244 | 317 | 272 | 315 | 342 | |||||||||||||||
| Honey |
220 | 248 | 184 | 186 | 211 | |||||||||||||||
| Others |
402 | 382 | 260 | 363 | 352 | |||||||||||||||
|
|
|
|
|
|
|
|
|
|
|
|||||||||||
| Total |
21,808 | 23,833 | 14,439 | 18,277 | 22,152 | |||||||||||||||
|
|
|
|
|
|
|
|
|
|
|
|||||||||||
| Manufactured goods of agricultural origin: |
||||||||||||||||||||
| Residues(2) |
12,743 | 13,223 | 9,016 | 11,439 | 9,500 | |||||||||||||||
| Oils and fats |
8,694 | 9,184 | 5,844 | 8,063 | 9,637 | |||||||||||||||
| Meat |
3,501 | 4,202 | 3,253 | 3,547 | 4,454 | |||||||||||||||
| Vegetable Products |
782 | 815 | 823 | 1,071 | 1,093 | |||||||||||||||
| Drinks, alcoholic beverages and vinegar |
973 | 947 | 782 | 882 | 845 | |||||||||||||||
| Grain mill products |
846 | 1,030 | 942 | 887 | 764 | |||||||||||||||
| Dairy food |
1,143 | 1,420 | 1,163 | 1,256 | 1,499 | |||||||||||||||
| Hides and skins |
450 | 464 | 418 | 413 | 375 | |||||||||||||||
| Others |
1,798 | 1,887 | 1,666 | 2,098 | 2,297 | |||||||||||||||
|
|
|
|
|
|
|
|
|
|
|
|||||||||||
| Total |
30,929 | 33,173 | 23,908 | 29,656 | 30,464 | |||||||||||||||
|
|
|
|
|
|
|
|
|
|
|
|||||||||||
| Manufactured goods of industrial origin: |
||||||||||||||||||||
| Transport equipment |
6,466 | 7,939 | 8,300 | 8,467 | 8,252 | |||||||||||||||
| Chemicals |
5,009 | 6,123 | 4,299 | 4,386 | 4,927 | |||||||||||||||
| Stones and precious metals |
2,555 | 2,653 | 2,592 | 3,341 | 4,187 | |||||||||||||||
| Basic metals |
1,841 | 2,087 | 2,058 | 2,323 | 2,308 | |||||||||||||||
| Machines and equipment |
1,375 | 1,799 | 1,549 | 1,387 | 1,537 | |||||||||||||||
| Plastics |
1,041 | 1,086 | 788 | 922 | 955 | |||||||||||||||
| Paper, cardboard, and printed publications |
458 | 464 | 339 | 393 | 418 | |||||||||||||||
| Rubber and its manufactures |
232 | 226 | 182 | 209 | 161 | |||||||||||||||
| Maritime, fluvial and air transport vehicles |
162 | 60 | 19 | 46 | 54 | |||||||||||||||
| Others |
776 | 670 | 553 | 580 | 597 | |||||||||||||||
|
|
|
|
|
|
|
|
|
|
|
|||||||||||
| Total |
19,913 | 23,108 | 20,681 | 22,054 | 23,395 | |||||||||||||||
|
|
|
|
|
|
|
|
|
|
|
|||||||||||
| Fuel and energy: |
||||||||||||||||||||
| Fuel |
5,284 | 8,589 | 7,928 | 9,717 | 11,100 | |||||||||||||||
| Energy |
— | — | — | — | — | |||||||||||||||
|
|
|
|
|
|
|
|
|
|
|
|||||||||||
| Total |
5,284 | 8,589 | 7,928 | 9,717 | 11,100 | |||||||||||||||
|
|
|
|
|
|
|
|
|
|
|
|||||||||||
| Total exports |
U.S.$ | 77,934 | U.S.$ | 88,703 | U.S.$ | 66,956 | U.S.$ | 79,703 | U.S.$ | 87,111 | ||||||||||
|
|
|
|
|
|
|
|
|
|
|
|||||||||||
| (1) | Measured on a FOB basis. |
| (2) | Residues refer to the byproducts left over from the processing of agricultural goods that can be resold for other purposes. |
| (3) | Preliminary data. |
Source: INDEC and Ministry of Economy.
D-67
Exports by Groups of Products (1)
(as % of total exports)
| 2021 | 2022(3) | 2023(3) | 2024(3) | 2025(3) | ||||||||||||||||
| Primary products: |
||||||||||||||||||||
| Cereal |
17.5 | % | 17.5 | % | 12.9 | % | 13.6 | % | 12.9 | % | ||||||||||
| Seeds and oilseeds |
5.0 | 4.9 | 3.1 | 4.0 | 7.1 | |||||||||||||||
| Fish and raw seafood |
2.2 | 1.7 | 2.2 | 2.1 | 2.0 | |||||||||||||||
| Fruits |
0.8 | 0.6 | 0.7 | 0.7 | 0.7 | |||||||||||||||
| Vegetables |
0.9 | 0.7 | 0.8 | 0.7 | 0.8 | |||||||||||||||
| Copper |
0.5 | 0.3 | 0.6 | 0.7 | 0.9 | |||||||||||||||
| Tobacco |
0.3 | 0.4 | 0.4 | 0.4 | 0.4 | |||||||||||||||
| Honey |
0.3 | 0.3 | 0.3 | 0.2 | 0.2 | |||||||||||||||
| Others |
0.5 | 0.4 | 0.4 | 0.5 | 0.4 | |||||||||||||||
|
|
|
|
|
|
|
|
|
|
|
|||||||||||
| Total |
28.0 | % | 26.9 | % | 21.6 | % | 22.9 | % | 25.4 | % | ||||||||||
|
|
|
|
|
|
|
|
|
|
|
|||||||||||
| Manufactured goods of agricultural origin: |
||||||||||||||||||||
| Residues(2) |
16.4 | 14.9 | 13.5 | 14.4 | 10.9 | |||||||||||||||
| Oils and fats |
11.2 | 10.4 | 8.7 | 10.1 | 11.1 | |||||||||||||||
| Meat |
4.5 | 4.7 | 4.9 | 4.4 | 5.1 | |||||||||||||||
| Vegetable Products |
1.0 | 0.9 | 1.2 | 1.3 | 1.3 | |||||||||||||||
| Drinks, alcoholic beverages and vinegar |
1.2 | 1.1 | 1.2 | 1.1 | 1.0 | |||||||||||||||
| Grain mill products |
1.1 | 1.2 | 1.4 | 1.1 | 0.9 | |||||||||||||||
| Dairy food |
1.5 | 1.6 | 1.7 | 1.6 | 1.7 | |||||||||||||||
| Hides and skins |
0.6 | 0.5 | 0.6 | 0.5 | 0.4 | |||||||||||||||
| Others |
2.3 | 2.1 | 2.5 | 2.6 | 2.6 | |||||||||||||||
|
|
|
|
|
|
|
|
|
|
|
|||||||||||
| Total |
39.7 | % | 37.4 | % | 35.7 | % | 37.2 | % | 35.0 | % | ||||||||||
|
|
|
|
|
|
|
|
|
|
|
|||||||||||
| Manufactured goods of industrial origin: |
||||||||||||||||||||
| Transport equipment |
8.3 | 9.0 | 12.4 | 10.6 | 9.5 | |||||||||||||||
| Chemicals |
6.4 | 6.9 | 6.4 | 5.5 | 5.7 | |||||||||||||||
| Stones and precious metals |
3.3 | 3.0 | 3.9 | 4.2 | 4.8 | |||||||||||||||
| Basic metals |
2.4 | 2.4 | 3.1 | 2.9 | 2.6 | |||||||||||||||
| Machines and equipment |
1.8 | 2.0 | 2.3 | 1.7 | 1.8 | |||||||||||||||
| Plastics |
1.3 | 1.2 | 1.2 | 1.2 | 1.1 | |||||||||||||||
| Paper, cardboard, and printed publications |
0.6 | 0.5 | 0.5 | 0.5 | 0.5 | |||||||||||||||
| Rubber and its manufactures |
0.3 | 0.3 | 0.3 | 0.3 | 0.2 | |||||||||||||||
| Maritime, fluvial and air transport vehicles |
0.2 | 0.1 | — | 0.1 | 0.1 | |||||||||||||||
| Others |
1.0 | 0.8 | 0.8 | 0.7 | 0.7 | |||||||||||||||
|
|
|
|
|
|
|
|
|
|
|
|||||||||||
| Total |
25.6 | % | 26.1 | % | 30.9 | % | 27.7 | % | 26.9 | % | ||||||||||
|
|
|
|
|
|
|
|
|
|
|
|||||||||||
| Fuel and energy: |
||||||||||||||||||||
| Fuel |
6.8 | 9.7 | 11.8 | 12.2 | 12.7 | |||||||||||||||
| Energy |
— | — | — | — | — | |||||||||||||||
|
|
|
|
|
|
|
|
|
|
|
|||||||||||
| Total |
6.8 | % | 9.7 | % | 11.8 | % | 12.2 | % | 12.7 | % | ||||||||||
|
|
|
|
|
|
|
|
|
|
|
|||||||||||
| Total Exports |
100.0 | % | 100.0 | % | 100.0 | % | 100.0 | % | 100.0 | % | ||||||||||
|
|
|
|
|
|
|
|
|
|
|
|||||||||||
| (1) | Measured on a FOB basis. |
| (2) | Residues refer to the byproducts left over from the processing of agricultural goods that can be resold for other purposes. |
| (3) | Preliminary data. |
Source: INDEC and Ministry of Economy.
Imports
In 2021, imports of goods increased by 49.2% to U.S.$63.2 billion from U.S.$42.3 billion in 2020. Capital goods and spare parts and accessories for capital goods increased by 47.5% and represented 34.9% of total imports, while imports of intermediate goods increased by 53.6% and amounted to 40.8% of total imports. Imports of fuel and energy increased by 121.3% and imports of motor vehicles for passengers increased by 4.8%, while imports of consumption goods increased by 20.3%, in each case, in terms of their U.S. dollar value.
D-68
In 2022, imports of goods increased by 29.4% to U.S.$81.7 billion from U.S.$63.2 billion in 2021. Capital goods and spare parts and accessories for capital goods increased by 24.5% and represented 33.6% of total imports, while imports of intermediate goods increased by 16.8% and amounted to 36.8% of total imports. Imports of fuel and energy increased by 122.1% and imports of motor vehicles for passengers increased by 18.0%, while imports of consumption goods increased by 18.4%, in each case, in terms of their U.S. dollar value.
In 2023, imports of goods decreased by 9.7% to U.S.$73.8 billion from U.S.$81.7 billion in 2022. Capital goods and spare parts and accessories for capital goods decreased by 1.8% and represented 36.6% of total imports, while imports of intermediate goods decreased by 4.8% and amounted to 38.8% of total imports. Imports of fuel and energy decreased by 39.2% and imports of motor vehicles for passengers decreased by 7.4%, while imports of consumption goods decreased by 7.4%, in each case, in terms of their U.S. dollar value.
In 2024, imports of goods decreased by 17.7% to U.S.$60.8 billion from U.S.$73.8 billion in 2023. Capital goods and spare parts and accessories for capital goods decreased by 14.1% and represented 38.2% of total imports, while imports of intermediate goods decreased by 19.6% and amounted to 37.9% of total imports. Imports of fuel and energy decreased by 49.4% and imports of motor vehicles for passengers increased by 55.5%, while imports of consumption goods decreased by 6.7%, in each case, in terms of their U.S. dollar value.
In 2025, imports of goods increased by 24.7% to U.S.$75.8 billion from U.S.$60.8 billion in 2024. Capital goods and spare parts and accessories for capital goods increased by 30.2% and represented 39.8% of total imports, while imports of intermediate goods increased by 5.5% and amounted to 32.1% of total imports. Imports of fuel and energy decreased by 18.0% and imports of motor vehicles for passengers increased by 97.6%, while imports of consumption goods increased by 54.0%, in each case, in terms of their U.S. dollar value.
The following tables set forth information on Argentina’s import products grouped by economic uses for the periods specified.
Imports by Economic Uses (1)
(in millions of U.S. dollars)
| 2021 | 2022 | 2023(2) | 2024(2) | 2025(2) | ||||||||||||||||
| Intermediate goods |
U.S.$ | 25,758 | U.S.$ | 30,098 | U.S.$ | 28,661 | U.S.$ | 23,033 | U.S.$ | 24,300 | ||||||||||
| Parts and accessories of capital goods |
11,890 | 15,040 | 15,966 | 13,225 | 15,113 | |||||||||||||||
| Capital goods |
10,181 | 12,446 | 11,023 | 9,961 | 15,073 | |||||||||||||||
| Consumption goods |
7,236 | 8,566 | 7,934 | 7,404 | 11,401 | |||||||||||||||
| Fuel and energy |
5,843 | 12,975 | 7,887 | 3,987 | 3,271 | |||||||||||||||
| Motor vehicles for passengers |
1,692 | 1,995 | 1,847 | 2,873 | 5,678 | |||||||||||||||
| Others |
584 | 621 | 497 | 292 | 955 | |||||||||||||||
|
|
|
|
|
|
|
|
|
|
|
|||||||||||
| Total |
U.S.$ | 63,184 | U.S.$ | 81,740 | U.S.$ | 73,816 | U.S.$ | 60,776 | U.S.$ | 75,791 | ||||||||||
|
|
|
|
|
|
|
|
|
|
|
|||||||||||
| (1) | Measured on a CIF basis. Data set forth in this table differs from the data presented in the tables titled “Balance of Payments” because the latter was calculated on a FOB basis. |
| (2) | Preliminary data. |
Source: INDEC and Ministry of Economy.
D-69
The following tables set forth information on Argentina’s import products grouped by principal characteristics for the periods specified.
Imports by Groups of Products (1)
(in millions of U.S. dollars)
| 2021(2) | 2022(2) | 2023(2) | 2024(2) | 2025(2) | ||||||||||||||||
| Machines, instruments and electric materials |
U.S.$ | 16,175 | U.S.$ | 20,212 | U.S.$ | 19,281 | U.S.$ | 15,772 | U.S.$ | 20,304 | ||||||||||
| Industrial products |
12,645 | 14,974 | 11,833 | 11,103 | 12,364 | |||||||||||||||
| Transport equipment |
6,710 | 8,142 | 8,439 | 9,164 | 14,832 | |||||||||||||||
| Mineral products |
7,028 | 14,098 | 8,635 | 4,619 | 3,660 | |||||||||||||||
| Plastic, rubber and manufactures |
4,194 | 5,065 | 4,400 | 3,796 | 4,337 | |||||||||||||||
| Common metals and manufactures |
4,431 | 5,041 | 4,701 | 3,592 | 4,197 | |||||||||||||||
| Products of vegetable origin |
3,503 | 3,162 | 6,622 | 4,238 | 3,567 | |||||||||||||||
| Optical instruments, medical-surgical precision equipment, watches and music equipment |
1,680 | 1,947 | 1,929 | 1,897 | 2,360 | |||||||||||||||
| Textiles and manufactures |
1,379 | 1,834 | 1,508 | 1,187 | 1,789 | |||||||||||||||
| Wood pulp, paper and paperboard |
977 | 1,386 | 1,335 | 938 | 1,132 | |||||||||||||||
| Commodities and other products |
858 | 1,127 | 1,044 | 866 | 1,377 | |||||||||||||||
| Feeding products, beverages and tobacco |
995 | 1,195 | 1,113 | 1,117 | 1,741 | |||||||||||||||
| Footwear, umbrellas, artificial flowers and others |
459 | 706 | 753 | 696 | 900 | |||||||||||||||
| Stone manufactures, plaster and cement, asbestos, mica, ceramic and glass |
614 | 735 | 627 | 505 | 617 | |||||||||||||||
| Live animals and products of animal origin |
320 | 356 | 219 | 216 | 463 | |||||||||||||||
| Other products |
1,218 | 1,760 | 1,378 | 1,070 | 2,151 | |||||||||||||||
|
|
|
|
|
|
|
|
|
|
|
|||||||||||
| Total imports |
U.S.$ | 63,184 | U.S.$ | 81,740 | U.S.$ | 73,816 | U.S.$ | 60,776 | U.S.$ | 75,791 | ||||||||||
|
|
|
|
|
|
|
|
|
|
|
|||||||||||
| (1) | Measured on a CIF basis. Data set forth in this table differs from the data presented in the tables titled “Balance of Payments” because the latter was calculated on a FOB basis. |
| (2) | Preliminary data. |
Source: INDEC and Ministry of Economy.
Imports by Groups of Products (1)
(as % of total imports)
| 2021(2) | 2022(2) | 2023(2) | 2024(2) | 2025(2) | ||||||||||||||||
| Machines, instruments and electric materials |
25.6 | % | 24.7 | % | 26.1 | % | 26.0 | % | 26.8 | % | ||||||||||
| Industrial products |
20.0 | 18.3 | 16.0 | 18.3 | 16.3 | |||||||||||||||
| Transport equipment |
10.6 | 10.0 | 11.4 | 15.1 | 19.6 | |||||||||||||||
| Mineral products |
11.1 | 17.2 | 11.7 | 7.6 | 4.8 | |||||||||||||||
| Plastic, rubber and manufactures |
6.6 | 6.2 | 6.0 | 6.2 | 5.7 | |||||||||||||||
| Common metals and manufactures |
7.0 | 6.2 | 6.4 | 5.9 | 5.5 | |||||||||||||||
| Products of vegetable origin |
5.5 | 3.9 | 9.0 | 7.0 | 4.7 | |||||||||||||||
| Optical instruments, medical-surgical precision equipment, watches and music equipment |
2.7 | 2.4 | 2.6 | 3.1 | 3.1 | |||||||||||||||
| Textiles and manufactures |
2.2 | 2.2 | 2.0 | 2.0 | 2.4 | |||||||||||||||
| Wood pulp, paper and paperboard |
1.5 | 1.7 | 1.8 | 1.5 | 1.5 | |||||||||||||||
| Commodities and other products |
1.4 | 1.4 | 1.4 | 1.4 | 1.8 | |||||||||||||||
| Feeding products, beverages and tobacco |
1.6 | 1.5 | 1.5 | 1.8 | 2.3 | |||||||||||||||
| Footwear, umbrellas, artificial flowers and others |
0.7 | 0.9 | 1.0 | 1.1 | 1.2 | |||||||||||||||
| Stone manufactures, plaster, cement, asbestos, mica, ceramic and glass |
1.0 | 0.9 | 0.8 | 0.8 | 0.8 | |||||||||||||||
| Live animals and products of animal origin |
0.5 | 0.4 | 0.3 | 0.4 | 0.6 | |||||||||||||||
| Other products |
1.9 | 2.2 | 1.9 | 1.8 | 2.8 | |||||||||||||||
|
|
|
|
|
|
|
|
|
|
|
|||||||||||
| Total imports |
100.0 | % | 100.0 | % | 100.0 | % | 100.0 | % | 100.0 | % | ||||||||||
|
|
|
|
|
|
|
|
|
|
|
|||||||||||
| (1) | Measured on a CIF basis. Data set forth in this table differs from the data presented in the tables titled “Balance of Payments” because the latter was calculated on a FOB basis. |
| (2) | Preliminary data. |
Source: INDEC and Ministry of Economy.
D-70
Trade Regulation
Until the beginning of the 1990s, Argentina had a relatively closed economy modeled around import substitution policies with significant trade barriers. Although certain reforms were pursued from the 1960s through the 1980s to liberalize trade, it was only during the 1990s that the Government implemented significant trade liberalization measures.
Trade policies remained relatively stable during the 1990s, marked by few export tariffs and low import tariffs in certain sectors of the economy. Following the collapse of the Convertibility Regime in 2002, the Government introduced trade measures intended to increase Government revenues, stem the outflow of foreign currencies, manage the pricing of basic goods (including by discouraging exports) and protect local industries.
Geographic Distribution of Trade
Argentina’s primary trading partner is Brazil. Argentina also conducts a substantial amount of trade with China, the United States and other countries in Latin America and Europe.
The following tables provide information on the geographic distribution of Argentine exports for the periods specified.
Geographic Distribution of Exports (1)
(in millions of U.S. dollars)
| 2021 | 2022 | 2023 | 2024 | 2025 | ||||||||||||||||
| Brazil |
U.S.$ | 11,767 | U.S.$ | 12,558 | U.S.$ | 11,879 | U.S.$ | 13,620 | U.S.$ | 12,783 | ||||||||||
| China |
6,295 | 8,048 | 5,289 | 6,072 | 9,809 | |||||||||||||||
| United States |
4,999 | 6,897 | 5,677 | 6,478 | 8,345 | |||||||||||||||
| Chile |
4,205 | 5,093 | 4,975 | 6,343 | 6,281 | |||||||||||||||
| Netherlands |
2,985 | 3,577 | 1,563 | 1,697 | 2,076 | |||||||||||||||
| Peru |
2,008 | 2,443 | 2,558 | 2,480 | 2,549 | |||||||||||||||
| Spain |
1,849 | 1,736 | 1,345 | 1,453 | 1,226 | |||||||||||||||
| Uruguay |
1,334 | 1,584 | 1,671 | 1,652 | 1,783 | |||||||||||||||
| Paraguay |
1,293 | 1,247 | 1,257 | 1,442 | 1,369 | |||||||||||||||
| Germany |
811 | 898 | 770 | 817 | 1,112 | |||||||||||||||
| Canada |
705 | 870 | 802 | 1,116 | 1,301 | |||||||||||||||
| Rest of ALADI(2) |
3,591 | 4,492 | 3,729 | 3,539 | 3,582 | |||||||||||||||
| Rest of EU |
6,607 | 7,230 | 5,587 | 7,398 | 7,543 | |||||||||||||||
| Association of Southeast Asian Nations |
7,431 | 7,882 | 5,073 | 6,773 | 5,767 | |||||||||||||||
| Middle East |
4,499 | 4,673 | 2,845 | 4,163 | 4,658 | |||||||||||||||
| Rest of Asia |
7,396 | 8,043 | 4,391 | 6,385 | 7,328 | |||||||||||||||
| Rest of world(3) |
9,323 | 10,175 | 6,403 | 6,964 | 8,313 | |||||||||||||||
| Indeterminate destination(4) |
836 | 1,257 | 1,143 | 1,310 | 1,285 | |||||||||||||||
|
|
|
|
|
|
|
|
|
|
|
|||||||||||
| Total |
U.S.$ | 77,934 | U.S.$ | 88,703 | U.S.$ | 66,956 | U.S.$ | 79,703 | U.S.$ | 87,111 | ||||||||||
|
|
|
|
|
|
|
|
|
|
|
|||||||||||
| Memorandum items: |
||||||||||||||||||||
| MERCOSUR(5) |
U.S.$ | 14,603 | U.S.$ | 15,650 | U.S.$ | 15,161 | U.S.$ | 17,185 | U.S.$ | 16,508 | ||||||||||
| ALADI |
U.S.$ | 24,198 | U.S.$ | 27,417 | U.S.$ | 26,068 | U.S.$ | 29,076 | U.S.$ | 28,348 | ||||||||||
| (1) | Measured on a FOB basis. |
| (2) | As of December 31, 2025, ALADI comprised the following countries: Argentina, Bolivia, Brazil, Chile, Colombia, Cuba, Ecuador, Mexico, Paraguay, Peru, Panama, Uruguay and Venezuela. |
| (3) | Includes exports to all other countries. |
| (4) | Includes exports for which the destination could not be identified. |
| (5) | As of the date of this Annual Report, MERCOSUR comprised the following countries: Argentina, Brazil, Paraguay and Uruguay. The Bolivarian Republic of Venezuela is suspended from all rights and obligations inherent in its status as a State Party to MERCOSUR, in accordance with the provisions of the second paragraph of Article 5 of the Ushuaia Protocol. For more information on MERCOSUR members see “The Republic of Argentina—Foreign Affairs and International Organizations—MERCOSUR.” |
Source: INDEC and Ministry of Economy.
D-71
Geographic Distribution of Exports (1)
(as % of total exports)
| 2021 | 2022 | 2023 | 2024 | 2025 | ||||||||||||||||
| Brazil |
15.1 | % | 14.2 | % | 17.7 | % | 17.1 | % | 14.7 | % | ||||||||||
| China |
8.1 | 9.1 | 7.9 | 7.6 | 11.3 | |||||||||||||||
| United States |
6.4 | 7.8 | 8.5 | 8.1 | 9.6 | |||||||||||||||
| Chile |
5.4 | 5.7 | 7.4 | 8.0 | 7.2 | |||||||||||||||
| Netherlands |
3.8 | 4.0 | 2.3 | 2.1 | 2.4 | |||||||||||||||
| Peru |
2.6 | 2.8 | 3.8 | 3.1 | 2.9 | |||||||||||||||
| Spain |
2.4 | 2.0 | 2.0 | 1.8 | 1.4 | |||||||||||||||
| Uruguay |
1.7 | 1.8 | 2.5 | 2.1 | 2.0 | |||||||||||||||
| Paraguay |
1.7 | 1.4 | 1.9 | 1.8 | 1.6 | |||||||||||||||
| Germany |
1.0 | 1.0 | 1.1 | 1.0 | 1.3 | |||||||||||||||
| Canada |
0.9 | 1.0 | 1.2 | 1.4 | 1.5 | |||||||||||||||
| Rest of ALADI(2) |
4.6 | 5.1 | 5.6 | 4.4 | 4.1 | |||||||||||||||
| Rest of EU |
8.5 | 8.2 | 8.3 | 9.3 | 8.7 | |||||||||||||||
| Association of Southeast Asian Nations |
9.5 | 8.9 | 7.6 | 8.5 | 6.6 | |||||||||||||||
| Middle East |
5.8 | 5.3 | 4.2 | 5.2 | 5.3 | |||||||||||||||
| Rest of Asia |
9.5 | 9.1 | 6.6 | 8.0 | 8.4 | |||||||||||||||
| Rest of world(3) |
12.0 | 11.5 | 9.6 | 8.7 | 9.5 | |||||||||||||||
| Indeterminate destination(4) |
1.1 | 1.4 | 1.7 | 1.6 | 1.5 | |||||||||||||||
|
|
|
|
|
|
|
|
|
|
|
|||||||||||
| Total |
100.0 | % | 100.0 | % | 100.0 | % | 100.0 | % | 100.0 | % | ||||||||||
|
|
|
|
|
|
|
|
|
|
|
|||||||||||
| Memorandum items: |
||||||||||||||||||||
| MERCOSUR(5) |
18.7 | % | 17.6 | % | 22.6 | % | 21.6 | % | 18.9 | % | ||||||||||
| ALADI |
31.0 | % | 30.9 | % | 38.9 | % | 36.5 | % | 32.5 | % | ||||||||||
| (1) | Measured on a FOB basis. |
| (2) | As of December 31, 2025, ALADI comprised the following countries: Argentina, Bolivia, Brazil, Chile, Colombia, Cuba, Ecuador, Mexico, Paraguay, Panama, Peru, Uruguay and Venezuela. |
| (3) | Includes exports from all other countries. |
| (4) | Includes exports for which the destination could not be identified. |
| (5) | As of the date of this Annual Report, MERCOSUR comprised the following countries: Argentina, Brazil, Paraguay and Uruguay. The Bolivarian Republic of Venezuela is suspended from all rights and obligations inherent in its status as a State Party to MERCOSUR, in accordance with the provisions of the second paragraph of Article 5 of the Ushuaia Protocol. For more information on MERCOSUR members see “The Republic of Argentina—Foreign Affairs and International Organizations—MERCOSUR.” |
Source: INDEC and Ministry of Economy.
D-72
The following tables provide information on the geographic distribution of Argentina’s imports for the periods specified.
Geographic Distribution of Imports (1)
(in millions of U.S. dollars)
| 2021 | 2022 | 2023 | 2024 | 2025 | ||||||||||||||||
| Brazil |
U.S.$ | 12,392 | U.S.$ | 16,164 | U.S.$ | 17,321 | U.S.$ | 14,286 | U.S.$ | 18,357 | ||||||||||
| China |
13,538 | 17,513 | 14,546 | 11,668 | 17,954 | |||||||||||||||
| United States |
5,922 | 10,328 | 8,628 | 6,225 | 6,704 | |||||||||||||||
| Germany |
2,527 | 2,719 | 2,781 | 2,652 | 3,136 | |||||||||||||||
| Paraguay |
2,915 | 1,959 | 3,912 | 3,314 | 2,958 | |||||||||||||||
| Bolivia |
1,055 | 2,220 | 1,190 | 709 | 147 | |||||||||||||||
| Italy |
1,312 | 1,676 | 1,810 | 1,333 | 1,564 | |||||||||||||||
| Mexico |
1,403 | 1,710 | 1,561 | 1,424 | 1,723 | |||||||||||||||
| Spain |
1,084 | 1,305 | 1,350 | 996 | 1,167 | |||||||||||||||
| Japan |
1,140 | 1,200 | 1,222 | 1,245 | 1,425 | |||||||||||||||
| France |
1,002 | 1,099 | 1,095 | 957 | 419 | |||||||||||||||
| Rest of ALADI(2) |
2,183 | 3,262 | 2,343 | 2,506 | 2,693 | |||||||||||||||
| Rest of EU |
4,889 | 6,280 | 5,283 | 4,435 | 5,886 | |||||||||||||||
| Association of Southeast Asian Nations |
3,928 | 4,225 | 4,116 | 3,325 | 4,543 | |||||||||||||||
| Middle East |
1,579 | 2,534 | 830 | 639 | 684 | |||||||||||||||
| Rest of Asia |
2,643 | 3,226 | 2,660 | 2,186 | 2,620 | |||||||||||||||
| Rest of world(3) |
3,007 | 3,430 | 2,379 | 2,303 | 2,607 | |||||||||||||||
| Indeterminate origin(4) |
665 | 891 | 790 | 571 | 1,206 | |||||||||||||||
|
|
|
|
|
|
|
|
|
|
|
|||||||||||
| Total(5) |
U.S.$ | 63,184 | U.S.$ | 81,740 | U.S.$ | 73,816 | U.S.$ | 60,776 | U.S.$ | 75,791 | ||||||||||
|
|
|
|
|
|
|
|
|
|
|
|||||||||||
| Memorandum items: |
||||||||||||||||||||
| MERCOSUR(6) |
15,929 | 19,449 | 21,879 | 18,475 | 22,013 | |||||||||||||||
| ALADI |
19,948 | 25,316 | 26,326 | 22,240 | 25,878 | |||||||||||||||
| (1) | Measured on a CIF basis. |
| (2) | As of December 31, 2025, ALADI comprised the following countries: Argentina, Bolivia, Brazil, Chile, Colombia, Cuba, Ecuador, Mexico, Paraguay, Panama, Peru, Uruguay and Venezuela. |
| (3) | Includes imports from all other countries. |
| (4) | Includes imports for which the origin could not be identified. |
| (5) | Data set forth in this table is updated more frequently than the data presented in the “Balance of Payments” table and thus total imports in this table may differ from those in the “Balance of Payments” table. |
| (6) | As of the date of this Annual Report, MERCOSUR comprised the following countries: Argentina, Brazil, Paraguay and Uruguay. The Bolivarian Republic of Venezuela is suspended from all rights and obligations inherent in its status as a State Party to MERCOSUR, in accordance with the provisions of the second paragraph of Article 5 of the Ushuaia Protocol. For more information on MERCOSUR members see “The Republic of Argentina—Foreign Affairs and International Organizations—MERCOSUR.” |
Source: INDEC and Ministry of Economy.
D-73
Geographic Distribution of Imports (1)
(as % of total imports)
| 2021 | 2022 | 2023 | 2024 | 2025 | ||||||||||||||||
| Brazil |
19.6 | % | 19.8 | % | 23.5 | % | 23.5 | % | 24.2 | % | ||||||||||
| China |
21.4 | 21.4 | 19.7 | 19.2 | 23.7 | |||||||||||||||
| United States |
9.4 | 12.6 | 11.7 | 10.2 | 8.8 | |||||||||||||||
| Germany |
4.0 | 3.3 | 3.8 | 4.4 | 4.1 | |||||||||||||||
| Paraguay |
4.6 | 2.4 | 5.3 | 5.5 | 3.9 | |||||||||||||||
| Bolivia |
1.7 | 2.7 | 1.6 | 1.2 | 0.2 | |||||||||||||||
| Italy |
2.1 | 2.1 | 2.5 | 2.2 | 2.1 | |||||||||||||||
| Mexico |
2.2 | 2.1 | 2.1 | 2.3 | 2.3 | |||||||||||||||
| Spain |
1.7 | 1.6 | 1.8 | 1.6 | 1.5 | |||||||||||||||
| Japan |
1.8 | 1.5 | 1.7 | 2.0 | 1.9 | |||||||||||||||
| France |
1.6 | 1.3 | 1.5 | 1.6 | 0.6 | |||||||||||||||
| Rest of ALADI(2) |
3.5 | 4.0 | 3.2 | 4.1 | 3.6 | |||||||||||||||
| Rest of EU |
7.7 | 7.7 | 7.2 | 7.3 | 7.8 | |||||||||||||||
| Association of Southeast Asian Nations |
6.2 | 5.2 | 5.6 | 5.5 | 6.0 | |||||||||||||||
| Middle East |
2.5 | 3.1 | 1.1 | 1.1 | 0.9 | |||||||||||||||
| Rest of Asia |
4.2 | 3.9 | 3.6 | 3.6 | 3.5 | |||||||||||||||
| Rest of world(3) |
4.8 | 4.2 | 3.2 | 3.8 | 3.4 | |||||||||||||||
| Indeterminate origin(4) |
1.1 | 1.1 | 1.1 | 0.9 | 1.6 | |||||||||||||||
|
|
|
|
|
|
|
|
|
|
|
|||||||||||
| Total(5) |
100.0 | % | 100.0 | % | 100.0 | % | 100.0 | % | 100.0 | % | ||||||||||
|
|
|
|
|
|
|
|
|
|
|
|||||||||||
| Memorandum items: |
||||||||||||||||||||
| MERCOSUR(6) |
25.2 | % | 23.8 | % | 29.6 | % | 30.4 | % | 29.0 | % | ||||||||||
| ALADI |
31.6 | % | 31.0 | % | 35.7 | % | 36.6 | % | 34.1 | % | ||||||||||
| (1) | Measured on a CIF basis. |
| (2) | As of December 31, 2025, ALADI comprised the following countries: Argentina, Bolivia, Brazil, Chile, Colombia, Cuba, Ecuador, Mexico, Paraguay, Panama, Peru, Uruguay and Venezuela. |
| (3) | Includes imports from all other countries. |
| (4) | Includes imports for which the origin could not be identified. |
| (5) | Data set forth in this table is updated more frequently than the data presented in the “Balance of Payments” table and thus total imports in this table may differ from those in the “Balance of Payments” table. |
| (6) | As of the date of this Annual Report, MERCOSUR comprised the following countries: Argentina, Brazil, Paraguay and Uruguay. The Bolivarian Republic of Venezuela is suspended from all rights and obligations inherent in its status as a State Party to MERCOSUR, in accordance with the provisions of the second paragraph of Article 5 of the Ushuaia Protocol. For more information on MERCOSUR members see “The Republic of Argentina—Foreign Affairs and International Organizations—MERCOSUR.” |
Source: INDEC and Ministry of Economy.
Trade with MERCOSUR Countries
Framework
In addition to Argentina, the MERCOSUR Member States include Brazil, Paraguay, Uruguay and, commencing in 2012, Venezuela. Since December 2016, Venezuela’s status as a full member has been suspended by the other Member States. See “The Republic of Argentina—Foreign Affairs and International Organizations—MERCOSUR.” On August 7, 2024, the Protocol of Accession of Bolivia to MERCOSUR became effective, making it a “member State” and providing the country with a four-year period to gradually adopt MERCOSUR’s regulations. Bolivia’s participation in the institutional structure of MERCOSUR will be gradual, following the principle of equal rights and obligations. MERCOSUR’s objective is to gradually integrate the economies of its member countries through the elimination of trade barriers, the harmonization of macroeconomic policies and the establishment of a common external tariff and a common external trade policy. See, however, “The Republic of Argentina—Foreign Affairs and International Organizations.”
D-74
Trade
Trade among MERCOSUR Member States increased significantly in the 10 years leading up to 2010, but has decreased ever since. This decline has occurred in the context of deteriorating external and internal economic conditions. This negative performance has been a widespread phenomenon affecting all Member States.
Argentina’s trade with MERCOSUR Member States reached U.S.$38.5 billion in 2025, representing 23.6% of Argentina’s total trade. Argentine exports to the other MERCOSUR Member States amounted to U.S.$16.5 billion, equivalent to 18.9% of Argentina’s total global exports, while imports from MERCOSUR amounted to U.S.$22.0 billion, equivalent to 29.0% of Argentina’s total imports. Argentina registered a U.S.$5.5 billion trade deficit with MERCOSUR in 2025, as compared to U.S.$1.3 billion deficit in 2024. This deficit increase was primarily due to an increase in the trade deficit with Brazil, from a U.S.$0.7 billion deficit in 2024 to a U.S.$5.6 billion deficit in 2025.
Brazil
Brazil is Argentina’s primary export market and source of imports. Manufactured goods of industrial origin account for approximately 26.9% of total exports. In 2025, the main imports from Brazil included intermediate goods, which totaled U.S.$5.5 billion, and parts and accessories goods which totaled U.S.$3.6 billion. Main exports to Brazil in 2025 were manufactured goods of industrial origin, which totaled U.S.$8.2 billion, followed by manufactured goods of agricultural origin, which totaled U.S.$2.0 billion. In 2025, Argentina’s trade deficit with Brazil was U.S.$5.6 billion, compared to a deficit of U.S.$0.7 billion in 2024, driven by a 28.5% increase in total imports from Brazil and a 6.1% decrease in exports.
The decrease in exports to Brazil in 2025 as compared to 2024 was mainly the result of a 32.9% decrease in exports of fuel and energy and a 3.4% decrease in manufactured goods of industrial origin.
The increase in imports from Brazil in 2025 as compared to 2024 was driven by a 66.8% increase in imports of motor vehicles and a 69.6% increase in imports of capital goods.
China
China is one of Argentina’s main trade partners. Imports from China include mainly chemical products, machinery and electronic devices, motorcycles and engines with small cylinder volumes, and toys. Exports to China include mainly agricultural commodities, such as wheat, soy and corn, as well as meat and its derivative products.
In 2025, imports from China included mainly intermediate goods, which totaled U.S.$4.9 billion, capital goods, which totaled U.S.$5.0 billion, and spare parts and accessories, which totaled U.S.$3.8 billion. Exports to China in 2025 were mainly primary products for U.S.$6.1 billion, followed by manufactured products of agricultural origin, which totaled U.S.$2.5 billion. In 2025, Argentina’s trade deficit with China was U.S.$8.1 billion, as compared to U.S.$5.6 billion in 2024.
Total imports from China increased by 53.9% in 2025 as compared to 2024, mainly due to an increase in imports of consumption goods.
Total exports to China increased by 61.6% in 2025 as compared to 2024, mainly due to a 100.7% increase in exports of primary products and a 363.1% increase in exports of fuel and energy.
United States
Historically, the United States has been one of Argentina’s most important trade partners. Manufactured goods constitute a significant share of Argentine exports to the United States, while capital and intermediate goods constitute a significant share of Argentina’s imports from the United States.
In 2025, imports from the United States included mainly fuel, which totaled U.S.$1.2 billion, intermediate goods, which totaled U.S.$2.3 billion, and capital goods, which totaled U.S.$1.4 billion. Exports to the United States for the same period were mainly fuel, which totaled U.S.$3.9 billion, followed by manufactured products of industrial origin, which totaled U.S.$2.3 billion. In 2025, Argentina’s trade surplus with the United States was U.S.$1.6 billion, as compared to a surplus of U.S.$0.3 billion in 2024, mainly due to a 28.8% increase in total exports from the United States.
The increase in imports from the United States in 2025 as compared to 2024 was mainly the result of increases in imports of capital goods and consumption goods by 47.3% and 24.4%, respectively.
D-75
The increase in exports to the United States in 2025 as compared to 2024 was primarily due to a 68.7% increase in fuel and energy and an 11.8% increase in manufactured products of industrial origin.
Trade of Services
The services trade balance records the amount of services (including financial services, but excluding payments of interest, dividends and other income) that Argentine residents purchase outside Argentina, relative to the amount of services that non-residents purchase in Argentina. For instance, a deficit in service trade indicates that the value of services purchased by Argentine residents outside Argentina exceeds the value of services purchased in Argentina by non-residents. Argentina’s services account also factors in partially in Argentina’s overall level of trade in goods since it includes the freight and insurance services associated with export and import transactions.
In 2021, net outflows recorded by the trade of services account increased by U.S.$1.2 billion to U.S.$3.7 billion, as a result of an increase in outflows on account of services, which was partially offset by an increase in inflows on account of services. Specifically, the increase in net outflows recorded by the trade of services account in 2021 was due to:
| | a 19.9% increase in net outflows in royalties, from U.S.$0.9 billion in 2020 to U.S.$1.1 billion in 2021; and |
| | a 131.9% increase in net outflows in the transportation account, from U.S.$0.9 billion in 2020 to U.S.$2.0 billion in 2021. |
In 2022, net outflows recorded by the trade of services account increased by U.S.$3.1 billion to U.S.$6.8 billion, as a result of an increase in outflows on account of services, which was partially offset by an increase in inflows on account of services. Specifically, the increase in net outflows recorded by the trade of services account in 2022 was due to:
| | a 117.4% increase in net outflows in tourism, from U.S.$1.0 billion in 2021 to U.S.$2.1 billion in 2022; and |
| | a 108.0% increase in net outflows in the transportation account, from U.S.$2.0 billion in 2021 to U.S.$4.2 billion in 2022. |
In 2023, net outflows recorded by the trade of services account decreased by U.S.$0.4 billion to U.S.$6.4 billion, as a result of an increase in inflows on account of services, which was partially offset by an increase in outflows on account of services. Specifically, the decrease in net outflows recorded by the trade of services account in 2023 was due to:
| | a 13.1% decrease in net outflows in tourism, from U.S.$2.1 billion in 2022 to U.S.$1.8 billion in 2023; and |
| | an 18.0% decrease in net outflows in the transportation account, from U.S.$4.2 billion in 2022 to U.S.$3.4 billion in 2023. |
In 2024, net outflows recorded by the trade of services account decreased by U.S.$1.4 billion to U.S.$4.9 billion, as a result of an increase in inflows on account of services. Specifically, the decrease in net outflows recorded by the trade of services account in 2024 was due to:
| | a 49.0% increase in net inflows in professional, technical and business services, from U.S.$1.7 billion in 2023 to U.S.$2.5 billion in 2024; and |
| | a 48.1% decrease in net outflows in the transportation account, from U.S.$3.4 billion in 2023 to U.S.$1.8 billion in 2024. |
In 2025, net outflows recorded by the trade of services account increase by U.S.$6.7 billion to U.S.$11.6 billion, as a result of an increase in outflows on account of services, which was partially offset by an increase in inflows on account of services. Specifically, the increase in net outflows recorded by the trade of services account in 2025 was due to:
| | a 153.8% increase in net outflows in tourism, from U.S.$2.8 billion in 2024 to U.S.$7.2 billion in 2025; and |
| | a 103.3% increase in net outflows in the transportation account, from U.S.$1.8 billion in 2024 to U.S.$3.6 billion in 2025. |
D-76
The table below sets forth the net results of Argentina’s services trade for the periods specified.
Services
(in millions of U.S. dollars, at current prices)
| 2021 | 2022 | 2023 | 2024 | 2025 | ||||||||||||||||
| Transportation: |
||||||||||||||||||||
| Freight |
U.S.$ | (2,440 | ) | U.S.$ | (3,606 | ) | U.S.$ | (2,708 | ) | U.S.$ | (2,151 | ) | U.S.$ | (2,675 | ) | |||||
| Passenger |
(471 | ) | (1,614 | ) | (1,679 | ) | (1,033 | ) | (2,187 | ) | ||||||||||
| Other |
908 | 1,028 | 947 | 1,400 | 1,234 | |||||||||||||||
| Total transportation |
(2,002 | ) | (4,192 | ) | (3,439 | ) | (1,784 | ) | (3,628 | ) | ||||||||||
| Tourism |
(963 | ) | (2,093 | ) | (1,820 | ) | (2,845 | ) | (7,221 | ) | ||||||||||
| Royalties |
(1,124 | ) | (1,466 | ) | (1,571 | ) | (1,732 | ) | (1,811 | ) | ||||||||||
| Professional, technical, business services |
901 | 1,437 | 1,660 | 2,473 | 2,394 | |||||||||||||||
| Others(1) |
(512 | ) | (462 | ) | (1,206 | ) | (1,050 | ) | (1,335 | ) | ||||||||||
|
|
|
|
|
|
|
|
|
|
|
|||||||||||
| Total services |
U.S.$ | (3,700 | ) | U.S.$ | (6,775 | ) | U.S.$ | (6,376 | ) | U.S.$ | (4,938 | ) | U.S.$ | (11,601 | ) | |||||
|
|
|
|
|
|
|
|
|
|
|
|||||||||||
| (1) | Includes communication, construction, insurance, financial, information, entertainment and recreational services, as well as certain Government services. |
Source: INDEC and Ministry of Economy.
Tourism
In 2021, the tourism sector registered U.S.$0.96 billion in net outflows compared to U.S.$1.2 billion in net outflows in 2020. This decrease in net outflows was primarily due to a 53.0% decrease in outflows related to residents traveling abroad. In 2021, inflows related to non-residents traveling to Argentina decreased by 77.2%.
In 2022, the tourism sector registered U.S.$2.1 billion in net outflows compared to U.S.$0.96 billion in net outflows in 2021. This increase in net outflows was primarily due to a 310.2% increase in outflows related to residents traveling abroad. In 2022, inflows related to non-residents traveling to Argentina increased by 781.2%.
In 2023, the tourism sector registered U.S.$1.8 billion in net outflows compared to U.S.$2.1 billion in net outflows in 2022. This decrease in net outflows was primarily due to a 57.9% increase in inflows related to non-residents traveling to Argentina.
In 2024, the tourism sector registered U.S.$2.8 billion in net outflows compared to U.S.$1.8 billion in net outflows in 2023. This increase in net outflows was primarily due to a 9.6% decrease in inflows related to non-residents traveling to Argentina.
In 2025, the tourism sector registered U.S.$7.2 billion in net outflows compared to U.S.$2.8 billion in net outflows in 2024. This increase in net outflows was primarily due to a 54.7% increase in outflows related to residents traveling abroad.
D-77
The following table sets forth tourism information for the years specified.
Tourism Statistics
| 2021 | 2022 | 2023 | 2024 | 2025 | ||||||||||||||||
| Income from tourism (in millions of U.S.$) |
394 | 3,474 | 5,486 | 4,959 | 4,852 | |||||||||||||||
| Expenses from tourism (in millions of U.S.$) |
1,357 | 5,566 | 7,306 | 7,805 | 12,072 | |||||||||||||||
| Balance (in millions of U.S.$) |
(963 | ) | (2,093 | ) | (1,820 | ) | (2,845 | ) | (7,221 | ) | ||||||||||
Source: INDEC and Ministry of Economy.
Primary income
The primary income account records amounts payable and receivable between residents and non-residents in return for receiving or providing temporary use of labor, financial resources and non-produced non-financial assets, including, among other things, compensation of personnel and investment income (comprised of revenues obtained or paid for direct investment, portfolio investment, other investments and reserve assets).
In 2021, the primary income net deficit decreased by 7.0% to U.S.$9.8 billion, primarily due to a 66.1% decrease in net portfolio investment deficit.
In 2022, the primary income net deficit increased by 18.5% to U.S.$11.6 billion, primarily due to a 23.0% increase in net direct investment deficit.
In 2023, the primary income net deficit increased by 32.2% to U.S.$15.3 billion, primarily due to a 51.0% increase in net direct investment deficit.
In 2024, the primary income net deficit decreased by 9.7% to U.S.$13.8 billion, primarily due to a 11.3% decrease in net direct investment deficit.
In 2025, the primary income net deficit increased by 1.9% to U.S.$14.1 billion, primarily due to a 51.0% increase in net portfolio investment deficit.
The following table sets forth primary income information for the years specified.
Primary Income
(in millions of U.S. dollars)
| 2021 | 2022 | 2023 | 2024 | 2025 | ||||||||||||||||
| Primary Income (earnings) |
(9,773 | ) | (11,577 | ) | (15,301 | ) | (13,820 | ) | (14,079 | ) | ||||||||||
| Credit |
2,545 | 3,824 | 6,411 | 6,395 | 6,390 | |||||||||||||||
| Employee Compensation |
62 | 82 | 60 | 98 | 98 | |||||||||||||||
| Investment Income |
2,483 | 3,742 | 6,351 | 6,297 | 6,291 | |||||||||||||||
| Direct Investment |
852 | 1,132 | 2,170 | 2,004 | 1,963 | |||||||||||||||
| Portfolio Investment |
977 | 1,258 | 1,693 | 1,672 | 1,816 | |||||||||||||||
| Other Investment |
647 | 1,187 | 2,134 | 2,361 | 2,180 | |||||||||||||||
| Reserve Assets |
6 | 166 | 354 | 260 | 332 | |||||||||||||||
| Debit |
12,318 | 15,400 | 21,712 | 20,215 | 20,468 | |||||||||||||||
| Employee Compensation |
182 | 176 | 195 | 194 | 196 | |||||||||||||||
| Investment Income |
12,135 | 15,224 | 21,517 | 20,021 | 20,272 | |||||||||||||||
| Direct Investment |
5,829 | 7,251 | 11,408 | 10,203 | 9,208 | |||||||||||||||
| Portfolio Investment |
2,368 | 3,321 | 3,679 | 3,440 | 4,485 | |||||||||||||||
| Other Investment |
3,938 | 4,652 | 6,430 | 6,378 | 6,580 | |||||||||||||||
Source: INDEC and Ministry of Economy.
D-78
Capital Account
The capital account records the capital transfers between residents and non-residents of Argentina and the acquisition and disposal of non-produced, non-financial assets.
As required by the balance of payments reporting methodology adopted by INDEC in 2017 in accordance with the IMF recommendations, the capital account is presented separately from the financial account.
The capital account registered surpluses for each year from 2021 to 2025.
In 2021, the capital account recorded U.S.$253.0 million net surplus, a 53.5% increase from the capital account U.S.$164.8 million net surplus recorded in 2020.
In 2022, the capital account recorded U.S.$191.5 million net surplus, a 24.3% decrease from the capital account U.S.$253.0 million net surplus recorded in 2021.
In 2023, the capital account recorded U.S.$190.4 million net surplus, a 0.6% decrease from the capital account U.S.$191.5 million net surplus recorded in 2022.
In 2024, the capital account recorded U.S.$277.6 million net surplus, a 45.8% increase from the capital account U.S.$190.4 million net surplus recorded in 2023.
In 2025, the capital account recorded U.S.$454.1 million net surplus, a 63.6% increase from the capital account U.S.$277.6 million net surplus recorded in 2024.
Financial Account
The financial account records the net acquisition and disposal of financial assets and liabilities between residents and non-residents.
The financial account includes direct investment flows, portfolio investment, financial derivatives (other than foreign currency reserves), other investments and reserve assets (monetary gold, special drawing rights, reserve position in the IMF and other reserve assets). The reserves of the Central Bank make up part of the financial account. Distributable income generated in Argentina by foreign-owned assets that are not distributed, whether by determination of the owner or as a result of regulatory impediments (such as controls on remittances), is treated as an inflow in the year generated and not remitted for the purpose of the financial account.
In 2021, the financial account recorded net outflows of U.S.$4.5 billion, compared to net outflows of U.S.$1.4 billion recorded in the previous year.
Deposit-Collecting Entities. In 2021, deposit-collecting entities recorded net inflows of U.S.$1.6 billion compared to net outflows of U.S.$0.2 billion recorded in 2020. These inflows were mainly due to an increase in external liabilities.
Government. In 2021, the non-financial public sector recorded net outflows of U.S.$5.5 billion, compared to net outflows of U.S.$2.6 billion recorded in 2020, mainly due to the payment of loans in an aggregate amount of U.S.$2.3 billion.
Other Sectors. In 2021, net outflows in other sectors totaled U.S.$5.0 billion, compared to net outflows of U.S.$5.8 billion in the previous year. This change was mainly due to an increase in external liabilities compared to the previous year.
As a result of variations in the current, capital and financial accounts, the Central Bank’s foreign currency reserves decreased by U.S.$0.1 billion.
The Central Bank’s financial liabilities increased by U.S.$4.3 billion as a result of borrowing special drawing rights.
In 2022, the financial account recorded net inflows of U.S.$7.4 billion, compared to net outflows of U.S.$4.5 billion recorded in the previous year.
Deposit-Collecting Entities. In 2022, deposit-collecting entities recorded net inflows of U.S.$2.3 billion compared to net inflows of U.S.$1.6 billion recorded in 2021. These inflows were mainly due to an increase in external liabilities.
D-79
Government. In 2022, the non-financial public sector recorded net inflows of U.S.$5.7 billion, compared to net outflows of U.S.$5.5 billion recorded in 2021, mainly due to loan disbursements in an aggregate amount of U.S.$9.4 billion.
Other Sectors. In 2022, net inflows in other sectors totaled U.S.$6.4 billion, compared to net outflows of U.S.$5.0 billion in the previous year. This change was mainly due to an increase in external liabilities compared to the previous year.
As a result of variations in the current, capital and financial accounts, the Central Bank’s foreign currency reserves increased by U.S.$6.9 billion.
The Central Bank’s financial liabilities did not register a significant variation compared to the previous year.
In 2023, the financial account recorded net inflows of U.S.$25.9 billion, compared to net inflows of U.S.$7.4 billion recorded in the previous year.
Deposit-Collecting Entities. In 2023, deposit-collecting entities recorded net inflows of U.S.$4.8 billion compared to net inflows of U.S.$2.3 billion recorded in 2022. These inflows were mainly due to an increase in external liabilities.
Government. In 2023, the non-financial public sector recorded net outflows of U.S.$4.5 billion, compared to net inflows of U.S.$5.7 billion recorded in 2022, mainly due to loan payments in an aggregate amount of U.S.$2.0 billion.
Other Sectors. In 2023, net inflows in other sectors totaled U.S.$4.7 billion, compared to net inflows of U.S.$6.4 billion in the previous year. This change was mainly due to a higher increase in external assets than in external liabilities compared to the previous year.
As a result of variations in the current, capital and financial accounts, the Central Bank’s foreign currency reserves decreased by U.S.$21.7 billion.
The Central Bank’s financial liabilities decreased by U.S.$0.8 billion, mainly due to an increase in loan payments compared to the previous year.
In 2024, the financial account recorded net outflows of U.S.$2.3 billion, compared to net inflows of U.S.$25.9 billion recorded in the previous year.
Deposit-Collecting Entities. In 2024, deposit-collecting entities recorded net outflows of U.S.$0.08 billion compared to net inflows of U.S.$4.8 billion recorded in 2023. These outflows were mainly due to an increase in external assets.
Government. In 2024, the non-financial public sector recorded net outflows of U.S.$3.2 billion, compared to net outflows of U.S.$4.5 billion recorded in 2023, mainly due to loan disbursements in an aggregate amount of U.S.$1.5 billion, partially offset by an increase in payments from portfolio investment.
Other Sectors. In 2024, net inflows in other sectors totaled U.S.$7.6 billion, compared to net inflows of U.S.$4.7 billion in the previous year. This change was mainly due to a decrease in external assets compared to the previous year.
As a result of variations in the current, capital and financial accounts, the Central Bank’s foreign currency reserves increased by U.S.$6.1 billion.
The Central Bank’s financial liabilities decreased by U.S.$0.6 billion, mainly due to an increase in inflows from portfolio investment compared to the previous year.
In 2025, the financial account recorded net inflows of U.S.$12.0 billion, compared to net outflows of U.S.$2.3 billion recorded in the previous year.
Deposit-Collecting Entities. In 2025, deposit-collecting entities recorded net inflows of U.S.$7.5 billion compared to net outflows of U.S.$0.08 billion recorded in 2024. These inflows were mainly due to an increase in external assets inflows.
D-80
Government. In 2025, the non-financial public sector recorded net inflows of U.S.$20.3 billion, compared to net outflows of U.S.$3.2 billion recorded in 2024, mainly due to loan disbursements in an aggregate amount of U.S.$18.0 billion, and an increase in inflows from portfolio investment of U.S.$2.4 billion.
Other Sectors. In 2025, net outflows in other sectors totaled U.S.$12.6 billion, compared to net inflows of U.S.$7.6 billion in the previous year. This change was mainly due to an increase in external assets compared to the previous year.
As a result of variations in the current, capital and financial accounts, the Central Bank’s foreign currency reserves increased by U.S.$7.2 billion in balance of payments terms. This figure reflects only the change in reserves arising from balance of payments transactions and does not represent the total change in the Central Bank’s gross international reserves, as described below.
The Central Bank’s financial liabilities increased by U.S.$4.0 billion, mainly due to an increase in inflows from loans compared to the previous year.
Foreign Investment
Evolution of Portfolio and Direct Investment
The following table sets forth information on portfolio investment, direct investment and other investment in the Argentine economy for the periods indicated.
Flows of Portfolio, Direct and Other Investment
(in millions of U.S. dollars)
| 2021 | 2022 | 2023 | 2024 | 2025 | ||||||||||||||||
| Financial account |
U.S.$ | 4,502 | U.S.$ | (7,437 | ) | U.S.$ | (25,914 | ) | U.S.$ | 2,319 | U.S.$ | (12,003 | ) | |||||||
| Direct Investment |
(5,114 | ) | (13,116 | ) | (23,244 | ) | (9,590 | ) | (1,618 | ) | ||||||||||
| Net acquisition of financial assets (debt with foreign entities) |
1,544 | 2,090 | 3,023 | 2,774 | 2,743 | |||||||||||||||
| Net liabilities incurred (debt with foreign entities) |
6,658 | 15,206 | 26,267 | 12,365 | 4,362 | |||||||||||||||
| Portfolio investment |
4,940 | 7,463 | 6,910 | 4,130 | 278 | |||||||||||||||
| Net acquisition of financial assets |
1,495 | 2,067 | 3,069 | 3,551 | 5,999 | |||||||||||||||
| Net liabilities incurred |
(3,446 | ) | (5,396 | ) | (3,841 | ) | (578 | ) | 5,721 | |||||||||||
| Net financial derivatives |
(16 | ) | 4 | 10 | 19 | 3 | ||||||||||||||
| Other Investment |
4,797 | (8,708 | ) | 12,085 | 1,667 | (17,887 | ) | |||||||||||||
| Net acquisition of financial assets |
5,962 | 6,852 | 16,596 | (2,909 | ) | 10,075 | ||||||||||||||
| Net liability issuance |
1,165 | 15,560 | 4,511 | (4,576 | ) | 27,962 | ||||||||||||||
| Foreign currency reserves |
U.S.$ | (106 | ) | U.S.$ | 6,920 | U.S.$ | (21,675 | ) | U.S.$ | 6,093 | U.S.$ | 7,221 | ||||||||
Source: INDEC and Ministry of Economy.
Foreign Direct Investment
Direct investment in Argentina increased significantly in the 1990s following the implementation of the Convertibility Regime and the elimination of barriers to foreign investment. A significant portion of the capital inflows in the early to mid-1990s resulted from the privatization of state-owned entities that attracted private foreign capital. Net direct investment in Argentina peaked in 1999 with the completion of the privatization of YPF, a process that had started in 1992. Commencing in 2002, the macro-economic policies and the expropriation of private companies, including 51% of the shares of YPF, resulted in a significant decline in capital inflows from direct investment.
In 2021, net inflows from direct investment increased by U.S.$1.4 billion to U.S.$5.1 billion, as compared to U.S.$3.7 billion in 2020. This increase was mainly driven by a U.S.$1.8 billion increase in investments made by non-residents.
In 2022, net inflows from direct investment increased by U.S.$8.0 billion to U.S.$13.1 billion, as compared to U.S.$5.1 billion in 2021. This increase was mainly driven by a U.S.$8.5 billion increase in direct investments by non-residents.
D-81
In 2023, net inflows from direct investment increased by U.S.$10.1 billion to U.S.$23.2 billion, as compared to U.S.$13.1 billion in 2022. This increase was mainly driven by an U.S.$11.1 billion increase in direct investments by non-residents.
In 2024, net inflows from direct investment decreased by U.S.$13.6 billion to U.S.$9.6 billion, as compared to U.S.$23.2 billion in 2023. This decrease was mainly driven by a U.S.$13.9 billion decrease in direct investments by non-residents.
In 2025, net inflows from direct investment decreased by U.S.$8.0 billion to U.S.$1.6 billion, as compared to U.S.$9.6 billion in 2024. This decrease was mainly driven by an U.S.$8.0 billion decrease in direct investments by non-residents.
Portfolio Investment
Portfolio investments, consisting of the purchase of stocks, bonds or other securities, tend to be highly liquid and short-term, making them particularly responsive to fluctuations in the market.
In 2021, net outflows from portfolio investment totaled U.S.$4.9 billion compared to net outflows of U.S.$1.6 billion in 2020, mainly due to an increase in the purchase of net financial assets. Net inflows from derivative financial instruments totaled U.S.$16 million in 2021, compared to U.S.$10 million net outflows in 2020.
In 2022, net outflows from portfolio investment totaled U.S.$7.5 billion compared to net outflows of U.S.$4.9 billion in 2021, mainly due to an increase in the payment of net debts. Net outflows from derivative financial instruments totaled U.S.$4.0 million in 2022, compared to U.S.$16 million net inflows in 2021.
In 2023, net outflows from portfolio investment totaled U.S.$6.9 billion compared to net outflows of U.S.$7.5 billion in 2022, mainly due to a decrease in the payment of net debts. Net outflows from derivative financial instruments totaled U.S.$10.0 million in 2023, compared to U.S.$4.0 million net outflows in 2022.
In 2024, net outflows from portfolio investment totaled U.S.$4.1 billion compared to net outflows of U.S.$6.9 billion in 2023, mainly due to a decrease in the payment of net debts. Net outflows from derivative financial instruments totaled U.S.$19 million in 2024, compared to U.S.$10.0 million net outflows in 2023.
In 2025, net outflows from portfolio investment totaled U.S.$278.0 million compared to net outflows of U.S.$4.1 billion in 2024, mainly due to an increase in net liabilities incurred. Net outflows from derivative financial instruments totaled U.S.$3.0 million in 2025, compared to U.S.$19.0 million net outflows in 2024.
Other Investment
Other investment includes information regarding other assets and liabilities of the non-financial public sector (Government), the non-financial private sector and other financial entities (Other Sectors), the financial sector (Deposit-Collecting Entities) and the Central Bank, and are classified under:
| | other equity investments; |
| | coins and deposits; |
| | loans; |
| | insurance, pensions and standardized mechanisms for guarantees; |
| | commercial credits and advances; and |
| | other accounts payable/receivable. |
In 2021, other investments recorded net outflows of U.S.$4.8 billion. During this period, offshore investments by Argentine residents decreased to U.S.$6.0 billion from U.S.$7.5 billion in 2020 and investments by non-residents in Argentina totaled U.S.$1.2 billion inflows in 2021 compared to U.S.$3.7 billion outflows in 2020.
In 2022, other investments recorded net inflows of U.S.$8.7 billion. During this period, offshore investments by Argentine residents increased to U.S.$6.9 billion from U.S.$6.0 billion in 2021 and investments by non-residents in Argentina totaled U.S.$15.6 billion inflows in 2022 compared to U.S.$1.2 billion inflows in 2021.
D-82
In 2023, other investments recorded net outflows of U.S.$12.1 billion. During this period, offshore investments by Argentine residents increased to U.S.$16.6 billion from U.S.$6.9 billion in 2022 and investments by non-residents in Argentina totaled U.S.$4.5 billion inflows in 2023 compared to U.S.$15.6 billion inflows in 2022.
In 2024, other investments recorded net outflows of U.S.$1.7 billion. During this period, offshore inflows from investments by Argentine residents increased to U.S.$2.9 billion from U.S.$16.6 billion outflows in 2023 and investments by non-residents in Argentina totaled U.S.$4.6 billion outflows in 2024 compared to U.S.$4.5 billion inflows in 2023.
In 2025, other investments recorded net inflows of U.S.$17.9 billion. During this period, offshore investments by Argentine residents increased to U.S.$10.1 billion from U.S.$2.9 billion inflows in 2024 and investments by non-residents in Argentina totaled U.S.$28.0 billion inflows in 2025 compared to U.S.$4.6 billion outflows in 2024.
International Reserves
As of December 31, 2025, the Central Bank’s international reserves totaled U.S.$41.1 billion, 38.6% higher than as of December 31, 2024, of which U.S.$24.1 billion were foreign currency, U.S.$8.4 billion were placements in foreign currency and U.S.$8.6 billion were gold.
D-83
MONETARY SYSTEM
The Central Bank
Founded in 1935, the Central Bank is the principal monetary and financial authority in Argentina. The Central Bank operates pursuant to its charter and the Ley de Entidades Financieras (“Financial Institutions Law”).
The Central Bank is governed by a ten-member board of directors, which is headed by the Governor of the Central Bank. The Governor of the Central Bank and the members of the board of directors are appointed by the president and confirmed by the Senate. They serve for fixed terms of six years, may be reappointed and may be removed by the president only for cause. Under the terms of its charter, the Central Bank must operate independently from the Government.
Under the Central Bank’s charter, as most recently amended in 2012, the Central Bank, among other things:
| | must promote monetary and financial stability, employment and economic growth with social equality; |
| | is empowered to regulate interest rates and regulate and steer lending activities; |
| | must hold and manage the international reserves, including gold and foreign currency; |
| | must implement the exchange rate policy in accordance with applicable legislation; |
| | must act as financial agent of the Government and contribute to the proper functioning of capital markets, regulate any activity connected with the financial system and foreign exchange transactions and protect the rights of consumers of financial services; and |
| | may grant the Government exceptional advances in an amount up to the equivalent of 10% of the revenues collected by the Government in the preceding 12-month period. |
Monetary Policy
Background
From 1991 through 2001, Argentina’s monetary policy was governed by the Convertibility Law of 1991, which pegged the peso to the U.S. dollar at a one-to-one exchange rate and required the Central Bank to maintain international monetary reserves at least equal to the monetary base (consisting of domestic currency in circulation and financial institutions’ peso-denominated deposits with the Central Bank). During the Convertibility Regime, the peso appreciated in real terms and the Central Bank did not have the necessary tools to react to the external shocks that affected the Argentine economy, such as the Mexico Crisis in 1995 and the Asian Crisis in 1997. In addition, commencing in 1995 the Government increased its reliance on the international capital markets to finance its operations, creating additional demand for foreign exchange reserves at the pegged rate. By December 2001, continued capital flight from the Argentine economy had made the Convertibility Regime unsustainable. On January 6, 2002, Congress enacted the Public Emergency Law, effectively bringing an end to the Convertibility Regime by eliminating the requirement that the Central Bank’s gross international reserves be at all times equal to at least 100% of the monetary base. The Public Emergency Law abolished the peg between the peso and the U.S. dollar and granted the executive branch the power to regulate the foreign exchange market and to establish exchange rates.
In 2003, the Central Bank implemented a series of measures designed to restore monetary stability and bolster the international reserves of the Central Bank. These measures included the elimination of the quasi-currencies issued by several provinces during the 2001-2002 crisis, the recapitalization of several financial institutions that were affected by the decree mandating asymmetric pesification of their balance sheets in 2002, the adoption of inflation targets intended to limit the impact of an acceleration of economic growth, the expansion of the financial system’s lending activities and the encouragement of capital market transactions as a source of financing economic growth. During the last quarter of 2004, the Central Bank began accumulating international monetary reserves and implemented various measures to manage the increasing monetary base.
Starting in the second half of 2007, in response to tightening credit markets and the global financial crisis, the Central Bank intervened in the foreign exchange market to manage increasing volatility in the exchange rate, provided liquidity to local banks and expanded the monetary base. The Central Bank’s actions included, among other measures, managing the yields on repo loans, auctioning put options on Lebacs and Nobacs and reducing the minimum reserve requirements in foreign currency for financial institutions. These measures allowed banks to keep their liquidity ratios within appropriate levels and sought to stimulate lending by banks. In late 2009, the Government issued a Decreto de Necesidad y Urgencia (emergency decree) making foreign reserves held by the Central Bank available for external debt payments.
D-84
In 2012, the Central Bank’s Charter was amended to expand the Central Bank’s mandate, including objectives linked to the real economy, increasing its powers and tools. As a result, the Central Bank began to actively promote credit, particularly credit to productive activities. In addition, the exercise of an active monetary policy and the policy measures aimed at reducing the volatility of the nominal exchange rate required the implementation of capital controls, which were in force since the end of 2011.
In December 2015, the Central Bank allowed the peso to float, eliminated restrictions on foreign exchange and capital flows, and streamlined foreign exchange regulations. In addition, the Central Bank announced its decision to implement a long term monetary policy based on inflation targeting, and to rely on short term interest notes as its primary monetary policy tool. Beginning in January 2017, the Central Bank implemented a formal scheme of inflation targeting, using the 7-day repo reference rate as the anchor of its inflation targeting regime.
On October 1, 2018, following an agreement with the IMF, the Central Bank modified its monetary and exchange rate regime with the aim of decoupling it from the formation of inflation expectations. In this context, the Central Bank replaced the inflation targeting regime established in September 2016 with a new framework based on a monetary base target, complemented by the definition of intervention and non-intervention zones in the foreign exchange market.
In September 2019, the Central Bank introduced new restrictions on foreign exchange transactions and capital flows. The main measures included the requirement that export proceeds be settled in the foreign exchange market, limits on the purchase of foreign currency for hoarding purposes and the requirement to obtain prior Central Bank approval for the repatriation of profits. These restrictions were maintained or tightened in the following years until December 2023, and additional measures were adopted, including restrictions on access to the MLC for individuals who received pandemic-related government assistance or enjoyed consumption subsidies, as well as restrictions on increases in import payments compared to previous years.
Monetary Policy measures implemented in 2021
In 2021, the Central Bank maintained its monetary policy based on guidelines defined in October 2020, which included:
| | (i) an increase in the overnight reverse swaps rates from 19% to 30% to increase the return in real rates of short-term local currency financial instruments, (ii) offerings of 7-day swaps with an annual rate of 33%, (iii) setting the Leliqs rate at 36% in order to gradually align the Treasury’s rates with the Central Bank’s sterilization instrument rates, and (iv) setting annual nominal rates applicable to fixed term deposits at 34% for 30-days placements of up to Ps.1 million by individuals, and at 32% for all other placements; |
| | abandonment of the mechanism of preset devaluation, providing greater flexibility and maintaining the competitive level of the multilateral real exchange rate; and |
| | the opening of a roundtable at the MAE and allowing authorizations to be processed at the Rosario Futures Exchange (ROFEX) to allow purchases of Renminbi for foreign trade operations. |
The measures taken by the Government to strengthen the peso debt market allowed channeling a significant proportion of financing needs through such market, reducing the Central Bank’s monetary financial assistance to the Treasury.
At the same time, the Central Bank sought to promote the development of the domestic capital market by allowing financial entities to integrate a percentage of their reserve requirements in Leliqs as well as in peso-denominated securities acquired in primary issuances by the Government (excluding those linked to the U.S. dollar) and with a minimum duration of 180 days. In order to guarantee liquidity at all times, banks were allowed to sell to the Central Bank securities acquired to meet reserve requirements.
The Central Bank maintained the minimum fixed-term and monetary policy interest rates unchanged during the period. The Central Bank and the Government maintained measures to ensure access to credit by MSMEs under favorable conditions. In addition, measures were taken to increase bank financing more broadly to the private sector. See “The Argentine Economy—Background and Recent Economic History—2020-2023.”
With regards to foreign exchange policy, the Central Bank complemented its structural objective of accumulating international reserves with a short-term strategy consisting of managing the volatility of the nominal exchange rate to further the anti-inflationary strategy and promote a more efficient allocation of foreign currency through foreign exchange regulation. Regarding the nominal exchange rate, the Central Bank maintained a relatively limited depreciation rate, in order to contribute to the disinflationary process.
D-85
Monetary Policy measures implemented in 2022
In 2022, the Central Bank resumed the policy guidelines set forth in 2020 aimed at consolidating the growth of the domestic market and exports through monetary and financial stability. The measures adopted by the Central Bank to comply with these guidelines included:
| | Monetary Policy. The Central Bank redesigned its monetary policy instruments, with the objective of (i) improving liquidity management at the financial institution level, (ii) increasing the average maturity of sterilization instruments, by issuing instruments such as the Notaliqs, and (iii) focusing the monetary policy rate on Leliqs’ interest rates. In addition, the Central Bank ceased the use of seven-day swaps among interest-bearing liabilities. Pursuant to the revised monetary policy, overnight reverse repos sterilized financial institutions’ short-term liquidity, while long-term Leliqs addressed structural liquidity. Further, the Central Bank amended regulations so that private sector financial institutions may purchase these instruments up to the amount of their stock of time deposits. |
| | Benchmark Rates. The Central Bank increased benchmark rates on saving instruments with the objective of ensuring that depositors obtained positive returns for savings in pesos. Further, the Central Bank raised the monetary policy interest rates as well as the minimum guaranteed interest rates on fixed-term deposits with the objective of supporting the demand for saving instruments in domestic currency. |
| | Credit Policy. In 2022, the Central Bank’s credit policy followed the guidelines established in 2021, focusing on sustaining credit assistance to MSMEs. The Central Bank maintained a gradual adjustment of the nominal annual rate for investment projects and the nominal annual rate for working capital mainly to ensure access to credit under favorable conditions by MSMEs. |
| | Treasury Instruments. The Central Bank sought to reduce the volatility in the prices of treasury instruments. To that effect, the Central Bank announced its participation in the secondary market of securities issued by the Government with a residual term greater than 15 days, buying at rates similar to those of prior auctions (plus a maximum spread of 2%) so that yields in the secondary market remained consistent with those determined in the primary market. |
Further, the Central Bank decided to incorporate the interest rate of short-term Treasury bills as a reference for monetary policy decisions. This decision was part of the Central Bank’s strategy to (i) move towards a structure of positive interest rates in real terms, taking the main financial assets of the economy as a reference, (ii) strengthen the public debt market in pesos, increasing depth and liquidity, and (iii) gradually advance in the use of Treasury instruments as monetary policy instruments.
| | Transfers to the Treasury: In 2022, the Government moved towards a gradual reduction of transfers from the Central Bank to the Treasury, establishing a limit equivalent to 1% of GDP for 2022. In addition, the Central Bank established a positive real interest rate structure to strengthen the demand for local currency assets and contribute to the exchange and financial stability. |
| | Exchange rate policy: The Central Bank (i) gradually accelerated the crawling peg to bring the rate to levels in line with the domestic inflation rate, and (ii) promoted a more efficient allocation of foreign currency through foreign exchange regulation. Further, the Government introduced a special foreign exchange rate to liquidate soybean exports to increase export sales and facilitate access to the foreign exchange market. See “—Role of the State in the Economy—Energy Sector Reforms” |
Monetary Policy measures implemented in 2023 by the Fernández Administration
In 2023, the Central Bank adopted measures aimed at consolidating the growth of the domestic market and exports through monetary and financial stability. The measures adopted by the Central Bank included:
| | Monetary Policy: The Central Bank’s monetary policy guidelines included (i) the management of liquidity ratios with the aim of reducing inflation (using Leliqs and Notaliqs, with a 28-day Leliq’s rate to monitor monetary policy), (ii) setting interest rates to maintain positive real returns on investments in pesos and (iii) promotion of the stability and development of the capital market, monitoring the financial balance. |
| | Foreign Exchange Policy: The Central Bank sought to (i) preserve external competitiveness, (ii) strengthen the position of international reserves and (iii) manage and adjust foreign exchange regulations to ensure monetary and foreign exchange stability. |
| | Credit Policy: The Central Bank stimulated financial intermediation to boost consumption, productive investment and technological development. Further, the Central Bank adopted measures aimed at promoting the development of credit in pesos for the private sector. |
D-86
| | Financial policy: The Central Bank sought to increase the number of participants in the credit market and took measures to guarantee the financial stability and solvency of the banking system, while implementing technological improvements aimed at increasing transparency and security. In addition, the Central Bank promoted new agreements with the provinces, other state agencies and organizations aimed at promoting integration across all sectors of society and to improve financial education. Further, the Central Bank monitored crypto assets and virtual wallets and their impact on financial institutions. Additionally, the Central Bank promoted measures in connection with sustainable finance within the framework of international and local commitments, including the generation and release of relevant information to assess potential risks to the stability of the financial system. |
In April 2023, the Government announced a currency swap with China for U.S.$1.0 billion aimed at facilitating payments of imports from China. In June 2023, the Central Bank entered into an early renewal of the swap agreement for up to U.S.$19.0 billion for a three-year term. The Central Bank also authorized the opening of renminbi (“RMB”) savings and checking accounts, complementing the measure adopted by the CNV to enable negotiation of securities in RMB.
In May 2023, the Central Bank increased the monetary policy rate by 600 basis points to reach 97%. Further, the Central Bank increased the minimum interest rate on time deposits for individuals, increasing the minimum rate on 30-day time deposits of up to Ps.30 million to 97% and the rest of the private sector time deposits to 90%. In addition, the rate for the financing of unpaid credit card balances was reduced from 88% to 86%.
In August 2023, the Board increased the minimum rate on 30-day time deposits from 97% to 118%, and it increased it again to 133% in October 2023, while maintaining the rate for other private sector time deposits at 126%.
Monetary Policy measures implemented in 2023 during the Milei Administration
On December 12, 2023, the Central Bank introduced a new monetary policy framework, focusing on eliminating the fiscal deficit financed by monetary issuance to achieve fiscal equilibrium. This framework also sought to address regulatory issues, correct relative prices, and clean up the Central Bank’s balance sheet by recovering international reserves and managing remunerated liabilities.
On December 13, 2023, the Central Bank depreciated the nominal currency exchange rate to stabilize the MULC and set the exchange rate at Ps.799.98 per U.S. dollar, from Ps.366.5 per U.S. dollar on December 12, 2023. This rate was intended as a temporary anchor for inflation expectations, with a planned monthly adjustment of 2%. Payment systems for goods and services were simplified by removing the need for SIRA (as defined below) authorizations and the Certificado de Cuenta Única de Comercio Exterior en la AFIP. Additionally, a payment scheduling scheme based on import tariff positions was established to manage foreign currency demand, particularly during low-season agricultural exports months.
On December 13, 2023, the Milei administration issued Decree No. 28/2023 establishing a new edition of the Programa de Incremento Exportador (“Export Increase Program”) allowing for the acquisition of 20% of the foreign currency derived from export collections through the stock market and requiring at least 80% to be negotiated through the foreign exchange market.
In addition, to provide predictability for payments associated with the stock of commercial debt accumulated by importers up to December 12, 2023, the Central Bank announced the terms for new instruments called “Bonds for the Reconstruction of a Free Argentina” (“Bopreal”). Through the auction of these instruments, the Central Bank aimed to offer an orderly solution to address the crisis caused by the accumulation of commercial debts by importers. In this context, importers were given the opportunity to acquire these instruments using their available liquidity in pesos to meet their foreign commitments and, in return, they received a certain flow of foreign currency from the Central Bank. As of the date of this Annual Report, the Central Bank had placed the full amount announced for each of the four series of Bopreals in an aggregate original principal amount of US$10.8 billion.
In terms of monetary market normalization, the Central Bank ceased new Leliq auctions and adopted overnight repos as the primary tool for managing excess liquidity. The overnight repo rate was reduced to 100%, down from the previous Leliq rate of 133%. The minimum term deposit rate was set at 110%. The discontinuation of future Leliq auctions shifted focus to repo operations for managing monetary excesses. The Central Bank centralized its operations around a single monetary instrument to clarify policy signals and influence other interest rates.
D-87
Monetary Policy measures implemented in 2024
During the first phase of the monetary program, the Central Bank focused on reducing the speed of growth of the Peso money supply, which was achieved through a reduction of interest rates and the changes in the monetary instruments implemented at the beginning of the new administration. In this context, the monetary policy rate was reduced to 80% annually (from 100% annually) in March 2024, further reduced to 60% annually by the end of April, to 40% annually in May 2024, and to 32% annually in December 2024. Minimum rates for term deposits were eliminated in March, together with maximum rates on credit cards, a surcharge imposed on agricultural exporters holding stocks, and subsidies to payments in installments for consumers, among other measures.
The Milei administration further liberalized foreign market restrictions, including easing payment for importers by allowing import payments through the MLC, initially establishing payment terms which were gradually reduced and then eliminated in April 2025, thereby reducing their financial costs. Additionally, the Central Bank doubled the amounts individuals could collect for services without forced liquidation in the MLC, raising the prior annual limit from U.S.$12,000 to U.S.$36,000 in December 2024. In September 2025, collections from service exports provided by natural persons were exempted from the obligation to be settled in the official foreign exchange market. Individuals who received pandemic-related government assistance or enjoyed consumption subsidies were also allowed to engage in foreign exchange operations through bonds.
Among the large number of reforms aimed at normalizing the functioning of a banking system that hosted a complex web of disguised financial subsidies, the Central Bank redefined the incentive scheme, effective as of April 2024, to facilitate credit access for MSMEs. The scheme provides for a reduction in the minimum cash reserve requirements for financial institutions that maintain an average stock of MSME’ loans representing at least 7.5% of their total deposits in pesos from the non-financial private sector. Moreover, the scheme requires that 30% of those holdings be channeled to investment projects with a minimum average term of 24 months. To further encourage longer-term investment projects, the Central Bank offered a 40% reduction in the minimum reserves required for financial institutions financing projects maturing in 36 months or more.
On April 15, 2024, the Central Bank increased minimum reserve requirements on term deposits held by mutual funds from 0% to 10%, as part of its liquidity management strategy. The requirement was subsequently raised to 15% on May 15, 2024, and to 20% on November 1, 2024, with the objective of standardizing the prudential regulatory treatment of similar accounts.
In June 2024, the Central Bank entered into a renewal of the currency swap with China for U.S.$5.0 billion until July 2026.
In July 2024, the Central Bank launched the second phase of its monetary program, aimed at reducing inflation and enabling future currency competition by capping monetary liabilities and aligning pesos in circulation with the April 2024 monetary base. As part of this effort, it closed the reverse repo window to limit endogenous money creation and, together with the Treasury, introduced one-year LEFIs to absorb excess liquidity and support balance sheet cleanup, providing banks with a new tool to manage liquidity without generating sterilization costs.
In 2024, there was a sustained accumulation of international reserves, reversing the trend seen in 2023, supported by the BOPREAL offerings, which postponed the amount of foreign currency used to repay importers’ accumulated commercial debts and the payment scheduling scheme of imports carried out since December 12, 2023. The Central Bank’s reserves increased to U.S.$29.6 billion by the end of December 2024, representing a 28.5% increase compared to December 2023. Greater credibility and the anchoring of expectations brought about by the implementation of the new economic program contributed to reduce the spread between the official and informal dollar prices. This reduced exchange rate uncertainty and improved inflation expectations.
Monetary Policy measures implemented in 2025
During 2025, the Ministry of Economy repurchased nontransferable notes due between 2025 and 2029 held by the Central Bank, for a total nominal amount of U.S.$16.9 million.
On January 30, 2025, the Board of the Central Bank reduced the monetary policy rate from an annual rate of 32% to an annual rate of 29%.
On January 16, 2025, the Central Bank announced a technical adjustment to the crawling peg, pursuant to which, effective February 1, 2025, the monthly rate of managed depreciation of the official exchange rate was reduced from 2% to 1%. This adjustment did not constitute a change in the exchange rate regime, as the exchange rate continued to be administered by the Central Bank within the framework of the existing foreign exchange controls (commonly referred to as the “cepo cambiario”), and the restrictions on access to the MLC were not modified. On February 20, 2025, the Central Bank eased the conditions for granting foreign currency loans by eliminating the prohibition on financial institutions extending such loans to customers that do not generate foreign currency revenues. As a result, financial institutions were permitted to extend foreign currency loans to a broader range of customers, provided that such loans were funded in the financial or capital markets.
D-88
On April 11, 2025, the Central Bank launched the third phase of its economic stabilization program, introducing a fundamental shift in the monetary and exchange rate regime, which included the following measures:
| | The Central Bank replaced the crawling peg arrangement with a floating exchange rate regime within a band, setting an initial floor and ceiling for the U.S. dollar at the MLC of Ps.1,000 and Ps.1,400 per U.S. dollar, respectively. The lower and upper values of the band adjust at a rate of -1% and +1% per month, respectively. When the exchange rate reaches the band floor, the Central Bank purchases U.S. dollars and does not sterilize the resulting issuance of Pesos, thereby facilitating the re-monetization of the economy. When the exchange rate reaches the band ceiling, the Central Bank sells U.S. dollars to absorb surplus liquidity. Within the band, the Central Bank may (i) purchase U.S. dollars to accumulate international reserves or (ii) sell U.S. dollars to stabilize sudden volatility in the exchange rate. |
| | The Central Bank eliminated the special foreign exchange rate used by exporters to settle their exports (commonly referred to as the “dólar blend”), under which exporters had been required to settle 80% of their export proceeds in the MLC and the remaining 20% by purchasing negotiable securities settled in foreign currency. In addition, restrictions on the purchase of foreign currency by individuals were eliminated, the 30% advance payment on the personal assets tax applicable to purchases of foreign currency for savings purposes was eliminated, and the distribution of dividends to foreign shareholders was permitted with respect to fiscal years beginning on or after January 1, 2025. Deadlines for payments related to foreign trade operations were also extended. |
| | The Central Bank replaced the prior limit on the broad monetary base with a monetary framework centered on the strict monitoring of the Private Transactional M2 aggregate. In addition, the Central Bank adopted a complementary metric based on Activos Internos Netos (Net Domestic Assets or “NDA”), in accordance with the Republic’s EFF agreement with the IMF signed on April 11, 2025, which also provides for quarterly guidance for both the evolution of NDA and the accumulation of net international reserves. |
On July 10, 2025, the Central Bank discontinued the issuance of Letras Fiscales de Liquidez (“LEFIs”) to financial institutions. LEFIs had been introduced during the second phase of the monetary program to absorb excess liquidity in the banking sector, thereby transferring the interest cost of sterilization from the Central Bank to the National Treasury. Following the reduction in excess liquidity, the Central Bank determined that the continued availability of LEFIs at administered rates was attracting balances that could be more efficiently channeled through conventional market instruments.
Prior to the maturity of the LEFIs on July 17, 2025, the outstanding LEFIs held on the Central Bank’s balance sheet were exchanged for short-term, fixed-rate, Peso-denominated securities (“LECAPs”) quoted in the secondary market. Financial institutions were directed to reallocate their LEFI holdings to current accounts at the Central Bank, Treasury securities, private repo transactions and cauciones, or other instruments.
The discontinuation of LEFIs was accompanied by the elimination of the administered monetary policy rate. As a result, interest rates are determined endogenously by the market, consistent with the Central Bank’s monetary aggregate framework. The Central Bank implements its operational strategy through open market operations, repo transactions and simultaneous operations in the securities markets. In addition, the Central Bank maintains an active repo facility to address temporary liquidity stress, at rates set at a spread over prevailing market rates.
Between April and September 2025, the Central Bank progressively increased reserve requirements on demand deposits. These measures were part of a broader regularization of the reserve requirement regime under which, as of December 2023, when the current administration took office, the effective cash backing ratio stood at 4% of deposits, significantly below its historical prudential level of 11% to 12%. Beginning in November 2025, as financial conditions stabilized following the elections, reserve requirements were gradually eased, with the daily minimum integration requirement reduced from 100% to 65% and the additional integration requirement in Government securities scheduled to expire by April 2026.
On October 20, 2025, the Central Bank announced that it had entered into a currency stabilization agreement with the U.S. Department of the Treasury for an amount of up to U.S.$20 billion. The agreement aims to support Argentina’s macroeconomic stability, with a particular focus on preserving price stability and promoting sustainable economic growth. The agreement sets forth the terms and conditions for bilateral currency swap operations between both parties, which are expected to expand the Central Bank’s monetary and exchange policy toolkit and strengthen the liquidity of its international reserves. The Central Bank drew U.S.$2.5 billion of the total amount under the currency stabilization agreement, and paid interest for a total aggregate amount of U.S.$17.7 million. As of the date of this Annual Report, there are no amounts due by the Central Bank under such agreement.
D-89
On December 15, 2025, the Central Bank announced a new phase of its monetary policy program commencing on January 1, 2026, with the objective of consolidating price stability, supporting economic growth and advancing the re-monetization of the economy. The program prioritizes the accumulation of international reserves as the primary source of monetary expansion. The new monetary program’s main objectives are (i) convergence of domestic inflation toward international levels while accommodating increased money demand without generating inflationary pressures, (ii) strengthening the Central Bank’s balance sheet through international reserve accumulation, and (iii) maintaining anchored inflation expectations and monetary policy predictability. The main measures effective as of January 1, 2026 is a monthly adjustment of the ceiling and floor of the exchange rate floating band, based on the Republic’s inflation rate as reported by the National Institute of Statistics and Census with a two-month lag.
Coordination with the National Treasury is expected to prevent negative impacts on liquidity. The potential recovery of the National Treasury’s access to international debt markets could allow for a higher level of reserve accumulation at the Central Bank, since foreign currency debt maturities could be refinanced without requiring access to Central Bank foreign exchange reserves.
As of December 31, 2025, the Central Bank transferred a total aggregate amount of Ps.27.2 billion (approximately U.S.$18.6 million) to the Popular Bank of China under a currency swap agreement executed in 2023.
D-90
Central Bank Balance Sheet
The following table sets forth information on the Central Bank’s balance sheet as of the dates specified.
Central Bank Balance Sheet
(in millions of current pesos, unless otherwise specified)(1)
| As of December 31, | ||||||||||||||||||||
| 2021 | 2022 | 2023 | 2024 | 2025 | ||||||||||||||||
| Assets |
||||||||||||||||||||
| International reserves: |
||||||||||||||||||||
| Gold |
Ps. | 330,237 | Ps. | 640,845 | Ps. | 3,311,445 | Ps. | 5,375,345 | Ps. | 12,530,059 | ||||||||||
| Foreign currency |
2,921,510 | 4,513,989 | 11,601,050 | 19,577,050 | 35,234,301 | |||||||||||||||
| Placements of foreign currency |
823,583 | 2,785,659 | 3,749,438 | 5,596,735 | 11,948,014 | |||||||||||||||
| Other(2) |
9 | (41,092 | ) | (7,665,236 | ) | 54,459 | 262,296 | |||||||||||||
|
|
|
|
|
|
|
|
|
|
|
|||||||||||
| Total international reserves(3) |
4,075,339 | 7,899,402 | 18,654,268 | 30,603,589 | 59,974,669 | |||||||||||||||
|
|
|
|
|
|
|
|
|
|
|
|||||||||||
| Public bonds(4) |
6,729,781 | 14,598,142 | 45,936,489 | 74,635,647 | 110,578,140 | |||||||||||||||
| Credits to: |
||||||||||||||||||||
| Government (temporary advances)(5) |
2,173,049 | 2,793,100 | 1,775,685 | 2,934,952 | 2,901,845 | |||||||||||||||
| Financial system |
116 | 125 | 149 | 811 | 17,720 | |||||||||||||||
| International organizations(6) |
528,193 | 927,645 | 4,364,621 | 5,746,232 | 8,572,356 | |||||||||||||||
| Other assets(7) |
5,603,680 | 2,776,621 | 28,691,087 | 2,786,495 | 5,509,661 | |||||||||||||||
|
|
|
|
|
|
|
|
|
|
|
|||||||||||
| Total assets |
19,110,158 | 28,995,035 | 99,422,299 | 116,707,727 | 187,554,391 | |||||||||||||||
|
|
|
|
|
|
|
|
|
|
|
|||||||||||
| Liabilities |
||||||||||||||||||||
| Monetary Base: |
||||||||||||||||||||
| Currency in circulation(8) |
2,691,400 | 4,094,595 | 7,435,216 | 19,988,275 | 27,109,343 | |||||||||||||||
| Current accounts in pesos(9) |
962,636 | 1,109,156 | 2,172,776 | 9,740,300 | 15,847,623 | |||||||||||||||
|
|
|
|
|
|
|
|
|
|
|
|||||||||||
| Total monetary base |
3,654,036 | 5,203,751 | 9,607,992 | 29,728,575 | 42,956,965 | |||||||||||||||
|
|
|
|
|
|
|
|
|
|
|
|||||||||||
| Deposits: |
||||||||||||||||||||
| Government deposits |
119,383 | 1,212,511 | 1,002,754 | 12,261,239 | 7,042,997 | |||||||||||||||
| Other deposits |
1,242,412 | 2,139,357 | 7,360,925 | 12,641,750 | 22,045,067 | |||||||||||||||
|
|
|
|
|
|
|
|
|
|
|
|||||||||||
| Total deposits |
1,361,796 | 3,351,868 | 8,363,678 | 24,902,989 | 29,088,065 | |||||||||||||||
|
|
|
|
|
|
|
|
|
|
|
|||||||||||
| Obligation to international organizations |
324,131 | 554,762 | 1,856,378 | 127,450 | 3,826,923 | |||||||||||||||
| Central Bank notes: |
||||||||||||||||||||
| Notes issued in foreign currency |
— | 82,871 | 2,474,069 | 9,494,910 | 11,255,469 | |||||||||||||||
| Notes issued in pesos |
5,044,615 | 10,400,575 | 28,584,250 | 151,508 | 250,024 | |||||||||||||||
|
|
|
|
|
|
|
|
|
|
|
|||||||||||
| Total Central Bank notes(10) |
5,044,615 | 10,483,446 | 31,058,319 | 9,646,418 | 11,506,393 | |||||||||||||||
| Other liabilities |
8,081,256 | 7,000,036 | 46,697,928 | 28,858,248 | 48,877,841 | |||||||||||||||
|
|
|
|
|
|
|
|
|
|
|
|||||||||||
| Total liabilities |
18,465,834 | 26,593,862 | 97,584,295 | 93,263,681 | 136,256,188 | |||||||||||||||
|
|
|
|
|
|
|
|
|
|
|
|||||||||||
| Net assets |
Ps. | 644,325 | Ps. | 2,401,173 | Ps. | 1,838,004 | Ps. | 23,444,046 | Ps. | 51,298,204 | ||||||||||
|
|
|
|
|
|
|
|
|
|
|
|||||||||||
| Memorandum items: |
||||||||||||||||||||
| International reserves (in millions of U.S. dollars) |
U.S.$ | 39,663 | U.S.$ | 44,597 | U.S.$ | 23,073 | U.S.$ | 29,640 | U.S.$ | 41,095 | ||||||||||
| International reserves of the central bank (in months of total imports) |
6.6 | 5.5 | 3.0 | 4.4 | 4.9 | |||||||||||||||
| Exchange rate Ps./U.S.$(11) |
102.750 | 177.128 | 808.483 | 1,032.500 | 1,459.417 | |||||||||||||||
| (1) | Figures in this table are reflected at constant prices for each year indicated and, therefore, are not comparable. Notwithstanding the foregoing, in the case of deposits, the information presented in the Central Bank’s balance sheet at constant prices shows no variation compared to the information reported in the balance sheet for the last week of each year, which allows for year-over-year comparisons. |
| (2) | Includes net results of transactions under a Reciprocal Credit Agreement with ALADI. |
| (3) | Includes short-term foreign-currency denominated bonds and foreign currency-denominated deposits. |
| (4) | Includes a 1990 consolidated Treasury note, IMF obligations and others. |
| (5) | The valuation criteria changed to amortized cost starting on May 7, 2024. |
| (6) | Includes transfers to international organizations from Government accounts and transfers to the Government from the IMF. |
| (7) | Includes transition accounts and others. |
| (8) | Includes cash in vaults at banks. |
| (9) | Includes bank reserves in pesos at Central Bank. |
| (10) | Includes Lebacs, Nobacs and Leliqs. |
| (11) | Exchange rate used by the Central Bank to publish its balance sheet. |
Source: Central Bank.
D-91
In 2021, Government deposits with the Central Bank increased to Ps.119.4 billion from Ps.68.8 billion in 2020.
In 2022, Government deposits with the Central Bank increased to Ps.1,212.5 billion from Ps.119.4 billion in 2021, mainly due to disbursements made by the IMF under the EFF.
In 2023, Government deposits with the Central Bank decreased to Ps.1,002.7 billion from Ps.1,212.5 billion in 2022, mainly due to a decrease in the economic activity index, high inflation levels and a loss in the purchasing power of income.
In 2024, Government deposits with the Central Bank increased to Ps.12,261.2 billion from Ps.1,002.7 billion in December 2023, mainly due to monetary policy measures and the transfer of the remaining monetary liabilities from the Central Bank balance sheet to that of the Treasury through the issuance of Lecaps. On May 20, 2024, the Central Bank transferred Ps.8,600 billion in reverse repos to Treasury’s Lecaps, resulting in a decrease in the costs related to the sterilization of the fiscal deficit accumulated in previous years.
In 2025, Government deposits with the Central Bank decreased to Ps.7,043.0 billion from Ps.12,261.2 billion in 2024, mainly due to an increase in the legal banking reserve from August 2025 onwards, which was partially covered through a reduction of government deposits.
Liquidity Aggregates
The monetary base consists of domestic currency in circulation (including cash held in vaults by banks) and peso-denominated deposits of financial entities with the Central Bank.
Additionally, the following aggregates measure the level of liquidity in the economy:
| | M1 measures cash held by the public plus peso-denominated demand deposits and foreign currency-denominated demand deposits; |
| | M2 measures M1 plus peso-denominated savings deposits and foreign currency-denominated savings deposits; and |
| | M3 measures M2 plus all other peso-denominated deposits and foreign currency-denominated deposits. |
The following tables set forth information on Argentina’s liquidity aggregates as of the dates specified:
Liquidity Aggregates
(in millions of Pesos)
| As of December 31, | ||||||||||||||||||||
| 2021 | 2022 | 2023 | 2024 | 2025 | ||||||||||||||||
| Currency in circulation(1) |
Ps. | 2,691,400 | Ps. | 4,094,595 | Ps. | 7,435,216 | Ps. | 19,988,275 | Ps. | 27,109,343 | ||||||||||
| M1 |
5,349,814 | 8,500,538 | 19,099,669 | 46,736,872 | 61,956,121 | |||||||||||||||
| M2 |
9,222,007 | 15,708,500 | 47,189,209 | 101,293,398 | 138,693,131 | |||||||||||||||
| M3 |
14,624,669 | 26,511,519 | 67,904,601 | 152,704,345 | 220,576,916 | |||||||||||||||
| Monetary base |
Ps. | 3,654,036 | Ps. | 5,203,751 | Ps. | 9,607,992 | Ps. | 29,728,575 | Ps. | 42,956,965 | ||||||||||
| (1) | Includes cash held by the public and cash held in bank vaults. |
Source: Central Bank.
Liquidity Aggregates
(% change from previous period)
| As of December 31 | ||||||||||||||||||||
| 2021 | 2022 | 2023 | 2024 | 2025 | ||||||||||||||||
| Currency in circulation(1) |
41.8 | % | 52.1 | % | 81.6 | % | 168.8 | % | 35.6 | % | ||||||||||
| M1 |
59.1 | 58.9 | 124.7 | 144.7 | 32.6 | |||||||||||||||
| M2 |
53.3 | 70.3 | 200.4 | 114.7 | 36.9 | |||||||||||||||
| M3 |
52.0 | 81.3 | 156.1 | 124.9 | 44.4 | |||||||||||||||
| Monetary base |
47.9 | % | 42.4 | % | 84.6 | % | 209.4 | % | 44.5 | % | ||||||||||
| (1) | Includes cash held by the public and cash held in bank vaults. |
Source: Central Bank.
D-92
In 2021, the monetary base increased by 47.9% (compared to an inflation of 50.9% in the same year), with 72.4% of the increase explained by net transfers from the Central Bank to the Treasury (in the form of temporary advances and profit transfers) and purchases of foreign currency by the Central Bank. The expansion of the monetary base was partially sterilized through regulatory monetary instruments (passive repos and Leliqs). In particular, the stock of remunerated peso-denominated liabilities increased by 66.3% during 2021.
In 2022, the monetary base increased by 42.4% (compared to an inflation of 94.8% in the same year), with 57.5% of the increase explained by net purchases of foreign currency from the private sector by the Central Bank and net transfers from the Central Bank to the Treasury (in the form of temporary advances and profit transfers). The expansion of the monetary base was partially sterilized through the use of regulatory monetary instruments with sterilization purposes.
In 2023, the monetary base increased by 84.6% (compared to an inflation of 211.4% in the same year), as a result of a 81.6% increase in currency in circulation.
In 2024, the monetary base increased by 209.4% (compared to an inflation of 117.8% in the same year), as a result of a 168.8% increase in currency in circulation.
In 2025, the monetary base increased by 44.5% (compared to an inflation of 31.5% in the same year), as a result of a 35.6% increase in currency in circulation and a 62.7% in financial institutions’ current account deposits.
Foreign Exchange and International Reserves
Foreign Exchange
Beginning in February 2002, the peso was allowed to float against other currencies. After several years of fluctuations in the nominal exchange rate, the peso lost approximately 12.5% of its value against the U.S. dollar in 2012. Despite increased Central Bank intervention and measures to limit Argentine residents’ access to foreign currency, the peso lost 23.8% of its value compared to the U.S. dollar in 2014.
In December 2015, the Central Bank eliminated a significant portion of the foreign exchange restrictions and the Central Bank returned to a free-float policy with interventions designed to enhance the operation of the foreign exchange market. Immediately after a significant portion of the foreign exchange controls were lifted on December 16, 2015, the peso lost 28.6% of its value compared to the U.S. dollar, as the peso-U.S. dollar exchange rate reached Ps.13.76 to U.S.$1.00 on December 17, 2015.
In 2016 and 2017, the Central Bank allowed the peso to freely float against other currencies with Central Bank intervention limited to measures designed to ensure the orderly operation of the foreign exchange market.
In 2018, the ability of the Central Bank to maintain its monetary and foreign exchange policies were severely challenged. The peso lost 25.6% of its value vis-à-vis the U.S. dollar between January 2 and May 31, 2018, while the international reserves of the Central Bank decreased by approximately U.S.$15.4 billion. In spite of the support provided by the IMF through the SBA, in 2018, the peso lost 50.3% of its value compared to the U.S. dollar.
In September 2019, the Central Bank established new restrictions on access to the foreign exchange market. On July 18, 2019, the Central Bank renewed its Chinese Yen (“CNY”) 70 million swap with China and, on December 17, 2019, it renewed the CNY60,000,000 complement to such agreement, bringing the total amount under the swap to CNY130,000,000. In 2019, the peso lost 36.9% of its value versus the U.S. dollar. See “—Monetary Policy measures implemented in 2019.”
In 2020, the main exchange market regulation measures were maintained and intensified, as part of the measures implemented by the Central Bank to maintain exchange rate stability and protect savings. See “—Restrictions to the Foreign Exchange Market and other related measures.”
In 2020 and 2021, the peso lost 28.8% and 18.1% of its value versus the U.S. dollar, respectively (on the basis of the exchange rates published pursuant to Communication A3500 of the Central Bank).
In 2022, the peso lost 42.0% of its value versus the U.S. dollar (on the basis of the exchange rates published pursuant to Communication A3500 of the Central Bank). See “—Monetary Policy measures implemented in 2020” and “—Monetary Policy measures implemented in 2022.”
D-93
In 2023, the Central Bank adopted measures for the preservation of international competitiveness by gradually readjusting the U.S. dollar crawl under the floating exchange rate to keep up with inflation rates, and reinforcing international reserves by accumulating external surplus. In 2023, the peso lost 78.1% of its value versus the U.S. dollar (on the basis of the exchange rates published pursuant to Communication A3500 of the Central Bank). See “—Monetary Policy measures implemented in 2020” and “—Monetary Policy measures implemented in 2023.”
In 2024, the peso lost 21.7% of its value versus the U.S. dollar (on the basis of the exchange rates published pursuant to Communication A3500 of the Central Bank). See “—Monetary Policy measures implemented in 2024.”
In 2025, the peso lost 29.3% of its value versus the U.S. dollar (on the basis of the exchange rates published pursuant to Communication A3500 of the Central Bank). See “—Monetary Policy measures implemented in 2025.”
The following table sets forth the peso U.S. dollar nominal exchange rate for the periods indicated.
Nominal Exchange Rate (1)
(pesos per U.S. dollar)
| Average | At end of period | |||||||
| 2021 | 95.16 | 102.75 | ||||||
| 2022 | 130.81 | 177.13 | ||||||
| 2023 | 295.21 | 808.48 | ||||||
| 2024 | 916.23 | 1,032.50 | ||||||
| 2025 | 1,244.26 | 1,459.42 | ||||||
| (1) | Central Bank reference exchange rates (Communication A 3500 of Central Bank). |
Source: Central Bank.
As of October 13, 2026, the exchange rate stood at Ps.1,515.85 per U.S.$1.00 compared to Ps.1,459.42 as of December 30, 2025.
International Reserves
The Central Bank’s international reserves are composed of foreign currency deposits, foreign currency and gold. The following table sets forth the composition of the international reserves of the Central Bank as of December 31 of each of the years indicated.
International Reserves of the Central Bank (in billions of U.S. dollars)
| Total | Deposits | Currency | Gold | |||||||||||||
| 2021 |
39.7 | 8.0 | 28.4 | 3.2 | ||||||||||||
| 2022 |
44.6 | 15.7 | 25.5 | 3.6 | ||||||||||||
| 2023 |
23.1 | 4.6 | 14.3 | 4.1 | ||||||||||||
| 2024 |
29.6 | 5.4 | 19.0 | 5.2 | ||||||||||||
| 2025 |
U.S.$ | 41.1 | U.S.$ | 8.2 | U.S.$ | 24.1 | U.S.$ | 8.6 | ||||||||
Source: Central Bank.
As of December 31, 2021, the Central Bank’s international reserves totaled U.S.$39.7 billion, 0.7% higher than the previous year, of which U.S.$8.0 billion were foreign currency deposits, U.S.$28.4 billion were foreign currency and U.S.$3.2 billion were gold.
As of December 31, 2022, the Central Bank’s international reserves totaled U.S.$44.6 billion, 12.4% higher than the previous year, of which U.S.$15.7 billion were foreign currency deposits, U.S.$25.5 billion were foreign currency and U.S.$3.6 billion were gold.
As of December 31, 2023, the Central Bank’s international reserves totaled U.S.$23.1 billion, 48.3% lower than the previous year, of which U.S.$4.6 billion were foreign currency deposits, U.S.$14.3 billion were foreign currency and U.S.$4.1 billion were gold.
As of December 31, 2024, the Central Bank’s international reserves totaled U.S.$29.6 billion, 28.5% higher than the previous year, of which U.S.$19.0 billion were foreign currency deposits, U.S.$5.4 billion were foreign currency and U.S.$5.2 billion were gold.
D-94
As of December 31, 2025, the Central Bank’s international reserves totaled U.S.$41.1 billion, 38.6% higher than the previous year, of which U.S.$8.2 billion were foreign currency deposits, U.S.$24.1 billion were foreign currency and U.S.$8.6 billion were gold.
Restrictions to the Foreign Exchange Market and other related measures
In response to the deterioration of the Argentine economy and financial system in 2001, the inability of the Republic to service its public external indebtedness and the decreased level of deposits in the financial system, the Government issued Decree No. 1,570/2001 on December 3, 2001, which established certain monetary and currency exchange control measures, including restrictions on the free disposition of funds deposited in banks and restrictions on the transfer of funds abroad, subject to certain exceptions.
In addition to the above measures, on February 8, 2002, the Government and the Central Bank made certain transfers of funds abroad to service principal and/or interest payments on foreign indebtedness subject to prior authorization. From 2011 until December 2015, the Government increased controls on the sale of foreign currency and the acquisition of foreign assets by local residents, limiting the possibility of transferring funds abroad.
Together with the regulations that subjected certain foreign exchange transactions to prior approval by the Argentine tax authorities or the Central Bank, certain measures adopted by the authorities significantly curtailed access to the Mercado Único y Libre de Cambio (the “MULC”). In response, an unofficial U.S. dollar trading market developed in which the peso-U.S. dollar exchange rate differed substantially from the official peso-U.S. dollar exchange rate.
Following an initial set of measures adopted in December 2015 with the aim of increasing capital inflows, the Government and the Central Bank introduced additional measures to eliminate restrictions affecting the balance of payment transactions. In August 2016, the Central Bank materially eased access to the MULC. In December 2016 and January 2017, the Central Bank further relaxed foreign exchange controls and, effective July 1, 2017, the Central Bank eliminated most of the remaining foreign exchange restrictions and adopted measures to provide access to the foreign exchange market by residents and non-residents.
The fundamental change in circumstances since 2018 resulted in a rapid reversal of many of the measures adopted during the prior two years. On September 1, 2019, the Central Bank imposed restrictions on foreign currency transactions, requiring financial institutions to obtain prior Central Bank approval to buy foreign currency in the exchange market for multiple types of operations (none related to foreign trade). Individuals were limited to purchases of foreign currency not to exceed U.S.$10,000 per month, which was eventually reduced to U.S.$200 per month in October 2019. Further, the Central Bank required exporters to repatriate the proceeds of export transactions five days after receiving payment or 180 days after shipping, whichever occurs first.
During 2020 and 2021, the Central Bank adopted regulations further limiting access to the MULC, mainly aiming at preserving the level of international reserves. These measures included, among others, imposing surcharges on foreign currency operations, setting restrictions on settlements, requiring prior approval from the Central Bank, and limiting the total amount of payments for imports.
In the last quarter of 2022, new restrictions were imposed on users of subsidized electricity, water, and natural gas, and an additional tax was added on foreign currency expenses exceeding certain amounts, as well as on personal, cultural, and leisure services hired abroad. The AFIP and the Secretary of Commerce introduced the Sistema de Importaciones de la República Argentina (SIRA) to manage the access of importing firms to the MULC based on specific analyses of each import transaction.
In 2023, restrictions continued to be adopted. In May, the Central Bank created a new instrument called LEDIV (Central Bank bills in dollars, payable in pesos at the reference exchange rate, with zero interest, and non-transferable). LEDIVs were designed for importers to pay for goods, banks holding dollar-linked deposits, and oil companies that had increased production. By November, new subscriptions for these instruments were eliminated, with the outstanding amount totaling over U.S.$5 billion.
In October 2023, the Central Bank further restricted dollar demand by limiting the banks’ holding of foreign currency assets. Thus, banks were prevented from increasing their daily cash positions in foreign currency without prior permission from the Central Bank.
Also, the Central Bank decided to shorten the term for importers to access the MLC to pay for their imports from 60 to 30 days. As a result, import payment terms are standardized for all goods in the economy, except those with immediate access to the MLC, such as energy-and for all the companies, regardless of their size.
On December 22, 2024, the Government announced the termination of the Impuesto PAIS when applied directly to the purchase of foreign currency (7.5% when paying goods and services imports, excluding tourism, and 30% whe purchasing foreign currency for paying tourism services and for saving purposes), which was established five years prior to operate as an advance collection on account of income tax.
D-95
Additionally, in December 2024 the Central Bank authorized companies to access the MLC without prior authorization, in order to pay interests on financial debts with related companies accrued since January 1, 2025.
On April 14, 2025, the Government issued Decree No. 269/25 repealing Decree No. 28/2023, which mandated exporters to convert their profits in foreign currency into pesos by selling 80% at the MLC and 20% via purchasing foreign currency debt to be settled in pesos. Subsequently, exporters must sell 100% of their exports collections at the market exchange rate.
On September 26, 2025 the Central Bank reinstalled a restriction to access the foreign exchange market consisting of an affidavit in which the financial institution’s client pledge not to buy in any way bonds denominated in foreign currency, from the date of access to the market until the date falling 90 calendar days thereafter.
For a description of measures implemented in 2026 to strengthen these restrictions, see “Recent Developments—Monetary System—Restrictions to the Foreign Exchange Market and other related measures.”
Inflation
For 2021, 2022, 2023, 2024 and 2025, accumulated inflation as measured by the National CPI methodology reached 50.9%, 94.8%, 211.4%,117.8%, and 31.5% respectively, reflecting the positive effect of (i) the measures adopted to reach fiscal stability, (ii) the abolishment of the Treasury monetary financing and (iii) the improvement of the Central Bank balance.
The following table sets forth inflation rates as measured by the National CPI for the periods specified.
Inflation (1)
Evolution of the annual rate of change in the National CPI and WPI
(% change from previous period, unless otherwise specified)
| National CPI | WPI | |||||||
| 2021 |
50.9 | 51.3 | ||||||
| January |
4.0 | 5.6 | ||||||
| February |
3.6 | 6.1 | ||||||
| March |
4.8 | 3.9 | ||||||
| April |
4.1 | 4.8 | ||||||
| May |
3.3 | 3.2 | ||||||
| June |
3.2 | 3.1 | ||||||
| July |
3.0 | 2.2 | ||||||
| August |
2.5 | 2.5 | ||||||
| September |
3.5 | 2.8 | ||||||
| October |
3.5 | 2.8 | ||||||
| November |
2.5 | 2.9 | ||||||
| December |
3.8 | 2.3 | ||||||
| 2022 |
94.8 | 94.8 | ||||||
| January |
3.9 | 3.7 | ||||||
| February |
4.7 | 4.7 | ||||||
| March |
6.7 | 6.3 | ||||||
| April |
6.0 | 5.9 | ||||||
| May |
5.1 | 5.2 | ||||||
| June |
5.3 | 4.8 | ||||||
| July |
7.4 | 7.1 | ||||||
| August |
7.0 | 8.2 | ||||||
| September |
6.2 | 5.5 | ||||||
| October |
6.3 | 4.8 | ||||||
| November |
4.9 | 6.3 | ||||||
| December |
5.1 | 6.1 | ||||||
D-96
| National CPI | WPI | |||||||
| 2023 |
211.4 | 276.0 | ||||||
| January |
6.0 | 6.5 | ||||||
| February |
6.6 | 7.0 | ||||||
| March |
7.7 | 5.1 | ||||||
| April |
8.4 | 6.9 | ||||||
| May |
7.8 | 7.1 | ||||||
| June |
6.0 | 7.5 | ||||||
| July |
6.3 | 7.0 | ||||||
| August |
12.4 | 18.7 | ||||||
| September |
12.7 | 9.2 | ||||||
| October |
8.3 | 7.6 | ||||||
| November |
12.8 | 11.1 | ||||||
| December |
25.5 | 54.0 | ||||||
| 2024 |
117.8 | 67.10 | ||||||
| January |
20.6 | 17.9 | ||||||
| February |
13.2 | 10.2 | ||||||
| March |
11.0 | 5.4 | ||||||
| April |
8.8 | 3.5 | ||||||
| May |
4.2 | 3.5 | ||||||
| June |
4.6 | 2.7 | ||||||
| July |
4.0 | 3.1 | ||||||
| August |
4.2 | 2.1 | ||||||
| September |
3.5 | 1.9 | ||||||
| October |
2.7 | 1.2 | ||||||
| November |
2.4 | 1.4 | ||||||
| December |
2.7 | 0.9 | ||||||
| 2025 |
||||||||
| January |
2.2 | 1.5 | ||||||
| February |
2.4 | 1.6 | ||||||
| March |
3.7 | 1.5 | ||||||
| April |
2.8 | 2.8 | ||||||
| May |
1.5 | (0.3 | ) | |||||
| June |
1.6 | 1.7 | ||||||
| July |
1.9 | 2.9 | ||||||
| August |
1.9 | 3.1 | ||||||
| September |
2.1 | 3.7 | ||||||
| October |
2.3 | 1.1 | ||||||
| November |
2.5 | 1.6 | ||||||
| December |
2.8 | 2.4 | ||||||
| (1) | Annual figures reflect accumulated annual inflation. Monthly figures reflect inflation for that month, as compared to the prior month. |
Source: INDEC.
In the first half of 2022, the inflation rate increased mainly as a consequence of the factors influencing inflation in 2021 and indexation mechanisms such as a salary adjustment program adopted by the Government following negotiations with labor unions. During the second half of 2022, the inflation rate increased mainly as a result of the higher volatility in the local financial market, uncertainty in the foreign exchange market and higher expected inflation.
In November 2022, the Government created the Programa de Precios Justos (Fair Prices Program), replacing the Precios Cuidados program, to maintain certain products at a fixed price until February 2023. Companies that adhered to the program were subject to sanctions in the event of product shortages.
During the first seven months of 2023, the Government adopted measures aimed at reducing financial volatility and controlling inflation included increasing the monetary policy rate from 75% in January to 97% in July, renewing and expanding the currency swap with China, restoring the Programa de Incremento Exportador (Export Growth Program), and adjusting regulations to improve foreign reserve management.
D-97
In July 2023, the Ministry of Economy introduced new measures to alleviate inflationary pressures. These measures included the reintegration of VAT for pensioners, social plan beneficiaries, employees earning up to six minimum salaries, and self-employed individuals paying self-employment tax (Monotributo). The exemption threshold for income tax was raised to include only those earning over Ps.1.7 milllion, approximately 0.88% of all taxpayers. Support for the food program under PAMI (Programa de Atención Médica Integral), which provides medical assistance for retirees, pensioners, and people without retirement income, was also increased. Fiscal pressure on the agricultural sector was reduced by eliminating export retentions on food products affected by drought. Additionally, bonuses were provided for retirees and employees with lower incomes, and financial assistance to SMEs was increased.
In October 2023, the Government reinstated the Precios Justos program to stabilize the prices of basic products and medicines, temporarily freezing prices for regulated products such as gasoline and private health insurance, and postponed fare increases for trains, buses, electricity, and gas. The Central Bank raised the monetary policy rate to 118% (ending the year at 113%) and continued its efforts to stabilize the foreign exchange market.
In 2024, the inflation rate deaccelerated, mainly as a result of measures aimed at reaching fiscal surplus and setting an official monthly crawling peg of 2% for the nominal foreign currency rate with respect to the U.S. dollar, reaching an exchange of Ps.799.97 per U.S. dollar on December 13, 2024, compared to Ps.364.40 on December 12, 2024.
In 2025, the adjustment of relative prices moderated the pace of disinflation. The realignment of regulated prices was achieved through a deregulation policy affecting, among other items, fuel prices and prepaid health insurance, as well as through reductions in consumer subsidies for public services, including electricity, natural gas and water.
Effective January 17, 2025, businesses may display prices in U.S. dollars or other foreign currencies in addition to Argentine pesos. Effective April 1, 2025, businesses are also required to disclose the price excluding VAT and other national indirect taxes, in a less prominent format than the final consumer price.
Following the consolidation observed in the inflation path over the preceding months and expectations of lower inflation, the Central Bank established a new crawling peg at 1% per month, effective as of February 1, 2025.
Regulation of the Financial Sector
The Central Bank regulates the financial sector. The Central Bank has the authority to set minimum capital, liquidity and solvency requirements, approve bank mergers, approve certain capital increases and transfers of stock, grant and revoke banking licenses and authorize the establishment of branches of foreign financial institutions in Argentina. The Central Bank also regularly monitors the activities and operations of financial institutions, requiring them to submit periodic financial reports, and is authorized to adopt regulations in accordance with the Financial Institutions Law.
The Central Bank regulates the financial sector primarily through the Superintendencia de Entidades Financieras y Cambiarias (Superintendence of Financial and Exchange Institutions), which is responsible for enforcing Argentina’s banking laws, establishing accounting and financial reporting requirements for the banking sector, monitoring and regulating the lending practices of financial institutions and establishing rules for participation of financial institutions in the foreign exchange market and the issuance of bonds and other securities.
In 2011, the Central Bank published a roadmap for the implementation of Basel III. Since then, the Central Bank has taken steps to adopt these regulations with the aim of identifying risks relating to liquidity shortages in systemically important domestic financial institutions and began implementing a comprehensive set of reform measures under Basel III that will help prevent systemic vulnerabilities. Currently, the Central Bank monitors financial institutions’ compliance with established indicators and publishes such results in a financial stability report, which is published every six-months.
In 2023, in addition to the measures regarding the foreign exchange market and inflation (see “—Restrictions to the Foreign Exchange Market and other related measures” and “—Inflation”), other measures were related to liquidity management and monetary regulation were introduced. For example, the Central Bank allowed financial institutions to fulfill their minimum cash requirements using Government bonds issued in pesos, with a residual maturity between 90 and 730 days from the moment of subscription, later extended to 760 days.
From April to December of 2023, financial institutions were permitted, with prior Central Bank authorization, to distribute up to 40% of their financial results in six equal monthly installments. Commercial banks that allowed their clients to use ATMs, regardless of ownership, were required to open a special account for such purpose. Clients’ voluntary foreign currency holdings, both inside and overseas, had to be deposited in their accounts specifically opened for that purpose.
D-98
Additionally, the Central Bank established guidelines for local governments to pay foreign debt capital amortizations, requiring them to submit a plan that provided for the payment of up to 40% of the amortization, rolling over the remaining debt with a due date of no less than two years.
To manage market liquidity, on May 2, 2024, the Central Bank increased the minimum cash reserve requirements for mutual fund deposits from 0% to 10%. The requirement was subsequently raised to 15% and 20% on May 15, 2024 and November 1, 2024, respectively. This rate also applies to financial institutions engaging in repo funding in the market via stocks and bonds with a residual life of up to 29 days. These measures aim to normalize the prudential management of liquidity by banks, and absorb excess liquidity from monetary financing used in previous years to address fiscal deficits.
The decrease in remunerative liabilities of the Central Bank, the sustained reductions of the repo rate and the crawling peg of the foreign exchange rate of 2%, limited the endogenous growth of Central Bank liabilities, see “Recent Developments—Monetary System—Restrictions to the Foreign Exchange Market and other related measures.”
During 2024, the Central Bank continuously adapted its regulation of financial entities to the changes in the financial and economic environment, such as (i) incorporating assets admitted as collateral for credit risk coverage, (ii) amplifying the regulation’s operational scope via non-banking agents (such as virtual wallets), and (iii) improving operative processes and logistics to reduce financial costs (such as the issuance of currency bills of higher denomination and the adjustment of limits on monetary transaction with ATMs).
During 2025, the Central Bank started the third phase of the economic program adopted by the Government by the end of 2023. See “The Argentine Economy—The Milei Administration.” The measures adopted by the Central Bank included:
| | Strengthening the Central Bank’s balance sheet. |
| o | On April 10, 2025, the Central Bank renewed the whole active tranche of the bilateral swap agreement for U.S.$5 billion with China until June 2026. |
| o | On April 11, 2025, the Central Bank set a foreign exchange band for the U.S. dollar at the MLC between Ps.1,000 and Ps.1,400 per U.S. dollar. The lower and upper values of the band will evolve gradually and predictably over time: -1% and +1% per month, respectively. |
| a. | Intervention within the band floor: when the foreign exchange rate reaches the band floor, the Central Bank will purchase U.S. dollars to maintain the value of the Peso in the market while increasing foreign reserves. The issuance of Pesos will not be sterilized, facilitating the re-monetizing the economy that may arise from an increase in the real money demand. |
| b. | Intervention within the band ceiling: when the foreign exchange rate reaches the band ceiling, the Central Bank will sell U.S. dollars to maintain the value of the Peso in the market while removing monetary liabilities, thus enabling a quick absorption of surplus liquidity that may arise from a reduction in the real money demand. |
| c. | Intervention within the band: the Central Bank can (i) purchase U.S. dollars considering its macroeconomic objectives and the accumulation of foreign reserves or (ii) sell U.S. dollars to stabilize sudden volatility in the exchange rate. |
| o | In May 2025, the Ministry of Economy cancelled the Letras Intransferibles (non-marketable bills) held by the Central Bank which were due on June 1, 2025 and April 29, 2025, and partially cancelled the non-marketable bills due on April 3, 2029. The cancellation was financed through the inflow of U.S.$12 billion as a result of a new EFF agreement signed with the IMF on April 11, 2025, for disbursements totaling approximately U.S.$20 billion. |
| o | On June 11, 2025, the Central Bank increased its reverse repo facility operations with seven international banks to up to U.S.$2 billion, through an auction of BOPREAL with an interest rate of SOFR plus 450 basis points, at an annual fixed rate of 8.25%. The amortization and repayment terms are identical to those of the previous operation with such banks on January 3, 2025 (U.S.$1 billion, due by the end of April 2027). These reverse repos and the prior ones were terminated and replaced with new facilities in July 2026. See “Recent Developments—Monetary System.” |
| o | On April 14, 2025, the Central Bank eliminated: |
| | restrictions on the amounts of foreign currency that could be purchased by individuals, by allowing financial institutions to grant their clients access to the MLC when meeting certain requirements. |
D-99
| | restrictions to the distribution of dividends to foreign shareholders and term restrictions for the payment of foreign trade operations. As a result, non-resident investors have access to the MLC for remitting their investments back to their countries with regards to profits obtained in balance sheets for fiscal years beginning on or after January 1, 2025, without previous authorization. |
| | the deadlines for payments related to imports of goods and services have been relaxed, with most of these now being payable upon customs entry registration (previously, payments were due 30 days after registration). |
| o | On September 22, 2025, the Government issued Decree No. 682/2025 setting the export duty rate for grains and meats at 0% for those exporters who settled at least 90% of the foreign currency proceeds within three business days following the submission of the corresponding Export Affidavit (DJVE). The measure was expected to remain in effect until October 31, 2025, or until DJVEs are registered for an aggregate amount equivalent to U.S.$7.0 billion. |
| | Improvement of the monetary policy framework. The improvement is to be conducted under the sustained premise of zero money emission to finance fiscal policy and to pay the Central Bank’s interest-bearing liabilities. |
| o | The Central Bank set the focus of its monetary programming on the monetary aggregates as the economy’s nominal anchor (instead of the fixed political monetary rate of reference which was 29% since its last modification on January 30, 2025, and until its last publication on July 10, 2025). As a result, the current focal point when deciding the measures necessary to regulate domestic liquidity is the convergence of the observed Private Transactional M2 (average of each quarter’s last month) compared to the objective Private Transactional M2. |
| o | The Central Bank adopted a complementary monetary metric that represents an evolution from the Activos Internos Netos (Net Domestic Assets or “NDA”), which arise from the difference between monetary base and net international reserves, in accordance with the Republic’s agreements with the IMF, which also implies quarterly guidance for both NDA evolution and accumulation of net international reserves. |
| o | On April 30, 2025, the Central Bank announced the issuance of the fourth series of BOPREAL for a total aggregate amount of U.S.$3.0 billion, to regulate outstanding foreign obligations related to the stock of dividends and retained profits accumulated until December 2024, commercial and financial debt services with related institutions and commercial debts accumulated until December 12, 2023. These BOPREALs accrue interest at a rate of 3.00% and are scheduled to mature in October 2028. The Central Bank expects that about U.S.$1 million will be applied to cancel tax and customs debts with ARCA. |
| o | The Central Bank took measures to enable financial operations and payments in a different currency than the Peso, such as the possibility to open U.S. dollar checking accounts to deliver electronic checks and use debit cards and other electronic platforms to pay in U.S. dollars. |
| o | The Central Bank intends to boost an open finances system or Sistema de Finanzas Abiertas to, among other things, simplify the access to credit, improve transparency and boost cost reduction. |
In December 2025, in response to increased money demand due to seasonal factors and an improved financial stability environment, the Central Bank lowered the minimum cash reserve requirements for banks from 95% (set in November 2025) to 75%.
D-100
Taxes on Foreign Exchange Trade
On April 14, 2025, the Government eliminated the 30% advanced payment on the tax on capital for individuals buying foreign currencies with saving purposes.
Foreign Exchange Rate
On December 4, 2025, the Central Bank announced the approval of a new methodology for calculating the reference exchange rate, which became effective on January 1, 2026. The development of this new methodology incorporated feedback from various market sectors, obtained through a public consultation process initiated by the Central Bank on November 5, 2025 and is designed to promote a more equitable financial environment by replacing the previous survey-based quotation methodology with a transaction-based approach weighted by trading volume. The new calculation methodology enhances the transparency and representativeness of the reference exchange rate indicator and strengthens the reliability of data utilized by financial institutions and participants in domestic and international forward currency markets. Further, the new methodology aligns the Central Bank with international best practices and standards, promoting greater modernization and objectivity in the calculation of the reference exchange rate for the benefit of all market participants.
Liquidity Management and Reserve Requirement Regime
On July 10, 2025, the Central Bank discontinued the issuance of LEFIs. This decision was part of the transition toward a new monetary frame, supported by the Central Bank’s policy toolkit, which includes targeted open-market operations and interventions in repo markets.
In the same month, the Central Bank’s entire LEFIs portfolio was converted to LECAPs with maturities on August 15, 2025 and September 12, 2025, and to BONCAP due on October 17, 2025, as part of the new monetary framework supported by the Central Bank’s policy toolkit, which includes targeted open–market operations and interventions in repo markets.
The Central Bank also implemented changes to the reserve requirement regime, increasing the Peso requirement to strengthen the financial system, reduce monetary volatility, and harmonize reserve requirements across different segments of demand deposits. In certain cases, these requirements may be met through holdings of Government Treasuries.
Composition of the Financial Sector
As of December 31, 2025, there were 73 financial institutions operating in Argentina. The following table sets forth the number of financial institutions operating in Argentina as of the dates specified.
Number of Financial Institutions in Operation in the Financial System, by Type
| As of December 31, | ||||||||||||||||||||
| 2021 | 2022 | 2023 | 2024 | 2025 | ||||||||||||||||
| State-owned banks(1) |
13 | 13 | 14 | 14 | 14 | |||||||||||||||
| Private banks |
51 | 50 | 49 | 47 | 46 | |||||||||||||||
| Financial entities other than banks |
15 | 14 | 14 | 13 | 13 | |||||||||||||||
| Credit Institutions (Cajas de Crédito) |
— | — | — | — | — | |||||||||||||||
|
|
|
|
|
|
|
|
|
|
|
|||||||||||
| Total |
79 | 77 | 77 | 74 | 73 | |||||||||||||||
|
|
|
|
|
|
|
|
|
|
|
|||||||||||
| (1) | Includes national, provincial and municipal banks. |
Source: Central Bank.
Number of Financial Institutions in Operation in the Financial System, Domestic and Foreign
| As of December 31, | ||||||||||||||||||||
| 2021 | 2022 | 2023 | 2024 | 2025 | ||||||||||||||||
| National institutions(1) |
54 | 54 | 54 | 53 | 53 | |||||||||||||||
| Foreign-owned institutions(2) |
25 | 23 | 23 | 21 | 20 | |||||||||||||||
|
|
|
|
|
|
|
|
|
|
|
|||||||||||
| Total |
79 | 77 | 77 | 74 | 73 | |||||||||||||||
|
|
|
|
|
|
|
|
|
|
|
|||||||||||
| (1) | Includes state-owned banks, private banks and other financial institutions (such as credit unions). |
| (2) | Includes private foreign banks and other foreign financial entities other than banks. |
Source: Central Bank.
D-101
Assets and Liabilities of the Financial System
The following tables set forth the assets and liabilities of the Argentine financial system as of the dates specified.
Total Assets and Liabilities of the Financial System by Type of Institution (in millions of pesos)
| As of December 31, | ||||||||||||||||||||
| 2021 | 2022 | 2023 | 2024 | 2025 | ||||||||||||||||
| State-owned banks:(1) |
||||||||||||||||||||
| Assets |
Ps. | 6,453,792 | Ps. | 12,483,046 | Ps. | 38,848,281 | Ps. | 81,601,691 | Ps. | 113,621,298 | ||||||||||
| Liabilities |
5,575,296 | 10,472,554 | 30,013,495 | 58,832,338 | 82,840,058 | |||||||||||||||
|
|
|
|
|
|
|
|
|
|
|
|||||||||||
| Net |
878,496 | 2,010,493 | 8,834,786 | 22,769,353 | 30,781,239 | |||||||||||||||
| Private banks: |
||||||||||||||||||||
| Assets |
10,124,860 | 19,297,052 | 57,732,192 | 124,772,099 | 182,983,523 | |||||||||||||||
| Liabilities |
8,324,566 | 15,540,405 | 44,366,554 | 96,780,377 | 148,181,325 | |||||||||||||||
|
|
|
|
|
|
|
|
|
|
|
|||||||||||
| Net |
1,800,294 | 3,756,647 | 13,365,638 | 27,991,722 | 34,802,199 | |||||||||||||||
| Financial entities other than banks: |
||||||||||||||||||||
| Assets |
184,071 | 297,060 | 841,048 | 3,105,943 | 6,398,562 | |||||||||||||||
| Liabilities |
149,535 | 242,994 | 691,995 | 2,751,101 | 5,694,765 | |||||||||||||||
|
|
|
|
|
|
|
|
|
|
|
|||||||||||
| Net |
34,535 | 54,067 | 149,053 | 354,842 | 703,798 | |||||||||||||||
| Total assets and liabilities: |
||||||||||||||||||||
| Assets |
16,762,722 | 32,077,158 | 97,421,520 | 209,479,733 | 303,003,383 | |||||||||||||||
| Liabilities |
14,049,397 | 26,255,953 | 75,072,044 | 158,363,816 | 236,716,147 | |||||||||||||||
|
|
|
|
|
|
|
|
|
|
|
|||||||||||
| Total net |
Ps. | 2,713,325 | Ps. | 5,821,206 | Ps. | 22,349,476 | Ps. | 51,115,917 | Ps. | 66,287,236 | ||||||||||
|
|
|
|
|
|
|
|
|
|
|
|||||||||||
| (1) | Includes national, provincial and municipal banks. |
Source: Central Bank.
D-102
Total Assets and Liabilities in the Financial System by Type of Institution
(% change from the previous period)
| As of December 31, | ||||||||||||||||||||
| 2021 | 2022 | 2023 | 2024 | 2025 | ||||||||||||||||
| State-owned banks:(1) |
||||||||||||||||||||
| Assets |
58.9 | % | 93.4 | % | 211.2 | % | 110.1 | % | 39.2 | % | ||||||||||
| Liabilities |
57.7 | 87.8 | 186.6 | 96.0 | 40.8 | |||||||||||||||
|
|
|
|
|
|
|
|
|
|
|
|||||||||||
| Net |
67.1 | 128.9 | 339.4 | 157.7 | 35.2 | |||||||||||||||
| Private banks: |
||||||||||||||||||||
| Assets |
51.0 | 90.6 | 199.2 | 116.2 | 46.7 | |||||||||||||||
| Liabilities |
49.7 | 86.7 | 185.5 | 118.2 | 53.1 | |||||||||||||||
|
|
|
|
|
|
|
|
|
|
|
|||||||||||
| Net |
57.7 | 108.7 | 255.8 | 109.5 | 24.3 | |||||||||||||||
| Financial entities other than banks: |
||||||||||||||||||||
| Assets |
33.0 | 61.4 | 183.1 | 269.3 | 106.0 | |||||||||||||||
| Liabilities |
32.0 | 62.5 | 184.8 | 297.6 | 107.0 | |||||||||||||||
|
|
|
|
|
|
|
|
|
|
|
|||||||||||
| Net |
37.6 | 56.6 | 175.7 | 138.1 | 98.3 | |||||||||||||||
| Total assets and liabilities: |
||||||||||||||||||||
| Assets |
53.8 | 91.4 | 203.7 | 115.0 | 44.6 | |||||||||||||||
| Liabilities |
52.5 | 86.9 | 185.9 | 110.9 | 49.5 | |||||||||||||||
|
|
|
|
|
|
|
|
|
|
|
|||||||||||
| Total net |
60.3 | % | 114.5 | % | 283.9 | % | 128.7 | % | 29.7 | % | ||||||||||
|
|
|
|
|
|
|
|
|
|
|
|||||||||||
| (1) | Includes national, provincial and municipal banks. |
Source: Central Bank
Assets
Total assets of the financial system increased in nominal terms by 53.8% to Ps.16,762.7 billion in 2021, 91.4% to Ps.32,077.2 billion in 2022, 203.7% to Ps.97,421.5 billion in 2023 and 115.0% to Ps.209,479.7 in 2024. In 2025, total assets of the financial system increased in nominal terms by 44.6% to Ps.303,003.8 billion.
Loan Portfolio and Risk Profile
The following tables set forth loan data by type of institution in the financial sector as of the dates specified.
Outstanding Loans by Type of Financial Institution
(in millions of pesos)
| As of December 31, | ||||||||||||||||||||
| 2021 | 2022 | 2023 | 2024 | 2025 | ||||||||||||||||
| State-owned banks(1) |
Ps. | 1,898,738 | Ps. | 3,251,254 | Ps. | 7,746,868 | Ps. | 26,702,064 | Ps. | 44,367,135 | ||||||||||
| Private banks |
3,055,176 | 5,152,596 | 13,308,506 | 45,939,985 | 83,088,665 | |||||||||||||||
| Financial entities other than banks |
138,629 | 181,642 | 445,066 | 1,615,817 | 3,770,451 | |||||||||||||||
|
|
|
|
|
|
|
|
|
|
|
|||||||||||
| Total |
Ps. | 5,092,543 | Ps. | 8,585,492 | Ps. | 21,500,440 | Ps. | 74,257,866 | Ps. | 131,226,251 | ||||||||||
|
|
|
|
|
|
|
|
|
|
|
|||||||||||
| (1) | Includes national, provincial and municipal banks. |
Source: Central Bank.
Outstanding Loans by Type of Financial Institution
(as a % of total)
| As of December 31, | ||||||||||||||||||||
| 2021 | 2022 | 2023 | 2024 | 2025 | ||||||||||||||||
| State-owned banks(1) |
37.3 | % | 37.9 | % | 36.0 | % | 36.0 | % | 33.8 | % | ||||||||||
| Private banks |
60.0 | 60.0 | 61.9 | 61.9 | 63.3 | |||||||||||||||
| Financial entities other than banks |
2.7 | 2.1 | 2.1 | 2.2 | 2.9 | |||||||||||||||
|
|
|
|
|
|
|
|
|
|
|
|||||||||||
| Total |
100.0 | % | 100.0 | % | 100.0 | % | 100.0 | % | 100.0 | % | ||||||||||
|
|
|
|
|
|
|
|
|
|
|
|||||||||||
| (1) | Includes national, provincial and municipal banks. |
Source: Central Bank.
D-103
Allocation of Outstanding Loans by Sector
(in millions of pesos)
| As of December 31, | ||||||||||||||||||||
| 2021 | 2022 | 2023 | 2024 | 2025 | ||||||||||||||||
| Non-financial public sector |
Ps. | 120,621 | Ps. | 205,218 | Ps. | 534,982 | Ps. | 1,292,356 | Ps. | 2,179,505 | ||||||||||
| Financial sector (public and private) |
94,118 | 103,483 | 265,225 | 1,393,557 | 4,257,832 | |||||||||||||||
| Non-financial private sector |
5,137,193 | 8,644,790 | 21,890,111 | 73,530,872 | 131,850,107 | |||||||||||||||
| Provisions for doubtful accounts |
(259,389 | ) | (367,999 | ) | (1,189,878 | ) | (1,958,919 | ) | (7,061,193 | ) | ||||||||||
|
|
|
|
|
|
|
|
|
|
|
|||||||||||
| Total |
Ps. | 5,092,543 | Ps. | 8,585,492 | Ps. | 21,500,440 | Ps. | 74,257,866 | Ps. | 131,226,251 | ||||||||||
|
|
|
|
|
|
|
|
|
|
|
|||||||||||
Source: Central Bank.
Allocation of Outstanding Loans by Sector
(% change from the previous period)
| As of December 31, | ||||||||||||||||||||
| 2021 | 2022 | 2023 | 2024 | 2025 | ||||||||||||||||
| Non-financial public sector |
23.4 | % | 70.1 | % | 160.7 | % | 141.6 | % | 68.6 | % | ||||||||||
| Financial sector (public and private) |
37.1 | 10.0 | 156.3 | 425.4 | 205.5 | |||||||||||||||
| Non-financial private sector |
42.4 | 68.3 | 153.2 | 235.9 | 79.3 | |||||||||||||||
| Provisions for doubtful accounts |
18.5 | 41.9 | 223.3 | 64.6 | 260.5 | |||||||||||||||
|
|
|
|
|
|
|
|
|
|
|
|||||||||||
| Total |
43.2 | % | 68.6 | % | 150.4 | % | 245.4 | % | 76.7 | % | ||||||||||
|
|
|
|
|
|
|
|
|
|
|
|||||||||||
Source: Central Bank
During 2021, peso-denominated loans to the private and public sectors increased by 47.4% as compared to 2020. U.S. dollar-denominated loans to the private and public sector decreased by 21.8%, from U.S.$5.5 billion in 2020 to U.S.$4.3 billion in 2021. Peso-denominated loans to the private sector increased by 48.0%, from Ps.2,705 billion in 2020 to Ps.4,003 billion in 2021. The inflation for the year was 50.9%. See “—Inflation.”
During 2022, peso-denominated loans to the private and public sectors increased by 66.7% as compared to 2021. U.S. dollar-denominated loans to the private and public sector decreased by 14.6%, from U.S.$4.3 billion in 2021 to U.S.$3.6 billion in 2022. Peso-denominated loans to the private sector increased by 67.2%, from Ps.4,003 billion in 2021 to Ps.6,695 billion in 2022. The inflation for the year was 94.8%. See “—Inflation.”
During 2023, peso-denominated loans to the private and public sectors increased by 130.6% as compared to 2022. U.S. dollar-denominated loans to the private and public sector increased by 1.5%, from U.S.$3.6 billion in 2022 to U.S.$3.7 billion in 2023. Peso-denominated loans to the private sector increased by 130.1%, from Ps.6,694 billion in 2022 to Ps.15,401 billion in 2023. The inflation for the year was 211.4%. See “—Inflation.”
During 2024, peso-denominated loans to the private and public sectors increased by 229.6% as compared to 2023. U.S. dollar-denominated loans to the private and public sector increased by 175.7%, from U.S.$3.7 billion in 2023 to U.S.$10.2 billion in 2024. Peso-denominated loans to the private sector increased by 230.0%, from Ps.15,413 billion in 2023 to Ps.50,936 billion in 2024. The inflation for the year was 117.8%. See “—Inflation.”
During 2025, peso-denominated loans to the private and public sectors increased by 72.8% as compared to 2024. U.S. dollar-denominated loans to the private and public sector increased by 80.4%, from U.S.$10.2 billion in 2024 to U.S.$18.4 billion in 2025. Peso-denominated loans to the private sector increased by 72.2%, from Ps.50,936 billion in 2024 to Ps.87,731 billion in 2025. The inflation for the year was 31.5%. See “—Inflation.”
D-104
The following table sets forth information regarding loans of the financial system by risk category and type of institution.
Risk Classification of Aggregate Assets of the Financial System by Type of Institution
(as a % of total loans, as of December 31, 2025)
| Public Banks |
Private Banks |
Financial Companies |
Financial System |
|||||||||||||
| Risk category: |
||||||||||||||||
| Current(1) |
91.3 | % | 92.3 | % | 91.1 | % | 91.9 | % | ||||||||
| Potentially problematic assets: |
||||||||||||||||
| Special monitoring/low risk(2) |
3.6 | 2.6 | 3.4 | 3.0 | ||||||||||||
| Problematic/medium risk(3) |
2.5 | 2.4 | 2.5 | 2.4 | ||||||||||||
| At high risk of insolvency/high risk(4) |
2.2 | 2.4 | 2.6 | 2.3 | ||||||||||||
| Irrecoverable(5) |
0.5 | 0.3 | 0.4 | 0.4 | ||||||||||||
|
|
|
|
|
|
|
|
|
|||||||||
| Total |
100.0 | % | 100.0 | % | 100.0 | % | 100.0 | % | ||||||||
|
|
|
|
|
|
|
|
|
|||||||||
| (1) | Includes customers who pay their obligations on time or are no more than 31 days in arrears. |
| (2) | Includes customers who (i) are in occasional default in meeting their obligations, with arrears of more than 31 to 90 days and (ii) were granted refinancing for the first time within a given calendar year and paid the first installment of such refinancing. |
| (3) | Includes customers that demonstrate some inability to pay their obligations, with arrears of more than 90 to 180 days. |
| (4) | Includes customers with arrears of more than 180 days up to one year. |
| (5) | Includes insolvent or bankrupt customers with little or no possibility of recovering the loan or with arrears of more than one year. |
Source: Central Bank.
Liabilities
Total liabilities of the financial system increased in nominal terms by 52.5% to Ps.14,049.4 billion in 2021, 87.0% to Ps.26,256 billion in 2022, 185.9% to Ps.75,072 billion in 2023, 110.9% to Ps.158,363 billion in 2024 and 49.5% to Ps.236,716 billion in 2025.
Deposits
In 2021, total deposits in Argentina’s financial system increased by 53.4% to Ps.12,345.1 billion as of December 31, 2021, compared to Ps.8,049.6 billion as of December 31, 2020. Non-financial public sector deposits increased by 64.3% as of December 31, 2021 compared to December 31, 2020. Deposits by the non-financial private sector increased by 51.0%, comprised of a 65.8% increase in demand deposits, a 44.2% increase in deposits in savings accounts and a 50.5% increase in term deposits in the twelve months ended December 31, 2021 compared to December 31, 2020.
Broken down by currency and sector (excluding the financial sector), deposits were as follows as of December 31, 2021:
| | total peso-denominated deposits by the non-financial sector increased by 58.0% to Ps.9,585.9 billion compared to the same date in 2020; |
| | peso-denominated deposits by the non-financial public sector increased by 56.2% to Ps.1,860.5 billion compared to 2020; |
| | peso-denominated deposits by the non-financial private sector increased by 58.4% to Ps.7,725.4 billion compared to 2020; and |
| | total dollar-denominated deposits by the non-financial sector increased by 2.6% to U.S.$18.2 billion compared to 2020. |
In 2022, total deposits in Argentina’s financial system increased by 88.5% to Ps.23,264.5 billion as of December 31, 2022, compared to Ps.12,345.1 billion as of December 31, 2021. Non-financial public sector deposits increased by 57.8% as of December 31, 2022 compared to December 31, 2021. Deposits by the non-financial private sector increased by 95.6%, comprised of a 64.3% increase in demand deposits, a 86.5% increase in deposits in savings accounts and a 118.5% increase in term deposits in the twelve months ended December 31, 2022 compared to December 31, 2021.
D-105
Broken down by currency and sector (excluding the financial sector), deposits were as follows as of December 31, 2022:
| | total peso-denominated deposits by the non-financial sector increased by 90.4% to Ps.18,248.0 billion compared to the same date in 2021; |
| | peso-denominated deposits by the non-financial public sector increased by 65.4% to Ps.3,077.7 billion compared to 2021; |
| | peso-denominated deposits by the non-financial private sector increased by 96.4% to Ps.15,170.4 billion compared to 2021; and |
| | total dollar-denominated deposits by the non-financial sector increased by 3.0% to U.S.$18.8 billion compared to 2021. |
In 2023, total deposits in Argentina’s financial system increased by 169.9% to Ps.62,796.4 billion as of December 31, 2023, compared to Ps.23,265.8 billion as of December 31, 2022. Non-financial public sector deposits increased by 157.2% as of December 31, 2023 compared to December 31, 2022. Deposits by the non-financial private sector increased by 172.2%, comprised of a 174.3% increase in demand deposits, a 280.9% increase in deposits in savings accounts and an 81.4% increase in term deposits in the twelve months ended December 31, 2023 compared to December 31, 2022.
Broken down by currency and sector (excluding the financial sector), deposits were as follows as of December 31, 2023:
| | total peso-denominated deposits by the non-financial sector increased by 118.3% to Ps.39,828 billion compared to the same date in 2022; |
| | peso-denominated deposits by the non-financial public sector increased by 127.1% to Ps.6,988 billion compared to 2022; |
| | peso-denominated deposits by the non-financial private sector increased by 116.5% to Ps.32,839.5 billion compared to 2022; and |
| | total dollar-denominated deposits by the non-financial sector decreased by 10.2% to U.S.$16.9 billion compared to 2022. |
In 2024, total deposits in Argentina’s financial system increased by 117.8% to Ps.136,766 billion as of December 31, 2024, compared to Ps.62,796.4 billion as of December 31, 2023. Non-financial public sector deposits increased by 144.9% as of December 31, 2024 compared to December 31, 2023. Deposits by the non-financial private sector increased by 113.2%, comprised of a 81.6% increase in demand deposits, a 100.8% increase in deposits in savings accounts and a 162.0% increase in term deposits in the twelve months ended December 31, 2024 compared to December 31, 2023.
Broken down by currency and sector (excluding the financial sector), deposits were as follows as of December 31, 2024:
| | total peso-denominated deposits by the non-financial sector increased by 142.7% to Ps.96,606 billion compared to the same date in 2023; |
| | peso-denominated deposits by the non-financial public sector increased by 212.0% to Ps.21,792 billion compared to 2023; |
| | peso-denominated deposits by the non-financial private sector increased by 128.0% to Ps.74,814 billion compared to 2023; and |
| | total dollar-denominated deposits by the non-financial sector increased by 101.2% to U.S.$34 billion compared to 2023. |
In 2025, total deposits in Argentina’s financial system increased by 44.7% to Ps.197,949 billion as of December 31, 2025, compared to Ps.136,766 billion as of December 31, 2024. Non-financial public sector deposits decreased by 2.5% as of December 31, 2025 compared to December 31, 2024. Deposits by the non-financial private sector increased by 47.9%, comprised of a 29.1% increase in demand deposits, a 40.7% increase in deposits in savings accounts and a 68.5% increase in term deposits in the twelve months ended December 31, 2025 compared to December 31, 2024.
Broken down by currency and sector (excluding the financial sector), deposits were as follows as of December 31, 2025:
| | total peso-denominated deposits by the non-financial sector increased by 38.3% to Ps.133,704 billion compared to the same date in 2024; |
| | peso-denominated deposits by the non-financial public sector increased by 33.5% to Ps.29,256 billion compared to 2024; |
| | peso-denominated deposits by the non-financial private sector increased by 39.7% to Ps.104,448 billion compared to 2024; and |
| | total dollar-denominated deposits by the non-financial sector increased by 15.9% to U.S.$39.4 billion compared to 2024. |
D-106
The following tables set forth information on total deposits in the financial sector as of the dates specified.
Deposits by Type of Financial Institution
(in millions of pesos)
| As of December 31, | ||||||||||||||||||||
| 2021 | 2022 | 2023 | 2024 | 2025 | ||||||||||||||||
| State-owned banks(1) |
Ps. | 5,232,990 | Ps. | 9,734,205 | Ps. | 26,486,061 | Ps. | 54,372,436 | Ps. | 75,748,210 | ||||||||||
| Private banks |
7,074,426 | 13,447,791 | 35,997,417 | 80,783,385 | 119,378,246 | |||||||||||||||
| Financial entities other than banks |
37,679 | 83,832 | 312,980 | 1,610,317 | 2,822,687 | |||||||||||||||
|
|
|
|
|
|
|
|
|
|
|
|||||||||||
| Total |
Ps. | 12,345,095 | Ps. | 23,265,828 | Ps. | 62,796,458 | Ps. | 136,766,138 | Ps. | 197,949,143 | ||||||||||
|
|
|
|
|
|
|
|
|
|
|
|||||||||||
| (1) | Includes national, provincial and municipal banks. |
Source: Central Bank.
Deposits by Type of Financial Institution
(as a % of total)
| As of December 31, | ||||||||||||||||||||
| 2021 | 2022 | 2023 | 2024 | 2025 | ||||||||||||||||
| State-owned banks(1) |
42.4 | % | 41.8 | % | 42.2 | % | 39.8 | % | 38.3 | % | ||||||||||
| Private banks |
57.3 | 57.8 | 57.3 | 59.1 | 60.3 | |||||||||||||||
| Financial entities other than banks |
0.3 | 0.4 | 0.5 | 1.2 | 1.4 | |||||||||||||||
|
|
|
|
|
|
|
|
|
|
|
|||||||||||
| Total |
100.0 | % | 100.0 | % | 100.0 | % | 100.0 | % | 100.0 | % | ||||||||||
|
|
|
|
|
|
|
|
|
|
|
|||||||||||
| (1) | Includes national, provincial and municipal banks. |
Source: Central Bank.
Deposits by Sector and by Type of Deposit
(in millions of pesos)
| As of December 31, | ||||||||||||||||||||
| 2021 | 2022 | 2023 | 2024 | 2025 | ||||||||||||||||
| Non-financial public sector |
Ps. | 2,369,708 | Ps. | 3,740,427 | Ps. | 9,620,213 | Ps. | 23,558,155 | Ps. | 30,686,829 | ||||||||||
| Financial sector (public and private) |
37,927 | 68,480 | 223,447 | 286,421 | 279,169 | |||||||||||||||
| Non-financial private sector |
9,937,460 | 19,456,916 | 52,952,798 | 112,921,562 | 166,983,145 | |||||||||||||||
| Demand deposits |
2,083,553 | 3,423,856 | 9,390,215 | 17,053,971 | 22,023,624 | |||||||||||||||
| Savings accounts |
3,601,765 | 6,720,076 | 25,598,517 | 51,411,187 | 72,356,135 | |||||||||||||||
| Term deposits |
3,924,526 | 8,576,387 | 15,559,905 | 40,769,850 | 68,709,336 | |||||||||||||||
| Others |
327,616 | 328,995 | 1,029,045 | 2,060,367 | 2,632,801 | |||||||||||||||
|
|
|
|
|
|
|
|
|
|
|
|||||||||||
| Total deposits |
Ps. | 12,345,095 | Ps. | 23,265,823 | Ps. | 62,796,458 | Ps. | 136,766,138 | Ps. | 197,949,143 | ||||||||||
|
|
|
|
|
|
|
|
|
|
|
|||||||||||
Source: Central Bank.
Deposits by Sector and by Type of Deposit
(% change from the previous period)
| As of December 31, | ||||||||||||||||||||
| 2021 | 2022 | 2023 | 2024 | 2025 | ||||||||||||||||
| Non-financial public sector |
64.3 | % | 57.8 | % | 157.2 | % | 144.9 | % | 30.3 | % | ||||||||||
| Financial sector (public and private) |
33.7 | 80.6 | 226.3 | 28.2 | (2.5 | ) | ||||||||||||||
| Non-financial private sector |
51.0 | 95.8 | 172.2 | 113.2 | 47.9 | |||||||||||||||
| Demand deposits |
65.8 | 64.3 | 174.3 | 81.6 | 29.1 | |||||||||||||||
| Savings accounts |
44.2 | 86.6 | 280.9 | 100.8 | 40.7 | |||||||||||||||
| Term deposits |
50.5 | 118.5 | 81.4 | 162.0 | 68.5 | |||||||||||||||
| Others |
50.8 | 0.4 | 212.8 | 100.2 | 27.8 | |||||||||||||||
|
|
|
|
|
|
|
|
|
|
|
|||||||||||
| Total deposits |
53.4 | % | 88.5 | % | 169.9 | % | 117.8 | % | 44.7 | % | ||||||||||
|
|
|
|
|
|
|
|
|
|
|
|||||||||||
Source: Central Bank.
D-107
Interest Rates
Interest Rates on Bank Loans
As of December 31, 2025, the annual average interbank rate on peso-denominated loans was 40.3% (as compared to 55.8% as of December 31, 2024). The overdraft current account rate decreased from 61.6% as of December 31, 2024 to 46.9% as of December 31, 2025. The annual average dollar-denominated interbank rate decreased from 3.2% as of December 31, 2024 to 2.4% as of December 31, 2025.
As of December 31, 2025, nominal annual interest rates on peso-denominated personal loans decreased to 65.6% from 73.3% as of December 31, 2024 and the average interest rates on peso-denominated mortgage loans increased from 33.0% as of December 31, 2024 to 39.4% as of December 31, 2025.
The following table sets forth information regarding average interest rates on bank loans for the periods specified.
Interest Rates on Bank Loans
(nominal annual interest rate)
| 2021 | 2022 | 2023 | 2024 | 2025 | ||||||||||||||||
| Domestic currency: |
||||||||||||||||||||
| Interbank(1) |
31.2 | % | 48.1 | % | 89.1 | % | 55.8 | % | 40.3 | % | ||||||||||
| Overdraft Current Account(2) |
35.6 | 52.5 | 96.0 | 61.6 | 46.9 | |||||||||||||||
| Foreign currency: |
||||||||||||||||||||
| Interbank(1) |
3.6 | % | 4.1 | % | 6.2 | % | 3.2 | % | 2.4 | % | ||||||||||
| (1) | Average interbank rate. |
| (2) | Average interest rate on current account peso-denominated overdrafts. |
Source: Central Bank.
On September 15, 2022, the Central Bank increased the monetary policy rate from 69.5% to 75.0% and the floor of term deposits by individuals up to an annual 75.0% for 30-day deposits of up to Ps.10 million. For the rest of the term deposits of the private sector, the floor was set at 66.5%.
During 2023, the Central Bank increased the monetary policy rate from 75.0% to 133% for the final Leliq auction. After Milei’s administration took office on December 10, 2023, the Central Bank decided to discontinue the use of Leliqs as a liquidity control instrument and, instead, opted for reverse repo transactions to absorb monetary surpluses.
By the end of 2024, the monetary policy rate reached 32.0%, decreasing from 100.0% at the beginning of the year, while the repo rate decreased to 36.0% from 160.0% during the same period. In November 2024, the Central Bank introduced a rate called TAMAR (Tasa Mayorista de Argentina) for fixed term deposits of Ps.1.0 billion or more, due between 30-35 days, published daily starting as of December 2, 2024 (when it stood at 38.4%). The main difference with other reference rates (such as the BADLAR) is that the minimum deposit amount will be updated annually. As of December 30, 2024, the TAMAR stood at 34.3%.
In 2025, the Central Bank achieved its objective of controlling the money supply while reducing control over other nominal variables (such as the exchange rate and interest rate). The first step was to diminish the role of the exchange rate as a nominal anchor through the exchange rate bands established in April 2025 and subsequently adjusted in December 2025. The policy interest rate was then eliminated, allowing the market to determine interest rates endogenously. Additional steps included the termination of the automatic placement facility for excess bank liquidity (LEFIs) and the management of money supply and demand without a target interest rate, relying instead on market instruments. The pace of this transformation was lower than initially anticipated given the financial volatility resulting from increased perceived political risk in connection with the congressional elections of October 26, 2025.
D-108
Interest Rates on Deposits
The average nominal annual interest rate on peso-denominated term deposits increased from 29.4% in 2020 to 33.6% in 2021. The average nominal annual interest rate on U.S. dollar-denominated term deposits decreased from 0.8% in 2020 to 0.4% in 2021. The monthly average nominal peso BADLAR rate for private banks decreased from 34.2% for the month of December 2020 to 34.1% for the month of December 2021.
The average nominal annual interest rate on peso-denominated term deposits increased from 33.6% in 2021 to 52.5% in 2022. The average nominal annual interest rate on U.S. dollar-denominated term deposits decreased from 0.42% in 2021 to 0.38% in 2022. The monthly average nominal peso BADLAR rate for private banks increased from 34.1% for the month of December 2021 to 69.4% for the month of December 2022.
The average nominal annual interest rate on peso-denominated term deposits increased from 52.5% in 2022 to 95.0% in 2023. The average nominal annual interest rate on U.S. dollar-denominated term deposits decreased from 0.38% in 2022 to 0.34% in 2023. The monthly average nominal peso BADLAR rate for private banks increased from 69.4% for the month of December 2022 to 109.8% for the month of December 2023.
The average nominal annual interest rate on peso-denominated term deposits decreased from 95.0% in 2023 to 54.2% in 2024. The average nominal annual interest rate on U.S. dollar-denominated term deposits increased from 0.34% in 2023 to 0.46% in 2024. The monthly average nominal peso BADLAR rate for private banks decreased from 109.8% for the month of December 2023 to 31.9% for the month of December 2024.
The average nominal annual interest rate on peso-denominated term deposits decreased from 54.2% in 2024 to 34.8% in 2025. The average nominal annual interest rate on U.S. dollar-denominated term deposits increased from 0.46% in 2024 to 1.57% in 2025. The monthly average nominal peso BADLAR rate for private banks decreased from 31.9% for the month of December 2024 to 26.7% for the month of December 2025.
The following table sets forth information regarding average interest rates on bank deposits for the periods specified.
Interest Rates on Deposits, Lebacs and Leliqs
(nominal annual interest rate)
| 2021 | 2022 | 2023 | 2024 | 2025 | ||||||||||||||||
| Domestic currency: |
||||||||||||||||||||
| Savings deposits |
7.4 | % | 13.2 | % | 35.5 | % | 22.6 | % | 10.0 | % | ||||||||||
| Term deposits(1) |
33.6 | 52.5 | 95.0 | 54.2 | 34.8 | |||||||||||||||
| Average deposit rate(2) |
23.8 | 41.5 | 77.4 | 37.0 | 26.5 | |||||||||||||||
| Leliq(3)(5) |
38.00 | 60.05 | 101.93 | — | — | |||||||||||||||
| Notaliq(4)(5) |
— | 62.91 | 87.40 | — | — | |||||||||||||||
| Foreign currency: |
||||||||||||||||||||
| Savings deposits |
0.02 | 0.02 | 0.02 | 0.02 | 0.18 | |||||||||||||||
| Term deposits(1) |
0.42 | 0.38 | 0.34 | 0.46 | 1.57 | |||||||||||||||
| Average deposit rate(2) |
0.15 | 0.14 | 0.12 | 0.14 | 0.75 | |||||||||||||||
| (1) | Weighted average interest rate on all term deposits. |
| (2) | Weighted average interest rate on term deposits plus savings deposits. |
| (3) | Weighted average annual rate for all term Leliqs. |
| (4) | Weighted average annual rate for all term Notaliqs. |
| (5) | Discontinued in 2023. |
n.a. = not available.
Source: Central Bank.
Securities Markets
In the Argentine securities market, Government bonds dominate trading activities, followed by trading of corporate equity securities and corporate bonds. Trading of other instruments such as futures and options represents only a small portion of market activity.
D-109
Regulation of the Securities Markets
The Argentine securities markets are regulated by the CNV and the stock markets. The CNV supervises all agents that carry out transactions in Argentina’s public securities markets, including brokers, public companies, mutual funds and clearinghouses, and has the authority to regulate and control the public offering of all securities, other than the primary issue of Government securities.
On December 29, 2016, the CNV authorized Bolsas y Mercados Argentinos (“ByMA”) as a market for the listing of securities through a public offering approval. The ByMA began its activities on May 23, 2017 and, subsequently, all listing of notes on the MERVAL were automatically transferred to ByMA. Currently, the primary markets are the ByMA and the Mercado Abierto Electrónico (“MAE”).
In the first half of the 1990s, changes to the legal framework provided for the issuance and trading of new financial products in the Argentine capital markets, including commercial paper, new types of corporate bonds, as well as futures and options. This period was characterized by relatively low levels of regulation of the Argentine securities market and limited enforcement. In November 2013, Congress approved the Capital Markets Law No. 26,831, which empowered the CNV to strengthen disclosure and regulatory standards for the Argentine securities market. The new standards were introduced through changes to the CNV’s rules implemented under Resolution 622/2013. On May 9, 2018, Congress enacted Law No. 27,440 to (i) develop national capital markets to increase financing for MSMEs; (ii) promote access to housing by generating financing for mortgage loans; (iii) increase financial instruments that favor and promote long-term savings; (iv) strengthen the regulatory powers of the CNV; and (v) stimulate the federalization of capital markets through technology.
During 2021, the value of the Argentine securities was adversely affected by investors’ perceptions of the long-term effects of macroeconomic developments and the impact of the COVID-19 pandemic, which resulted in significant decreases of company valuations and increases in yields in the secondary market for debt securities of Argentine issuers.
Between December 2020 and December 2021, Argentine companies increased their capital markets financing by 43%. As of December 31, 2021, the market capitalization of Argentina’s main securities market for equities was U.S.$41.7 billion, representing a 41.4% and 79.7% increase when measured in U.S. dollars and pesos, respectively, compared to December 31, 2020.
During 2022, the value of the Argentine securities was adversely affected by investors’ perceptions of the long-term effects of macroeconomic developments and the impact of the COVID-19 pandemic, which resulted in significant decreases of company valuations and increases in yields in the secondary market for debt securities of Argentine issuers.
Between December 2021 and December 2022, Argentine companies increased their capital markets financing by 51.0%. As of December 31, 2022, the market capitalization of Argentina’s main securities market for equities was U.S.$54.1 billion (when measured in U.S. dollars), a 29.8% increase compared to December 31, 2021.
As of December 31, 2023, the market capitalization of Argentina’s main securities market for equities was U.S.$46.78 billion (when measured in U.S. dollars), a 13.6% decrease compared to December 31, 2022. Throughout 2023, companies’ funding via capital markets reached Ps.433,404 million, representing a 127% increase compared to the previous year. For SMEs alone, financing amounted to Ps.329,778 million, marking a 295% increase compared to December 2022.
As of December 31, 2024, the market capitalization of Argentina’s main securities market for equities was U.S.$90.1 billion (when measured in U.S. dollars), a 93% increase compared to December 31, 2023. Throughout 2024, companies’ funding via capital markets reached Ps.27.9 billion, representing a 42% increase compared to the previous year (measured at constant pesos of December 2024). For SMEs alone, financing amounted to Ps.10,846 million, marking a 27% increase in real terms compared to December 2023.
As of December 31, 2025, the market capitalization of Argentina’s main securities market for equities was U.S.$64.8 billion (when measured in U.S. dollars), a 28.1% decrease compared to December 31, 2024. Throughout 2025, companies’ funding via capital markets reached Ps.49,15 billion, representing a 34.0% increase compared to the previous year (measured at constant pesos of December 2025). For SMEs alone, financing amounted to Ps.15,295 million, marking a 7.0% increase in real terms compared to December 2024.
Mutual Funds and the FGS
From 2005 to 2008, individuals, pension funds and mutual funds constituted the largest groups of investors in Argentina’s capital markets.
D-110
On November 20, 2008, Congress approved Law No. 26,425, which reformed the private pension system. Under this law, the former private pension system was absorbed and replaced by the Sistema Solidario de Reparto (Argentine Integrated Pension System), structured as a “pay as you go” system. As a result, all of the resources administered by the private pension funds, including equity interests in a wide range of listed companies, were transferred to a separate fund, the FGS, to be administered by ANSES. The assets held in the FGS may only be used to make advances to the Government to cover unexpected budget deficits that prevent the Government (through ANSES) from honoring its obligation to make social security and pension payments. The FGS holds a wide range of financial assets, including without limitation public sector securities, shares of corporations, fixed and floating rate instruments, bonds, mutual funds, securities representing debt issued under trusts and mortgage bonds. As of December 2025, the FGS was valued at Ps.106,142 billion. Securities and stocks were the FGS’s most important investments, representing 91.9% of the total value of the Fund.
Total Assets of the FGS
| 2021 | 2022 | 2023 | 2024 | 2025 | ||||||||||||||||
| Assets (in billions of pesos) |
Ps. | 5,254.9 | Ps. | 9,534.9 | Ps. | 40,084.3 | Ps. | 76,904.9 | Ps. | 106,141.9 | ||||||||||
| Percentage increase from previous year |
50.1 | % | 81.4 | % | 320.4 | % | 91.9 | % | 38.0 | % | ||||||||||
Source: FGS.
Government Bonds
In terms of trading volume, the Argentine bond market is dominated by Government securities. The total traded amount of public bonds reached U.S.$394.5 billion in 2021, U.S.$691.7 billion in 2022, U.S.$807.1 billion in 2023, U.S.$1,180.6 billion in 2024 and U.S.$.2,409.5 billion in 2025.
For a description of the types of bonds issued by the Government see “Public Sector Debt.”
Corporate Bonds
Corporate bonds are issued in registered form and may be denominated in local or foreign currency. Interest rates on corporate bonds may be fixed or floating and can vary substantially with market conditions and the creditworthiness of the issuer.
Equities
The Argentine equities market is regulated by the CNV. Authorized markets, following CNV standards, set the rules that corporate issuers must follow to list equity securities on those markets.
In 2021, equity total trading volume contracted by 16.4% to U.S.$3.1 billion compared to U.S.$3.7 billion in 2020. In 2022, equity total trading volume grew by 2.9% to U.S.$3.2 billion compared to U.S.$3.1 billion in 2021. In 2023, equity total trading volume grew by 167.7% to U.S.$8.5 billion compared to U.S.$3.2 billion in 2022. In 2024, equity total trading volume grew by 58.3% to U.S.$13.5 billion compared to U.S.$8.5 billion in 2023. In 2025, equity total trading volume grew by 53.2% to U.S.$20.7 billion compared to U.S.$13.5 billion in 2024.
D-111
The following table sets forth certain data regarding the market capitalization and average daily trading volume on the Buenos Aires Stock Exchange as of the dates specified.
Market Capitalization and Traded Amount on the Buenos Aires Stock Exchange
(in millions of U.S. dollars, unless otherwise specified)(³)
| As of December 31, | ||||||||||||||||||||
| 2021 | 2022 | 2023 | 2024 | 2025 | ||||||||||||||||
| Market capitalization (in billions of U.S. Dollars) |
U.S.$ | 41.7 | U.S.$ | 54.1 | U.S.$ | 46.8 | U.S.$ | 90.1 | U.S.$ | 64.8 | ||||||||||
| Average daily traded amount |
3,010.9 | 5,284.3 | 7,602.3 | 9,015.4 | 19,765.7 | |||||||||||||||
| Shares |
12.7 | 13.1 | 35.1 | 55.8 | 85.6 | |||||||||||||||
| Corporate bonds |
411.0 | 1,030.1 | 1,056.4 | 644.4 | 641.6 | |||||||||||||||
| Public bonds |
1,616.9 | 2,834.9 | 3,321.4 | 4,878.5 | 9,956.4 | |||||||||||||||
| Others(1) |
970.4 | 1,406.2 | 3,189.4 | 3,436.7 | 9,082.1 | |||||||||||||||
| Total traded amount(2) |
734,673.5 | 1,289,361 | 1,847,369.5 | 2,181,738 | 4,804,806 | |||||||||||||||
| Shares |
3,101 | 3,189.5 | 8,540 | 13,515 | 20,704 | |||||||||||||||
| Corporate bonds |
100,277 | 251,352 | 256,706 | 155,934 | 155,274 | |||||||||||||||
| Public bonds |
394,516 | 691,713 | 807,104 | 1,180,605 | 2,409,455 | |||||||||||||||
| Others(1) |
U.S.$ | 236,780 | U.S.$ | 343,106 | U.S.$ | 775,020 | U.S.$ | 831,684 | U.S.$ | 2,197,868 | ||||||||||
| (1) | Includes mutual funds, index futures, options and others. |
| (2) | Total traded amounts for each year. |
| (3) | For 2021, 2022, 2023 and 2024, the information reflects trading only on the Buenos Aires Stock Exchange (ByMA). For 2025, the information reflects all data from ByMA and A3 Mercados S.A. (which resulted from the merger of Matba Rofex and MAE-Mercado Abierto Electrónico). |
Source: Buenos Aires Stock Exchange.
D-112
PUBLIC SECTOR FINANCES
Introduction
Argentina’s public sector comprises national, provincial and municipal entities. These entities are divided into the non-financial public sector and the financial public sector. The non-financial public sector consists of national, provincial and municipal administrations, state-owned enterprises, certain public agencies and special-purpose fiduciary funds. The National Administration, in turn, is composed of the Central Administration, decentralized agencies and social security institutions (including former provincial pension funds). The financial public sector consists of the Central Bank, the Banco de la Nación Argentina, the BICE and ten other public financial entities (including provincial and municipal banks).
The chart below sets forth the organizational structure of Argentina’s public sector, excluding the non-financial municipal sector.
The Central Administration comprises the executive, legislative and judicial branches of the Government, including the public ministries. National decentralized agencies include governmental institutions, such as the Agencia de Recaudación y Control Aduanero (“ARCA”) with a budget, revenues and expenditures separate from the Central Administration. The national social security institutions consist of ANSES, which is a self-governing entity, the Armed Forces Pension Fund and the Federal Police Pension Fund. As of the date of this Annual Report, ten provinces and the City of Buenos Aires had transferred their social security obligations to ANSES.
The national public accounts reflect the consolidated results of the non-financial national public sector.
Argentina’s provincial and local authorities are independent from the Government and maintain separate fiscal accounts. Accordingly, the fiscal results of the provinces and local governments are not reflected in the national public accounts. The Central Administration, however, is legally required to transfer a portion of its revenues to the provinces and from time to time has also provided other forms of financial assistance to the provinces. See “—Fiscal Relations with the Provinces.”
Except as otherwise specified in the discussion below, the national public accounts are presented using a cash-basis method, which computes revenues and expenditures in the period in which cash flows take place, regardless of the period in which they were accrued. In the discussion of the National Public Accounts below and throughout this Annual Report, the non-financial national public sector is referred to as the “Government.” Additionally, we refer to the fiscal balance of the non-financial national public sector as the “primary fiscal balance.” This primary fiscal balance does not reflect the issuance of Bocones, a debt instrument issued by the Government to discharge a portion of its payment obligations (e.g., with suppliers) or interest payments. The overall balance of the non-financial national public sector includes interest payments unless otherwise specified.
National Public Accounts
Overview
Since 2016, fiscal results are presented such that (i) transfers from the Central Bank and FGS to the Government are excluded from total fiscal revenues, (ii) intra-public sector interest payments on public debt made by the Government are excluded from total primary expenditures and (iii) tax revenues are presented net of revenues and transfers co-participated with the provinces, pension contributions, subsidies and social security transfers of the Government. Information below for years prior to 2016, employs data using the new reporting methodology described above.
Amounts in the discussion of fiscal results below are those set forth in the immediately following tables, with the exception of references to revenues from social security taxes, value-added taxes (“VAT”), income taxes, taxes on goods and services and taxes on fuel, each of which relate to data set forth in the table titled “Composition of Tax Revenues” presented in “—Tax Regime,” which include revenues (and transfers) “co-participated” with the provinces (see “—Fiscal Relations with the Provinces”) and pension contributions mandated by the Argentine Integrated Pension System.
D-113
Evolution of Fiscal Results: 2021 to 2025
From 2021 to 2023, the Government recorded deficits in both the primary fiscal balance and the overall balance. In 2024, the Government recorded a surplus in both the primary fiscal balance and the overall balance. Primary expenditures decreased to 20.5% of GDP in 2021, 19.5% of GDP in 2022, 18.9% of GDP in 2023 and 14.6% of GDP in 2024. Such continued decrease was mainly due to a reduction of the funding of social programs and the economic program implemented by the Milei administration focused on rationalizing public sector spending. In 2025, primary expenditures decreased to 14.2% of GDP. See “The Argentine Economy—The Milei Administration.”
National Public Accounts
(in millions of pesos)
| 2021 | 2022 | 2023 | 2024 | 2025 | ||||||||||||||||
| Fiscal revenue |
||||||||||||||||||||
| Current revenue: |
||||||||||||||||||||
| National Administration taxes(1) |
Ps. | 5,128,525 | Ps. | 9,152,136 | Ps. | 19,005,560 | Ps. | 60,630,335 | Ps. | 77,130,564 | ||||||||||
| Social security tax(1) |
2,382,291 | 4,274,215 | 9,619,766 | 29,444,258 | 46,988,475 | |||||||||||||||
| Net operating result from state-owned enterprises |
(363,735 | ) | (626,597 | ) | (1,204,295 | ) | (2,450,729 | ) | (1,231,159 | ) | ||||||||||
| Other non-tax revenue(2) |
1,355,145 | 1,683,248 | 3,694,126 | 7,860,678 | 9,331,245 | |||||||||||||||
| Capital revenue(3) |
14,180 | 40,023 | 725 | 5,084 | 95,147 | |||||||||||||||
|
|
|
|
|
|
|
|
|
|
|
|||||||||||
| Total fiscal revenues(4) |
Ps. | 8,516,405 | Ps. | 14,523,025 | Ps. | 31,115,882 | Ps. | 95,489,626 | Ps. | 132,314,272 | ||||||||||
|
|
|
|
|
|
|
|
|
|
|
|||||||||||
| Primary expenditures(5) |
||||||||||||||||||||
| Current expenditures: |
||||||||||||||||||||
| National Administration wages |
1,078,560 | 1,987,026 | 5,037,827 | 12,588,606 | 16,357,104 | |||||||||||||||
| Goods and services |
461,544 | 624,903 | 1,326,892 | 3,086,378 | 5,048,073 | |||||||||||||||
| Social security(6) |
3,709,542 | 6,288,154 | 12,914,190 | 35,733,170 | 56,673,137 | |||||||||||||||
| Transfers to provinces |
418,836 | 637,042 | 1,641,762 | 1,663,468 | 2,782,454 | |||||||||||||||
| Other transfers(7) |
3,144,573 | 5,278,593 | 12,211,854 | 29,508,154 | 36,469,116 | |||||||||||||||
| Other expenditures |
32,531 | 34,644 | 77,640 | 134,826 | 156,796 | |||||||||||||||
| Capital expenditures |
651,058 | 1,332,412 | 3,070,354 | 2,369,215 | 3,058,374 | |||||||||||||||
|
|
|
|
|
|
|
|
|
|
|
|||||||||||
| Total primary expenditures |
9,496,646 | 16,182,773 | 36,280,518 | 85,083,816 | 120,545,054 | |||||||||||||||
|
|
|
|
|
|
|
|
|
|
|
|||||||||||
| Primary fiscal balance |
Ps. | (980,240 | ) | Ps. | (1,659,748 | ) | Ps. | (5,164,637 | ) | Ps. | 10,405,810 | Ps. | 11,769,219 | |||||||
| Interest payments(8) |
684,241 | 1,493,009 | 3,253,832 | 8,641,024 | 10,315,400 | |||||||||||||||
| Privatization proceeds |
— | — | — | — | — | |||||||||||||||
|
|
|
|
|
|
|
|
|
|
|
|||||||||||
| Overall balance of non-financial public sector(9) |
Ps. | (1,664,482 | ) | Ps. | (3,152,757 | ) | Ps. | (8,418,468 | ) | Ps. | 1,764,786 | Ps. | 1,453,819 | |||||||
|
|
|
|
|
|
|
|
|
|
|
|||||||||||
| (1) | Data set forth in this table differs from the data presented in the tables titled “Composition of Tax Revenues” because it excludes revenues (and transfers) co-participated with the provinces and because it is published after the data set forth in the “Composition of Tax Revenues” table and thus reflects updated information. |
| (2) | Excludes transfers from the Central Bank and the FGS and includes sale of goods and services of the public administration, operational revenues, current transfers and other transfers. |
| (3) | Excludes revenues from privatization. |
| (4) | Includes pension contributions mandated by the Argentine Integrated Pension System. |
| (5) | The Government discharges certain of its payment obligations (e.g., with suppliers) by issuing bonds known as Bocones. Bocones constitute bonds to be paid in the future rather than cash payments, and were not recorded as primary expenditures in the periods presented in this table or reflected as part of the overall balance of the non-financial public sector. The amount of Bocones issued in 2021, 2022, 2023, 2024 and 2025 was Ps.3.9 billion, Ps.1.9 billion, Ps.14.8 billion, Ps.10.5 billion and Ps.5.5 billion, respectively. |
| (6) | Amounts presented under “Social security” in this table are calculated on a cash basis and therefore differ from the data presented in the table entitled “Composition of National Public Expenditures,” which are calculated using the accrual method of accounting and correspond to the National Administration. |
D-114
| (7) | Includes transfers to the private sector (including subsidies), to the public sector (e.g., transfers to universities), under the Heads of Households Program and to state-owned companies. |
| (8) | Excludes intra-public sector interest payments and includes interest payments on bonds issued pursuant to the 2005 Debt Exchange and the 2010 Debt Exchange. |
| (9) | The overall balance of the non-financial public sector equals the primary fiscal balance minus interest payments. |
Source: Ministry of Economy.
National Public Accounts
(% of Nominal GDP)
| 2021 | 2022 | 2023 | 2024 | 2025 | ||||||||||||||||
| Fiscal revenue |
||||||||||||||||||||
| Current revenue: |
||||||||||||||||||||
| National Administration taxes(1) |
11.1 | % | 11.1 | % | 9.8 | % | 10.4 | % | 9.1 | % | ||||||||||
| Social security tax(1) |
5.2 | 5.2 | 5.0 | 5.0 | 5.5 | |||||||||||||||
| Net operating result from state-owned enterprises |
(0.8 | ) | (0.8 | ) | (0.6 | ) | (0.4 | ) | (0.1 | ) | ||||||||||
| Other non-tax revenue(2) |
2.9 | 2.0 | 1.9 | 1.3 | 1.1 | |||||||||||||||
| Capital revenue(3) |
— | — | — | — | — | |||||||||||||||
| Total fiscal revenues(4) |
18.4 | 17.5 | 16.0 | 16.3 | 15.6 | |||||||||||||||
| Primary expenditures(5) |
||||||||||||||||||||
| Current expenditures: |
||||||||||||||||||||
| National Administration wages |
2.3 | 2.4 | 2.6 | 2.2 | 1.9 | |||||||||||||||
| Goods and services |
1.0 | 0.8 | 0.7 | 0.5 | 0.6 | |||||||||||||||
| Social security(6) |
8.0 | 7.6 | 6.7 | 6.1 | 6.7 | |||||||||||||||
| Transfers to provinces |
0.9 | 0.8 | 0.9 | 0.3 | 0.3 | |||||||||||||||
| Other transfers(7) |
6.8 | 6.4 | 6.4 | 5.0 | 4.3 | |||||||||||||||
| Other expenditures |
0.1 | — | — | — | — | |||||||||||||||
| Capital expenditures |
1.4 | 1.6 | 1.6 | 0.4 | 0.4 | |||||||||||||||
|
|
|
|
|
|
|
|
|
|
|
|||||||||||
| Total primary expenditures |
20.5 | 19.6 | 18.7 | 14.6 | 14.2 | |||||||||||||||
|
|
|
|
|
|
|
|
|
|
|
|||||||||||
| Primary fiscal balance |
(2.1 | ) | (2.0 | ) | (2.7 | ) | 1.8 | 1.4 | ||||||||||||
| Interest payments(8) |
1.5 | 1.8 | 1.7 | 1.5 | 1.2 | |||||||||||||||
| Privatization proceeds |
— | — | — | — | — | |||||||||||||||
|
|
|
|
|
|
|
|
|
|
|
|||||||||||
| Overall balance of non-financial public sector(9) |
(3.6 | )% | (3.8 | )% | (4.3 | )% | 0.3 | % | 0.2 | % | ||||||||||
|
|
|
|
|
|
|
|
|
|
|
|||||||||||
| (1) | Data set forth in this table differs from the data presented in the tables titled “Composition of Tax Revenues” because it excludes revenues (and transfers) co-participated with the provinces and because it is published after the data set forth in the “Composition of Tax Revenues” tables and thus reflects updated information. |
| (2) | Excludes transfers from the Central Bank and the FGS and includes sale of goods and services of the public administration, operational revenues, current transfers and other transfers. |
| (3) | Excludes revenues from privatization. |
| (4) | Includes pension contributions mandated by the Argentine Integrated Pension System. |
| (5) | The Government discharges certain of its payment obligations (e.g., with suppliers) by issuing bonds known as Bocones. Bocones constitute bonds to be paid in the future rather than cash payments, and were not recorded as primary expenditures in the periods presented in this table or reflected as part of the overall balance of the non-financial public sector. The amount of Bocones issued in 2021, 2022, 2023, 2024 and 2025 was Ps.3.9 billion, Ps.1.9 billion, Ps.14.8 billion, Ps.10.5 billion and Ps.5.5 billion, respectively. |
| (6) | Amounts presented under “Social security” in this table are calculated on a cash basis and therefore differ from the data presented in the table entitled “Composition of National Public Expenditures,” which are calculated using the accrual method of accounting and correspond to the National Administration. |
| (7) | Includes transfers to the private sector (including subsidies), to public sector entities (e.g., transfers to universities), to the Heads of Households Program and to state-owned companies. |
| (8) | Excludes intra-public sector interest payments Includes interest payments on bonds issued pursuant to the 2005 Debt Exchange and the 2010 Debt Exchange. |
| (9) | The overall balance of the non-financial public sector equals the primary fiscal balance minus interest payments. |
Source: Ministry of Economy.
D-115
Fiscal Result of 2021 Compared to Fiscal Results of 2020
Primary fiscal balance. The primary fiscal deficit recorded for 2021 was Ps.980.2 billion, compared to a deficit of Ps.1,749.9 billion for 2020. Total revenues increased by 81.2% in 2021, while primary expenditures (excluding interest payments) increased by 47.3%.
Fiscal revenues. In 2021, fiscal revenues increased by 81.2% to Ps.8,516.4 billion from Ps.4,698.9 billion in 2020. The increase was mainly due to an increase in revenues generated by (i) VAT, imports and exports taxes and social security taxes, (ii) the tax modifications introduced by the Solidarity Law (see “—Tax Regime—Tax Modifications Introduced by the Solidarity Law”), (iii) a U.S.$439.0 billion extraordinary allocation of special-drawing rights by the IMF, mainly to mitigate the impact of the global crisis caused by the COVID-19 pandemic, and (iv) the enactment of Law No.27,605, which created a solidary and extraordinary contribution by higher income sectors levied on the assets of individuals and undivided estates.
Primary expenditures. In 2021, primary expenditures (excluding interest payments) of the Government increased by 47.3% to Ps.9,496.6 billion in 2021 from Ps.6,448.9 billion in 2020. This increase was mainly due to the following factors:
| | social security outlays, which accounted for approximately 36.0% of the overall increase in expenditures, increased by 41.9%, from Ps.2,613.8 billion in 2020 to Ps.3,709.5 billion in 2021, mainly as a result of increases in pension payments mandated by law; |
| | national administration wages, which accounted for approximately 12.6% of the overall increase in expenditures, increased by 55.0% from Ps.696.0 billion in 2020 to Ps.1,078.5 billion in 2021; |
| | other transfers (including external sector transfers, private sector subsidies and transfers to autonomous public entities such as universities), which accounted for approximately 28.8% of the overall increase in expenditures, increased by 38.7%, from Ps.2,267.5 billion in 2020 to Ps.3,144.5 billion in 2021. This increase was mainly due to an increase in outlays to social security payments to mitigate the economic effects of the measures deployed by the Government to prevent the spread of COVID-19, including: |
| | extraordinary social security payments made during May, April, August and December to beneficiaries of lower income pensions and retirement benefits, to mitigate the effects of the COVID-19 pandemic; |
| | distribution of Ps.90.9 billion in food cards within the framework of the national food emergence, which has been extended until December 31, 2022; |
| | payment of an extraordinary Ps.15,000 subsidy to Universal Child Allowance beneficiaries and single-taxpayers that are beneficiaries of family allowances, as well as a supplemental monthly payment to Universal Child Allowance beneficiaries of lower income; |
| | disbursements for Ps.149.4 billion under the Plan Potenciar Trabajo (Plan to Boost Employment), to encourage employment and new productive projects; and |
| | capital expenditures, increased from Ps.279.6 billion in 2020 to Ps.651.0 billion in 2021. |
Overall fiscal balance. The overall fiscal balance of the Government recorded a deficit of Ps.1,664.4 billion in 2021, compared to a deficit of Ps.2,292.8 billion in 2020.
Fiscal Result of 2022 Compared to Fiscal Results of 2021
Primary fiscal balance. The primary fiscal deficit recorded for 2022 was Ps.1,659.7 billion, compared to a deficit of Ps.980.2 billion for 2021. Total revenues increased by 70.5% in 2022, while primary expenditures (excluding interest payments) increased by 70.4%.
Fiscal revenues. In 2022, fiscal revenues increased by 70.5% to Ps.14,523.0 billion from Ps.8,516.4 billion in 2021. The increase was mainly due to an increase in revenues generated by VAT, imports and exports taxes and social security taxes.
Primary expenditures. In 2022, primary expenditures (excluding interest payments) of the Government increased by 70.4% to Ps.16,182.7 billion in 2022 from Ps.9,496.6 billion in 2021. This increase was mainly due to the following factors:
| | social security outlays, which accounted for approximately 38.6% of the overall increase in expenditures, increased by 69.5%, from Ps.3,709.5 billion in 2021 to Ps.6,288.2 billion in 2022, mainly as a result of increases in pension payments mandated by law and extraordinary social security payments made during April, May, August, and December 2022, aimed at providing greater protection to vulnerable groups. The Government announced additional payments for Ps.6,000 and Ps.12,000 to beneficiaries of lower income pensions and retirement benefits in April and May 2022, respectively. Further, the Government announced a monthly increase for lower income pensions; |
D-116
| | other transfers (including external sector transfers, private sector subsidies and transfers to autonomous public entities such as universities), which accounted for approximately 31.9% of the overall increase in expenditures, increased by 67.9%, from Ps.3,144.5 billion in 2021 to Ps.5,278.6 billion in 2022. This increase was mainly due to (i) financial assistance granted to CAMMESA and ENARSA for the execution of energy policies; (ii) an increase in family allowances mainly as a result of a new mobility index; (iii) additional support for retirees, pensioners and vulnerable groups to mitigate the effects of the worsening of their financial capacity; (iv) compensations for the loss of purchasing power of income; (v) transfers to national universities, mainly for salary payments and operating expenses; and (vi) further allocation of assets for the Plan Potenciar Trabajo (Plan to Boost Employment); |
| | national administration wages, which accounted for approximately 13.6% of the overall increase in expenditures, increased by 84.2% from Ps.1,078.5 billion in 2021 to Ps.1,987.0 billion in 2022; and |
| | capital expenditures, increased from Ps.651.0 billion in 2021 to Ps.1,332.4 billion in 2022. |
Overall fiscal balance. The overall fiscal balance of the Government recorded a deficit of Ps.3,152.7 billion in 2022, compared to a deficit of Ps.1,664.4 billion in 2021.
Fiscal Result of 2023 Compared to Fiscal Results of 2022
Primary fiscal balance. The primary fiscal deficit recorded for 2023 was Ps.5,164.6 billion, compared to a deficit of Ps.1,659.7 billion for 2022. Total revenues increased by 114.3% in 2023, while primary expenditures (excluding interest payments) increased by 124.2%.
Fiscal revenues. In 2023, fiscal revenues increased by 114.4% to Ps.31,115.8 billion from Ps.14,523.0 billion in 2022. The increase was mainly due to an increase in revenues generated by VAT, income tax, import taxes and social security taxes.
Primary expenditures. In 2023, primary expenditures (excluding interest payments) of the Government increased by 124.2% to Ps.36,280.5 billion in 2023 from Ps.16,182.7 billion in 2022. This increase was mainly due to the following factors:
| | social security outlays, which accounted for approximately 33.0% of the overall increase in expenditures, increased by 105.4%, from Ps.6,288.2 billion in 2022 to Ps.12,914.1 billion in 2023, mainly as a result of increases in pension payments mandated by law; |
| | other transfers (including external sector transfers, private sector subsidies and transfers to autonomous public entities such as universities), which accounted for approximately 34.5% of the overall increase in expenditures, increased by 131.3%, from Ps.5,278.6 billion in 2022 to Ps.12,211.8 billion in 2023. This increase was mainly due to (i) financial assistance granted to CAMMESA and ENARSA for the execution of energy policies; (ii) an increase in family allowances mainly as a result of a new mobility index; (iii) additional support for retirees, pensioners and vulnerable groups to mitigate the effects of the worsening of their financial capacity; (iv) compensations for the loss of purchasing power of income; (v) transfers to national universities, mainly for salary payments and operating expenses; and (vi) further allocation of assets for the Plan Potenciar Trabajo (Plan to Boost Employment); |
| | national administration wages, which accounted for approximately 15.2% of the overall increase in expenditures, increased by 153.5% from Ps.1,987.0 billion in 2022 to Ps.5,037.8 billion in 2023; and |
| | capital expenditures, increased from Ps.1,332.4 billion in 2022 to Ps.3,070.3 billion in 2023. |
Overall fiscal balance. The overall fiscal balance of the Government recorded a deficit of Ps.8,418.5 billion in 2023, compared to a deficit of Ps.3,152.7 billion in 2022.
Fiscal Result of 2024 Compared to Fiscal Results of 2023
Primary fiscal balance. The primary fiscal surplus recorded for 2024 was Ps.10,405.8 billion, compared to a deficit of Ps.5,164.6 billion for 2023. Total revenues increased by 206.9% in 2024, while primary expenditures (excluding interest payments) increased by 134.5%.
D-117
Fiscal revenues. In 2024, fiscal revenues increased by 206.9% to Ps.95,489.6 billion from Ps.31,115.9 billion in 2023. The increase was mainly due to an increase in revenues generated by VAT, income tax, import taxes and social security taxes.
Primary expenditures. In 2024, primary expenditures (excluding interest payments) of the Government increased by 134.5% to Ps.85,083.8 billion in 2024 from Ps.36,280.5 billion in 2023. This increase was mainly due to the following factors:
| | social security outlays, which accounted for approximately 46.8% of the overall increase in expenditures, increased by 176.7%, from Ps.12,914.1 billion in 2023 to Ps.35,733.2 billion in 2024, mainly as a result of increases in pension payments mandated by law; and |
| | other transfers (including external sector transfers, private sector subsidies and transfers to autonomous public entities such as universities), which accounted for approximately 35.4% of the overall increase in expenditures, increased by 141.6%, from Ps.12,211.8 billion in 2023 to Ps.29,508.1 billion in 2024. This increase was mainly due to (i) financial assistance granted to CAMMESA and ENARSA for the execution of energy policies; (ii) an increase in family allowances mainly as a result of a new mobility index; and (iii) additional support for retirees, pensioners and vulnerable groups to mitigate the effects of the worsening of their financial capacity. |
Overall fiscal balance. The overall fiscal balance of the Government recorded a surplus of Ps.1,764.8 billion in 2024, compared to a deficit of Ps.8,418.5 billion in 2023.
Fiscal Result of 2025 Compared to Fiscal Results of 2024
Primary fiscal balance. The primary fiscal surplus recorded for 2025 was Ps.11,769.2 billion, compared to a surplus of Ps.10,405.8 billion for 2024. Total revenues increased by 38.6% in 2025, while primary expenditures (excluding interest payments) increased by 41.7%.
Fiscal revenues. In 2025, fiscal revenues increased by 38.6% to Ps.132,314.3 billion from Ps.95,489.6 billion in 2024. The increase was mainly due to an increase in revenues generated by VAT and social security taxes.
Primary expenditures. In 2025, primary expenditures (excluding interest payments) of the Government increased by 41.7% to Ps.120,545.1 billion in 2025 from Ps.85,083.8 billion in 2024. This increase was mainly due to the following factors:
| | social security outlays, which accounted for approximately 59.1% of the overall increase in expenditures, increased by 58.6%, from Ps.35,733.2 billion in 2024 to Ps.56,673.1 billion in 2025, mainly as a result of an increase in pension payments mandated by law; and |
| | other transfers (including external sector transfers, private sector subsidies and transfers to autonomous public entities such as universities), which accounted for approximately 19.6% of the overall increase in expenditures, increased by 23.6%, from Ps.29,508.1 billion in 2024 to Ps.36,469 billion in 2025. This increase was mainly due to (i) financial assistance granted to AySA and ENARSA for the execution of energy policies; (ii) road works and railway energy; and (iii) transfers to international organizations. |
Overall fiscal balance. The overall fiscal balance of the Government recorded a surplus of Ps.1,453.8 billion in 2025, compared to a surplus of Ps.1,764.8 billion in 2024.
Tax Regime
Overview
In Argentina, the legal authority to impose taxes is shared by Congress, the provincial legislatures and, within certain limits, the municipalities.
Federal taxes must be authorized by an act of Congress, although the executive branch is empowered to issue regulations and decrees necessary to implement congressional legislation. Argentina does not have a federal revenue code; instead, separate laws, which are amended frequently, govern different categories of taxes. The Ministry of Economy is responsible for the collection of federal fiscal revenues. The Ministry of Economy carries out this task mainly through the ARCA.
Data set forth in this section differs from the data presented in “—National Public Accounts” section because this data includes revenues (and transfers) “co-participated” with the provinces. See “—Fiscal Relations with the Provinces.”
D-118
Composition of Tax Revenues
The Government levies the following taxes:
| | VAT on goods and services; |
| | income taxes; |
| | social security taxes; |
| | taxes on foreign trade; |
| | taxes on capital; |
| | taxes on fuel; and |
| | other taxes on goods and services (such as consumption taxes, taxes on financial transactions. |
In 2020, the Government levied a net worth tax that targeted high net worth individuals. See “—Tax Modifications Introduced by the Solidarity Law.”
Traditionally, the Government derived most of its revenue from VAT, social security contributions and income taxes.
Tax revenues for the year ended December 31, 2025 totaled Ps.185,535.2 billion, an increase of 39.2% as compared to 2024. The increase was primarily the result of:
| | increases in VAT and taxes on financial transactions; |
| | increases in social security tax collection, due to an increase in nominal wages of the public and private sectors; |
| | increases in income tax due to greater tax withholding; and |
| | increases in collection of import duties, as a result of an increase in imports and in the nominal exchange rate. |
During 2025:
| | revenues from taxes on financial transactions increased by 48.6%, mainly as a result of a nominal increase in banking transactions; |
| | VAT revenues increased by 42.5%, mainly due to an increase in exchange rate and more imports; |
| | social security taxes increased by 58.0%, mainly due to an increase in taxable wages (in nominal terms) and the increase in the maximum tax base; |
| | income tax revenues increased by 42.2%, mainly due to modifications in the income tax framework (as a tax on high-income taxpayers established during the first semester of 2024 was replaced by the personal income tax, which introduced new deduction thresholds and net profit brackets effective July 2024); |
| | capital tax revenues decreased by 11.8%; |
| | revenues from international trade and transactions decreased by 14.2% compared to 2024; |
| | import duty revenues increased by 75.5%, mainly driven by an increase in the nominal exchange rate; and |
| | export duty revenues increased by 19.3%, mainly due to a rise in nominal exchange rate. |
The year-on-year increase in tax revenues and social security contributions was mainly due to an increase in prices, exchange rates and wages.
D-119
The following tables set forth the composition of the Government’s tax revenues for the periods specified.
Composition of Tax Revenues
(in millions of pesos)
| 2021(3) | 2022(3) | 2023 | 2024 | 2025 | ||||||||||||||||
| VAT |
Ps. | 3,243,608 | Ps. | 5,831,330 | Ps. | 14,791,510 | Ps. | 43,027,692 | Ps. | 61,296,099 | ||||||||||
| Tax on Financial Transactions |
750,414 | 1,343,374 | 3,146,166 | 9,417,135 | 13,995,364 | |||||||||||||||
| Social security taxes(1) |
2,398,126 | 4,331,972 | 9,723,087 | 30,010,575 | 47,422,533 | |||||||||||||||
| Taxes on income |
2,346,646 | 4,715,417 | 8,782,659 | 26,068,568 | 37,063,166 | |||||||||||||||
| Corporate income tax |
1,151,650 | 2,397,764 | 4,204,681 | 15,910,153 | 20,573,307 | |||||||||||||||
| Personal income tax |
999,343 | 2,071,777 | 4,111,605 | 8,464,105 | 12,922,922 | |||||||||||||||
| Other |
195,653 | 245,876 | 466,374 | 1,694,310 | 3,566,937 | |||||||||||||||
| Import and export taxes |
1,450,171 | 2,659,040 | 4,460,819 | 16,339,447 | 14,018,499 | |||||||||||||||
| Taxes on capital |
283,469 | 428,916 | 1,002,323 | 2,356,081 | 2,076,916 | |||||||||||||||
| Taxes on fuel |
356,273 | 431,487 | 526,432 | 2,520,915 | 4,846,146 | |||||||||||||||
| Other taxes on goods and services |
335,975 | 538,469 | 1,258,254 | 3,345,130 | 4,306,124 | |||||||||||||||
| Other |
42,114 | 70,465 | 147,497 | 763,898 | 1,119,038 | |||||||||||||||
|
|
|
|
|
|
|
|
|
|
|
|||||||||||
| Tax regularization |
5,262 | 18,284 | 46,176 | 438,256 | 219,546 | |||||||||||||||
| Other |
36,852 | 52,181 | 101,321 | 325,642 | 899,492 | |||||||||||||||
| Gross tax revenues(2) |
11,207,075 | 20,351,369 | 43,838,748 | 133,849,440 | 186,143,886 | |||||||||||||||
|
|
|
|
|
|
|
|
|
|
|
|||||||||||
| Tax refunds |
(65,950 | ) | (109,970 | ) | (233,950 | ) | (581,000 | ) | (608,700 | ) | ||||||||||
|
|
|
|
|
|
|
|
|
|
|
|||||||||||
| Net tax revenues |
Ps. | 11,141,125 | Ps. | 20,241,399 | Ps. | 43,604,798 | Ps. | 133,268,440 | Ps. | 185,535,186 | ||||||||||
|
|
|
|
|
|
|
|
|
|
|
|||||||||||
| (1) | Include pension contributions resulting from the Argentine Integrated Pension System. |
| (2) | Gross tax revenues include certain tax revenues that are collected in a given year and later refunded, such as VAT and income tax, which are refundable in certain circumstances. These refunds are deducted from gross tax revenues to calculate net tax revenues. |
| (3) | Preliminary data. |
Source: Ministry of Economy.
D-120
Composition of Tax Revenues
(% of total Government fiscal revenues)
| 2021(3) | 2022(3) | 2023 | 2024 | 2025 | ||||||||||||||||
| VAT |
29.1 | % | 28.8 | % | 33.9 | % | 32.3 | % | 33.0 | % | ||||||||||
| Tax on Financial Transaction |
6.7 | 6.6 | 7.2 | 7.1 | 7.5 | |||||||||||||||
| Social security taxes(1) |
21.5 | 21.4 | 22.3 | 22.5 | 25.6 | |||||||||||||||
| Taxes on income |
21.1 | 23.3 | 20.1 | 19.6 | 20.0 | |||||||||||||||
| Corporate income tax |
10.3 | 11.8 | 9.6 | 11.9 | 11.1 | |||||||||||||||
| Personal income tax |
9.0 | 10.2 | 9.4 | 6.4 | 7.0 | |||||||||||||||
| Other |
1.8 | 1.2 | 1.1 | 1.3 | 1.9 | |||||||||||||||
| Import and export taxes |
13.0 | 13.1 | 10.2 | 12.3 | 7.6 | |||||||||||||||
| Taxes on capital |
2.5 | 2.1 | 2.3 | 1.8 | 1.1 | |||||||||||||||
| Taxes on fuel |
3.2 | 2.1 | 1.2 | 1.9 | 2.6 | |||||||||||||||
| Other taxes on goods and services |
3.0 | 2.7 | 2.9 | 2.5 | 2.3 | |||||||||||||||
| Other |
0.4 | 0.3 | 0.3 | 0.6 | 0.6 | |||||||||||||||
|
|
|
|
|
|
|
|
|
|
|
|||||||||||
| Tax regularization |
— | 0.1 | 0.1 | 0.3 | 0.1 | |||||||||||||||
| Other |
0.3 | 0.3 | 0.2 | 0.2 | 0.5 | |||||||||||||||
| Gross tax revenues(2) |
100.6 | 100.5 | 100.5 | 100.4 | 100.3 | |||||||||||||||
| Tax refunds |
(0.6 | ) | (0.5 | ) | (0.5 | ) | (0.4 | ) | (0.3 | ) | ||||||||||
|
|
|
|
|
|
|
|
|
|
|
|||||||||||
| Net tax revenues |
100.0 | % | 100.0 | % | 100.0 | % | 100.0 | % | 100.0 | % | ||||||||||
|
|
|
|
|
|
|
|
|
|
|
|||||||||||
| (1) | Include pension contributions resulting from the Argentine Integrated Pension System. |
| (2) | Gross tax revenues include certain tax revenues that are collected in a given year and later refunded, such as VAT and income tax, which are refundable in certain circumstances. These refunds are deducted from gross tax revenues to calculate net tax revenues. |
| (3) | Preliminary data. |
Source: Ministry of Economy.
Tax Relief Measures under the Milei Administration
As part of the Milei administration’s efforts to reduce tax pressure on individuals and business, the following main measures were adopted by the Government in 2025:
| | On January 30, 2025, the Government suspended the 20% tax applicable on purchases of automobiles, motorcycles, bicycles and recreational boats from February 1, 2025 to June 30, 2026. |
| | On March 31, 2025, the Government reduced tariffs on footwear (from 35% to 20%), fabrics (from 26% to 18%) and yarn (from 18% to 16%). |
| | On May 7, 2025, the Government eliminated the export rights, which ranked between 3% and 4.5%, for 88% manufactured products, including agroparts, casting products, machinery and equipment, optics, glass, automobile parts, farmacy products, among others. The measure’s objective was to boost local industrial competitivity and exports, benefitting approximately 40% of exporting companies. |
| | On May 13, 2025, the Government announced a two-stage elimination of import tariffs on cell phones: (i) starting on May 13, 2025, the tariffs were lowered from 16% to 8%, and (ii) starting on January 15, 2026, the tariffs are scheduled to be reduced to 0%. |
| | In addition, internal taxes on imports of cell phones, televisions and air conditioners were reduced from 19% to 9.5%, and taxes on items produced in the province of Tierra del Fuego were reduced from 9.5% to 0%. Further, tariffs on imports of video game consoles were reduced from 35% to 20%. |
| | On May 22, 2025, the Government announced specific measures to ease restrictions on the use of savings by individuals and businesses, including a reduction in compensatory and penalty rates on taxes and customs obligations. |
D-121
| | In addition, on May 22, 2025, the Government launched the Plan de Reparación Histórica de los Ahorros de los Argentinos (Historic Repair Plan for Argentine Savings), allowing individuals to spend up to Ps.50 million per month on non-registerable goods without having to notify ARCA. Moreover, the plan is expected to simplify the income tax system and update the mechanics to calculate an individual’s income tax. |
| | On June 27, 2025, the Government extended the term of the reduction on exports of wheat, barley and their derivatives until March 31, 2026. Additionally, it expanded the term to settle foreign currency transactions from 15 to 30 business days. |
| | On July 29, 2025, the Ministry of Economy announced a reduction in tariffs on capital goods imports from 35% to 12.6%, resulting in lower costs for purchasing machinery and equipment. Further, the Government announced a permanent reduction in withholding taxes on agricultural products, including (i) poultry and beef (from 6.75% to 5%), (ii) corn (from 12% to 9.5%), (iii) sorghum (from 12% to 9.5%), (iv) sunflower (from 7.5% and 5% to 5.5% and 4%), (v) soybeans (from 33% to 26%) and (vi) soybean by-products (from 31% to 24.5%). The measure resulted in a permanent reduction in net withholdings of 20% for the grain chain and a 26% reduction for the livestock and meat chain. |
| | On September 22, 2025, the Government issued Decree No. 682/2025 setting the export duty rate for grains and meats (including wheat, barley, corn, sorghum, sunflower, flours, soybean oil, live and processed farm animals and their by-products) at 0% for those exporters who settled at least 90% of the foreign currency proceeds within three business days following the submission of the corresponding Export Affidavit (“DJVE”). The measure was expected to remain in effect until October 31, 2025, or until DJVEs were registered for an aggregate amount equivalent to U.S.$7.0 billion, whichever occurred first. The measure concluded in September 24, 2025, when the U.S.$7.0 billion threshold was reached. |
| | In November 2025, the Government entered into an agreement with the oil-producing provinces of Neuquén, Chubut and Santa Cruz to progressively eliminate export duties on conventional oil (which ranged between 0% and 8%) with the objective of promoting new investments in mature oil basins and consolidating growth under clear rules. As a first step in the implementation of this agreement, on November 14, 2025, the Government issued Decree No. 811/2025, eliminating export duties on oils and lubricants (with or without additives), hydraulic transmission and brake fluids, and electrical insulation oils. |
| | On December 12, 2025, the Government announced permanent reductions to export duties applicable to grains and grain by-products, including (i) soybeans (from 26% to 24%), (ii) soybean by-products (from 24.5% to 22.5%), (iii) wheat and barley (from 9.5% to 7.5%), (iv) corn and sorghum (from 9.5% to 8.5%), and (v) sunflower (from 5.5% to 4.5%). The decrease in soybean export duties represents the lowest rate imposed in 19 years and is aimed at improving the competitiveness of the agro-industrial sector, which accounts for approximately 60% of the Republic’s total exports. The export duty reductions are part of the Government’s fiscal relief program and commitment to the permanent elimination of export duties, implemented in a manner consistent with maintaining fiscal equilibrium. Since taking office, the Milei administration has reduced the overall tax burden by approximately 2.0% of GDP, mainly due to the elimination of an extraordinary net worth tax by the end of December 2024, accounting for approximately 50% of the decrease. The modification of the personal property regime and the temporary reduction of export duties also contributed to this reduction. |
The information below is a brief description of the principal taxes levied by the Government as of December 2025 except for social security taxes. For a description of social security taxes see “—Social Security.”
Value Added Tax
VAT is levied on sales of goods and services within Argentina, and the rendering of services abroad when the effective use of those services takes place in Argentina and the provider of the service is registered as a VAT taxable person. VAT is also applied on imports of consumer products and on digital services with effective use in the Republic.
As of December 31, 2025, the general VAT rate was 21.0%. An increased rate of 27.0% applies to the provision of gas, electricity, water, sewage and telecommunications services for non-residential purposes. A reduced rate of 10.5% applies in certain cases, including housing projects, the sale of livestock and other agricultural products, the sale of capital goods and certain financial revenues and expenses.
Between September 18, 2023 and December 31, 2023, the Government implemented the Compre Sin IVA (Buy Without VAT) program, which provided for the refund of 21% of the VAT on purchases of products belonging to the essential food basket in an amount of up to Ps.18,800 per month per person. The program was aimed at alleviating the tax burden on consumers of essential products, contributing to the improvement of their purchasing power and facilitating the access to basic goods. The program was available for retirees, beneficiaries of the Universal Child Allowance, single taxpayers, employees with an income of up to six minimum salaries, and domestic workers within the Régimen del Personal de Casas Particulares (Private Household Personnel Regime).
D-122
In 2024, VAT collection increased 115.2% when compared to 2023, mainly due to an increase in foreign exchange rates, customs, imports and deferred collections due to the implementation of measures aimed at controlling inflation.
In 2025, VAT collection increased 42.5% when compared to 2024, mainly due to higher exchange rates and an increase in imports.
The Government also levies certain taxes on the consumption of certain goods and services. The following table sets forth a sample of the tax rates applicable to certain products.
Composition of Taxes on Goods and Services
| Product |
Rate (%) |
|||
| Goods |
||||
| Tobacco products |
25-73 | |||
| Alcoholic beverages |
8–26 | |||
| Non-alcoholic beverages (including extracts, concentrates and mineral water) |
4–10 | |||
| Luxury items |
20 | |||
| Recreational sporting equipment (including private planes and yachts) |
0–20 | |||
| Electronic products |
19 | |||
| Cars, engines and motorcycles |
0–18 | |||
| Services |
||||
| Insurances |
0.1–23 | |||
| Satellite and Cell phones (mobile phones) |
5 | |||
Source: Ministry of Economy.
Taxes on Financial Transactions
The tax on financial transactions was introduced in 2001 as an exceptional measure and has become an important source of revenue for the Government. The tax is levied on the full amount of most financial transactions, with certain limited exemptions. The standard tax rate is 0.6% for credits and debits from checking accounts, 1.2% for transfers of funds and other cash transfers, and between 0.25% and 0.5% for credits and debits for certain operations and companies. The tax on financial transactions was originally scheduled to expire in December 2002, but Congress extended the expiration date on several consecutive occasions and it is still effective as of the date of this Annual Report.
Taxes on Income, Utilities and Capital Gains
Argentine residents and corporations domiciled in Argentina are subject to income tax on their worldwide income. Nonresidents are subject to income tax on Argentine sourced income.
Tax payers are divided in three categories based on income and jurisdiction:
| a) | individuals and undivided estates that are residents in the Republic; |
| b) | domestic corporations and permanent establishments located within the Republic; and |
| c) | foreign beneficiaries, which include individuals, undivided estates, legal entities in general and sole proprietorships not included in the preceding items a) and b) above. |
D-123
The following are exempted from taxes on income, utilities and capital gains (as applicable): (i) national, provincial or local authorities, (ii) non-profit organizations (including cooperatives, religious institutions and foundations), (iii) wages of foreign diplomats, (iv) author’s rights over their work product (up to Ps.10,000), (v) interests on savings accounts, as long as there are no transfers to foreign fiscal entities; (vi) yield and sales of Argentine public bonds, (vii) negotiable obligations, among others. The Government has exempted or created special incentives (in the form of tax breaks) for projects carried out in certain locations, such as the province of Tierra del Fuego, and for certain economic activities, such as public transportation and garbage collection.
There are two main categories of taxes on income in Argentina:
| | Impuesto a las ganancias (income tax) |
| | Individuals that are Argentine residents for income tax purposes are taxed on their worldwide income at progressive rate according to a scale that ranges from 5% to 35%. |
| | Individuals that are Argentine residents whose net income includes foreign sources arising from the sale of shares, certificates of deposit of shares, quotas and social participations (including shares of mutual funds and certificates of participation of trusts and any other right over trusts and similar contracts), digital currencies, bonds and other securities, as well as from the sale of real estate or transfer of rights over real estate, are taxed on those assets at a rate of 15%. |
| | Individuals and undivided estates are taxed on (i) dividends and remittances at a tax rate of 7%, (ii) gains realized on real estate sales involving property acquired on or after January 1, 2018 at a rate of 15%, and (iii) net gains derived from trade of securities and digital currencies at a tax rate that ranges from 5% to 15%. |
| | Non-resident individuals and entities are taxed on Argentine-sourced income (including income that is presumed to be Argentine sourced) at a rate of 35%. |
| | Corporations and other business entities are taxed on their worldwide net income at progressive rate according to the following scale: |
| Accumulated taxable net income |
||||||||||||
| From |
To | Fixed amount payable | Additional percentage per step of the scale (1) |
|||||||||
| Ps. 0 |
Ps. | 101,679,575.26 | Ps. | 0 | 25 | % | ||||||
| Ps.101,679,575.26 |
1,016,795,752.62 | 25,419,893.82 | 30 | |||||||||
| Ps. 1,016,795,752.62 |
Onwards | Ps. | 299,954,747.02 | 35 | % | |||||||
| (1) | The additional percentage per step of the scale applies to the differential between the income earned by a corporation and the floor of the applicable step. For example, a corporation earning Ps.150,000,000 is required to pay income tax in an amount equal to Ps.25,419,893.82, plus 30% of Ps.48,320,424.74 (i.e., the difference between Ps.150,000,000 and 101,679,575.26). |
| | Branches of a foreign companies are also subject to an additional tax at a rate of 7% at the time of remittance of profits to their parent company. |
For changes in income tax introduced in December 2019, see “—Tax Modifications Introduced by the Solidarity Law.”
| | Emergency tax on lotteries and gaming proceeds. The rate of this tax is 31% and it is levied on 90% of the net amount of gains from lotteries and games. |
On September 12, 2023, the Government issued Decree No. 473/2023, which provided that, for the second semester of 2023, individuals earning a monthly salary below the equivalent of 15 minimum wages would not be subject to income tax. In July 2024, ARCA further regulated the amendments introduced by the Law No. 27,743, Ley de Medidas Fiscales Paliativas y Relevantes (Law of Palliative and Relevant Fiscal Measures) by (i) making such law applicable to all employees starting on August 1, 2024 and (ii) providing for a semi-annual adjustment on the tax application scale pursuant to CPI variation.
D-124
During 2025, ARCA issued new resolutions concerning income tax, which excluded the following from income tax withholding:
| | purchases of foreign currency, including traveler’s checks, made by Argentine residents for the payment of certain imports included in the tariff positions of the MERCOSUR common nomenclature (RG ARCA No. 5672/2025); |
| | purchases of foreign currency, including traveler’s checks, made by Argentine residents for savings purposes or without a pre-existing payment obligation (RG ARCA No. 5672/2025); |
| | purchases of foreign currency by financial institutions on behalf of third parties for the payment of foreign services through virtual platforms (RG ARCA No. 5677/2025); and |
| | compensation received by public or private healthcare workers for work performed during critical hours or on-call duty, for a period of one year commencing October 22, 2025 (Law No. 27,796). |
In October 2025, the Government issued Decree No. 767/2025, which introduced modifications to the income tax regulations, including changes to taxpayer information requirements, the definition of taxable subjects and specific information requirements applicable to exporters.
Taxes on Foreign Trade
Taxes on foreign trade consist of export and import duties.
Import duties are levied on goods and services imported into Argentina for consumption. They are assessed either ad valorem (i.e., on the actual value of the good or service) or per unit (expressed as a fixed amount per unit), or a combination of both.
The following import duties and their respective rates apply:
| | Intra-zone Import Duties: a 0% import duty rate is levied on imports of consumption goods coming from and originating in Mercosur member countries, except for sugar and related products, which are subject to an 18% to 20% import duty. |
| | Common External Tariff: an import duty rate ranging from 0% to 35% is levied on imports of consumer goods originated in non-Mercosur countries but imported into Argentina from another Mercosur member country. |
| | Extra-Zone Import Duties: the import duty rate levied on consumer goods originating in and coming from non-Mercosur countries is the applicable rate set forth in the Common External Tariff, except for certain products included in exempted lists provided by each of the Mercosur members. |
Export duties became an important source of revenue for the Government beginning in 2003, primarily as a result of the high international prices for commodities and the depreciation of the peso, which during the initial years following the devaluation in 2002 increased the competitiveness and value of Argentina’s U.S. dollar exports in pesos. Domestic inflation and the real appreciation of the peso over time eroded the competitiveness of Argentine exports. In 2021, the Government announced a series of measures aimed at adjusting export duties to boost exports of goods and services, including (i) the elimination of export duties for incremental exports by MSMEs, (ii) a reduction in export duties on vehicles and automobile parts, (iii) a reduction in export duties for regional products such as fruit juices, peanuts, oats, flax, rye, sunflower and wool products, and (iv) the reduction in export duties on gold and mineral fuels from 12% to 8%.
On September 5, 2022, the Government created the Programa de Incremento Exportador (Export Growth Program) for those that exported soybean goods during the 18 months prior to November 28, 2022, granting them an exchange rate of Ps.230 per U.S. dollar. On December 13, 2023, the Government expanded the Export Growth Program, mandating that 80% of export revenues must either be repatriated in foreign currency or traded through the MULC. The remaining 20% must be handled through the trading of negotiable securities, acquired in foreign currency and sold in local currency. This measure aims to optimize the inflow of foreign currency into the country while regulating its flow within the local market.
Export duties tax the export of consumer goods. Services rendered in the country, whose use or effective exploitation is carried out abroad, are also considered goods subject to export taxes.
In May 2024, the Government extended the suspension of export duties on dairy products for an additional year and, in August 2024, export duties on dairy, cow and pork products (except for living cattle) were eliminated.
D-125
Set forth below are certain export duty rates in effect as of December 31, 2025.
| | exports of crude oil and fuels: |
| | if the international price per barrel of crude oil and fuel is less than or equal to U.S.$45.0, the applicable export duty is 0%; |
| | if the international price per barrel of crude oil and fuel is higher than or equal to U.S.$60.0, the applicable export duty is 8%; and |
| | if the international price per barrel of crude oil and fuel is higher than U.S.$45.0 and lower than U.S.$60.0, the export duty is calculated according to the following formula: |
Where D is export duty, PI is international price, VB is the base value (equal to U.S.$45.0) and VR is the reference value (equal to U.S.$60.0).
| | reduction to 0% of export duties on products from regional economies, including food products, cereals, milling products, industrial and medicinal plants, straw and fodder, and fats and oils of animal origin, effective January 27, 2025; |
| | successive reductions in export duties on agro-industrial products throughout 2025, including (i) soybeans (from 33% to 26%, and subsequently to 24%) and soybean by-products (from 31% to 24.5%, and subsequently to 22.5%), (ii) corn and sorghum (temporary reduction from 7% to 5.5%, with a final rate of 8.5%), (iii) wheat (from 7% to 5.5%, then to 12%, with a final rate of 7.5%), (iv) barley (temporary reduction from 7% to 5.5%, then to 0%, then to 9.5%, with a final rate of 7.5%), (v) sunflower (temporary reduction from 7% to 5.5%, with a final rate of 4.5%), and (vi) biodiesel (temporary reduction from 29% to 23%, then to 0%, with a final rate of 21%); |
| | reduction of export duties on industrial products manufactured with basic inputs from agricultural, mining and petrochemical activities, from a range of 3% to 9% to 0%, effective May 8, 2025. In addition, export duties on non-metallic mining products (including precious and semi-precious stones, plaster and clay) were reduced from a range of 3% to 12% to 0%, effective August 8, 2025; |
| | reduction to 0% of export duties on certain oils and lubricants, cables, ammunition, arms, rubber, tires and synthetic fibers, effective November 18, 2025; and |
| | temporary reduction of export duties on meat products, live cattle and processed meat from a range of 2.25% to 6.5% to 0%, effective from September 24, 2025 to October 31, 2025. |
Import and export duty revenues decreased by 14.2%, from Ps.16,339 billion in 2024 to Ps.14,018 billion in 2025, mainly due to the termination of the Impuesto PAIS in December 2024.
Export duty revenues increased by 19.3% in 2025 as compared to 2024, mainly due to an increase in the nominal exchange rate.
Import duty revenues increased by 75.5% in 2025 as compared to 2024, mainly due to an increase in the nominal exchange rate and import volumes. Throughout 2025, a number of decrees established exemptions and reductions of import duties on certain products subject to Extra-Zone Import Duties, including:
| | a reduction of import duties from 35% to 0%, effective from January 31, 2025 to January 31, 2030, on motor vehicles (up to 50,000 units) utilizing alternative propulsion technologies other than internal combustion, with a price below U.S.$16,000; |
| | a reduction of import duties on footwear (from 35%, 18% and 10% to 20%, 16% and 0%, respectively), fabrics (from 26% to 18%), and yarn (from 18% to 16%, 14% and 12%, respectively), effective March 31, 2025; |
D-126
| | a reduction of import duties on smartphones and cell phones (excluding satellite phones) from 16% to 8%, effective from May 21, 2025 to January 14, 2026, and from 8% to 0%, effective January 15, 2026; |
| | the removal of certain video game consoles and arcade machines from the list of products subject to transitory tariff increases; |
| | a reduction of import duties from 35% and 20% to 12.6% on certain machinery and industrial equipment; and |
| | a reduction of import duties from 35% to 20% on certain toys, effective November 1, 2025. |
Taxes on Net Worth
Taxes on net worth include taxes on the value of personal assets owned by individuals and taxes on the net worth of credit unions. In the aggregate, taxes on capital accounted for 2.3%, 1.8% and 1.1% of the Government’s overall tax revenues in 2023, 2024 and 2025, respectively.
Non-residents and foreign undivided estates are taxed on assets located in Argentina at a rate of 0.5%. Argentine residents are taxed at progressive rates ranging between 0.5% and 1.0%. See “—Tax Modifications Introduced by the Solidarity Law—Taxes on Capital.”
Taxes on Fuels
The Government levies taxes on the sale of various fuels, including liquid fuels, such as gasoline and diesel, and compressed natural gas. Through 2025, the tax on the sale of liquid fuels was generally levied on importers, refineries and distributors. Taxes on the sale of fuels are assessed per unit (expressed as a fixed amount per liter of liquid fuels, updated quarterly and published by ARCA on its website based on the National CPI variations published by INDEC).
Taxes on Mobile Phones
Since 2010, the Government has collected a tax on mobile phones, which is recorded as “other taxes.” This tax is equal to 1% of customer payments to cell phone companies (net of VAT). In December 2017, the Government enacted legislation increasing the tax on mobile phones to 5% of customer payments to cell phone companies (net of VAT).
Tax Enforcement
Recent initiatives introduced by the Government to improve tax collections include the following:
Double taxation and tax cooperation agreements
Argentina has signed cooperation agreements with numerous countries (including Brazil (2017), Canada (1994), China (2024) and Turkey (2024)) to promote international cooperation in tax matters through the exchange of information and increase the transparency of cross-border commercial transactions. These agreements provide for the sharing of tax information in documentary form and, in certain circumstances, allow representatives of a country’s competent authority to conduct interviews and examine records in the territory of a counterparty. In other cases, these agreements provide for mutual assistance in customs procedures.
Argentina is also a party to the 1988 Convention on Mutual Administrative Assistance in Tax Matters and to the 2014 Multilateral Competent Authority Agreement promoted by the OECD. In 2018, Argentina entered into a memorandum of understanding with the OECD establishing the OECD Latin America Academy for Tax and Financial Crime Investigation, which intends to promote a global approach to the treatment of tax evasion to tackle tax and financial crimes.
During 2022, the AFIP entered into two memorandums of understanding to authorize the Republic’s participation in the International Compliance Assurance Program (“ICAP”), with the objective of improving cooperation and transparency between multinational entities and the tax administrations of the jurisdictions where their members operate.
On December 5, 2022, the Government signed an agreement with the Government of the United States aimed at improving international tax compliance through mutual assistance in tax matters based on an effective infrastructure for the automatic and reciprocal exchange of information, and on the implementation of the Foreign Account Tax Compliance (FATCA) provisions.
D-127
On May 5, 2025, Argentina adopted the OECD’s BEPS Multilateral Instrument through Law No. 27,788, which offers concrete solutions for governments to close loopholes in international tax treaties and allows them to implement agreed minimum standards to counter treaty abuse and to improve dispute resolution mechanisms.
Tax Modifications Introduced by the Solidarity Law
On December 27, 2017, the Argentine Congress approved a tax reform (the “2017 Tax Reform”), which was intended to eliminate certain loopholes and inefficiencies of the Argentine tax regime, diminish evasion, increase the coverage of income tax as applied to individuals and encourage investment while sustaining Argentina’s medium and long term efforts aimed at restoring fiscal balance.
The lack of economic growth, however, since the changes introduced by the 2017 Tax Reform, resulted in the Republic’s tax revenues falling as a percentage of GDP. In December 2019, the Argentine Congress enacted the Solidarity Law, to improve the fiscal balance in the short term through a series of tax and non-tax measures.
The main amendments to the Argentine tax system introduced by the Solidarity Law are:
Employers’ Contributions to the Social Security System
The Solidarity Law froze the reduction of the average effective rate paid by employers established for the year 2020 under the 2017 Tax Reform and further increases in the non-taxable amount, but provided that companies with less than 25 registered workers may deduct an additional amount of $10,000. In addition, to encourage companies to increase salaries, the Solidarity Law authorized the Government to grant temporary exemptions from the payment of fees and social security contributions on salary increases.
Adjustments for Inflation
The 2017 Tax Reform, as modified in 2018, contemplated a transitional regime regarding the determination of income where such determination results from restatement of financial statements to take account of the effect of inflation.
To further mitigate the fiscal impact that the comprehensive inflation adjustment would have in 2020, the Solidarity Law extended the transitional regime by 72 months.
Taxes on Capital
The Solidarity Law reverted to the rates of 2015, although it maintained the non-taxable bases (which give greater progressiveness to the tax) and entitled the Government to increase by up to 100% the rate applicable to assets held outside of Argentina, subject to certain exceptions resulting from the repatriation of a portion of those assets.
In addition, the Solidarity Law exempted interests derived from certain peso-denominated deposits and financial assets.
Tax for an Inclusive and Solidary Argentina
The Solidarity Law introduced an extraordinary tax levied on the purchase or exchange of foreign currency for savings, offshore payments related to the acquisition of goods and services and other payments linked to outbound tourism and the consumption of goods and services provided in Argentina by non-residents, except for the acquisition of medicines, health-related benefits, books, the use of educational platforms and expenses associated with research projects (the “Impuesto PAIS”). The Impuesto PAIS rate was set at 30% of the amount of each transaction, except for the price paid on digital services, which are levied at an 8% tax rate. 70% of the revenues from the Impuesto PAIS are earmarked for the financing of ANSES programs and the remaining 30% to fund economic infrastructure and social housing. In 2020 and 2021, tax collections associated to the Impuesto PAIS amounted to Ps.135.0 billion and Ps.111.4 billion, respectively.
Tax on Bank Debits and Credits and Other Financial Transactions
In order to minimize the use of cash and encourage the formal economy and financial inclusion, the Solidarity Law provided that when cash withdrawals are made, the amount of the bank debit shall be subject to double the applicable rate in force. Individuals and SMEs are not covered by this regulation.
D-128
Internal Taxes
Internal taxes cover tobacco, alcoholic beverages, telephone services, luxury goods, automobiles, motorcycles, pleasure boats and airplanes, among others. These taxes were modified with the Solidarity Law to protect domestic production and tax consumption of luxury products. In particular, to increase the progressiveness of internal taxes, the prior 20% single rate system for land motor vehicles, motorcycles, vessels and aircraft was replaced by a system of scales by sales price that will be adjusted quarterly to reflect the evolution of the Internal Wholesale Price Index. In the case of automobiles and motorcycles, scales depend on the value of the automobile or motorcycle.
Corporate Income Tax
The Solidarity Law suspended the reduction of the corporate income tax rate for 2020 established by the 2017 Tax Reform, which was set at 30%.
Income Tax
Workers whose salary did not exceed Ps.3,503,688 per year (equivalent to Ps.237,772 per month, including a 13th salary as an annual bonus) by the end of 2024, were exempt from income tax payments. The maximum amount is adjusted semi-annually by reference to changes in the IPC corresponding to the immediately preceding semester. See “Recent Developments—Public Sector Finances—Tax Regime—Taxes on Income, Utilities and Capital Gains.”
Income Tax Exemptions on Certain Financial Assets
The Solidarity Law suspended the taxes applicable to capital companies and dividends paid and profit remittances made by permanent establishments for the fiscal year ended December 31, 2020. Moreover, it increased rates for corporations and permanent establishments to 30%, and reduced rates for distribution of dividends to individuals and undivided estates to 7%.
Moratorium for SMEs
The Solidarity Law empowered the Government to establish a moratorium aimed at allowing SMEs and non-for-profit organizations to comply with their tax obligations.
Asset Regularization Regime
In July 2024, Congress enacted Law No. 27,743 establishing a tax amnesty law, the Régimen de Regularización de Activos (Asset Regularization Regime), which allows taxpayers to declare assets owned as of December 31, 2023, in order to normalize their tax situation and avoid future penalties. The regime permits a tax-free declaration of assets up to U.S.$100,000, with a 5% penalty applied to amounts exceeding that threshold, increasing to 10% for assets declared between September 30, 2024, and December 31, 2024. Additionally, the regime provides a tax exemption for amounts over U.S.$100,000 that are invested in a range of local government and corporate bonds, stocks, and new real estate projects, aimed at stimulating the construction sector.
On June 27, 2024, the Government (i) increased the minimum taxable amount for a tax payer’s real state destined to inhabitance to Ps.350 million, (ii) increased the minimum taxable base for the personal assets tax to Ps.100 million, and (iii) provided a special rate for tax payments made five years in advance.
In September 2024, the Government extended the deadline for declaring participation in the Asset Regularization Regime and making the mandatory advance payment to October 31, 2024, to ease administrative tasks for banks, tax advisors, and taxpayers. As of October 1, 2024, individuals who withdraw funds, either partially or fully, from assets regularized by September 30, will be ineligible to regularize additional amounts. Additionally, funds regularized during the extension must remain in special accounts or be allocated to authorized investments until October 31, 2024. From November 1, 2024, individuals may withdraw up to U.S. $100,000 without withholding, but amounts exceeding that amount must remain invested in authorized destinations until December 31, 2025, to avoid a 5% withholding.
On November 11, 2024, private sector deposits in foreign currency increased to U.S.$20.6 billion, compared to U.S.$7.7 billion during the previous tax amnesty law issued in 2016. This increase was mainly a result of the expiration of the first phase of the Asset Regularization Regime.
D-129
In October 2024, President Milei announced the dissolution of the AFIP, the current tax collection authority, and its replacement with the newly created ARCA, which will retain AFIP’s dual responsibilities of overseeing tax collection and customs monitoring. This measure aims to further reduce the size of the State by eliminating inefficiencies.
On May 7, 2025 and June 6, 2025, the second and third phases of the Asset Regularization Regime concluded. Following the closure of the third phase, total private sector foreign currency deposits increased to U.S.$24.5 billion, compared to U.S.$20.7 billion following the first phase. Total declared assets increased to U.S.$11.0 billion from U.S.$10.5 billion, foreign accounts declared abroad increased to U.S.$1.6 billion from U.S.$1.5 billion in March 2025 and declared properties inside and outside Argentina increased to U.S.$2.6 billion from U.S.$2.4 billion.
Composition of Public Expenditures
Public sector expenditures include general administrative expenses, debt service payments, investments in public infrastructure and services, expenditures related to defense and security, administrative expenses of the judiciary and social program expenditures.
The following table sets forth the National Administration’s expenditures for the periods specified, calculated using an accrual method, which records revenues and expenditures in the period in which they are accrued, regardless of the period in which payments are received or made. This method differs from the cash-basis used to calculate national public accounts. See “—Introduction.”
Composition of National Administration’s Expenditures (1)
(% of Nominal GDP)
| 2021 | 2022 | 2023 | 2024 | 2025 | ||||||||||||||||
| General administration |
0.8 | % | 0.7 | % | 0.8 | % | 0.4 | % | 0.5 | % | ||||||||||
| Defense and security |
0.9 | 0.9 | 0.9 | 0.8 | 0.7 | |||||||||||||||
| Justice |
0.4 | 0.4 | 0.4 | 0.3 | 0.3 | |||||||||||||||
| Social programs |
15.2 | 13.8 | 12.8 | 10.5 | 10.6 | |||||||||||||||
| Social security(2) |
9.7 | 9.5 | 8.7 | 7.9 | 8.4 | |||||||||||||||
| Culture, education, science and technology |
1.5 | 1.6 | 1.7 | 1.1 | 0.9 | |||||||||||||||
| Health |
1.3 | 0.8 | 0.7 | 0.7 | 0.8 | |||||||||||||||
| Housing |
1.2 | 0.5 | 0.4 | 0.1 | 0.0 | |||||||||||||||
| Social welfare |
1.2 | 1.3 | 1.3 | 0.5 | 0.3 | |||||||||||||||
| Labor |
0.2 | 0.1 | 0.1 | 0.1 | 0.1 | |||||||||||||||
| Public expenditures on economic infrastructure and services |
4.3 | 3.5 | 2.9 | 1.8 | 1.1 | |||||||||||||||
| Public debt service(3) |
1.7 | 1.9 | 1.8 | 1.6 | 1.2 | |||||||||||||||
|
|
|
|
|
|
|
|
|
|
|
|||||||||||
| Total |
23.3 | % | 21.2 | % | 19.6 | % | 15.3 | % | 14.5 | % | ||||||||||
|
|
|
|
|
|
|
|
|
|
|
|||||||||||
| (1) | The accrued amounts contained in this table do not include amounts budgeted for entities that form part of Argentina’s national non-financial public sector but are not part of the National Administration, such as state-owned enterprises and fiduciary funds. Data also exclude interest accrued on Untendered Debt, substantially all of which has been settled since April, 2016. Untendered Debt has been defined to include only unpaid principal plus accrued and unpaid interest at contractual rates through its originally scheduled maturity, excluding penalty or default interest. The Republic has not offered to pay time-barred claims on principal or interest. See “Public Sector Debt—Legal Proceedings.” |
| (2) | Amounts presented under “Social security” in this table differ from the data presented in the table “National Public Accounts” because they were calculated using different methodologies. |
| (3) | Based on performing debt. |
Source: Ministry of Economy.
D-130
Composition of National Public Expenditures (1)
(% of total Government expenditures)
| 2021 | 2022 | 2023 | 2024 | 2025 | ||||||||||||||||
| General administration |
3.6 | % | 3.5 | % | 4.2 | % | 2.5 | % | 3.1 | % | ||||||||||
| Defense and security |
3.8 | 4.1 | 4.5 | 4.9 | 4.9 | |||||||||||||||
| Justice |
1.7 | 1.9 | 2.0 | 2.3 | 2.3 | |||||||||||||||
| Social programs |
65.2 | 65.1 | 65.3 | 68.3 | 73.5 | |||||||||||||||
| Social security(2) |
41.9 | 44.9 | 44.2 | 51.8 | 57.9 | |||||||||||||||
| Culture, education, science and technology |
6.5 | 7.4 | 8.8 | 6.9 | 6.5 | |||||||||||||||
| Health |
5.6 | 4.0 | 3.6 | 4.9 | 5.6 | |||||||||||||||
| Housing |
5.0 | 2.4 | 2.0 | 0.6 | 0.1 | |||||||||||||||
| Social welfare |
5.2 | 6.0 | 6.5 | 2.8 | 2.4 | |||||||||||||||
| Labor |
1.0 | 0.3 | 0.3 | 0.9 | 0.9 | |||||||||||||||
| Public expenditures on economic infrastructure and services |
18.6 | 16.3 | 14.9 | 11.5 | 7.8 | |||||||||||||||
| Public debt service(3) |
7.2 | 9.1 | 9.1 | 10.5 | 8.4 | |||||||||||||||
|
|
|
|
|
|
|
|
|
|
|
|||||||||||
| Total |
100.0 | % | 100.0 | % | 100.0 | % | 100.0 | % | 100.0 | % | ||||||||||
|
|
|
|
|
|
|
|
|
|
|
|||||||||||
| (1) | The accrued amounts contained in this table do not include amounts budgeted for entities that form part of Argentina’s national non-financial public sector, but are not part of the National Administration, such as state-owned enterprises and fiduciary funds. Data also exclude interest accrued on Untendered Debt, substantially all of which has been settled since April, 2016. Untendered Debt has been defined to include only unpaid principal plus accrued and unpaid interest at contractual rates through its originally scheduled maturity, excluding penalty or default interest. The Republic has not offered to pay time-barred claims on principal or interest. See “Public Sector Debt—Legal Proceedings.” |
| (2) | Amounts presented under “Social security” in this table differ from the data presented in the table titled “National Public Accounts” because they were calculated using different methodologies. |
| (3) | Based on performing debt. |
Source: Ministry of Economy.
Expenditures on Social Programs
The Government devotes a substantial portion of its revenues to social programs. From 2021 to 2025, social programs expenditures accounted on average for 67.5% of annual National Administration expenditures, of which social security payments alone accounted on average for 48.1%. These social programs include the social security system, cultural goods and services, education, science and technology programs, the health-care system, low-income housing programs, social welfare programs and labor subsidies.
In particular, in 2025, social security expenditures increased by 58.2% compared to 2024, mainly as a result of (i) the social security system’s transfers to pensioners to comply with legal minimum adjustments required to offset inflation and (ii) the increase in the number of beneficiaries due to a moratorium of social security debts announced by the Government.
On February 28, 2024, the Government transformed the Plan Potenciar Trabajo (Plan to Boost Employment) in two separate programs: (i) the Acompañamiento Social (Social Support) for people over 50 years old and mothers of four or more children under 18 years old and (ii) Volver al Trabajo (Return to Employment) to improve the employability of informal workers through training activities, on-the-job training and support for entrepreneurship.
In May 2024, the Government increased the benefits under the Plan Nacional de la Argentina Contra el Hambre (Argentina’s National Plan against Hunger) by 8.6%.
In November 2025, the Government established the Centro de Formación de Capital Humano (Human Capital Formation Center) to develop innovative labor offerings, strengthen human capital in strategic productive sectors, and promote the formal employment of young and adult workers in coordination with companies, business chambers and public organizations. In addition, the Government launched the Programa de Crédito Fiscal (Fiscal Credit Program), which enables companies (including SMEs) and cooperatives to increase their productivity by submitting proposals for workforce training programs for their employees and unemployed individuals. Companies with approved proposals that submit evidence of implementation results are eligible to receive a fiscal credit to offset tax liabilities, calculated as a percentage of the payroll, up to a maximum of Ps.6 million.
D-131
Public Infrastructure and Services
The main projects in public infrastructure include the following:
| | construction of railroads and roads; |
| | construction and improvements to power lines to transport electricity; |
| | extension of gas transportation systems for thermoelectric plants; |
| | construction of water pipelines and drainage; and |
| | construction of gas pipelines. |
For more information see “—Infrastructure Development.”
Public Debt Service
The Government has only recorded interest paid on performing debt. The data discussed below does not include interest accrued on Untendered Debt, a portion of which was settled in April 2016 and in subsequent transactions thereafter. Untendered Debt has been defined to include only unpaid principal plus accrued and unpaid interest at contractual rates through its originally scheduled maturity. Such amounts do not include penalty or default interest. The Republic has not offered to pay time-barred claims on principal or interest. In settling outstanding disputes with holdout creditors, the Government took into consideration interest accrued after the originally scheduled maturity of each defaulted series of securities (other than time-barred interest), as well as default interest. See “Public Sector Debt—Legal Proceedings.” Interest paid on the debt securities issued since April 2016 (the net proceeds of which were applied in whole or in part to settle claims under Untendered Debt) are reflected under Public Debt Service. In 2021, interest payments as a percentage of total expenditures decreased from 9.0% in 2020 to 7.2% in 2021 and increased by 22.7% in nominal terms. In 2022, interest payments as a percentage of total expenditures increased from 7.2% in 2021 to 9.1% in 2022 and increased by 106.3% in nominal terms. In 2023, interest payments as a percentage of total expenditures remained stable at 9.1% in 2022 and 2023, and increased by 116.9% in nominal terms. In 2024, the public debt service as a percentage of total expenditures increased from 9.1% in 2023 to 10.5% in 2024 and increased by 171.2% in nominal terms. In 2025, interest payments as a percentage of total expenditures decreased from 10.5% in 2024 to 8.4% in 2025 and increased by 9.9% in nominal terms. See “Public Sector Debt—Debt Record—2020 Debt Exchanges.”
Defense and Security
Government expenditures in defense and security represented 3.8% of total expenditures in 2021, 4.1% of total expenditures in 2022, 4.5% of total expenditures in 2023, 4.9% of total expenditures in 2024 and 4.9% of total expenditures in 2025.
General Administration Expenses
In 2021, general administration expenses as a percentage of total government expenditures decreased to 3.6% from 4.5% in 2020, and increased by 20.7% in nominal terms as compared to 2020.
In 2022, general administration expenses as a percentage of total government expenditures decreased to 3.5% from 3.6% in 2021, and increased by 59.7% in nominal terms as compared to 2021.
In 2023, general administration expenses as a percentage of total government expenditures increased to 4.2% from 3.5% in 2022, and increased by 160.5% in nominal terms as compared to 2022.
In 2024, general administration expenses as a percentage of total government expenditures decreased to 2.5% from 4.2% in 2023, and increased by 39.1% in nominal terms as compared to 2023.
In 2025, general administration expenses as a percentage of total government expenditures increased to 3.1% from 2.5% in 2024, and increased by 72.9% in nominal terms as compared to 2024.
D-132
Infrastructure Development
The following table sets forth the composition of the Government’s expenditure (including subsidiaries) in infrastructure development for the years indicated.
Composition of Public Expenditures
(% of total expenditures)
| 2021 | 2022 | 2023 | 2024 | 2025 | ||||||||||||||||
| Public expenditures on economic infrastructure |
18.6 | % | 16.3 | % | 14.9 | % | 11.5 | % | 7.8 | % | ||||||||||
| Energy, fuels and mining |
10.9 | 9.9 | 8.4 | 7.4 | 4.5 | |||||||||||||||
| Communications |
0.5 | 0.4 | 0.5 | 0.4 | 0.3 | |||||||||||||||
| Transport |
5.0 | 4.7 | 4.5 | 2.9 | 2.4 | |||||||||||||||
| Ecology and environment |
0.2 | 0.4 | 0.3 | 0.2 | 0.2 | |||||||||||||||
| Agriculture |
0.3 | 0.4 | 0.5 | 0.3 | 0.1 | |||||||||||||||
| Industry |
1.1 | 0.3 | 0.3 | 0.1 | 0.1 | |||||||||||||||
| Trade, tourism and other services |
0.4 | 0.2 | 0.2 | 0.1 | 0.1 | |||||||||||||||
| Insurances and finances |
0.1 | 0.1 | 0.1 | 0.2 | 0.1 | |||||||||||||||
Source: Ministry of Economy.
Composition of Public Expenditures
(% of GDP)
| 2021 | 2022 | 2023 | 2024 | 2025 | ||||||||||||||||
| Public expenditures on economic infrastructure |
4.3 | % | 3.5 | % | 2.9 | % | 1.8 | % | 1.1 | % | ||||||||||
| Energy, fuels and mining |
2.5 | 2.1 | 1.7 | 1.1 | 0.7 | |||||||||||||||
| Communications |
0.1 | 0,1 | 0.1 | 0.1 | — | |||||||||||||||
| Transport |
1.2 | 1.0 | 0.9 | 0.4 | 0.4 | |||||||||||||||
| Ecology and environment |
0.1 | 0.1 | 0.1 | — | — | |||||||||||||||
| Agriculture |
0.1 | 0.1 | 0.1 | — | — | |||||||||||||||
| Industry |
0.3 | 0.1 | 0.1 | — | — | |||||||||||||||
| Trade, tourism and other services |
0.1 | — | — | — | — | |||||||||||||||
| Insurances and finances |
— | — | — | — | — | |||||||||||||||
Source: INDEC and Ministry of Economy.
The Budget
The Chief of the Cabinet of Ministers is responsible for preparing the National Administration’s budget, which must project the National Administration’s fiscal results for the next three years. Although the budget is prepared on a tri-annual basis, Congress only approves the budget for the following year. Once a budget is approved, the Government can transfer the allocated amounts to the various agencies and to the provinces and the City of Buenos Aires on a quarterly basis. The Auditoría General de la Nación (National General Audit Agency) is responsible for supervising budgetary compliance by the National Administration and its agencies. The Public Sector Financial Administration Law prohibits the Government from borrowing to cover operating expenses.
On December 26, 2025, Congress approved the draft bill of the national budget for the fiscal year ending December 31, 2026. The 2026 Budget provides for the continuation of the fiscal consolidation path initiated in December 2023, with fiscal anchoring as a core strategic priority. For the national public sector, the 2026 Budget projects:
| (i) | A financial surplus of 0.3% of GDP; and |
| (ii) | A primary surplus equivalent to gross debt interest obligations, estimated at 1.4% of GDP. |
These fiscal targets reflect the Government’s commitment to maintaining budgetary discipline and ensuring sustainable public finances in accordance with the framework established under the 2026 Budget.
D-133
The 2026 Budget includes the following macroeconomic and fiscal assumptions for 2026: (i) a real GDP growth of approximately 5.0%, (ii) a 4.9% increase in private consumption, (iii) a 1.2% increase in public consumption, (iv) a 9.4% increase in investments, and (v) a 10.6% increase in exports and an 11.1% increase in imports, in each case, compared to 2025. Total expenditures for the public sector for 2026 were estimated at 15.3% of GDP, total primary expenditures at 14.1% of GDP and total revenues were estimated at 15.6% of GDP.
The table below presents a comparison between budgeted information for 2025 and 2026 for the National Public Administration Sector, in each case, as included in the 2026 Budget.
Budget Comparison
(in millions of pesos)
| Budgeted for 2025(1) |
Budgeted for 2026(1) |
Difference | ||||||||||||||
| Ps. | % | |||||||||||||||
| Current Revenues |
Ps. | 134,539,982 | Ps. | 147,938,296 | 13,398,314 | 10.0 | ||||||||||
| Tax Revenues |
73,695,485 | 90,308,958 | 16,613,472 | 22.5 | ||||||||||||
| Social Security Contributions |
40,257,109 | 47,652,940 | 7,395,831 | 18.4 | ||||||||||||
| Non-Tax Revenues |
2,113,786 | 2,855,067 | 741,282 | 35.1 | ||||||||||||
| Sales of Goods and Services of the Public Administration |
204,824 | 333,141 | 128,317 | 62.6 | ||||||||||||
| Property Taxes |
18,215,150 | 6,745,376 | (11,469,774 | ) | (63.0 | ) | ||||||||||
| Current Transfers |
53,629 | 42,815 | (10,814 | ) | (20.2 | ) | ||||||||||
| Other Revenues |
— | — | — | — | ||||||||||||
| Operating Surplus of Public Entities |
— | — | — | — | ||||||||||||
|
|
|
|
|
|
|
|
|
|||||||||
| Current Expenditures |
120,619,955 | 144,782,528 | 24,162,573 | 20.0 | ||||||||||||
| Consumption Expenditures |
17,647,350 | 20,179,299 | 2,531,950 | 14.3 | ||||||||||||
| Interest and other Property Taxes |
11,697,516 | 14,053,282 | 2,355,766 | 20.1 | ||||||||||||
| Interests in national currency |
1,738,792 | 2,002,637 | 263,845 | 15.2 | ||||||||||||
| Interests in foreign currency |
9,936,992 | 12,033,847 | 2,096,855 | 21.1 | ||||||||||||
| Others |
21,732 | 16,797 | (4,935 | ) | (22.7 | ) | ||||||||||
| Social Security Expenditures |
55,291,046 | 67,178,856 | 11,887,810 | 21.5 | ||||||||||||
| Direct taxes |
2,402 | 2,912 | 510 | 21.2 | ||||||||||||
| Other expenditures |
2,383 | 6 | (2,377 | ) | (99.7 | ) | ||||||||||
| Current Transfers |
35,979,258 | 43,368,172 | 7,388,915 | 20.5 | ||||||||||||
| Operating Deficit of Public Entities |
— | — | — | — | ||||||||||||
|
|
|
|
|
|
|
|
|
|||||||||
| Economic Result |
13,920,028 | 3,155,769 | (10,764,259 | ) | (77.3 | ) | ||||||||||
| Capital Revenues |
— | — | — | — | ||||||||||||
| Capital Expenditures |
2,186,476 | 3,286,766 | 1,100,290 | 50.3 | ||||||||||||
| Real Direct Investment |
1,074,204 | 1,354,707 | 280,503 | 26.1 | ||||||||||||
| Capital Transfers |
899,839 | 1,632,438 | 732,599 | 81.4 | ||||||||||||
| Financial Investment |
212,433 | 299,621 | 87,188 | 41.0 | ||||||||||||
| Total Revenues |
134,827,851 | 148,295,763 | 13,467,912 | 10.0 | ||||||||||||
|
|
|
|
|
|
|
|
|
|||||||||
| Total Expenditures |
122,806,431 | 148,069,294 | 25,262,862 | 20.6 | ||||||||||||
|
|
|
|
|
|
|
|
|
|||||||||
| Total Primary Expenditures |
108,922,439 | 130,729,246 | 21,806,807 | 20.0 | ||||||||||||
|
|
|
|
|
|
|
|
|
|||||||||
| Primary Result |
25,905,412 | 17,566,517 | (8,338,895 | ) | (32.2 | ) | ||||||||||
|
|
|
|
|
|
|
|
|
|||||||||
| Financial Result |
Ps. | 12,021,420 | Ps. | 226,469 | Ps. | (11,794,951) | (98.1 | )% | ||||||||
|
|
|
|
|
|
|
|
|
|||||||||
| (1) | Refers to the budgeted information for the fiscal year ending December 31, 2025 included in the 2026 Budget. |
Source: 2026 Budget and Ministry of Treasury.
Fiscal Relations with the Provinces
Each of Argentina’s 23 provinces and the City of Buenos Aires is a separate legal and fiscal entity, independent from one another and the Government. Argentina’s federal system allocates significant responsibility for public services and other public expenditures to the provinces, but relies primarily on a centralized system of tax collection. The provinces rely on revenue transfers from the Government, primarily through the Co-Participation Regime (as defined below). See “— Revenue Transfers.” Under the Constitution, the provinces delegate to the Government their authority to collect certain taxes, and the Government, in turn, agreed under the Co-Participation Regime to transfer a portion of the revenues generated from such taxes to the provinces.
D-134
From 2021 to 2025, the aggregate annual expenditures of the provinces (including the City of Buenos Aires) averaged 15.8% of nominal GDP, while the provinces (including the City of Buenos Aires), on average, collected annual revenues of approximately 15.7% of nominal GDP (including co-participation amounts). The following table sets forth a summary of the changes in the aggregate fiscal results at the provincial level for the periods specified.
Summary of Revenues and Expenditures of the Provinces and the City of Buenos Aires
(in millions of pesos)(1)
| As of December 31, | ||||||||||||||||||||
| 2021 | 2022 | 2023 | 2024 | 2025 | ||||||||||||||||
| Revenues |
||||||||||||||||||||
| Current revenues: |
||||||||||||||||||||
| Administration taxes: |
||||||||||||||||||||
| Provincial taxes |
Ps. | 2,322,143.0 | Ps. | 4,189,136.7 | Ps. | 9,689,167.6 | Ps. | 28,666,984.3 | Ps. | 42,142,522.4 | ||||||||||
| National taxes: |
||||||||||||||||||||
| Co-participation |
3,143,437.1 | 5,916,743.2 | 13,091,377.3 | 38,792,520.0 | 54,748,974.2 | |||||||||||||||
| Other national taxes |
412,304.0 | 610,498.7 | 1,265,467.4 | 3,340,938.2 | 5,712,954.6 | |||||||||||||||
|
|
|
|
|
|
|
|
|
|
|
|||||||||||
| Total national taxes |
3,555,741.1 | 6,527,241.9 | 14,356,844.7 | 42,133,458.3 | 60,461,928.9 | |||||||||||||||
|
|
|
|
|
|
|
|
|
|
|
|||||||||||
| Total administration taxes |
5,877,884.1 | 10,716,378.6 | 24,046,012.2 | 70,800,442.6 | 102,604,451.3 | |||||||||||||||
| Other non-tax revenue |
1,055,960.5 | 1,945,805.5 | 4,644,973.4 | 14,161,855.6 | 21,908,370.4 | |||||||||||||||
| Sale of goods and services of the public administration |
37,010.5 | 65,296.4 | 151,225.4 | 474,868.3 | 921,321.4 | |||||||||||||||
| Property taxes |
94,994.9 | 339,110.0 | 1,312,001.1 | 3,025,348.0 | 3,293,347.6 | |||||||||||||||
| Current transfers |
412,146.7 | 677,969.3 | 1,646,431.5 | 1,610,349.7 | 3,238,657.5 | |||||||||||||||
|
|
|
|
|
|
|
|
|
|
|
|||||||||||
| Total current revenues |
7,477,996.7 | 13,735,559.8 | 31,800,643.5 | 90,072,864.3 | 131,966,148.2 | |||||||||||||||
| Capital revenue |
160,504.6 | 303,121.1 | 736,987.4 | 514,582.3 | 1,162,229.4 | |||||||||||||||
|
|
|
|
|
|
|
|
|
|
|
|||||||||||
| Total revenues |
7,638,501.3 | 14,038,680.9 | 32,537,630.9 | 90,587,466.6 | 133,128,377.6 | |||||||||||||||
|
|
|
|
|
|
|
|
|
|
|
|||||||||||
| Expenditures |
||||||||||||||||||||
| Current expenditures: |
||||||||||||||||||||
| Consumption expenditures: |
||||||||||||||||||||
| Provincial administration wages |
3,221,342.5 | 5,813,717.8 | 14,212,648.9 | 38,901,332.6 | 59,293,169.1 | |||||||||||||||
| Consumer goods |
256,771.0 | 384,791.8 | 757,811.8 | 2,864,778.0 | 3,944,641.5 | |||||||||||||||
| Services |
470,022.5 | 851,631.9 | 2,187,189.1 | 6,157,252.0 | 10,018,739.2 | |||||||||||||||
|
|
|
|
|
|
|
|
|
|
|
|||||||||||
| Total consumption expenditures |
3,948,136.0 | 7,050,141.5 | 17,157,685.8 | 47,923,362.5 | 73,256,549.8 | |||||||||||||||
| Interest payments |
175,454.4 | 290,840.1 | 690,041.0 | 1,543,204.1 | 2,486,620.8 | |||||||||||||||
| Current transfers |
2,642,485.4 | 4,789,152.4 | 11,111,837.8 | 31,414,079.9 | 47,127,759.4 | |||||||||||||||
|
|
|
|
|
|
|
|
|
|
|
|||||||||||
| Total current expenditures |
6,766,075.8 | 12,130,134.0 | 28,959,564.6 | 80,880,646.5 | 122,870,929.9 | |||||||||||||||
| Capital expenditures |
||||||||||||||||||||
| Direct investment |
517,589.1 | 1,116,497.7 | 2,682,616.5 | 5,819,727.9 | 9,944,422.6 | |||||||||||||||
| Capital transfers |
142,010.9 | 287,253.1 | 717,897.3 | 1,343,211.8 | 1,740,156.4 | |||||||||||||||
| Financial investment |
118,510.9 | 233,045.7 | 699,600.9 | 1,582,426.2 | 1,484,558.0 | |||||||||||||||
|
|
|
|
|
|
|
|
|
|
|
|||||||||||
| Total capital expenditures |
778,110.9 | 1,636,796.5 | 4,100,113.8 | 8,745,365.9 | 13,169,137.1 | |||||||||||||||
|
|
|
|
|
|
|
|
|
|
|
|||||||||||
| Total expenditures |
7,544,186.6 | 13,766,930.5 | 33,049,678.7 | 89,626,012.4 | 136,040,067.0 | |||||||||||||||
|
|
|
|
|
|
|
|
|
|
|
|||||||||||
| Fiscal balance |
Ps. | 94,314.6 | Ps. | 271,750.4 | Ps. | (522,047.6 | ) | Ps. | 961,434.2 | Ps. | (2,911,684.4 | ) | ||||||||
|
|
|
|
|
|
|
|
|
|
|
|||||||||||
| (1) | Amounts calculated using the accrual method. Figures for 2025 include a preliminary estimate of the information for the Province of La Pampa provided by the Secretariat of Finance. |
Source: Ministry of Economy.
D-135
The following table sets forth a summary of the aggregate fiscal results at the provincial level for the periods specified, in percentage terms.
Summary of Revenues and Expenditures of the Provinces and the City of Buenos Aires
(% change from the previous year)
| As of December 31, | ||||||||||||||||||||
| 2021 | 2022 | 2023 | 2024 | 2025 | ||||||||||||||||
| Revenues |
||||||||||||||||||||
| Current revenues: |
||||||||||||||||||||
| Administration taxes: |
||||||||||||||||||||
| Provincial taxes |
69.7 | % | 80.4 | % | 131.3 | % | 195.9 | % | 47.0 | % | ||||||||||
| National taxes: |
||||||||||||||||||||
| Co-participation |
60.7 | 88.2 | 121.3 | 196.3 | 41.1 | |||||||||||||||
| Other national taxes |
44.9 | 48.1 | 107.3 | 164.0 | 71.0 | |||||||||||||||
| Total national taxes |
58.7 | 83.6 | 120.0 | 193.5 | 43.5 | |||||||||||||||
|
|
|
|
|
|
|
|
|
|
|
|||||||||||
| Total administration taxes |
62.9 | 82.3 | 124.4 | 194.4 | 44.9 | |||||||||||||||
|
|
|
|
|
|
|
|
|
|
|
|||||||||||
| Other non-tax revenue |
54.3 | 84.3 | 138.7 | 204.9 | 54.7 | |||||||||||||||
| Sale of goods and services of the public administration |
66.7 | 76.4 | 131.6 | 214.0 | 94.0 | |||||||||||||||
| Property taxes |
117.5 | 247.5 | 297.4 | 130.6 | 8.9 | |||||||||||||||
| Current transfers |
23.5 | 64.5 | 142.8 | (2.2 | ) | 101.1 | ||||||||||||||
|
|
|
|
|
|
|
|
|
|
|
|||||||||||
| Total current revenues |
59.3 | 83.7 | 131.5 | 183.2 | 46.5 | |||||||||||||||
| Capital revenue |
165.8 | 88.9 | 143.1 | (30.2 | ) | 125.9 | ||||||||||||||
|
|
|
|
|
|
|
|
|
|
|
|||||||||||
| Total revenues |
60.7 | 83.8 | 131.8 | 178.4 | 47.0 | |||||||||||||||
|
|
|
|
|
|
|
|
|
|
|
|||||||||||
| Expenditures |
||||||||||||||||||||
| Current expenditures: |
||||||||||||||||||||
| Consumption expenditures: |
||||||||||||||||||||
| Provincial administration wages |
49.1 | 80.5 | 144.5 | 173.7 | 52.4 | |||||||||||||||
| Consumer goods |
87.3 | 49.9 | 96.9 | 278.0 | 37.7 | |||||||||||||||
| Services |
63.8 | 81.2 | 156.8 | 181.5 | 62.7 | |||||||||||||||
|
|
|
|
|
|
|
|
|
|
|
|||||||||||
| Total consumption expenditures |
52.8 | 78.6 | 143.4 | 179.3 | 52.9 | |||||||||||||||
| Interest payments |
24.9 | 65.8 | 137.3 | 123.6 | 61.1 | |||||||||||||||
| Current transfers |
57.0 | 81.2 | 132.1 | 182.7 | 50.0 | |||||||||||||||
|
|
|
|
|
|
|
|
|
|
|
|||||||||||
| Total current expenditures |
53.5 | 79.3 | 138.7 | 179.3 | 51.9 | |||||||||||||||
| Capital expenditures |
||||||||||||||||||||
| Direct investment |
104.6 | 115.7 | 140.3 | 116.9 | 70.9 | |||||||||||||||
| Capital transfers |
54.9 | 102.3 | 149.9 | 87.1 | 29.6 | |||||||||||||||
| Financial investment |
71.2 | 96.6 | 200.2 | 126.2 | (6.2 | ) | ||||||||||||||
|
|
|
|
|
|
|
|
|
|
|
|||||||||||
| Total capital expenditures |
88.0 | 110.4 | 150.5 | 113.3 | 50.6 | |||||||||||||||
|
|
|
|
|
|
|
|
|
|
|
|||||||||||
| Total expenditures |
56.5 | 82.5 | 140.1 | 171.1 | 51.8 | |||||||||||||||
|
|
|
|
|
|
|
|
|
|
|
|||||||||||
| Fiscal balance |
240.0 | % | 188.1 | % | (292.1 | )% | 184.2 | % | (402.8 | )% | ||||||||||
|
|
|
|
|
|
|
|
|
|
|
|||||||||||
| (1) | Amounts calculated using the accrual method. Figures include a preliminary estimate of the information for the Province of La Pampa provided by the Secretariat of Finance. |
Source: Ministry of Economy.
D-136
Summary of Revenues and Expenditures of the Provinces and the City of Buenos Aires
(as percentage of GDP)
| As of December 31, | ||||||||||||||||||||
| 2021 | 2022 | 2023 | 2024 | 2025 | ||||||||||||||||
| Revenues |
||||||||||||||||||||
| Current revenues: |
||||||||||||||||||||
| Administration taxes: |
||||||||||||||||||||
| Provincial taxes |
5.0 | % | 5.1 | % | 5.0 | % | 4.9 | % | 4.9 | % | ||||||||||
| National taxes: |
||||||||||||||||||||
| Co-participation |
6.8 | 7.1 | 6.8 | 6.6 | 6.3 | |||||||||||||||
| Other national taxes |
0.9 | 0.7 | 0.7 | 0.6 | 0.7 | |||||||||||||||
|
|
|
|
|
|
|
|
|
|
|
|||||||||||
| Total national taxes |
7.7 | 7.9 | 7.4 | 7.2 | 7.0 | |||||||||||||||
|
|
|
|
|
|
|
|
|
|
|
|||||||||||
| Total administration taxes |
12.7 | 12.9 | 12.4 | 12.1 | 11.8 | |||||||||||||||
| Other non-tax revenue |
2.3 | 2.3 | 2.4 | 2.4 | 2.5 | |||||||||||||||
| Sale of goods and services of the public administration |
0.1 | 0.1 | 0.1 | 0.1 | 0.1 | |||||||||||||||
| Property taxes |
0.2 | 0.4 | 0.7 | 0.5 | 0.4 | |||||||||||||||
| Current transfers |
0.9 | 0.8 | 0.9 | 0.3 | 0.4 | |||||||||||||||
|
|
|
|
|
|
|
|
|
|
|
|||||||||||
| Total current revenues |
16.2 | 16.6 | 16.5 | 15.4 | 15.2 | |||||||||||||||
| Capital revenue |
0.3 | 0.4 | 0.4 | 0.1 | 0.1 | |||||||||||||||
|
|
|
|
|
|
|
|
|
|
|
|||||||||||
| Total revenues |
16.5 | 17.0 | 16.9 | 15.5 | 15.3 | |||||||||||||||
|
|
|
|
|
|
|
|
|
|
|
|||||||||||
| Expenditures |
||||||||||||||||||||
| Current expenditures: |
||||||||||||||||||||
| Consumption expenditures: |
||||||||||||||||||||
| Provincial administration wages |
7.0 | 7.0 | 7.4 | 6.7 | 6.8 | |||||||||||||||
| Consumer goods |
0.6 | 0.5 | 0.4 | 0.5 | 0.5 | |||||||||||||||
| Services |
1.0 | 1.0 | 1.1 | 1.1 | 1.2 | |||||||||||||||
|
|
|
|
|
|
|
|
|
|
|
|||||||||||
| Total consumption expenditures |
8.5 | 8.5 | 8.9 | 8.2 | 8.4 | |||||||||||||||
|
|
|
|
|
|
|
|
|
|
|
|||||||||||
| Interest payments |
0.4 | 0.4 | 0.4 | 0.3 | 0.3 | |||||||||||||||
| Current transfers |
5.7 | 5.8 | 5.8 | 5.4 | 5.4 | |||||||||||||||
|
|
|
|
|
|
|
|
|
|
|
|||||||||||
| Total current expenditures |
14.6 | 14.6 | 15.1 | 13.9 | 14.2 | |||||||||||||||
|
|
|
|
|
|
|
|
|
|
|
|||||||||||
| Capital expenditures |
||||||||||||||||||||
| Direct investment |
1.1 | 1.3 | 1.4 | 1.0 | 1.1 | |||||||||||||||
| Capital transfers |
0.3 | 0.3 | 0.4 | 0.2 | 0.2 | |||||||||||||||
| Financial investment |
0.3 | 0.3 | 0.4 | 0.3 | 0.2 | |||||||||||||||
|
|
|
|
|
|
|
|
|
|
|
|||||||||||
| Total capital expenditures |
1.7 | 2.0 | 2.1 | 1.5 | 1.5 | |||||||||||||||
|
|
|
|
|
|
|
|
|
|
|
|||||||||||
| Total expenditures |
16.3 | 16.6 | 17.2 | 15.3 | 15.7 | |||||||||||||||
|
|
|
|
|
|
|
|
|
|
|
|||||||||||
| Fiscal balance |
0.2 | % | 0.3 | % | (0.3 | )% | 0.2 | % | (0.3 | )% | ||||||||||
|
|
|
|
|
|
|
|
|
|
|
|||||||||||
| (1) | Amounts calculated using the accrual method. |
Source: INDEC and Ministry of Economy.
Revenue Transfers
Currently, revenue transfers between the Government and the provinces take place under the Co-Participation Regime and several other special revenue-distribution arrangements. The 1988 Co-Participation Law as amended in 2002 (the “Co-Participation Law”) governs the current co-participation regime (the “Co-Participation Regime”). Originally intended as a temporary measure, the Co-Participation Law has been automatically renewed every year since it was due to expire at the end of 1989. Although the 1994 amendments to the Constitution called for the adoption of a new co-participation law by 1996, none has been adopted. Since the mid-1980s, the executive branches of the Government and the provinces and the City of Buenos Aires have maintained consensual agreements concerning revenue transfers, which Congress has routinely ratified. The Comisión Federal de Impuestos (Federal Tax Commission), a federal agency created pursuant to the Co-Participation Law, monitors compliance with the Co-Participation Regime.
D-137
The Co-Participation Law requires the Government to transfer to a federal co-participation fund 100.0% of income tax revenues (net of Ps.580 million, as described below), 89.0% of value-added tax revenues, 100.0% of revenues from the notional minimum income tax and 93.7% of revenues from the personal property tax, 100.0% of the revenues from excise tax and other minor taxes. The 2017 Fiscal Consensus establishes that 100.0% of revenues generated by the tax on financial transactions will be allocated to ANSES. Additionally, the 2017 Fiscal Consensus provided for (i) certain compensations to those jurisdictions whose funds were reduced as a result of certain changes in the allocations of income tax and financial transactions tax and (ii) a specific compensation to the Province of Buenos Aires due to the dismantling of the Fondo del Conurbano Bornaerense.
The special distribution arrangements in place through December 31, 2025, in addition to the federal Co-Participation Regime, include the following:
| | VAT. 11% of VAT revenues (after deducting export refunds) were distributed as follows: 6.27% to those provinces whose social security funds had not been transferred to the federal Government (Buenos Aires, Chaco, Chubut, Córdoba, Corrientes, Entre Ríos, Formosa, La Pampa, Misiones, Neuquén, Santa Cruz, Santa Fe and Tierra del Fuego) and the remaining 93.73% to ANSES; |
| | Internal Taxes. Internal taxes on tobacco, alcoholic beverages, beers, luxury goods, wagers and other items are 100% co-participated. |
| | Tax on Cooperatives’ Capital. 50% of the 2% tax on cooperatives’ capital is co-participated. |
| | Taxes on Liquid Fuels and Carbon Dioxide. 10.40% of revenues generated by taxes on liquid fuels and carbon dioxide is allocated to the provinces and the City of Buenos Aires. |
| | Tax on Electricity. 80.14% is applied as follows: 60% to the Fondo Subsidiario Regional (Regional Subsidiary Fund) to compensate final users’ consumption, and 40% to the Fondo de Desarrollo Eléctrico del Interior (Electricity Development Fund for the Provinces). |
| | Personal Property Tax. After deducting Ps.0.25 million to INCUCAI, 6.27% is allocated to provinces whose social security funds had not been transferred to the federal Government; and |
| | Monotributo (self-employment tax). Revenue from the self-employment tax is divided into a tax component and a social security component. The tax component is allocated: 70% to ANSES system and 30% as provided in the Co-Participation Law. The social security component is entirely allocated to ANSES. |
Dispute with the City of Buenos Aires
In January 2016, the Macri administration increased the distribution of co-participation taxes to the City of Buenos Aires from 1.4% to 3.75% in the context of the transfer to such jurisdiction of competencies in the area of public safety in non-federal matters, including the transfer of all personnel, agencies, functions, competencies, services and assets affected up to that time. Such percentage was reduced to 3.5% in 2018 pursuant to an agreement between the Government and the City of Buenos Aires. In September 2020, the Fernández administration reduced such co-participation percentage to 2.32%. Following such decision, the City of Buenos Aires filed a petition for unconstitutionality before the Supreme Court.
In December 2020, through Law 27,606, the City of Buenos Aires’ co-participation rate was further reduced to 1.4%. In addition, the City of Buenos Aires began to receive a contribution from the National Treasury to finance the police forces.
In December 2022, the Supreme Court of Justice issued an injunction (i) establishing that the Government must send to the City of Buenos Aires 2.95% of the co-participation funds until such court renders a decision on the merits and (ii) suspending the effectiveness of Law 27,606. Starting in September 2024, the National Treasury began making direct (current) transfers to the City of Buenos Aires in order to comply with the Supreme Court’s order in this precautionary measure.
Other Arrangements with the Provinces
Since the late 1990s, the Government entered into different arrangements with the provinces to regularize their fiscal situation. Under these arrangements, the Government provides financial assistance to the provinces in various forms and subject to various conditions. Some of these programs are highlighted below.
Fiscal Responsibility Law. The Fiscal Responsibility Law was enacted in 2004 and is only binding on those provinces and the City of Buenos Aires, that approved it. To date, 21 of 23 provinces and the City of Buenos Aires have approved the Fiscal Responsibility Law. This law implements important reforms to the fiscal framework for Argentina’s national, provincial and municipal public sectors. Some of its key features include the following:
| | the Government and the provinces must prepare annual fiscal programs for each upcoming year setting forth certain fiscal policies, targets and projections, and regularly publish their fiscal results on their respective websites; |
D-138
| | the growth rate of the primary expenditures of the national and provincial governments may not exceed the growth rate of the national consumer price index (CPI); |
| | once a balanced financial result is achieved, the nominal rate of increase in primary current expenditures may not exceed the nominal GDP growth rate. When the change in nominal GDP rate is negative, primary current expenditures may at most grow at the rate of the national consumer price index; |
| | the Government and the provinces must maintain balanced budgets; |
| | the Government and the provinces must create special anti-cyclical funds to reduce volatility in the fiscal cycle; |
| | the provinces may not incur debt service obligations in excess of 15% of provincial current revenues net of co-participation transfers to the municipal governments (other than in connection with expenditures for the promotion of economic activity, employment and social assistance). Any province in breach of this limit would be precluded, with certain exceptions, from incurring additional debt; |
| | the Government must commit to reduce its outstanding debt as a percentage of nominal GDP following its debt restructuring; |
| | the provinces must seek approval from the Ministry of Economy to incur debt or issue guarantees; and |
| | the Ministry of Economy must base its approval of provincial debt issues or guarantees on the parameters set forth in the law. |
The Fiscal Responsibility Law, however, does not implement any amendments to the Federal Co-Participation Regime.
On November 16, 2017, all provinces (except San Luis and La Pampa) approved the 2017 Fiscal Consensus, establishing rules designed to enhance sound public finance practices at the national and provincial levels and ensure that each jurisdiction maintains control over its expenses, such as capping increases in public expenditures for any given period at the inflation rate for that period, and capping increases in overall public employment at the rate of population growth. Through the 2017 Fiscal Consensus, the provinces commit to limit tax increases, especially on taxes on labor and production and the financing of labor and production, in order to foster economic growth at the national and provincial level.
The 2017 Fiscal Consensus was amended by Law 27,469 (2018 Fiscal Consensus), Law 27,542 (2019 Fiscal Consensus), Law 27,634 (2020 Fiscal Consensus), Law 27,687 (2021 Fiscal Consensus) and articles 20 to 22 of Law 27,591, which modified the Fiscal Responsibility regime, in particular with regards to the incurrence of debt.
Social Security
Reform of the Pension Funds System
On November 20, 2008, Congress approved Law No. 26,425, reforming the private pension system. Under this law, the former private pension system was absorbed and replaced by the Argentine Integrated Pension System, structured as a “pay as you go” system. As a result, all resources administered by the private pension funds, including equity interests in a wide range of listed companies, were transferred to a separate fund, the FGS, to be administered by ANSES. The assets held in the FGS may only be used to make advances to the Government to cover unexpected budget deficits that prevent the Government (through ANSES) from honoring its obligation to make social security and pension payments. As of December 31, 2025, the FGS was valued at Ps.106,142 billion.
Decree No. 2,103/08 requires that the FGS invest in financial assets that include, among other instruments, Government bonds or local securities of recognized solvency. ANSES prioritizes investments that mitigate the financial impact that economic and social trends have on the public pension system, act as a reserve fund providing an appropriate investment of any public pension system surpluses, contribute to preserve the value and profitability of FGS’s resources and the sustainable development of the public pension system and address any shortfalls in such system’s or ANSES’s financing.
The FGS has decision making bodies and control bodies. The Executive Director of ANSES manages the FGS with the assistance of an Executive Committee (composed of the Secretary of Finance, Treasury and Economic Policy of the Ministry of Economy). The Deputy Director of Operations of the FGS is the Executive Secretary of the Executive Committee and also its Operating Manager. Decisions are taken by simple majority, although the Executive Director of ANSES has veto rights. In addition to the Council of the FGS (which includes representatives of workers, retirees, businessmen, legislators, the cabinet of ministers and of ANSES), the activities of the FGS are audited by a Join Congressional Commission for Control of Funds, the Audit of the FGS, the General Audit of the Nation and the Office of the Ombudsman of the Nation.
D-139
Social Security Framework
ANSES is a self-governing entity with its own legal status, distinct from that of the National Government, and enjoys financial and economic autonomy.
Three separate institutions manage Argentina’s national public pension system:
| | ANSES, which oversees the pension funds of the general public; |
| | the Instituto de Ayuda Financiera para Pago de Retiros y Pensiones Militares (Armed Forces Pension Fund), which manages a special pension fund for the armed forces; and |
| | the Caja de Retiros, Jubilaciones y Pensiones de la Policía Federal (Federal Police Pension Fund), which manages a special pension fund for federal law enforcement personnel. |
A significant portion of ANSES’s investments portfolio includes Government bonds.
Between 1994 and 1996, the Government assumed responsibility for operating the provincial pension systems of 10 provinces and the City of Buenos Aires. The Government merged these provincial pension funds into ANSES.
The current public social security system provides the following main benefits for retirees and for eligible individuals:
| | Ordinary pensions, consisting of: |
| | Prestación básica universal (Basic pension). ANSES provides a basic pension to all individuals who have paid social security contributions for a majority of their working lives and have reached retirement age, regardless of the amount of the contributions made. The amount of this benefit is fixed by law and bears no relation to the amount of the contributions. |
| | Prestación compensatoria (Compensatory pension). ANSES also provides a compensatory pension to recipients of the basic pension in proportion to any social security contributions made by or on behalf of such recipient prior to July 1994. The amount of this supplemental pension is determined based on an individual’s social security contributions and the length of time during which contributions were made. |
| | Prestación adicional por permanencia (Additional pension). Recipients of the basic pension and compensatory pension also receive an additional pension. The amount of this benefit is equivalent to 1.5% of the average yearly salary during the ten years before retirement, multiplied by each service year for which an individual made social security contributions. |
| | Special pensions and allowances, consisting mainly of: |
| | Retiro por invalidez (Disability retirement). Allowance granted to disabled individuals under the age of 65. |
| | Jubilación por edad avanzada (Pension for the elderly). Allowance granted to individuals over the age of 70 who do not qualify for a basic retirement pension. |
| | Pensión por fallecimiento (Death pension). Allowance granted to certain dependents of a deceased retiree, if at the time of the retiree’s death, such dependents were unable to work due to a disability. |
| | Universal Child Allowance: ANSES provides a monthly pension child per under the age of 18 and per disabled child (with no age limit) of workers in the informal sector of the economy, employees with income below the minimum monthly wage and the unemployed. |
| | Universal Pregnancy Allowance: ANSES provides a monthly allowance to pregnant women, who have no medical insurance, from the twelfth week of pregnancy. |
Argentina’s social security system also includes the following two unemployment programs:
| | unemployment insurance that provides one-time or monthly benefits to terminated employees and their dependents who meet certain requirements; and |
| | the Heads of Households program, sponsored by the World Bank, under which unemployed heads of households receive benefit payments in exchange for community service. Heads of Households program beneficiaries may opt for a new plan called Más y Mejor Empleo (More and Better Jobs), as well as the Seguro de Capacitación y Empleo (Training and Employment Insurance) and the Programa Familias por la Inclusión Social (Families for Social Inclusion Program). |
D-140
Currently, the national social security system is funded primarily through the following taxes:
| | payroll taxes based on employee wages (usually 11% for employees and between 18% and 20.4% for employers, depending on the employer’s line of business); |
| | mandatory employee contributions to the Instituto Nacional de Servicios Sociales para Jubilados y Pensionados (National Institute of Pensioner and Retiree Social Services) (equal to 3% of the employee’s wages); |
| | the employee health system tax based on employee wages (3% for employees and 6% for employers); and |
| | the Monotributo (self-employment tax) system applicable to self-employed individuals (under which amounts are determined on an individual basis according to assumed income ranges for various lines of work). |
Other fiscal revenues allocated to cover costs of ANSES include the following:
| | 11% of VAT revenues (after deducting export refunds) were distributed as follows: 6.27% to provinces whose social security funds had not been transferred to the federal Government (Buenos Aires, Chaco, Chubut, Córdoba, Corrientes, Entre Rios, Formosa, La Pampa, Misiones, Neuquén, Santa Cruz, Santa Fe and Tierra del Fuego) and the remaining 93.73% to ANSES; |
| | 100% of revenues from the emergency tax on cigarettes; and |
| | 70% of Monotributo. |
Evolution of Social Security Revenues and Expenditures
From 2021 to 2025, the social security system result increased from a deficit of Ps.841.1 billion in 2021 to a deficit of Ps.1,876.2 billion in 2025, with the exception of 2024, in which there was a surplus of Ps.2,425.7 billion. The deficits were primarily due to a 1,480% increase in social security payments between 2021 and 2025 as a result of an automatic increase in benefit amounts mandated by Law No. 27,426/2017, Law No. 27,609/2020 and Decree No. 274/2024 (the Social Security Mobility Regime), which address the mobility of public social security regimes. These laws updated minimum pensions considering tax collection, minimum wages and inflation rates. Revenues were affected by the termination of the Impuesto PAÍS, the expiration of the moratorium, and an increase in applications for debt payment plans. As of the date of this Annual Report, less than half of the economically active population in Argentina made contributions to the social security system, and approximately half of the working population made such contributions.
In 2025, the contributions to the social security system rose due to an increase in average gross salary and in the taxable base for employee contributions.
Social security revenues. In 2021, social security revenues increased by 55.4% as compared to 2020 to Ps.2,382 billion, mainly driven by an increase in taxable wages and employment in the formal economy. In 2022, social security revenues increased by 79.4% as compared to 2021 to Ps.4,274 billion, mainly driven by an increase in taxable wages and employment in the formal economy. In 2023, social security revenues increased by 125.1% as compared to 2022 to Ps.9,620 billion, mainly driven by an increase in taxable wages and employment in the formal economy. In 2024, social security revenues increased by 206.1% as compared to 2023 to Ps.29,444 billion, mainly driven by an increase in taxable wages. In 2025, social security revenues increased by 58.0% as compared to 2024 to Ps.47,422 billion, mainly driven by an increase in taxable wages.
Social security expenditures. In 2021, social security expenditures increased by 41.9% to Ps.3,709.5 billion. In 2022, social security expenditures increased by 69.5% to Ps.6,288 billion. In 2023, social security expenditures increased by 105.4% to Ps.12,914 billion. In 2024, social security expenditures increased by 176.7% to Ps.35,733 billion. In 2025, social security expenditures increased by 58.6% to Ps.56,673 billion.
Retiree Programs and Ley de Reforma Previsional (Pension Reform Law)
On December 29, 2020, Congress enacted a pension reform law (the “2020 Pension Reform Law”) to improve the sustainability and predictability of the Argentine pension program. To that effect, the basic formula for the periodic adjustment of retirements, pensions and the Universal Child Allowance was modified as of March 2021, to provide for quarterly adjustments based on a formula combining ANSES revenues for the period (given a 50% weight in the formula) with the RIPTE, an index published by the Ministry of Labor that measures salary increases of state employees (given the remaining 50% weight in the formula).
D-141
In 2023, the Government carried out a series of significant adjustments to pension assets, in accordance with the Social Security Mobility Law, with the objective of preserving the purchasing power of retirees. The increases were applied through a staggered approach, amounting to 17.04%, 20.92%, 23.29% and 20.87% in March, June, September and December, respectively. In addition, the Government implemented a monthly bonus for low-income retirees and pensioners starting at Ps.10,000 in January and progressively increasing until reaching Ps.55,000 in December. This progressive bonus policy was aimed at mitigating the effects of inflation and providing additional economic support to the most vulnerable sectors of the retired population.
In March 2024, the Government enacted Decree No. 274/24 establishing that future adjustments to pensions and allowances would be based on increases in the Consumer Price Index (CPI). In October 2024, pensions and allowances rose by 4.17%, and retirees received a Ps.70,000 bonus, bringing the minimum pension to Ps.314,320.56 per month. Retirees whose pensions do not reach this amount are expected to receive a proportional bonus to ensure they receive the full Ps.314,320.56. In December 2024, pensions and allowances rose by 2.7%, and retirees received a Ps.70,000 bonus and half a monthly pension as a year’s end bonus, the minimum pension was increased by 2.7%, plus a Ps 70,000 bonus and half of the pension as a year’s end bonus, bringing the minimum pension to Ps.459,398.14 per month.
On March 23, 2025, the Plan de Pago de Deuda Previsional (Pension Debt Payment Plan) expired. The plan gave the possibility to individuals within the retirement age who had not reached the required 30 years of contributions, to regularize their pension debt and access retirement status. As a result of the plan’s expiration, individuals will now be eligible for retirement only under the Pensión Universal Para Adultos Mayores (Universal Pension for Elders) from 65 years of age onwards.
In December 2025, pensions and allowances rose by 2.34%, bringing the minimum pension to Ps.340,871, or Ps.581,319 including the monthly bonus of Ps.70,000 and the half-wage year-end bonus.
D-142
PUBLIC SECTOR DEBT
Overview
Unless otherwise specified, the amounts of the Republic’s securities outstanding included in this section “Public Debt” were calculated as of December 31, 2025.
The Republic’s total gross public debt consists of foreign currency-denominated and peso-denominated debt owed directly by the Government and indirect debt consisting of Government guarantees of obligations of other national public institutions, the provinces (including the City of Buenos Aires) and private sector entities. It does not include direct debt of the provinces or other entities that is not guaranteed by the Government. Except where indicated, foreign currency-denominated debt and peso-denominated debt is comprised of performing and non-performing debt (including Untendered Debt). See “—Legal Proceedings.”
On February 5, 2020, Congress enacted legislation authorizing the Executive Power, acting through the Ministry of Economy, to engage in transactions and negotiations with Argentina’s creditors to restore the sustainability of its public external debt (the “Debt Sustainability Bill”), including by modifying the principal amounts, maturities and interest payments of public securities issued by Argentina and governed by foreign law. Pursuant to the Debt Sustainability Bill, between April and September 2020, the Government conducted the 2020 Debt Exchanges. See “—Debt Record—2020 Debt Exchanges.”
The Republic’s total gross public debt, including Untendered Debt, for the years 2021 through 2025, was:
| | U.S.$363.2 billion, as of December 31, 2021; |
| | U.S.$396.6 billion, as of December 31, 2022; |
| | U.S.$370.7 billion, as of December 31, 2023; |
| | U.S.$466.9 billion, as of December 31, 2024; and |
| | U.S.$455.1 billion, as of December 31, 2025. |
Of the U.S.$455.1 billion of the Republic’s total gross public debt outstanding as of December 31, 2025, peso-denominated debt totaled U.S.$191.0 billion, representing 42.0% of the Republic’s total gross public debt of which 49.9% corresponded to CER-index linked debt, and foreign currency-denominated debt totaled U.S.$264.1 billion, representing 58.0% of the Republic’s total gross public debt.
As of December 31, 2025, total gross public debt (including non-performing debt and Untendered Debt) by type of creditor was estimated as follows:
| | 44.0% of total gross public debt, or U.S.$200.2 billion, primarily consisted of Public Debt held by National Public Sector Agencies; |
| | 34.2% of total gross public debt, or U.S.$155.5 billion, was Public Debt held by private sector creditors; and |
| | 21.8% of total gross public debt, or U.S.$99.4 billion, primarily consisted of Public Debt held by multilateral and bilateral lenders. |
As of December 31, 2025, total gross public debt (excluding non-performing debt and Untendered Debt) by type of instrument was as follows: 63.5%, or U.S.$287.5 billion in bonds; 22.0%, or U.S.$99.4 billion, in loans from multilateral and bilateral lenders; 13.1% or U.S.$59.4 billion, in treasury notes and treasury bills; 0.4% or U.S.$1.9 billion in Avales and promissory notes; 0.6% or U.S.$2.8 billion in temporary advances from the Central Bank; 0.2% or U.S.$0.7 billion in loans from commercial banks; and 0.2% or U.S.$0.9 billion in National Guaranteed Loans.
Untendered Debt has been defined to include unpaid principal plus accrued and unpaid interest at contractual rates through December 31, 2025 plus compensatory or default interest. The Republic has not offered to pay time-barred claims on principal or interest.
As of December 31, 2025, nominal claims on account of Untendered Debt (including solely for this purpose claims that the Republic considers time-barred), as registered in the public accounts of the Ministry of Economy, totaled approximately U.S.$2.4 billion.
D-143
As of December 31, 2025, non-performing debt (excluding Untendered Debt) totaled U.S.$105.9 million, or less than 0.02% of total gross public debt.
Debt Record
Introduction
From time to time, the Republic has carried out debt restructuring transactions in accordance with Section 65 of Law No. 24,156 and other applicable legislation with official as well as private creditors. Between 1990 and 2025, the Republic entered into four restructurings of external and domestic debt in default: the Brady Plan, the 2005 Debt Exchange, the 2010 Debt Exchange and the 2020 Debt Exchanges.
Paris Club
The Republic restructured debt owed to members of the Paris Club, a group of sovereign creditors, through five separate agreements in 1985, 1987, 1989, 1991 and 1992. During the debt crisis that began in 2001, the Republic defaulted on its outstanding debt owed to Paris Club members. As of April 30, 2014, the total outstanding debt owed to members of the Paris Club amounted to U.S.$9,690 million, which consisted of U.S.$4,955 million in principal, U.S.$1,102 million in interest and U.S.$3,633 million in penalty interest. On May 29, 2014, the Republic reached a settlement agreement with the Paris Club to cancel the total outstanding debt in five years. As of December 31, 2019, U.S.$1,941.2 million principal amount remained outstanding. On April 7, 2020, the Minister of Economy sent the Paris Club members a proposal to modify the existing terms of the Paris Club 2014 Settlement Agreement, seeking mainly an extension of the maturity dates and a significant reduction in the interest rate. On June 22, 2021, the Minister of Economy announced that the Republic had obtained a “time bridge” within the framework of Paris Club negotiations, avoiding default. On October 28, 2022, the Republic and the Paris Club creditors reached an agreement to amend the Paris Club 2014 Settlement Agreement, to reschedule an estimated stock of arrears of U.S.$1.9 billion (the “Amended Paris Club Settlement Agreement”). The repayment of the outstanding amounts under the Amended Paris Club Settlement Agreement is to be made in 13 installments over a six-year period and reducing the applicable interest rate from 9.0% to 4.5%. As of December 31, 2025, the Republic had paid the first three installments under the Amended Paris Club Settlement Agreement (as defined herein) and finalized the execution of bilateral agreements with all Paris Club creditors involved in the negotiation. See “Recent Developments—Public Sector Debt—Debt Owed to Financial Institutions—Paris Club.”
Commercial Banks
In 1985 and 1987, the Republic negotiated the restructuring of U.S.$34.7 billion in debt owed to international commercial bank creditors. In addition to the banks extending new loans in the aggregate amount of approximately U.S.$3.0 billion, two bond issuances formed part of this restructuring: “new money bonds” and “alternative participation instruments,” or “APIs.” Interest payments to bank creditors were suspended in April 1988 and resumed on a partial basis until the refinancing of medium- and long-term commercial bank debt under the Brady Plan (as described below).
The Brady Plan
In April 1992, the Republic announced a refinancing agreement under the Brady Plan relating to medium- and long-term debt owed to commercial banks. The Brady Plan applied to an estimated U.S.$28.5 billion in debt, including an estimated U.S.$9.3 billion in interest arrears, representing over 96.0% of the commercial bank debt then outstanding. The Brady Plan effected a reduction of approximately U.S.$3 billion in the nominal amount of the Republic’s foreign debt.
Over 96.0% of the commercial bank debt was refinanced pursuant to the Brady Plan. The Brady Plan provided for the issuance of par bonds, discount bonds and floating rate bonds, and a cash payout of U.S.$700 million in exchange for previously outstanding commercial bank debt of U.S.$28.5 billion, which included U.S.$9.3 billion of interest in arrears.
The Republic serviced the Brady Bonds until its default in 2001. Approximately 95.7% of the then outstanding U.S. dollar-denominated Brady Bonds and 81.3% of the then-outstanding euro-denominated Brady Bonds were exchanged in the 2005 Debt Exchange.
In March 2023, Citibank, N.A.’s New York and Frankfurt branches, in their role as fiscal agents with respect to the Republic’s 2038 Par Bonds and 2030 Discount Bonds, requested the Federal Reserve Bank of New York to liquidate the guarantees for the payment of such series of bonds in a portion required to comply with the attachment ordered by the Second Circuit Court of Appeals.
D-144
2001 Debt Crisis
On December 24, 2001, the Government (under the temporary administration of President Rodríguez Saá) declared a moratorium on a substantial portion of the Republic’s public debt. President Duhalde, his successor, endorsed the moratorium when he took office some days later. The Public Emergency Law, enacted on January 6, 2002, authorized the Government to take the measures necessary to create conditions for an economic recovery and to restructure the Republic’s public debt.
On February 6, 2002, the Government officially suspended payments on the Republic’s public debt and authorized the Ministry of Economy to undertake a restructuring of these obligations. Subsequently, the Government issued various measures refining the scope of the suspension of debt payments. As a result of these measures, the Government continued to meet its debt obligations to the following creditors:
| | multilateral official lenders; |
| | creditors that agreed to the pesification of their National Guaranteed Loans; |
| | holders of new bonds (such as Boden) issued after the Government announced the suspension of debt payments; and |
| | certain other categories of public debt. |
2005 Debt Exchange
On January 14, 2005, Argentina invited holders of 152 different series of securities on which it had defaulted in 2001 to exchange their defaulted debt for 2038 Par Bonds, 2045 Quasi-Par Bonds, 2033 Discount Bonds and 2035 GDP-Linked Securities. The aggregate eligible amount of securities that were eligible to participate in the exchange (including principal of the eligible securities plus accrued but unpaid interest accumulated through December 2001) was approximately U.S.$81.8 billion. The aggregate eligible amount of securities tendered in the 2005 Debt Exchange was (in each case together with past due interest) approximately U.S.$62.3 billion, representing 76.2% of the aggregate eligible amount of eligible securities.
Depending on the security tendered and the time of tender, holders of eligible securities who participated in the 2005 Debt Exchange were entitled to receive, in exchange for their securities, different combinations of the following:
| | the 2038 Par Bonds due December 31, 2038; |
| | the 2033 Discount Bonds due December 31, 2033; |
| | the 2045 Quasi-Par Bonds due December 31, 2045; and |
| | the 2035 GDP-Linked Securities with a notional amount of GDP-linked securities expiring no later than December 15, 2035. |
Brady bondholders tendered Brady Bonds for an aggregate principal amount of approximately U.S.$2.8 billion and 235 million and received their present value in cash from the redemption of the Brady Bonds’ principal collateral.
2010 Debt Exchange
On April 30, 2010, Argentina launched an invitation to holders of the securities issued in the 2005 Debt Exchange and of 149 different series of securities on which it had defaulted in 2001 to exchange such debt for the new securities described below and, in certain cases, a cash payment (the “April Invitation”).
D-145
Holders of eligible securities who participated in either the April Invitation or in the offer conducted by Argentina in Japan concurrently with the April Invitation were entitled to receive, in exchange for their securities, different combinations of the following:
| | the 2033 Discount Bonds (2010) due December 2033 and denominated in U.S. dollars, euros, Japanese yen and pesos; |
| | the 2038 Par Bonds (2010) due December 2038 and denominated in U.S. dollars, euros, Japanese yen and pesos; |
| | the 2017 Globals due 2017 and denominated in U.S. dollars; and |
| | the 2035 GDP-Linked Securities (2010) expiring no later than December 2035 and denominated in U.S. dollars, euros, Japanese yen and pesos. |
In December 2010, Argentina launched a reopening of the April Invitation in the domestic market (the “December Invitation”). The December Invitation closed on December 31, 2010.
Holders of eligible securities who participated in the December Invitation were entitled to receive, in exchange for their securities, different combinations of the following:
| | 2033 Discount Bonds (2010) denominated in U.S. dollars and pesos; |
| | 2017 Globals; and |
| | 2035 GDP-Linked Securities (2010) denominated in U.S. dollars and pesos. |
The aggregate eligible amount of securities in default tendered in the 2010 Debt Exchange, totaled approximately U.S.$12.4 billion, representing approximately 66.2% of the aggregate eligible amount of eligible securities.
Brady Bond Invitation
During December 2010, Argentina announced an invitation to the holders of the Brady Bonds, or the “Brady Invitation,” to tender their Brady Bonds in exchange for a combination of 2033 Discount Bonds (2010), 2017 Globals, 2035 GDP-linked Securities (2010) and cash payment. The Brady Invitation was, however, subject to the requirement that the Court of Appeals affirm the lower court’s ruling allowing the release, liquidation and transfer to the tendering holders of the proceeds of the collateral securing the tendered Brady Bonds. On July 20, 2011, the Court of Appeals reversed the lower court. As a result, on August 5, 2011, Argentina cancelled the Brady Invitation without accepting any tenders. All tenders under the Brady Invitation were automatically deemed rejected.
2020 Debt Exchanges
Bonds Governed by Foreign Law
On April 21, 2020, the Republic invited holders of its foreign currency external bonds issued under its 2005 indenture and 2016 indenture holding approximately U.S.$66.5 billion aggregate principal amount, to exchange such bonds for new bonds. The invitation contemplated the use of collective action clauses included in the terms and conditions of the respective bonds, whereby the decision by certain majorities would bind holders that do not tender into the exchange offer. After announcing the invitation, representatives of the Republic held several rounds of discussions with holders of such bonds relating to the terms of the invitation.
On August 17, 2020, the Republic amended the invitation to incorporate bondholders’ feedback and on August 31, 2020 it announced that it had obtained bondholders’ consents required to exchange and or modify 99.01% of the aggregate principal amount outstanding of all series of eligible bonds invited to participate in the exchange offer. The invitation settled on September 4, 2020. As a result of the invitation, the average interest rate paid by the Republic’s foreign currency external bonds was lowered to 3.07%, with a maximum rate of 5.0%, compared to an average interest rate of 7.0% and maximum rate of 8.28% prior to the invitation. In addition, the aggregate amount outstanding of the Republic’s foreign currency external bonds was reduced by 1.9% and the average maturity of such bonds was extended.
Bonds Governed by Argentine Law
On April 5, 2020, the Government enacted Decree No. 346/2020 (i) deferring the payments of principal and interest on certain of its foreign currency bonds governed by Argentine law until December 31, 2020, or until such earlier date as the Ministry of Economy may determine, taking into account the degree of advance in the process designed to restore the sustainability of the Republic’s public debt, and (ii) authorizing the Ministry of Economy to conduct liability management transactions or exchange offers, or to implement restructuring measures affecting foreign currency bonds governed by Argentine law which payments have been deferred pursuant to such Decree.
D-146
On August 18, 2020, the Republic offered holders of its foreign currency bonds governed by Argentine law to exchange such bonds for new bonds, on terms that were substantially comparable to the terms of the invitation made to holders of foreign law-governed bonds. On September 18, 2020, the Republic announced that holders representing 99.4% of the aggregate principal amount outstanding of all series of eligible bonds invited to participate in the local exchange offer had participated. As a result of the exchange offer, the average interest rate paid by the Republic’s foreign currency bonds governed by Argentine law was lowered to 2.4%, compared to an average interest rate of 7.6% prior to the exchange. In addition, the exchange offer extended the average maturity of such bonds.
The Pari Passu Litigation and the Settlement Proposal
Following the Republic’s default on its debt at the end of 2001, creditors filed numerous lawsuits against the Republic in several jurisdictions, including the United States. For additional information regarding litigation in the United States, including the pari passu litigation and the Republic’s Settlement Proposal to settle claims on the Untendered Debt, see “—Legal Proceedings.”
Indirect Debt
The Government guarantees principal and interest payments on certain debt obligations of the provinces and other national and private entities. A portion of these Government guarantees is secured by assets or tax receivables of the Government.
As of December 31, 2025, the Government guaranteed third-party obligations for an aggregate amount of U.S.$9.5 billion (including past due principal and interest) as compared to U.S.$9.4 billion as of December 31, 2024, consisting of the following obligations:
| | U.S.$4.0 billion in provincial debt (including the City of Buenos Aires), all of which was secured by assets of the issuer; |
| | U.S.$1.4 billion in debt owed by public sector entities other than the Government (such as Banco de la Nación Argentina); and |
| | U.S.$4.1 billion in debt of private sector entities. |
Secured Debt
Certain of the Government’s debt obligations are secured by pledges of specific assets, including tax receivables and other forms of collateral. A description of these security arrangements follows:
National Guaranteed Loans. These peso-denominated loans are secured by a pledge of the Government’s share of the revenue derived from the tax on financial transactions and co-participation taxes (i.e., taxes the Government is required to share with the provinces under the Co-Participation Law). As of December 31, 2025, the outstanding principal amount of National Guaranteed Loans was approximately U.S.$926.1 million.
Evolution of Public Debt
From 2021 through 2025, the Republic’s total gross public debt (including Untendered Debt) increased by 25.3% from U.S.$363.2 billion as of December 31, 2021 to U.S.$455.1 billion as of December 31, 2025, mainly as a result of debt issuances exceeding amortization payments and disbursements under the EFF entered into with the IMF. The nominal depreciation of the peso reduced the impact of CER on indexed debt and had a capitalization effect on the Republic’s debt stock.
As of December 31, 2025, foreign currency-denominated debt totaled U.S.$264.1 billion and represented 58.0% of total gross public debt compared to U.S.$257.7 billion and 55.2% of total gross public debt as of December 31, 2024.
As of December 31, 2025, 44.0% of the Republic’s total public debt was held by public sector entities, 34.2% was held by private sector entities (including 0.5% of untendered debt) and 21.8% was held by international organizations.
D-147
The following table sets forth information on the Republic’s total gross public debt as of the dates indicated.
Total Gross Public Debt (1)
(in millions of U.S. dollars)
| 2021 | 2022 | 2023 | 2024 | 2025 | ||||||||||||||||
| Peso-denominated Debt:(2) |
||||||||||||||||||||
| Performing |
U.S.$ | 107,808 | U.S.$ | 131,113 | U.S.$ | 103,745 | U.S.$ | 209,190 | U.S.$ | 190,902 | ||||||||||
| Non-performing principal arrears |
2 | 2 | 1 | 2 | 2 | |||||||||||||||
| Untendered Debt(5) |
56 | 60 | 32 | 60 | 55 | |||||||||||||||
| Total peso-denominated debt |
107,867 | 131,175 | 103,777 | 209,252 | 190,959 | |||||||||||||||
| As a % of total gross public debt |
29.7 | % | 33.1 | % | 28.0 | % | 44.8 | % | 42.0 | % | ||||||||||
| Foreign currency-denominated debt:(4) |
||||||||||||||||||||
| Performing |
252,881 | 262,952 | 264,583 | 255,413 | 261,753 | |||||||||||||||
| Non-performing debt not yet due(3) |
60 | 60 | 60 | 60 | 60 | |||||||||||||||
| Non-performing principal arrears |
34 | 32 | 33 | 32 | 35 | |||||||||||||||
| Non-performing interest arrears |
8 | 8 | 8 | 8 | 9 | |||||||||||||||
| Non-performing compensatory interest |
— | — | — | — | — | |||||||||||||||
| Untendered Debt(5) |
2,383 | 2,328 | 2,313 | 2,256 | 2,364 | |||||||||||||||
| Total foreign currency-denominated debt |
255,367 | 265,381 | 264,583 | 257,669 | 264,118 | |||||||||||||||
| As a % of total gross public debt |
70.3 | % | 66.9 | % | 71.4 | % | 55.2 | % | 58 | % | ||||||||||
|
|
|
|
|
|
|
|
|
|
|
|||||||||||
| Total gross public debt (including arrears)(6) |
363,233 | 396,555 | 370,673 | 466,921 | 455,077 | |||||||||||||||
|
|
|
|
|
|
|
|
|
|
|
|||||||||||
| Collateral and other credits |
(1,764 | ) | (1,818 | ) | (1,279 | ) | (1,370 | ) | (1,317 | ) | ||||||||||
|
|
|
|
|
|
|
|
|
|
|
|||||||||||
| Total public debt less collateral and other credits (including arrears) |
U.S.$ | 361,468 | U.S.$ | 394,737 | U.S.$ | 369,394 | U.S.$ | 465,552 | U.S.$ | 453,759 | ||||||||||
|
|
|
|
|
|
|
|
|
|
|
|||||||||||
| Memorandum items: |
||||||||||||||||||||
| Total gross public debt (including arrears) as a % of GDP(7) |
80.8 | % | 84.8 | % | 154.5 | % | 82.5 | % | 78.1 | % | ||||||||||
|
|
|
|
|
|
|
|
|
|
|
|||||||||||
| Total gross public debt (including arrears) as a % of annual Government revenues |
397.2 | % | 464.9 | % | 927.2 | % | 491.9 | % | 491.7 | % | ||||||||||
|
|
|
|
|
|
|
|
|
|
|
|||||||||||
| Exchange rate(8) |
102.75 | 177.13 | 808.45 | 1,032.50 | 1,459.42 | |||||||||||||||
| CER(8) |
38.64 | 73.50 | 184.93 | 515.52 | 676.81 | |||||||||||||||
| (1) | Total debt was calculated using the exchange rate at the end of each period. |
| (2) | Includes public debt denominated in local currency (public bonds, National Guaranteed Loans, temporary advances from the Central Bank, Treasury notes, Treasury bills, commercial-bank debt, promissory notes and others). Includes debt instruments initially issued in U.S. dollars but converted into pesos. For a list of these instruments, see “—Debt Record.” |
| (3) | For a definition of non-performing debt, see “Certain Defined Terms and Conventions—Certain Defined Terms.” |
| (4) | Includes public debt denominated in foreign currencies (multilateral and bilateral debt, public bonds, Treasury notes, Treasury bills, commercial-bank debt and others). |
| (5) | Includes claims on principal and/or interest that the Republic considers time-barred. |
| (6) | Includes Untendered Debt, collateral and other credits representing an obligation from the main obligor to reimburse the Republic for amounts paid. |
| (7) | GDP figures are expressed in nominal terms. |
| (8) | Exchange rate and CER used to calculate public debt totals for end of each period. |
Source: INDEC and Ministry of Economy.
In 2021, the Republic’s total gross public debt (measured in U.S.$) increased by 8.2% to U.S.$363.2 billion (80.8% of nominal GDP). In 2021, the Republic:
| | issued U.S.$78.0 billion in peso-denominated debt; |
| | issued U.S.$19.8 billion in foreign currency-denominated debt; |
| | capitalized interests for U.S.$260.5 billion; and |
| | made CER-indexation adjustments for U.S.$11.5 billion. |
D-148
These factors were partially offset by principal payments that totaled U.S.$72.7 billion and exchange rate fluctuations that reduced debt by U.S.$8.7 billion.
In 2022, the Republic’s total gross public debt (measured in U.S.$) increased by 9.2% to U.S.$396.6 billion (84.8% of nominal GDP). In 2022, the Republic:
| | issued U.S.$123.8 billion in peso-denominated debt; |
| | issued U.S.$42.9 billion in foreign currency-denominated debt; and |
| | made CER-indexation adjustments for U.S.$7.2 billion. |
These factors were partially offset by principal payments that totaled U.S.$116.7 billion and exchange rate fluctuations that reduced debt by U.S.$24.0 billion.
In 2023, the Republic’s total gross public debt (measured in U.S.$) decreased by 6.5% to U.S.$370.7 billion (154.5% of nominal GDP). In 2023, the Republic:
| | issued U.S.$168.1 billion in peso-denominated debt; |
| | issued U.S.$34.1 billion in foreign currency-denominated debt; and |
| | made CER-indexation adjustments for U.S.$26.1 billion. |
These factors were partially offset by principal payments that totaled U.S.$159.2 billion, exchange rate fluctuations that reduced debt by U.S.$29.6 billion, CER-indexation adjustments that reduced debt by U.S.$37.4 billion and payment of letters of guarantee that reduced debt by U.S.$1.8 billion.
In 2024, the Republic’s total gross public debt (measured in U.S.$) increased by 26.0% to U.S.$466.9 billion (82.6% of nominal GDP). In 2024, the Republic:
| | issued U.S.$167.9 billion in peso-denominated debt; |
| | issued U.S.$31.2 billion in foreign currency-denominated debt (including multilateral debt); |
| | made CER-indexation and exchange rate adjustments on CER-linked debt for U.S.$83.3 billion; and |
| | recorded U.S.$15.9 billion in capitalization. |
These factors were partially offset by principal payments that totaled U.S.$190.5 billion, exchange rate fluctuations that reduced debt by U.S.$11.8 billion, payment of letters of guarantee that reduced debt by U.S.$0.3 billion, and a decrease in guarantees by U.S.$0.1 billion.
In 2025, the Republic’s total gross public debt (measured in U.S. dollars) decreased by 2.5% to U.S.$455.1 billion (representing 78.1% of nominal GDP). In 2025, the Republic:
| | issued U.S.$84.9 billion in peso-denominated debt; |
| | issued U.S.$22.8 billion in foreign currency-denominated debt (including multilateral debt); |
| | made CER-indexation and exchange rate adjustments on CER-linked debt for U.S.$7.7 billion; and |
| | recorded U.S.$69 billion in capitalization. |
The following table sets forth information on intra-public sector issuances between January 1, 2021 and December 31, 2025, which provided financing to the Treasury.
D-149
Intra-Public Sector Issuances(1)
(in millions of U.S. dollars)
| For the year ended December 31, | ||||||||||||||||||||
| 2021 | 2022 | 2023 | 2024 | 2025 | ||||||||||||||||
| Temporary advances(2) |
U.S.$ | 24,225 | U.S.$ | 18,539 | U.S.$ | 16,799 | U.S.$ | 3,986 | U.S.$ | 3,584 | ||||||||||
| Peso-denominated debt |
24,225 | 18,539 | 16,799 | 3,986 | 3,584 | |||||||||||||||
| Foreign currency-denominated debt |
— | — | — | — | — | |||||||||||||||
| Nontransferable notes Central Bank |
13,764 | 11,956 | 14,907 | 37,624 | 137 | |||||||||||||||
| Peso-denominated debt |
— | — | — | 21,936 | — | |||||||||||||||
| Foreign currency-denominated debt(3) |
13,764 | 11,956 | 14,907 | 15,689 | 137 | |||||||||||||||
| Treasury notes |
3,307 | 4,588 | 3,868 | 2,407 | 1,210 | |||||||||||||||
| Peso-denominated debt(4) |
1,131 | 2,245 | 1,541 | — | — | |||||||||||||||
| Foreign currency-denominated debt(5) |
2,176 | 2,342 | 2,328 | 2,407 | 1,210 | |||||||||||||||
| Promissory notes |
861 | 1,222 | — | 988 | — | |||||||||||||||
| Peso-denominated debt(6) |
861 | 1,222 | — | 988 | — | |||||||||||||||
| Foreign currency-denominated debt |
— | — | — | — | — | |||||||||||||||
| Bontes |
257 | 111 | 56 | — | — | |||||||||||||||
| Peso-denominated debt(7) |
257 | 111 | 56 | — | — | |||||||||||||||
| Foreign currency-denominated debt |
— | — | — | — | — | |||||||||||||||
| Bonares |
— | — | — | — | — | |||||||||||||||
| Peso-denominated debt(8) |
— | — | — | — | — | |||||||||||||||
| Foreign currency-denominated debt(9) |
— | — | — | — | — | |||||||||||||||
| Boncers |
— | — | — | — | — | |||||||||||||||
| Peso-denominated debt(10) |
— | — | — | — | — | |||||||||||||||
| Foreign currency-denominated debt |
— | — | — | — | — | |||||||||||||||
| Treasury bills |
— | — | — | — | — | |||||||||||||||
| Peso-denominated debt |
— | — | — | — | — | |||||||||||||||
| Foreign currency-denominated debt |
— | — | — | — | — | |||||||||||||||
| Loans from BNA |
— | — | — | — | — | |||||||||||||||
| Peso-denominated debt |
— | — | — | — | — | |||||||||||||||
| Foreign currency-denominated debt |
— | — | — | — | — | |||||||||||||||
| Total Argentine securities issued |
U.S.$ | 42,414 | U.S.$ | 36,415 | U.S.$ | 35,631 | U.S.$ | 44,890 | U.S.$ | 4,930 | ||||||||||
|
|
|
|
|
|
|
|
|
|
|
|||||||||||
| (1) | The figures in the table show the amount in U.S. dollars of financings entered into with Argentine public agencies, which provided new financing to the Treasury in each of the periods indicated in the table. The total amount for each period set forth in the table does not purport to show the outstanding amount with respect to such financings as of any specified date, but rather purports to show the total amount in U.S. dollars of such financings between January 1 and December 31 for each of the years in the period 2021 to 2025. The exchange rate used is that of the issue date. |
| (2) | Financing from the Central Bank. |
| (3) | Includes nontransferable notes issued to the Central Bank. The applicable rate of these notes is the lesser of LIBOR minus 1% and the yield of international reserves and maturity dates between December 30, 2029 and December 30, 2034. |
| (4) | Treasury notes with an interest rate of BADLAR and maturity dates between January 21, 2019 and June 16, 2023. |
| (5) | Treasury notes with an interest rate of BADLAR and zero rate and maturity dates between March 13, 2020 and March 1, 2023. |
| (6) | Promissory notes with maturity dates between March 15, 2021 and March 15, 2023. |
| (7) | Bontes with an interest rate of BADLAR and BADLAR plus 100 basis point and maturing dates between August 8, 2019 and July 5, 2030. |
| (8) | Bonares with an interest rate ranging from BADLAR plus 200 basis points and maturing on February 8, 2021. |
| (9) | Bonares with a fixed interest rates ranging from 7% to 9% and maturity dates between May 29, 2020 and April 18, 2037. |
| (10) | Boncers with an interest rate ranging from 2.25% to 4.25% and maturity dates between April 28, 2020 and November 29, 2022. |
Source: Ministry of Economy.
D-150
Debt by Interest Rate
The following tables set forth information on the Republic’s total gross public debt by type of interest rates.
Total Gross Public Debt by Type of Interest Rate (1)
(in millions of U.S. dollars)
| As of December 31, | ||||||||||||||||||||
| 2021 | 2022 | 2023 | 2024 | 2025 | ||||||||||||||||
| Fixed rate(2) |
U.S.$ | 183,706 | U.S.$ | 178,009 | U.S.$ | 171,418 | U.S.$ | 175,777 | U.S.$ | 183,625 | ||||||||||
| Floating rate |
124,398 | 139,931 | 139,846 | 165,905 | 175,025 | |||||||||||||||
| BADLAR |
2,152 | 2,378 | 670 | 231 | 153 | |||||||||||||||
| LIBOR |
23,693 | 8,649 | 3,866 | 342 | 301 | |||||||||||||||
| LIBOR minus 1%(3) |
57,509 | 64,837 | 67,190 | 69,286 | 52,534 | |||||||||||||||
| Floating IADB Rate |
85 | — | — | — | — | |||||||||||||||
| IMF |
40,952 | 45,707 | 40,899 | 40,558 | 57,230 | |||||||||||||||
| SOFR |
— | 18,353 | 27,196 | 32,443 | 36,754 | |||||||||||||||
| Others(4) |
7 | 7 | 25 | 23,044 | 28,054 | |||||||||||||||
| Zero rate(5) |
55,129 | 78,615 | 59,409 | 125,240 | 96,427 | |||||||||||||||
|
|
|
|
|
|
|
|
|
|
|
|||||||||||
| Total gross public debt |
U.S.$ | 363,233 | U.S.$ | 396,555 | U.S.$ | 370,673 | U.S.$ | 466,921 | U.S.$ | 455,077 | ||||||||||
|
|
|
|
|
|
|
|
|
|
|
|||||||||||
| (1) | Includes past due principal and interest (including Untendered Debt). |
| (2) | Includes bonds, the principal amount of which is adjusted for inflation in the Republic as measured by CER. The amount of such CER-linked debt (including past due principal and interest payments) was U.S.$18.0 billion as of December 31, 2025. |
| (3) | Nontransferable notes issued to the Central Bank (with maturities between 2025 and 2034), which were issued as compensation for the cancellation of debt with the IMF, private debt holders, multilateral agencies and bilateral lenders. The applicable rate of these notes is the lower of LIBOR (or, in the case of more recently issued series, SOFR) minus 1% and the yield of international reserves. |
| (4) | Includes savings accounts interest rate and others. |
| (5) | Includes temporary advances from the Central Bank, guaranteed treasury notes for renewable energy projects, treasury notes, promissory notes and discount rate treasury bills. As of December 31, 2021, the aggregate amount outstanding under temporary advances from the Central Bank was U.S.$21.1 billion, the amount of guaranteed treasury notes for renewable energy was U.S.$6.4 billion, the amount of promissory notes was U.S.$1.2 billion, the amount of treasury notes was U.S.$2.5 billion, the amount of Guarantees (Avales) was U.S.$0.8 billion, the amount of commercial bank loans was U.S.$2.5 billion and the amount of treasury bills was U.S.$21.2 billion. As of December 31, 2022, the aggregate amount outstanding under temporary advances from the Central Bank was U.S.$15.8 billion, the amount of guaranteed treasury notes for renewable energy was U.S.$5.1billion, the amount of promissory notes was U.S.$1.4 billion, the amount of treasury notes was U.S.$1.7 billion, the amount of Guarantees (Avales) was U.S.$0.8 billion, the amount of commercial bank loans was U.S.$2.7 billion and the amount of treasury bills was U.S.$30.7 billion. As of December 31, 2023, the aggregate amount outstanding under temporary advances from the Central Bank was U.S.$5.1 billion, the amount of guaranteed treasury notes for renewable energy was U.S.$4.7 billion, the amount of promissory notes was U.S.$0.2 billion, the amount of treasury notes was U.S.$1.2 billion, the amount of Guarantees (Avales) was U.S.$0.5 billion, the amount of commercial bank loans was U.S.$1.2 billion and the amount of treasury bills was U.S.$5.1 billion. As of December 31, 2024, the aggregate amount outstanding under temporary advances from the Central Bank was U.S.$4.0 billion, the amount of guaranteed treasury notes for renewable energy was U.S.$4.4 billion, the amount of promissory notes was U.S.$1.5 billion, the amount of Guarantees (Avales) was U.S.$1.0 billion, the amount of commercial bank loans was U.S.$0.9 billion and the amount of treasury bills was U.S.$28.5 billion. As of December 31, 2025, the aggregate amount outstanding under temporary advances from the Central Bank was U.S.$2.8 billion, the amount of guaranteed treasury notes for renewable energy was U.S.$4.1 billion, the amount of promissory notes was U.S.$0.5 billion, the amount of Guarantees (Avales) was U.S.$1.4 billion, the amount of commercial bank loans was U.S.$0.7 billion and the amount of treasury bills was U.S.$54.1 billion. |
Source: Ministry of Economy.
D-151
Total Gross Public Debt by Type of Interest Rate (1)
(% of total gross public debt)
| As of December 31, | ||||||||||||||||||||
| 2021 | 2022 | 2023 | 2024 | 2025 | ||||||||||||||||
| Fixed rate(2) |
50.6 | % | 44.9 | % | 46.2 | % | 37.6 | % | 40.4 | % | ||||||||||
| Floating rate |
34.2 | 35.3 | 37.7 | 35.5 | 38.5 | |||||||||||||||
| BADLAR |
0.6 | 0.6 | 0.2 | — | — | |||||||||||||||
| LIBOR |
6.5 | 2.2 | 1.0 | 0.1 | 0.1 | |||||||||||||||
| LIBOR minus 1%(3) |
15.8 | 16.4 | 18.1 | 14.8 | 11.5 | |||||||||||||||
| Floating IADB Rate |
0.02 | — | — | — | — | |||||||||||||||
| IMF |
11.3 | 11.5 | 11.0 | 8.7 | 12.6 | |||||||||||||||
| SOFR |
— | — | 7.3 | 6.9 | 8.1 | |||||||||||||||
| Others(4) |
— | — | — | 4.9 | 6.2 | |||||||||||||||
| Zero rate(5) |
15.2 | 19.8 | 16.0 | 26.8 | 21.2 | |||||||||||||||
|
|
|
|
|
|
|
|
|
|
|
|||||||||||
| Total gross public debt |
100.0 | % | 100.0 | % | 100.0 | % | 100.0 | % | 100.0 | % | ||||||||||
|
|
|
|
|
|
|
|
|
|
|
|||||||||||
| (1) | Includes past due principal and interest (including Untendered Debt). |
| (2) | Includes bonds, the principal amount of which is adjusted for inflation in the Republic as measured by CER. The amount of such CER-linked debt (including past due principal and interest payments) was U.S.$18.0 billion as of December 31, 2025. |
| (3) | Nontransferable notes issued to the Central Bank (Central Bank 2020, 2021, 2022, 2023, 2024, 2025, 2026, 2029, 2030, 2031 and 2032), which were issued as compensation for the cancellation of debt with the IMF, private debt holders, multilateral agencies and bilateral lenders. The applicable rate of these notes is the minimum of LIBOR minus 1% and the yield of international reserves. |
| (4) | Includes savings accounts interest rate and others. |
| (5) | Includes temporary advances from the Central Bank, guaranteed treasury notes for renewable energy projects, treasury notes, promissory notes and discount rate treasury bills. As of December 31, 2021, the aggregate amount outstanding under temporary advances from the Central Bank was U.S.$21.1 billion, the amount of guaranteed treasury notes for renewable energy was U.S.$6.4 billion, the amount of promissory notes was U.S.$1.2 billion, the amount of treasury notes was U.S.$2.5 billion, the amount of Guarantees (Avales) was U.S.$0.8 billion, the amount of commercial bank loans was U.S.$2.5 billion and the amount of treasury bills was U.S.$21.2 billion. As of December 31, 2022, the aggregate amount outstanding under temporary advances from the Central Bank was U.S.$15.8 billion, the amount of guaranteed treasury notes for renewable energy was U.S.$5.1billion, the amount of promissory notes was U.S.$1.4 billion, the amount of treasury notes was U.S.$1.7 billion, the amount of Guarantees (Avales) was U.S.$0.8 billion, the amount of commercial bank loans was U.S.$2.7 billion and the amount of treasury bills was U.S.$30.7 billion. As of December 31, 2023, the aggregate amount outstanding under temporary advances from the Central Bank was U.S.$5.1 billion, the amount of guaranteed treasury notes for renewable energy was U.S.$4.7 billion, the amount of promissory notes was U.S.$0.2 billion, the amount of treasury notes was U.S.$1.2 billion, the amount of Guarantees (Avales) was U.S.$0.5 billion, the amount of commercial bank loans was U.S.$1.2 billion and the amount of treasury bills was U.S.$5.1 billion. As of December 31, 2024, the aggregate amount outstanding under temporary advances from the Central Bank was U.S.$4.0 billion, the amount of guaranteed treasury notes for renewable energy was U.S.$4.4 billion, the amount of promissory notes was U.S.$1.5 billion, the amount of Guarantees (Avales) was U.S.$1.0 billion, the amount of commercial bank loans was U.S.$0.9 billion and the amount of treasury bills was U.S.$28.5 billion. As of December 31, 2025, the aggregate amount outstanding under temporary advances from the Central Bank was U.S.$2.8 billion, the amount of guaranteed treasury notes for renewable energy was U.S.$4.1 billion, the amount of promissory notes was U.S.$0.5 billion, the amount of Guarantees (Avales) was U.S.$1.4 billion, the amount of commercial bank loans was U.S.$0.7 billion and the amount of treasury bills was U.S.$54.1 billion. |
Source: INDEC and Ministry of Economy.
As of December 31, 2025, the composition of the public debt (excluding Untendered Debt) by interest rate included:
| | fixed rate peso-denominated debt, such as Boncers, Bontes, 2045 Quasi-Par Bonds, 2033 Discount Bonds, National Guaranteed Loans, 2038 Par Bonds, Promissory Notes, Bonar, Bocones, Boncap, Lecap and others; |
| | fixed rate foreign currency-denominated debt, such as U.S. dollar-denominated and euro-denominated bonds issued in the 2020 Debt Exchanges, multilateral debt, bilateral debt, 2038 Par Bonds, commercial banks loans, 2033 Discount Bonds and Bonar, Global and others; |
| | zero rate peso-denominated debt, such as Treasury bills, temporary advances from the Central Bank, commercial bank loans, Promissory notes and others; |
| | zero rate foreign currency-denominated debt, such as Guaranteed Treasury notes for renewable energy projects, Guarantees and multilateral debt; |
| | floating rate peso-denominated debt, such as Bontes, Bocones and others, and all debt issued at BADLAR, savings, Lebacs, TAMAR or term deposit interest rates; and |
D-152
| | floating rate foreign currency-denominated debt, such as LIBOR rate instruments, loans from multilateral organizations (including the IMF) and bilateral debt, nontransferable notes issued to the Central Bank (Central Bank 2029, 2030, 2031, 2032, 2033 and 2034, in compensation for advances applied to cancel the debt with private creditors, multilateral organizations and bilateral lenders), and nontransferable notes issued to the Central Bank for an increase in the Republic of Argentina’s quota in the IMF, a portion of the bilateral debt and IADB rate loans. |
Maturity Profile
For purposes of its debt maturity profile, the Republic divides its debt into three categories: short-term debt, medium- and long-term debt, arrears and Untendered Debt. Principal and interest arrears, having already matured, are not included in the amount of short-term or medium- and long-term debt but are included in the total amount of debt outstanding. Compensatory and default interest and Untendered Debt are also included in the total amount of debt outstanding.
The following tables set forth the Republic’s total public debt by term as of the dates indicated.
Total Gross Public Debt by Term
(in millions of U.S. dollars)
| As of December 31, | ||||||||||||||||||||
| 2021 | 2022 | 2023 | 2024 | 2025 | ||||||||||||||||
| Short-term(1) |
U.S.$ | 34,921 | U.S.$ | 48,687 | U.S.$ | 15,663 | U.S.$ | 58,450 | U.S.$ | 58,095 | ||||||||||
| Medium-term and long-term(2) |
325,768 | 345,377 | 352,562 | 406,053 | 394,456 | |||||||||||||||
| Arrears: |
||||||||||||||||||||
| Principal |
96 | 95 | 94 | 94 | 97 | |||||||||||||||
| Interest |
8 | 8 | 8 | 8 | 9 | |||||||||||||||
| Compensatory Interest(3) |
— | — | — | — | — | |||||||||||||||
|
|
|
|
|
|
|
|
|
|
|
|||||||||||
| Total arrears |
105 | 103 | 102 | 102 | 106 | |||||||||||||||
|
|
|
|
|
|
|
|
|
|
|
|||||||||||
| Untendered Debt(4) |
2,439 | 2,388 | 2,345 | 2,316 | 2,420 | |||||||||||||||
|
|
|
|
|
|
|
|
|
|
|
|||||||||||
| Total gross public debt(5) |
U.S.$ | 363,233 | U.S.$ | 396,555 | U.S.$ | 370,673 | U.S.$ | 466,921 | U.S.$ | 455,077 | ||||||||||
|
|
|
|
|
|
|
|
|
|
|
|||||||||||
| (1) | Debt with original maturity of one year or less. |
| (2) | Debt with original maturity of more than one year. |
| (3) | Compensatory interest is estimated by reference to contractual rates. |
| (4) | Includes claims on principal and/or interest that the Republic considers time-barred. |
| (5) | Amounts include Untendered Debt. |
Source: Ministry of Economy.
Total Gross Public Debt by Term
(% of total gross public debt)
| As of December 31, | ||||||||||||||||||||
| 2021 | 2022 | 2023 | 2024 | 2025 | ||||||||||||||||
| Short-term(1) |
9.6 | % | 12.3 | % | 4.2 | % | 12.5 | % | 12.8 | % | ||||||||||
| Medium-term and long-term(2) |
89.7 | 87.1 | 95.1 | 87.0 | 86.7 | |||||||||||||||
| Arrears: |
— | — | — | — | — | |||||||||||||||
| Principal |
0.03 | 0.02 | 0.03 | 0.02 | 0.02 | |||||||||||||||
| Interest |
— | — | — | — | — | |||||||||||||||
| Compensatory Interest(3) |
— | — | — | — | — | |||||||||||||||
|
|
|
|
|
|
|
|
|
|
|
|||||||||||
| Total arrears |
0.03 | 0.03 | 0.03 | 0.02 | 0.02 | |||||||||||||||
|
|
|
|
|
|
|
|
|
|
|
|||||||||||
| Untendered Debt(4) |
0.7 | 0.6 | 0.6 | 0.5 | 0.5 | |||||||||||||||
|
|
|
|
|
|
|
|
|
|
|
|||||||||||
| Total gross public debt(5) |
100.0 | % | 100.0 | % | 100.0 | % | 100.0 | % | 100.0 | % | ||||||||||
|
|
|
|
|
|
|
|
|
|
|
|||||||||||
| (1) | Debt with original maturity of one year or less. |
| (2) | Debt with original maturity of more than one year. Includes Bonares due 2024, Bonares due 2025 and Bonares due 2037 issued in 2017, 2018 and 2019 as part of certain transactions granting the Republic the right to cause the cancellation of such Bonares upon the payment by the Republic of the amounts specified under such transactions. The outstanding Bonares due 2024, Bonares due 2025 and Bonares due 2037 involved in the sales were cancelled in August 2019. Also includes Bonares and Global bonds issued in 2020. |
| (3) | Compensatory interest is estimated by reference to contractual rates. |
| (4) | Includes claims on principal and/or interest that the Republic considers time-barred. |
| (5) | Amounts include Untendered Debt. |
Source: Ministry of Economy.
D-153
The Republic’s short-term debt increased to 12.8% of total gross public debt as of December 31, 2025 from 9.6% as of December 31, 2021, primarily due to an increase in treasury bills from U.S.$23.0 billion in 2021 to U.S.$55.3 billion in 2025.
In 2025, the Republic’s short-term debt decreased by 0.6% to U.S.$58.1 billion from U.S.$58.4 billion in 2024, primarily due to a decrease in (i) short-term peso bonds from U.S.$24.3 billion in 2024 to U.S.$0 in 2025, and (ii) temporary advances from the Central Bank from U.S.$3.4 billion in 2024 to U.S.$2.8 billion in 2025.
The Republic’s medium- and long-term debt decreased in relative terms to 86.7% of total gross public debt as of December 31, 2025 compared to 89.7% of total gross public debt as of December 31, 2021, and increased in absolute terms by U.S.$68.7 billion to U.S.$394.4 billion as of December 31, 2025 from U.S.$325.8 billion as of December 31, 2021, primarily due to disbursements under facility agreements with international organizations, issuances exceeding amortization payments, inflation adjustment of certain outstanding bonds, and compounding interest. These factors were partially offset by the nominal depreciation of the peso, which reduced peso-denominated debt when expressed in U.S. dollars.
Distribution of Total Gross Public Debt by Type of Creditor and Term
The following tables set forth information relating to the Republic’s performing and non-performing public debt (including Untendered Debt) by creditor.
Total Gross Performing and Non-Performing Public Debt by Creditor
(in millions of U.S. dollars)
| As of December 31, | ||||||||||||||||||||
| 2021 | 2022 | 2023 | 2024 | 2025 | ||||||||||||||||
| Performing debt |
||||||||||||||||||||
| Medium-term and long-term debt: |
||||||||||||||||||||
| Official debt: |
||||||||||||||||||||
| Multilateral debt: |
||||||||||||||||||||
| IMF |
U.S.$ | 40,952 | U.S.$ | 45,707 | U.S.$ | 40,899 | U.S.$ | 40,558 | U.S.$ | 57,230 | ||||||||||
| Inter-American Development Bank |
14,052 | 15,648 | 16,511 | 17,572 | 19,301 | |||||||||||||||
| World Bank |
8,517 | 9,205 | 9,889 | 10,738 | 12,807 | |||||||||||||||
| Corporación Andina de Fomento |
3,781 | 3,931 | 5,435 | 4,800 | 4,842 | |||||||||||||||
| FONPLATA |
404 | 491 | 461 | 644 | 599 | |||||||||||||||
| European Investment Bank |
122 | 211 | 225 | 229 | 222 | |||||||||||||||
| International Fund for the Development of Agriculture |
34 | 36 | 48 | 40 | 39 | |||||||||||||||
| Central American Bank for Economic Integration |
79 | 138 | 590 | 758 | 955 | |||||||||||||||
| The OPEC Fund for International Development |
124 | 145 | 158 | 146 | 136 | |||||||||||||||
| Total multilateral debt |
68,065 | 75,512 | 74,215 | 75,486 | 96,131 | |||||||||||||||
| Paris Club |
1,714 | 1,928 | 1,613 | 1,181 | 843 | |||||||||||||||
| Bilateral debt |
2,996 | 3,122 | 3,059 | 2,713 | 2,386 | |||||||||||||||
| Total bilateral debt |
4,710 | 5,049 | 4,672 | 3,795 | 3,229 | |||||||||||||||
| Total official debt |
72,775 | 80,561 | 78,887 | 79,280 | 99,360 | |||||||||||||||
|
|
|
|
|
|
|
|
|
|
|
|||||||||||
D-154
| As of December 31, | ||||||||||||||||||||
| 2021 | 2022 | 2023 | 2024 | 2025 | ||||||||||||||||
| Bonds: |
||||||||||||||||||||
| Peso-denominated bonds |
60,334 | 65,639 | 85,521 | 149,249 | 132,167 | |||||||||||||||
| Foreign currency-denominated bonds |
170,035 | 173,891 | 177,904 | 168,746 | 155,339 | |||||||||||||||
|
|
|
|
|
|
|
|
|
|
|
|||||||||||
| Total bonds |
230,369 | 239,530 | 263,425 | 317,995 | 287,507 | |||||||||||||||
|
|
|
|
|
|
|
|
|
|
|
|||||||||||
| Treasury bills:(1) |
||||||||||||||||||||
| Peso-denominated bills |
2,187 | 7,829 | — | — | — | |||||||||||||||
| Foreign currency-denominated bills |
7 | — | — | — | — | |||||||||||||||
| Total Treasury bills |
2,193 | 7,829 | — | — | — | |||||||||||||||
| Temporary advances from the Central Bank |
7,864 | 6,380 | 2,193 | 525 | — | |||||||||||||||
| Treasury notes:(2) |
||||||||||||||||||||
| Peso-denominated notes |
125 | 66 | — | — | — | |||||||||||||||
| Foreign currency denominated notes |
705 | 493 | 45 | — | — | |||||||||||||||
| Total Treasury notes |
829 | 560 | 45 | — | — | |||||||||||||||
| Commercial banks |
2,530 | 2,745 | 1,195 | 919 | 682 | |||||||||||||||
| National Guaranteed Loans |
751 | 829 | 457 | 997 | 926 | |||||||||||||||
| Guaranteed Debt |
||||||||||||||||||||
| Promissory notes |
379 | 418 | 230 | 503 | 467 | |||||||||||||||
| Guarantees (Avales) |
1,667 | 1,428 | 1,470 | 1,453 | 1,422 | |||||||||||||||
| Guaranteed Treasury notes |
6,410 | 5,097 | 4,659 | 4,380 | 4,092 | |||||||||||||||
|
|
|
|
|
|
|
|
|
|
|
|||||||||||
| Total Guaranteed Debt |
8,456 | 6,943 | 6,359 | 6,336 | 5,981 | |||||||||||||||
|
|
|
|
|
|
|
|
|
|
|
|||||||||||
| Total medium-term and long-term debt |
325,768 | 345,377 | 352,562 | 406,053 | 394,456 | |||||||||||||||
|
|
|
|
|
|
|
|
|
|
|
|||||||||||
| Short-term debt: |
||||||||||||||||||||
| Bonds:(3) |
||||||||||||||||||||
| Peso-denominated bonds |
— | 14,301 | 6,525 | 24,350 | — | |||||||||||||||
| Foreign-currency-denominated bonds |
— | — | — | — | — | |||||||||||||||
| Total Bonds |
— | 14,301 | 6,525 | 24,350 | — | |||||||||||||||
| Treasury bills:(4) |
||||||||||||||||||||
| Peso-denominated bills |
19,041 | 21,990 | 5,097 | 28,498 | 54,069 | |||||||||||||||
| Foreign currency-denominated bills |
— | — | 1,174 | 1,197 | 1,210 | |||||||||||||||
| Total Treasury bills |
19,041 | 21,990 | 6,271 | 29,695 | 55,278 | |||||||||||||||
| Treasury notes:(5) |
||||||||||||||||||||
| Peso-denominated |
550 | 857 | — | — | — | |||||||||||||||
| Foreign currency-denominated bills |
1,096 | 1,134 | — | — | — | |||||||||||||||
| Total Treasury notes |
1,647 | 1,992 | — | — | — | |||||||||||||||
| Temporary advances from the Central Bank |
13,285 | 9,389 | 2,867 | 3,437 | 2,803 | |||||||||||||||
| Promissory notes |
827 | 1,016 | — | 968 | — | |||||||||||||||
| Guarantees (Avales) |
121 | 0.50 | — | — | 13.9 | |||||||||||||||
| Commercial banks |
— | — | — | — | — | |||||||||||||||
| Total short-term debt |
34,921 | 48,687 | 15,663 | 58,450 | 58,095 | |||||||||||||||
|
|
|
|
|
|
|
|
|
|
|
|||||||||||
| Total performing debt |
360,689 | 394,064 | 368,225 | 464,503 | 452,551 | |||||||||||||||
|
|
|
|
|
|
|
|
|
|
|
|||||||||||
| Non-performing debt(6) |
||||||||||||||||||||
| Non-performing debt not yet due: |
||||||||||||||||||||
| Medium-term and long-term debt: |
||||||||||||||||||||
| Bilateral debt(7) |
— | — | — | — | — | |||||||||||||||
| Suppliers |
— | — | — | — | — | |||||||||||||||
| Guarantees (Avales) |
60 | 60 | 60 | 60 | 60 | |||||||||||||||
|
|
|
|
|
|
|
|
|
|
|
|||||||||||
| Total non-performing debt not yet due |
60 | 60 | 60 | 60 | 60 | |||||||||||||||
|
|
|
|
|
|
|
|
|
|
|
|||||||||||
D-155
| As of December 31, | ||||||||||||||||||||
| 2021 | 2022 | 2023 | 2024 | 2025 | ||||||||||||||||
| Non-performing principal and interest arrears: |
||||||||||||||||||||
| Paris Club |
— | — | — | — | — | |||||||||||||||
| Other bilateral debt |
— | — | — | — | — | |||||||||||||||
| Commercial banks |
34 | 32 | 33 | 31 | 35 | |||||||||||||||
| Suppliers |
10 | 11 | 10 | 11 | 11 | |||||||||||||||
| Compensatory interest |
— | — | — | — | — | |||||||||||||||
|
|
|
|
|
|
|
|
|
|
|
|||||||||||
| Total non-performing principal and interest arrears |
44 | 42 | 42 | 42 | 45 | |||||||||||||||
|
|
|
|
|
|
|
|
|
|
|
|||||||||||
| Total non-performing debt |
105 | 103 | 103 | 102 | 106 | |||||||||||||||
|
|
|
|
|
|
|
|
|
|
|
|||||||||||
| Untendered Debt(8) |
2,439 | 2,388 | 2,346 | 2,316 | 2,420 | |||||||||||||||
|
|
|
|
|
|
|
|
|
|
|
|||||||||||
| Total gross public debt including arrears(9) |
U.S.$ | 335,582 | U.S.$ | 363,233 | U.S.$ | 396,555 | U.S.$ | 466,921 | U.S.$ | 455,077 | ||||||||||
|
|
|
|
|
|
|
|
|
|
|
|||||||||||
| (1) | Includes medium and long term negotiable instruments issued by public auctioning or private placements, such as Letes, Lecaps, Lecer, Lelink, Lepas and Ledes. |
| (2) | Includes medium and long term non-negotiable instruments held by public-sector entities or certain private entities specifically, China Machinery Engineering Argentina S.A. (“CMEA”). |
| (3) | Includes Bonares due 2024, Bonares due 2025 and Bonares due 2037 issued in 2017, 2018 and 2019 as part of certain transactions granting the Republic the right to cause the cancellation of such Bonares upon the payment by the Republic of the amounts specified under such transactions. In 2024, includes outstanding Boncer due 2025. |
| (4) | Includes short term negotiable instruments issued by public auctioning or private placements, such as Letes, Lecaps, Lecer, Lelink, Lebad, Ledes and Lelites. |
| (5) | Includes short term non-negotiable instruments held by public-sector entities or certain private entities. |
| (6) | For a definition of non-performing debt, see “Certain Defined Terms and Conventions—Certain Defined Terms.” |
| (7) | Bilateral debt is debt with sovereign governments. |
| (8) | Includes claims on principal and/or interest that the Republic considers time-barred. |
| (9) | Figures include Untendered Debt. |
Source: Ministry of Economy.
Total Gross Performing and Non-Performing Public Debt by Creditor
(as a % of total gross public debt)
| As of December 31, | ||||||||||||||||||||
| 2021 | 2022 | 2023 | 2024 | 2025 | ||||||||||||||||
| Performing debt |
||||||||||||||||||||
| Medium-term and long-term debt: |
||||||||||||||||||||
| Official debt: |
||||||||||||||||||||
| Multilateral debt: |
||||||||||||||||||||
| IMF |
11.3 | % | 11.5 | % | 11.0 | % | 8.7 | % | 12.6 | % | ||||||||||
| Inter-American Development Bank |
3.9 | 3.9 | 4.5 | 3.8 | 4.2 | |||||||||||||||
| World Bank |
2.3 | 2.3 | 2.7 | 2.3 | 2.8 | |||||||||||||||
| Corporación Andina de Fomento |
1.0 | 1.0 | 1.5 | 1.0 | 1.1 | |||||||||||||||
| FONPLATA |
0.1 | 0.1 | 0.1 | 0.1 | 0.1 | |||||||||||||||
| European Investment Bank |
0.03 | 0.05 | 0.06 | 0.05 | 0.05 | |||||||||||||||
| International Fund for the Development of Agriculture |
0.01 | 0.01 | 0.01 | 0.01 | 0.01 | |||||||||||||||
| Central American Bank for Economic Integration |
0.02 | 0.03 | 0.16 | 0.16 | 0.21 | |||||||||||||||
| The OPEC Fund for International Development |
0.03 | 0.04 | 0.04 | 0.03 | 0.03 | |||||||||||||||
| Total multilateral debt |
18.7 | 19.0 | 20.0 | 16.2 | 21.1 | |||||||||||||||
| Paris Club |
0.5 | 0.5 | 0.4 | 0.3 | 0.2 | |||||||||||||||
| Bilateral debt |
0.8 | 0.8 | 0.8 | 0.6 | 0.5 | |||||||||||||||
|
|
|
|
|
|
|
|
|
|
|
|||||||||||
| Total bilateral debt |
1.3 | 1.3 | 1.3 | 0.8 | 0.7 | |||||||||||||||
|
|
|
|
|
|
|
|
|
|
|
|||||||||||
| Total official debt |
20.0 | 20.3 | 21.3 | 17.0 | 21.8 | |||||||||||||||
|
|
|
|
|
|
|
|
|
|
|
|||||||||||
D-156
| + | As of December 31, | |||||||||||||||||||
| 2021 | 2022 | 2023 | 2024 | 2025 | ||||||||||||||||
| Bonds: |
||||||||||||||||||||
| Peso-denominated bonds |
16.6 | 16.6 | 23.1 | 32.0 | 29.0 | |||||||||||||||
| Foreign currency-denominated bonds |
46.8 | 43.9 | 48.0 | 36.1 | 34.1 | |||||||||||||||
|
|
|
|
|
|
|
|
|
|
|
|||||||||||
| Total Bonds |
63.4 | 60.4 | 71.1 | 68.1 | 63.2 | |||||||||||||||
|
|
|
|
|
|
|
|
|
|
|
|||||||||||
| Treasury Bills: |
||||||||||||||||||||
| Peso-denominated treasury bills |
0.6 | 2.0 | — | — | — | |||||||||||||||
| Foreign currency-denominated treasury bills |
— | 0.3 | — | — | — | |||||||||||||||
| Total Treasury Bills |
0.6 | 2.0 | — | — | — | |||||||||||||||
| Temporary advances from the Central Bank |
2.2 | 1.6 | 0.6 | 0.1 | — | |||||||||||||||
| Treasury notes |
||||||||||||||||||||
| Peso-denominated treasury notes |
0.03 | 0.02 | — | — | — | |||||||||||||||
| Foreign currency-denominated treasury notes |
0.2 | 0.1 | — | — | — | |||||||||||||||
| Total Treasury notes |
0.2 | 0.1 | — | — | — | |||||||||||||||
| Commercial banks |
0.7 | 0.7 | 0.3 | 0.2 | 0.1 | |||||||||||||||
| National Guaranteed Loans |
0.2 | 0.2 | 0.1 | 0.2 | 0.2 | |||||||||||||||
| Guaranteed Debt: |
||||||||||||||||||||
| Promissory notes |
0.1 | 0.1 | 0.1 | 0.1 | 0.1 | |||||||||||||||
| Guarantees (Avales) |
0.5 | 0.4 | 0.4 | 0.3 | 0.3 | |||||||||||||||
| Guaranteed Treasury notes |
1.8 | 1.3 | 1.3 | 0.9 | 0.9 | |||||||||||||||
| Total Guaranteed Debt |
2.3 | 1.8 | 1.7 | 1.4 | 1.3 | |||||||||||||||
|
|
|
|
|
|
|
|
|
|
|
|||||||||||
| Total medium-term and long-term debt |
89.7 | 87.1 | 95.1 | 87.0 | 86.7 | |||||||||||||||
|
|
|
|
|
|
|
|
|
|
|
|||||||||||
| Short-term debt: |
||||||||||||||||||||
| Bonds: |
||||||||||||||||||||
| Peso-denominated bonds |
— | 3.6 | 1.8 | 5.2 | — | |||||||||||||||
| Foreign currency-denominated bonds |
— | — | — | — | — | |||||||||||||||
| Total Bonds |
— | 3.6 | 1.8 | 5.2 | — | |||||||||||||||
| Treasury bills: |
||||||||||||||||||||
| Peso-denominated bills |
5.2 | 5.5 | 1.4 | 6.1 | 11.9 | |||||||||||||||
| Foreign currency-denominated bills |
— | — | 0.3 | 0.3 | 0.3 | |||||||||||||||
| Total Treasury bills |
5.2 | 5.5 | 1.7 | 6.4 | 12.1 | |||||||||||||||
| Treasury notes: |
||||||||||||||||||||
| Peso-denominated treasury notes |
0.2 | 0.2 | — | — | — | |||||||||||||||
| Foreign currency-denominated treasury notes |
0.3 | 0.3 | — | — | — | |||||||||||||||
| Total Treasury notes |
0.5 | 0.5 | — | — | — | |||||||||||||||
| Temporary advances from the Central Bank |
3.7 | 2.4 | 0.8 | 0.7 | 0.6 | |||||||||||||||
| Promissory notes |
0.2 | 0.3 | — | — | — | |||||||||||||||
| Guarantees (Avales) |
0.03 | — | — | 0.2 | — | |||||||||||||||
| Commercial banks |
— | — | — | — | — | |||||||||||||||
| Total short term debt |
9.6 | 12.3 | 4.2 | 12.5 | 12.8 | |||||||||||||||
|
|
|
|
|
|
|
|
|
|
|
|||||||||||
| Total performing debt |
99.3 | 99.4 | 99.3 | 99.5 | 99.4 | |||||||||||||||
|
|
|
|
|
|
|
|
|
|
|
|||||||||||
| Non-performing debt(1) |
||||||||||||||||||||
| Non-performing debt not yet due: |
||||||||||||||||||||
| Medium-term and long-term debt: |
||||||||||||||||||||
| Bilateral debt(2) |
— | — | — | — | — | |||||||||||||||
| Suppliers |
— | — | — | — | — | |||||||||||||||
| Commercial banks |
0.02 | 0.02 | 0.02 | 0.01 | 0.01 | |||||||||||||||
|
|
|
|
|
|
|
|
|
|
|
|||||||||||
| Total non-performing debt not yet due |
0.02 | 0.02 | 0.02 | 0.01 | 0.01 | |||||||||||||||
|
|
|
|
|
|
|
|
|
|
|
|||||||||||
| Non-performing principal and interest arrears: |
||||||||||||||||||||
| Paris Club |
— | — | — | — | — | |||||||||||||||
| Other bilateral debt |
— | — | — | — | — | |||||||||||||||
| Commercial banks |
0.01 | 0.01 | 0.01 | 0.01 | 0.01 | |||||||||||||||
| Suppliers |
— | — | — | — | — | |||||||||||||||
| Compensatory interest |
— | — | — | — | — | |||||||||||||||
| Total non-performing principal and interest arrears |
0.01 | 0.01 | 0.01 | 0.01 | 0.01 | |||||||||||||||
|
|
|
|
|
|
|
|
|
|
|
|||||||||||
| Total non-performing debt |
0.03 | 0.03 | 0.03 | 0.02 | 0.02 | |||||||||||||||
|
|
|
|
|
|
|
|
|
|
|
|||||||||||
| Untendered Debt(3) |
0.7 | 0.6 | 0.6 | 0.5 | 0.5 | |||||||||||||||
|
|
|
|
|
|
|
|
|
|
|
|||||||||||
| Total gross public debt(4) |
100.0 | % | 100.0 | % | 100.0 | % | 100.0 | % | 100.0 | % | ||||||||||
|
|
|
|
|
|
|
|
|
|
|
|||||||||||
| (1) | For a definition of non-performing debt, see “Certain Defined Terms and Conventions—Certain Defined Terms.” |
| (2) | Bilateral debt is debt with sovereign governments. |
| (3) | Includes claims on principal and/or interest that the Republic considers time-barred. |
| (4) | Includes Untendered Debt. |
Source: Ministry of Economy.
D-157
Performing Debt
Performing Medium-term and long-term debt
Performing medium-term and long-term debt decreased in relative terms to 86.7% of total gross public debt as of December 31, 2025 from 89.7% as of December 31, 2021, and increased by U.S.$68.7 billion in absolute terms to U.S.$394.4 billion as of December 31, 2025 from U.S.$325.8 billion as of December 31, 2021, as a result of issuances of new bonds, treasury bills, promissory notes, disbursements under facility agreements with international organizations and inflation adjustments of certain outstanding bonds. This increase in absolute terms was partially offset by a decrease in the issuance of foreign currency-denominated bonds, a decrease in debt with commercial banks, guaranteed treasury notes for renewable energy projects, Guarantees (Avales), temporary advances and exchange rate fluctuations (the nominal depreciation of the peso, which reduced peso-denominated debt when expressed in U.S. dollars).
Performing Short-term debt
On August 28, 2019, the Government issued a decree deferring the scheduled payment date for 85% of the amounts due on short-term notes maturing in the fourth quarter of 2019, governed by Argentine law and held by institutional investors. Of the deferred amounts, 30% was repaid 90 days after the original payment date and the remaining 70% was repaid 180 days after the original payment date, except for payments under Lecaps due 2020 held domestically, which was repaid entirely 90 days after the original payment date. Amounts due on short-term notes held by individual investors was paid as originally scheduled.
As of December 31, 2025, 100.0% of the Republic’s short term debt was performing.
Changes in Total Gross Performing Public Debt by Creditor
Performing multilateral debt increased in relative terms to 21.1% of the Republic’s total gross public debt as of December 31, 2025 from 16.2% as of December 31, 2024, and increased by U.S.$20.6 billion in absolute terms to U.S.$96.1 billion as of December 31, 2025 from U.S.$75.5 billion as of December 31, 2024.
Performing bilateral debt decreased from 0.8% to 0.7% relative to total gross public debt between December 2024 and December 2025, and decreased by U.S.$0.6 billion in absolute terms to U.S.$3.2 billion as of December 31, 2025 from U.S.$3.8 billion as of December 31, 2024.
Performing bond debt decreased in relative terms to 63.2% of the Republic’s total gross public debt as of December 31, 2025 from 73.3% as of December 31, 2024, and decreased by U.S.$54.8 billion in absolute terms to U.S.$287.5 billion as of December 31, 2025, from U.S.$342.3 billion as of December 31, 2024.
During 2025, all medium-term and long-term Treasury bills were repaid.
Performing short-, medium- and long-term temporary advances from the Central Bank decreased in relative terms to 0.6% of the Republic’s total gross public debt as of December 31, 2025, from 0.8% as of December 31, 2024, and decreased by U.S.$1.2 billion in absolute terms to U.S$2.8 billion as of December 31, 2025 from U.S.$4.0 billion as of December 31, 2024.
Performing commercial bank debt decreased in relative terms to 0.1% of the Republic’s total gross public debt as of December 31, 2025 from 0.2% as of December 31, 2024, and decreased by U.S.$0.2 billion in absolute terms to U.S.$0.7 billion as of December 31, 2025 from U.S.$0.9 billion as of December 31, 2024.
D-158
Performing national Guaranteed Loans decreased in relative terms to 0.2% of the Republic’s total gross public debt as of December 31, 2025 from 0.2% as of December 31, 2024, and decreased by U.S.$0.1 billion in absolute terms to U.S.$0.9 billion as of December 31, 2025 from U.S.$1 billion as of December 31, 2024.
Performing guaranteed debt decreased in relative terms to 1.3% of the Republic’s total gross public debt as of December 31, 2025 from 1.4% as of December 31, 2024, and decreased by U.S.$0.3 billion in absolute terms to U.S.$6.0 billion as of December 31, 2025 from U.S.$6.3 billion as of December 31, 2024.
Performing short-term debt increased in relative terms to 12.8% of the Republic’s total gross public debt as of December 31, 2025 from 12.5% as of December 31, 2024, and decreased by U.S.$0.4 billion in absolute terms to U.S.$58.1 billion as of December 31, 2025 from U.S.$58.4 billion as of December 31, 2024.
Non-Performing Debt (excluding Untendered Debt)
Non-Performing Debt (excluding Untendered Debt) increased from U.S.$105 million in December 31, 2021 to U.S.$106 million in December 31, 2025. Such increase was driven by foreign exchange variations.
D-159
Foreign Currency-Denominated Debt
The following tables set forth information regarding the Republic’s total foreign currency-denominated debt, including past due principal and interest and compensatory and default interest, as of the dates indicated.
Foreign Currency-Denominated Public Debt by Instrument (1)
(in millions of U.S. dollars)
| As of December 31, | ||||||||||||||||||||
| 2021 | 2022 | 2023 | 2024 | 2025 | ||||||||||||||||
| Performing debt |
U.S.$ | 252,882 | U.S.$ | 262,952 | U.S.$ | 264,481 | U.S.$ | 255,311 | U.S.$ | 261,648 | ||||||||||
| Multilateral debt |
68,065 | 75,512 | 74,215 | 75,486 | 96,131 | |||||||||||||||
| Bono Global |
67,964 | 67,685 | 66,211 | 65,292 | 61,875 | |||||||||||||||
| Non-transferable notes to the Central Bank 2021, 2022, 2023, 2024, 2025, 2026, 2029, 2030, 2031, 2032 and 2033 |
57,509 | 61,707 | 67,190 | 69,286 | 52,534 | |||||||||||||||
| Bono R.A. |
43,510 | 43,628 | 43,628 | 33,358 | 39,048 | |||||||||||||||
| Guaranteed Treasury Notes for Renewable Energy Projects |
6,410 | 5,097 | 4,659 | 4,380 | 4,092 | |||||||||||||||
| Bilateral Debt |
4,710 | 5,049 | 4,672 | 3,795 | 3,229 | |||||||||||||||
| Treasury Notes |
1,801 | 1,628 | 1,219 | 1,197 | 1,210 | |||||||||||||||
| 2038 Par Bonds (2010) |
695 | 650 | 792 | 630 | 709 | |||||||||||||||
| Commercial banks |
438 | 402 | 348 | 256 | 213 | |||||||||||||||
| 2038 Par Bonds |
179 | 132 | 122 | 110 | 110 | |||||||||||||||
| 2033 Discount Bonds |
69 | 52 | 48 | 39 | 35 | |||||||||||||||
| 2033 Discount Bonds (2010) |
30 | 23 | 22 | 17 | 16 | |||||||||||||||
| Bontes |
4 | 4 | — | — | 1,000 | |||||||||||||||
| Bocones |
3 | 3 | 3 | 3 | 3 | |||||||||||||||
| Bonar |
37 | — | — | — | — | |||||||||||||||
| Bonar 2024 |
26 | — | — | — | — | |||||||||||||||
| of which Agreements Bonar 24(2) |
— | — | — | — | — | |||||||||||||||
| Treasury Bills |
7 | — | — | — | — | |||||||||||||||
| Bonar 2025 |
2 | — | — | — | — | |||||||||||||||
| of which Agreements Bonar 25(3) |
— | — | — | — | — | |||||||||||||||
| Promissory notes |
— | — | — | — | — | |||||||||||||||
| Birad |
— | — | — | — | — | |||||||||||||||
| Birae |
— | — | — | — | — | |||||||||||||||
| Biraf |
— | — | — | — | — | |||||||||||||||
| 2017 Globals |
— | — | — | — | — | |||||||||||||||
| Other |
1,422 | 1,380 | 1,345 | 1,462 | 1,445 | |||||||||||||||
| Non-performing debt |
103 | 101 | 102 | 102 | 106 | |||||||||||||||
| Non-performing debt not yet due |
60 | 60 | 61 | 60 | 60 | |||||||||||||||
| Non-performing debt arrears |
42 | 40 | 41 | 42 | 45 | |||||||||||||||
| Compensatory Interest |
— | — | — | — | — | |||||||||||||||
| Untendered debt(4) |
2,383 | 2,328 | 2,313 | 2,256 | 2,364 | |||||||||||||||
|
|
|
|
|
|
|
|
|
|
|
|||||||||||
| Total foreign currency-denominated debt |
U.S.$ | 255,367 | U.S.$ | 265,381 | U.S.$ | 266,896 | U.S.$ | 257,669 | U.S.$ | 264,118 | ||||||||||
|
|
|
|
|
|
|
|
|
|
|
|||||||||||
| (1) | Includes performing and non-performing debt (including Untendered Debt). |
| (2) | Corresponds to Bonares due 2024 issued as underlying of certain agreements entered into by the Republic, granting the Republic the right to cause the cancellation of such Bonares upon the payment by the Republic of the amounts specified under such agreements. Such Bonares due 2024 were cancelled in August 2019. |
| (3) | Corresponds to Bonares due 2025 issued as underlying of certain agreements entered into by the Republic, granting the Republic the right to cause the cancellation of such Bonares upon the payment by the Republic of the amounts specified under such agreements. Such Bonares due 2025 were cancelled in August 2019. |
| (4) | Includes claims on principal and/or interest that the Republic considers time-barred. |
Source: Ministry of Economy.
D-160
Gross Foreign Currency-Denominated Public Debt (1) (2)
(in millions of U.S. dollars, except for percentages)
| As of December 31, | ||||||||||||||||||||
| 2021 | 2022 | 2023 | 2024 | 2025 | ||||||||||||||||
| Foreign currency-denominated debt |
U.S.$ | 255,368 | U.S.$ | 265,381 | U.S.$ | 266,896 | U.S.$ | 257,669 | U.S.$ | 264,118 | ||||||||||
| As a % of GDP |
52.6 | 41.9 | 40.9 | 40.4 | 38.7 | |||||||||||||||
| As a % of Government revenues |
258.7 | 229.7 | 243.8 | 240.9 | 243.3 | |||||||||||||||
| As a % of exports |
291.6 | 257.2 | 320.0 | 266.0 | 250.4 | |||||||||||||||
| As a % of international reserves |
643.9 | 595.1 | 1,156.7 | 869.3 | 641.6 | |||||||||||||||
| As a % of total gross public debt |
70.3 | % | 66.9 | % | 72.0 | % | 55.2 | % | 58.0 | % | ||||||||||
| (1) | Includes performing and non-performing (including Untendered Debt). |
| (2) | Ratios calculated using the average exchange rate for the period. |
Source: INDEC and Ministry of Economy.
Foreign Currency-Denominated Debt
In 2025, the Republic issued foreign currency-denominated debt in an aggregate principal amount of U.S.$2.4 billion (U.S.$22.8 billion including multilateral debt), consisting mainly of non-transferable bills to the Central Bank for a total aggregate principal amount of U.S.$0.1 billion, the Letra U$S/Intra-SP/13-02-2026 of U.S.$1.2 billion and Bonte 6.5%/2029 for U.S.$1.0 billion. In addition, multilateral and bilateral institutions made disbursements for an aggregate principal amount of U.S.$20.4 billion. See “—Debt Record—2020 Debt Exchanges.”
The following table sets forth information regarding the Republic’s total foreign currency-denominated debt by type of currency as of the dates indicated.
Gross Foreign Currency-Denominated Public Debt, by Currency (1)
(in millions of U.S. dollars)
| As of December 31, | ||||||||||||||||||||
| 2021 | 2022 | 2023 | 2024 | 2025 | ||||||||||||||||
| U.S. dollars |
U.S.$ | 205,873 | U.S.$ | 211,418 | U.S.$ | 217,901 | U.S.$ | 209,906 | U.S.$ | 199,422 | ||||||||||
| Euro |
7,609 | 7,289 | 7,413 | 6,684 | 7,041 | |||||||||||||||
| Japanese yen |
675 | 648 | 532 | 408 | 330 | |||||||||||||||
| Special Drawing Rights |
40,960 | 45,711 | 40,899 | 40,558 | 57,230 | |||||||||||||||
| Other(2) |
251 | 315 | 151 | 114 | 95 | |||||||||||||||
|
|
|
|
|
|
|
|
|
|
|
|||||||||||
| Total foreign currency-denominated debt |
U.S.$ | 255,367 | U.S.$ | 265,381 | U.S.$ | 266,896 | U.S.$ | 257,669 | U.S.$ | 264,118 | ||||||||||
|
|
|
|
|
|
|
|
|
|
|
|||||||||||
| (1) | Includes Untendered Debt. |
| (2) | Figures include Danish crown, Swedish crown, Swiss franc, Canadian dollar, Australian dollar and Kuwaiti dinar. |
Source: Ministry of Economy.
D-161
As of December 31, 2025, the Republic’s total gross foreign currency public debt was denominated as follows:
| | 75.5% in U.S. dollars; |
| | 2.7% in euro; |
| | 0.1% in Japanese yen; and |
| | 21.7% in other foreign currencies (including Special Drawing Rights). |
Performing Foreign Currency-Denominated Debt Service
In 2021, the Republic’s interest expense on its performing foreign currency-denominated debt was U.S.$2.2 billion (0.4% of nominal GDP for 2021). In 2022, the Republic’s interest expense on its performing foreign currency-denominated debt was U.S.$7.6 billion (1.2% of nominal GDP for 2022). In 2023, the Republic’s interest expense on its performing foreign currency-denominated debt was U.S.$6.8 billion (1.0% of nominal GDP for 2023). In 2024, the Republic’s interest expense on its performing foreign currency-denominated debt was U.S.$8.8 billion (1.4% of nominal GDP for 2024). In 2025, the Republic’s interest expense on its performing foreign currency-denominated debt was U.S.$8.0 billion (1.2% of nominal GDP for 2025).
In December 2025, Argentina returned to the foreign currency capital markets after nearly eight years, by issuing the BONAR 2029N, a U.S. dollar-denominated bond bearing a 6.5% coupon rate with semi-annual interest payments, issued under Argentine law. This financing strategy implemented by the Government is aimed at refinancing existing debt obligations without drawing upon Central Bank reserves, thereby facilitating the accumulation of net international reserves. On December 17, 2024, S&P Global Ratings upgraded Argentina’s sovereign credit rating from selective default (SD) to CCC+ for local currency-denominated debt.
The following table sets forth information regarding the Republic’s projected debt service obligations on its performing foreign currency-denominated debt for the periods indicated, as of December 31, 2025.
Projected Performing Foreign Currency-Denominated Public Debt Service by Creditor (1)(2)
(in millions of U.S. dollars)
| 2026 | 2027 | 2028 | 2029 | |||||||||||||||||||||||||||||
| Principal | Interest | Principal | Interest | Principal | Interest | Principal | Interest | |||||||||||||||||||||||||
| Multilateral debt: |
||||||||||||||||||||||||||||||||
| Inter-American Development Bank |
U.S.$ | 1,214 | U.S.$ | 1,002 | U.S.$ | 1,272 | U.S.$ | 950 | U.S.$ | 1,542 | U.S.$ | 882 | U.S.$ | 1,547 | U.S.$ | 797 | ||||||||||||||||
| World Bank |
400 | 748 | 450 | 730 | 477 | 706 | 500 | 667 | ||||||||||||||||||||||||
| Corporación Andina de Fomento |
422 | 299 | 481 | 271 | 494 | 240 | 485 | 208 | ||||||||||||||||||||||||
| International Fund for Agricultural Development |
5 | 2 | 5 | 1 | 5 | 1 | 5 | 1 | ||||||||||||||||||||||||
| FONPLATA |
61 | 42 | 60 | 37 | 67 | 33 | 69 | 28 | ||||||||||||||||||||||||
| Central American Bank for Economic Integration |
7 | 65 | 13 | 64 | 30 | 63 | 44 | 60 | ||||||||||||||||||||||||
| The OPEC Fund for International Development |
14 | 7 | 14 | 6 | 14 | 5 | 14 | 5 | ||||||||||||||||||||||||
| European Investment Bank |
16 | 12 | 20 | 11 | 12 | 10 | 11 | 9 | ||||||||||||||||||||||||
| IMF |
1,141 | 3,083 | 4,451 | 2,948 | 6,631 | 2,631 | 8,144 | 2,207 | ||||||||||||||||||||||||
| Total multilateral debt |
3,280 | 5,259 | 6,766 | 5,019 | 9,271 | 4,572 | 10,819 | 3,991 | ||||||||||||||||||||||||
| Bilateral debt (excluding Paris Club) |
489 | 146 | 489 | 112 | 490 | 75 | 490 | 39 | ||||||||||||||||||||||||
| Paris Club |
298 | 35 | 284 | 23 | 261 | 10 | — | — | ||||||||||||||||||||||||
| Total Bilateral debt |
787 | 181 | 773 | 134 | 751 | 85 | 490 | 39 | ||||||||||||||||||||||||
| Total official debt |
4,067 | 5,440 | 7,539 | 5,153 | 10,021 | 4,657 | 11,308 | 4,030 | ||||||||||||||||||||||||
| Bonds |
5,540 | 3,466 | 6,445 | 3,423 | 8,454 | 3,642 | 14,110 | 3,525 | ||||||||||||||||||||||||
| Treasury bills |
1,210 | — | — | — | — | — | — | — | ||||||||||||||||||||||||
| Treasury notes |
— | — | — | — | — | — | — | — | ||||||||||||||||||||||||
| Commercial Banks |
74 | 5 | 64 | 3 | 32 | 2 | 22 | 1 | ||||||||||||||||||||||||
| Guaranteed Debt: |
||||||||||||||||||||||||||||||||
| Guarantees (Avales) |
334 | 31 | 869 | 3 | 30 | — | — | — | ||||||||||||||||||||||||
| Guaranteed Treasury notes |
288 | — | 288 | — | 288 | — | 288 | — | ||||||||||||||||||||||||
|
|
|
|
|
|
|
|
|
|
|
|
|
|
|
|
|
|||||||||||||||||
| Total Guaranteed Debt |
622 | 31 | 1,157 | 3 | 318 | — | 288 | — | ||||||||||||||||||||||||
|
|
|
|
|
|
|
|
|
|
|
|
|
|
|
|
|
|||||||||||||||||
| Total performing foreign currency-denominated debt service |
U.S.$ | 11,413 | U.S.$ | 8,942 | U.S.$ | 15,205 | U.S.$ | 8,582 | U.S.$ | 18,825 | U.S.$ | 8,301 | U.S.$ | 25,728 | U.S.$ | 7,556 | ||||||||||||||||
|
|
|
|
|
|
|
|
|
|
|
|
|
|
|
|
|
|||||||||||||||||
D-162
| 2030 | 2031 | 2032 | 2033 | |||||||||||||||||||||||||||||
| Principal | Interest | Principal | Interest | Principal | Interest | Principal | Interest | |||||||||||||||||||||||||
| Multilateral debt: |
||||||||||||||||||||||||||||||||
| Inter-American Development Bank |
U.S.$ | 1,475 | U.S.$ | 716 | U.S.$ | 1,550 | U.S.$ | 638 | U.S.$ | 1,219 | U.S.$ | 561 | U.S.$ | 1,077 | U.S.$ | 500 | ||||||||||||||||
| World Bank |
516 | 648 | 555 | 618 | 646 | 586 | 654 | 546 | ||||||||||||||||||||||||
| Corporación Andina de Fomento |
445 | 178 | 415 | 150 | 379 | 124 | 335 | 101 | ||||||||||||||||||||||||
| International Fund for Agricultural Development |
4 | 1 | 3 | 1 | 3 | 1 | 3 | — | ||||||||||||||||||||||||
| FONPLATA |
61 | 23 | 51 | 19 | 51 | 15 | 45 | 12 | ||||||||||||||||||||||||
| Central American Bank for Economic Integration |
60 | 57 | 66 | 53 | 66 | 48 | 64 | 44 | ||||||||||||||||||||||||
| The OPEC Fund for International Development |
14 | 4 | 14 | 3 | 14 | 3 | 10 | 2 | ||||||||||||||||||||||||
| European Investment Bank |
11 | 9 | 11 | 8 | 11 | 8 | 11 | 7 | ||||||||||||||||||||||||
| IMF |
9,538 | 1,674 | 9,538 | 1,100 | 8,397 | 543 | 5,087 | 242 | ||||||||||||||||||||||||
| Total multilateral debt |
12,123 | 3,308 | 12,203 | 2,589 | 10,787 | 1,889 | 7,286 | 1,455 | ||||||||||||||||||||||||
| Bilateral debt (excluding Paris Club) |
178 | 13 | 61 | 7 | 61 | 5 | 40 | 2 | ||||||||||||||||||||||||
| Paris Club |
— | — | — | — | — | — | — | — | ||||||||||||||||||||||||
| Total Bilateral debt |
178 | 13 | 61 | 7 | 61 | 5 | 40 | 2 | ||||||||||||||||||||||||
| Total official debt |
12,301 | 3,322 | 12,264 | 2,595 | 10,847 | 1,894 | 7,326 | 1,457 | ||||||||||||||||||||||||
| Bonds |
7,967 | 3,403 | 24,513 | 3,097 | 22,393 | 2,574 | 22,743 | 2,050 | ||||||||||||||||||||||||
| Treasury bills |
— | — | — | — | — | — | — | — | ||||||||||||||||||||||||
| Treasury notes |
— | — | — | — | — | — | — | — | ||||||||||||||||||||||||
| Commercial Banks |
14 | — | 7 | — | — | — | — | — | ||||||||||||||||||||||||
| Guaranteed Debt |
— | |||||||||||||||||||||||||||||||
| Guarantees (Avales) |
120 | — | — | — | — | — | — | — | ||||||||||||||||||||||||
| Guaranteed Treasury notes |
288 | — | 288 | — | 288 | — | 288 | — | ||||||||||||||||||||||||
|
|
|
|
|
|
|
|
|
|
|
|
|
|
|
|
|
|||||||||||||||||
| Total Guaranteed Debt |
408 | — | 288 | — | 288 | — | 288 | — | ||||||||||||||||||||||||
|
|
|
|
|
|
|
|
|
|
|
|
|
|
|
|
|
|||||||||||||||||
| Total performing foreign currency-denominated debt service |
U.S.$ | 20,689 | U.S.$ | 6,725 | U.S.$ | 37,073 | U.S.$ | 5,693 | U.S.$ | 33,528 | U.S.$ | 4,467 | U.S.$ | 30,357 | U.S.$ | 3,507 | ||||||||||||||||
|
|
|
|
|
|
|
|
|
|
|
|
|
|
|
|
|
|||||||||||||||||
| (1) | Calculated based on total debt, exchange and interest rates as of December 31, 2025. |
| (2) | Includes payments made by the Government to comply with judgments obtained by private parties through acciones de amparo. See “—Legal Proceedings—Litigation in Argentina.” |
Source: INDEC and Ministry of Economy.
D-163
Peso-Denominated Debt
The following table sets forth information regarding the Republic’s total peso-denominated debt as of the dates indicated.
Peso-Denominated Debt by Instrument (1)
(in millions of U.S. dollars)
| As of December 31, | ||||||||||||||||||||
| 2021 | 2022 | 2023 | 2024 | 2025 | ||||||||||||||||
| Performing |
U.S.$ | 107,808 | U.S.$ | 131,113 | U.S.$ | 103,744 | U.S.$ | 209,190 | U.S.$ | 190,902 | ||||||||||
| Boncer |
34,701 | 34,412 | 36,931 | 118,429 | 77,047 | |||||||||||||||
| Treasury Bills |
21,228 | 29,819 | 5,097 | 28,498 | 54,069 | |||||||||||||||
| Bonar Dual |
1 | 20,167 | 41,118 | 9,237 | 641 | |||||||||||||||
| Temporary advances from the Central Bank |
21,149 | 15,769 | 5,060 | 3,962 | 2,803 | |||||||||||||||
| Bontes |
11,751 | 11,234 | 7,515 | 3,746 | 3,412 | |||||||||||||||
| 2045 Quasi-Par Bonds |
8,400 | 9,269 | 5,110 | 11,153 | 10,359 | |||||||||||||||
| 2033 Discount Bonds |
3,464 | 3,822 | 865 | 1,794 | 1,491 | |||||||||||||||
| Commercial Banks |
2,092 | 2,343 | 847 | 663 | 469 | |||||||||||||||
| Promissory notes |
1,206 | 1,434 | 230 | 1,471 | 467 | |||||||||||||||
| Treasury Notes |
675 | 66 | — | — | — | |||||||||||||||
| National Guaranteed Loans |
751 | 829 | 457 | 997 | 926 | |||||||||||||||
| 2038 Par Bonds |
733 | 809 | 446 | 973 | 904 | |||||||||||||||
| Bonares |
1,016 | 136 | 26 | 17 | 9 | |||||||||||||||
| Bocones |
260 | 86 | 34 | 47 | 62 | |||||||||||||||
| Bontes PIK |
— | — | — | — | — | |||||||||||||||
| Bonos PGN |
— | — | — | — | — | |||||||||||||||
| Boncap |
— | — | — | 5,180 | 38,242 | |||||||||||||||
| LeFi |
— | — | — | 23,021 | — | |||||||||||||||
| Bonads |
— | — | — | — | — | |||||||||||||||
| Bonacs |
— | — | — | — | — | |||||||||||||||
| Other |
381 | 62 | 8 | 2 | 2 | |||||||||||||||
| Non-performing debt |
2 | 2 | 1 | 2 | 2 | |||||||||||||||
| Non-performing debt not yet due |
— | — | — | — | — | |||||||||||||||
| Non-performing debt arrears |
2 | 2 | 1 | 2 | 2 | |||||||||||||||
| Untendered debt(2) |
56 | 60 | 32 | 60 | 55 | |||||||||||||||
|
|
|
|
|
|
|
|
|
|
|
|||||||||||
| Total peso-denominated debt |
U.S.$ | 107,866 | U.S.$ | 131,175 | U.S.$ | 103,777 | U.S.$ | 209,252 | U.S.$ | 190,959 | ||||||||||
|
|
|
|
|
|
|
|
|
|
|
|||||||||||
| (1) | Includes performing and non-performing (including Untendered Debt). |
| (2) | Includes claims on principal and/or interest that the Republic considers time-barred. |
Source: Ministry of Economy.
Total peso-denominated debt amounted to Ps.278,689 billion (U.S.$191.0 billion, or 42.0% of gross public total debt) as of December 31, 2025 compared to Ps.11,083 billion (U.S.$107.9 billion, or 29.7% of gross public total debt) as of December 31, 2021. The decrease as a percentage of total debt is primarily as a result of:
| | the decrease in the issuances of peso-denominated debt instruments, Boncers, Bonar Dual, promissory notes, etc.; |
| | the nominal decrease in peso-denominated debt caused by adjustments to inflation on the portion of the peso-denominated debt that by its terms adjusts for inflation based on CER and debt capitalization; and |
| | the adjustments due to exchange rate fluctuations. |
D-164
Performing Peso-Denominated Debt Service
In 2021, interest on the Republic’s peso-denominated debt increased by 42.7% from Ps.397.7 billion in 2020 to Ps.567.4 billion (U.S.$6.0 billion, or 73.2% of total interest). This increase was primarily due to an increase in interest payments on Bonares, Treasury bills and Boncer.
In 2022, interest on the Republic’s peso-denominated debt increased by 17.5% from Ps.567.4 billion in 2021 to Ps.666.6 billion (U.S.$3.7 billion, or 40.1% of total interest). This increase was primarily due to an increase in interest payments on Bonares, Treasury bills and bonds issued in the 2020 Debt Exchanges.
In 2023, interest on the Republic’s peso-denominated debt increased by 162.1% from Ps.666.6 billion in 2022 to Ps.1,746.8 billion (U.S.$2.2 billion, or 46.7% of total interest). This increase was primarily due to an increase in interest payments on Bonares, Treasury bills and bonds issued in the 2020 Debt Exchanges.
In 2024, interest on the Republic’s peso-denominated debt decreased by 6.7% from Ps.1,746.8 billion in 2023 to Ps.1,629.8 billion (U.S.$1.6 billion, or 17% of total interest). The decrease was primarily due to an increase in the issuance of debt that capitalizes interest such as Boncap and Lecap. The adjustments of debt for variation of the amount of debt that capitalizes interest was U.S.$16.3 million in 2023 and U.S.$15,938 million in 2024.
In 2025, interest on the Republic’s peso-denominated debt decreased by 20.7% from Ps.1,629.8 billion in 2024 to Ps.1,292.5 billion (U.S.$1.0 billion, or 11.4% of total interest). The decrease was primarily due to greater debt amortizations than debt issuances. The adjustments of debt for variation of the amount of debt that capitalizes interest was U.S.$15,938 million in 2024 and U.S.$69,000 million in 2025.
D-165
The following table sets forth information regarding the Republic’s projected debt service on its performing peso-denominated public debt for the periods indicated.
Projected Performing Peso-Denominated Public Debt Service by Creditor (1)(2)
(in millions of U.S. dollars)
| 2026 | 2027 | 2028 | 2029 | |||||||||||||||||||||||||||||
| Principal | Interest | Principal | Interest | Principal | Interest | Principal | Interest | |||||||||||||||||||||||||
| Bonds |
U.S.$ | 71,448 | U.S.$ | 1,168 | U.S.$ | 33,477 | U.S.$ | 864 | U.S.$ | 12,644 | U.S.$ | 815 | U.S.$ | 450 | U.S.$ | 790 | ||||||||||||||||
| National Guaranteed Loans |
— | 47 | 188 | 44 | — | 37 | — | 37 | ||||||||||||||||||||||||
| Commercial banks |
469 | — | — | — | — | — | — | — | ||||||||||||||||||||||||
| Temporary Advances from the Central Bank |
2,803 | — | — | — | — | — | — | — | ||||||||||||||||||||||||
| Treasury notes |
— | — | — | — | — | — | — | — | ||||||||||||||||||||||||
| Treasury bills |
54,069 | — | — | — | — | — | — | — | ||||||||||||||||||||||||
| LeFi |
— | — | — | — | — | — | — | — | ||||||||||||||||||||||||
| Promissory notes |
— | 8 | — | 8 | — | 8 | 23 | 10 | ||||||||||||||||||||||||
|
|
|
|
|
|
|
|
|
|
|
|
|
|
|
|
|
|||||||||||||||||
| Guarantees (Avales) |
— | — | — | — | — | — | — | — | ||||||||||||||||||||||||
|
|
|
|
|
|
|
|
|
|
|
|
|
|
|
|
|
|||||||||||||||||
| Total performing |
U.S.$ | 128,790 | U.S.$ | 1,223 | U.S.$ | 33,665 | U.S.$ | 916 | U.S.$ | 12,644 | U.S.$ | 861 | U.S.$ | 473 | U.S.$ | 837 | ||||||||||||||||
|
|
|
|
|
|
|
|
|
|
|
|
|
|
|
|
|
|||||||||||||||||
| 2030 | 2031 | 2032 | 2033 | |||||||||||||||||||||||||||||
| Principal | Interest | Principal | Interest | Principal | Interest | Principal | Interest | |||||||||||||||||||||||||
| Bonds |
U.S.$ | 1,641 | U.S.$ | 602 | 478 | U.S.$ | 413 | U.S.$ | 266 | U.S.$ | 396 | U.S.$ | 266 | U.S.$ | 384 | |||||||||||||||||
| National Guaranteed Loans |
51 | 36 | 688 | 17 | — | — | — | — | ||||||||||||||||||||||||
| Commercial banks |
— | — | — | — | — | — | — | — | ||||||||||||||||||||||||
| Temporary Advances from the Central Bank |
— | — | — | — | — | — | — | — | ||||||||||||||||||||||||
| Treasury notes |
— | — | — | — | — | — | — | — | ||||||||||||||||||||||||
| Treasury bills |
— | — | — | — | — | — | ||||||||||||||||||||||||||
| Promissory notes |
47 | 11 | 47 | 10 | 47 | 8 | 47 | 7 | ||||||||||||||||||||||||
| LeFi |
— | — | — | — | — | — | — | — | ||||||||||||||||||||||||
|
|
|
|
|
|
|
|
|
|
|
|
|
|
|
|
|
|||||||||||||||||
| Guarantees (Avales) |
— | — | — | — | — | — | — | — | ||||||||||||||||||||||||
|
|
|
|
|
|
|
|
|
|
|
|
|
|
|
|
|
|||||||||||||||||
| Total performing |
U.S.$ | 1,739 | U.S.$ | 649 | U.S.$ | 1,213 | U.S.$ | 440 | U.S.$ | 312 | U.S.$ | 405 | U.S.$ | 312 | U.S.$ | 391 | ||||||||||||||||
|
|
|
|
|
|
|
|
|
|
|
|
|
|
|
|
|
|||||||||||||||||
| (1) | Calculated based on the stock of debt, exchange rate and interest rates as of December 31, 2025. |
| (2) | Includes payments made by the Government to comply with judgments obtained by private parties through acciones de amparo. See “— Legal Proceedings—Litigation in Argentina. |
Source: Ministry of Economy.
Debt Owed to Financial Institutions
Overview
Historically, the IMF, the IADB and the World Bank have provided the Republic with financial support subject to the Government’s compliance with stabilization and reform policies. The financial support of the World Bank and the IADB include sector-specific and structural loans intended to finance social programs, public works and structural projects at the national and provincial levels. From 2021 to 2025, outstanding amounts owed by the Government to multilateral creditors increased by U.S.$72.8 billion to U.S.$99.4 billion, mainly due to disbursements made by the World Bank, the IMF and the IADB.
| | During 2021, the Government made principal payments to multilateral lenders of U.S.$5.6 billion, compared to disbursements by multilateral lenders to the Government of U.S.$3.7 billion. |
| | During 2022, the Government made principal payments to multilateral lenders of U.S.$18.5 billion, compared to disbursements by multilateral lenders to the Government of U.S.$28.0 billion. |
| | During 2023, the Government made principal payments to multilateral lenders of U.S.$19.6 billion, compared to disbursements by multilateral lenders to the Government of U.S.$17.9 billion. |
| | During 2024, the Government made principal payments to multilateral lenders of U.S.$7.8 billion, compared to disbursements by multilateral lenders to the Government of U.S.$10.3 billion. |
| | During 2025, the Government made principal payments to multilateral lenders of U.S.$2.2 billion, compared to disbursements by multilateral lenders to the Government of U.S.$20.4 billion. |
D-166
From 2021 to 2025, the total amount of interest payments to multilateral lenders (including the IADB, the World Bank, IMF and other institutions) was U.S.$4.8 billion. The Government also guarantees multilateral debt owed by the provinces. See “The Argentine Economy—Agreements with the IMF.”
The following table sets forth the disbursements from, and payments to, multilateral lenders as of the dates indicated.
Disbursements/Payments - Multilateral Lenders
(in millions of U.S. dollars)
| As of December 31, | ||||||||||||||||||||
| 2021 | 2022 | 2023 | 2024 | 2025 | ||||||||||||||||
| World Bank: |
||||||||||||||||||||
| Disbursements |
U.S.$ | 1,182 | U.S.$ | 973 | U.S.$ | 969 | U.S.$ | 1,170 | U.S.$ | 2,422 | ||||||||||
| Principal payments |
(394 | ) | (310 | ) | (291 | ) | (328 | ) | (359 | ) | ||||||||||
| Disbursements, net of principal payments |
788 | 663 | 678 | 842 | 2,063 | |||||||||||||||
| Interest payments |
(113 | ) | (187 | ) | (541 | ) | (665 | ) | (678 | ) | ||||||||||
| Payment of commissions |
(5 | ) | (6 | ) | (7 | ) | (10 | ) | (7 | ) | ||||||||||
|
|
|
|
|
|
|
|
|
|
|
|||||||||||
| Net (outflows) inflows |
669 | 470 | 130 | 168 | 1,378 | |||||||||||||||
| International Monetary Fund: |
||||||||||||||||||||
| Disbursements |
— | 23,570 | 12,701 | 5,501 | 14,243 | |||||||||||||||
| Principal payments |
(3,737 | ) | (16,644 | ) | (17,780 | ) | (4,519 | ) | — | |||||||||||
| Disbursements, net of principal payments |
(3,737 | ) | 6,926 | (5,079 | ) | 982 | 14,243 | |||||||||||||
| Interest payments |
(1,347 | ) | (1,721 | ) | (3,014 | ) | (3,089 | ) | (2,784 | ) | ||||||||||
| Payments of commissions |
— | (212 | ) | (108 | ) | (30 | ) | (117 | ) | |||||||||||
| Net (outflows) inflows |
(5,084 | ) | 4,994 | (8,201 | ) | (2,137 | ) | 11,341 | ||||||||||||
| Inter-American Development Bank: |
||||||||||||||||||||
| Disbursements |
1,524 | 2,440 | 1,750 | 2,433 | 2,924 | |||||||||||||||
| Principal payments |
(867 | ) | (845 | ) | (895 | ) | (1,358 | ) | (1,199 | ) | ||||||||||
| Disbursements, net of principal payments |
657 | 1,595 | 855 | 1,075 | 1,724 | |||||||||||||||
| Interest payments |
(303 | ) | (369 | ) | (821 | ) | (953 | ) | (942 | ) | ||||||||||
| Payments of commissions |
(26 | ) | (29 | ) | (23 | ) | (31 | ) | (30 | ) | ||||||||||
|
|
|
|
|
|
|
|
|
|
|
|||||||||||
| Net (outflows) inflows |
327 | 1,197 | 11 | 91 | 753 | |||||||||||||||
| FAD:(1) |
||||||||||||||||||||
| Disbursements |
3 | 7 | 11 | — | — | |||||||||||||||
| Principal payments |
(8 | ) | (7 | ) | (6 | ) | (6 | ) | (5 | ) | ||||||||||
| Disbursements, net of principal payments |
(5 | ) | — | 5 | (6 | ) | (5 | ) | ||||||||||||
| Interest payments |
— | (1 | ) | (2 | ) | (2 | ) | (2 | ) | |||||||||||
| Payments of commissions |
— | — | — | — | — | |||||||||||||||
|
|
|
|
|
|
|
|
|
|
|
|||||||||||
| Net (outflows) inflows |
(5 | ) | — | 3 | (8 | ) | (7 | ) | ||||||||||||
|
|
|
|
|
|
|
|
|
|
|
|||||||||||
D-167
| As of December 31, | ||||||||||||||||||||
| 2021 | 2022 | 2023 | 2024 | 2025 | ||||||||||||||||
| FONPLATA:(2) |
||||||||||||||||||||
| Disbursements |
106 | 123 | 10 | 249 | 19 | |||||||||||||||
| Principal payments |
(27 | ) | (36 | ) | (40 | ) | (68 | ) | (66 | ) | ||||||||||
| Disbursements, net of principal |
79 | 87 | (30 | ) | 181 | (47 | ) | |||||||||||||
| Interest payments |
(10 | ) | (14 | ) | (36 | ) | (39 | ) | (46 | ) | ||||||||||
| Payments of commissions |
(1 | ) | (1 | ) | (1 | ) | (1 | ) | (1 | ) | ||||||||||
|
|
|
|
|
|
|
|
|
|
|
|||||||||||
| Net (outflows) inflows |
68 | 71 | (67 | ) | 140 | (94 | ) | |||||||||||||
|
|
|
|
|
|
|
|
|
|
|
|||||||||||
| Corporación Andina de Fomento: |
||||||||||||||||||||
| Disbursements |
691 | 760 | 2,023 | 862 | 596 | |||||||||||||||
| Principal payments |
(561 | ) | (610 | ) | (521 | ) | (1,511 | ) | (568 | ) | ||||||||||
| Disbursements, net of principal |
130 | 150 | 1,502 | (649 | ) | 28 | ||||||||||||||
| Interest payments |
(75 | ) | (100 | ) | (275 | ) | (353 | ) | (314 | ) | ||||||||||
| Payments of commissions |
(6 | ) | (8 | ) | (6 | ) | (11 | ) | (11 | ) | ||||||||||
|
|
|
|
|
|
|
|
|
|
|
|||||||||||
| Net (outflows) inflows |
49 | 41 | 1,221 | (1,013 | ) | (297 | ) | |||||||||||||
|
|
|
|
|
|
|
|
|
|
|
|||||||||||
| The OPEC Fund for International Development: |
||||||||||||||||||||
| Disbursements |
21 | 20 | 12 | 2 | 2 | |||||||||||||||
| Principal payments |
(4 | ) | (10 | ) | (14 | ) | (14 | ) | (17 | ) | ||||||||||
| Disbursements, net of principal |
18 | 10 | (2 | ) | (12 | ) | (15 | ) | ||||||||||||
| Interest payments |
(5 | ) | (7 | ) | (7 | ) | (8 | ) | (7 | ) | ||||||||||
| Payments of commissions |
— | — | — | — | — | |||||||||||||||
| Net (outflows) inflows |
13 | 4 | (9 | ) | (20 | ) | (22 | ) | ||||||||||||
| Central American Bank for Economic Integration: |
||||||||||||||||||||
| Disbursements |
47 | 60 | 454 | 175 | 202 | |||||||||||||||
| Principal payments |
(1 | ) | (1 | ) | (2 | ) | (3 | ) | (5 | ) | ||||||||||
| Disbursements, net of principal |
46 | 59 | 452 | 172 | 197 | |||||||||||||||
| Interest payments |
— | (3 | ) | (26 | ) | (49 | ) | (56 | ) | |||||||||||
| Payments of commissions |
— | — | (1 | ) | (1 | ) | — | |||||||||||||
| Net (outflows) inflows |
46 | 56 | 425 | 122 | 141 | |||||||||||||||
| The European Investment Bank: |
||||||||||||||||||||
| Disbursements |
26 | 100 | 25 | 16 | 7 | |||||||||||||||
| Principal payments |
(10 | ) | (11 | ) | (11 | ) | (12 | ) | (13 | ) | ||||||||||
| Disbursements, net of principal |
16 | 89 | 14 | 4 | (7 | ) | ||||||||||||||
| Interest payments |
(1 | ) | (1 | ) | (12 | ) | (15 | ) | (13 | ) | ||||||||||
| Payments of commissions |
(1 | ) | (1 | ) | (2 | ) | (2 | ) | (1 | ) | ||||||||||
|
|
|
|
|
|
|
|
|
|
|
|||||||||||
| Net (outflows) inflows |
14 | 86 | — | (12 | ) | (21 | ) | |||||||||||||
|
|
|
|
|
|
|
|
|
|
|
|||||||||||
| Total disbursements |
3,600 | 28,054 | 17,956 | 10,408 | 20,414 | |||||||||||||||
| Total principal payments |
(5,610 | ) | (18,475 | ) | (19,560 | ) | (7,818 | ) | (2,232 | ) | ||||||||||
| Disbursements, net of principal |
(2,009 | ) | 9,579 | (1,604 | ) | 2,590 | 18,182 | |||||||||||||
| Total interest payments |
(1,855 | ) | (2,402 | ) | (4,735 | ) | (5,174 | ) | (4,841 | ) | ||||||||||
| Total commissions |
(39 | ) | (258 | ) | (148 | ) | (86 | ) | (167 | ) | ||||||||||
|
|
|
|
|
|
|
|
|
|
|
|||||||||||
| Total net (outflows) inflows |
U.S.$ | (3,903 | ) | U.S.$ | 6,919 | U.S.$ | (6,486 | ) | U.S.$ | (2,669 | ) | U.S.$ | 13,173 | |||||||
|
|
|
|
|
|
|
|
|
|
|
|||||||||||
| (1) | International Fund for Agricultural Development. |
| (2) | Financial Fund for the development of the Plata Valley. |
Source: Ministry of Economy.
International Monetary Fund
The IMF organized two separate financial aid packages for the Republic during the years leading up to the collapse of the Convertibility Regime: one in December 2000, and the other in August 2001. As part of these packages, the IMF increased the amount available to the Republic under its credit facilities and secured for the Republic other sources of funding (including loan commitments from the World Bank, the IADB and the Spanish government).
D-168
Between 2001 and 2005, the Republic reduced its outstanding IMF debt from U.S.$14.0 billion as of December 31, 2001 to U.S.$9.5 billion as of December 31, 2005. In August 2004, the IMF suspended disbursements under the 2003 Stand-By Arrangement after the Government indefinitely postponed the scheduled review of its performance under the arrangement.
On January 3, 2006, the Government repaid all of its outstanding debt owed to the IMF in a single payment of U.S.$9.5 billion. The payment to the IMF represented 7.4% of the total Argentine public debt and saved U.S.$568 million in interest. The Government borrowed funds from the Central Bank to make the payment, which resulted in a 33.3% reduction of the Central Bank’s reserves from U.S.$28.1 billion to U.S.$18.6 billion. The Government issued a 10-year U.S. dollar-denominated non-transferable Treasury note to repay the Central Bank for this financing. Given that the IMF liability was exchanged for Central Bank liability of the same value, the IMF repayment did not affect the Government’s total debt.
Under Article IV of the IMF’s Articles of Agreement, the IMF holds bilateral discussions with members, usually every year. IMF staff visits the country, collects economic and financial information, and discusses the country’s economic developments and policies with officials. The IMF staff then prepares a report, which forms the basis for discussion by the Executive Board.
On June 7, 2018, the Ministry of Economy and the IMF staff reached an understanding on the terms of a 36-month SBA for disbursements totaling approximately U.S.$50 billion, which was approved by the IMF’s Executive Board on June 20, 2018. On October 26, 2018, the IMF’s Executive Board approved an augmentation of the SBA increasing total assets to approximately U.S.$57.1 billion for the duration of the program through 2021. See “The Argentine Economy— Agreements with the IMF.” On September 22, 2021, Argentina repaid the first principal installment under the SBA of U.S.$1.9 billion to the IMF.
On March 25, 2022, the Republic signed a 30-month EFF agreement with the IMF for 31.9 billion SDRs (approximately U.S.$44 billion), to refinance the SBA. The EFF provides balance of payments and budget support, with the objective of strengthening public finances, tackling inflation, boosting the accumulation of international reserves, and setting the basis for more sustainable and inclusive economic growth. The EFF includes 10 reviews by the IMF to be carried out quarterly over two and a half years. On June 25, 2022, the IMF approved the Republic’s first quarterly review under the EFF, authorizing an immediate disbursement of approximately U.S.$4.01 billion. The repayment period for each disbursement is 10 years, with a grace period of four and a half years, which implies that the Republic shall repay the debt between 2026 to 2034.
Between March 25, 2022 and July 29, 2022, the Government made principal payments to the IMF for 6,028 million SDRs (approximately U.S.$8.1 billion).
On September 19, 2022, the Republic reached an agreement with the IMF on the second review under the EFF, which was approved by the IMF’s Executive Board on October 7, 2022, authorizing an immediate disbursement of approximately U.S.$3.9 billion. On December 2, 2022, the Republic reached an agreement with the IMF on the third review under the EFF, which was approved by the IMF’s Executive Board on December 22, 2022, authorizing an immediate disbursement of approximately U.S.$6.0 billion. During 2023, the IMF’s Executive Board authorized two disbursements under the EFF of approximately U.S.$12.7 billion in the aggregate. During 2024, and as of the date of this Annual Report, the IMF’s Executive Board has authorized disbursements under the EFF of approximately U.S.$5.5 billion in the aggregate. See “Recent Developments—Public Sector Debt—Debt Owed to Financial Institutions—IMF.”
In January 2024, the Milei administration renegotiated its common goals with the IMF, allowing the IMF program to resume.
On June 13, 2024, the IMF’s Executive Board completed the eighth review under the EFF, resulting in a U.S.$790 million disbursement to support the Government’s efforts to lower inflation, rebuild fiscal and external buffers, and foster economic recovery.
On April 11, 2025, the Government requested a new arrangement under the EFF, which resulted in the IMF’s Executive Board approving a 48-month EFF for a total aggregate amount of U.S.$20 billion, including an immediate disbursement of U.S.$12 billion and a first review under the EFF scheduled for June 2025. The arrangement supports the transition to a new phase with the objective of improving macroeconomic stability, strengthening external sustainability, and deepening structural reforms towards a more open and market-oriented economy.
In April and August 2025, the IMF completed the first and second disbursements under the EFF for a total aggregate amount of U.S.$12 billion and U.S.$2 billion, respectively, which were used by the Government to repurchase non-transferable bills from the Central Bank.
D-169
World Bank
On July 25, September 7, and December 7, 2022, the Government announced financing agreements with the World Bank for U.S.$200 million, U.S.$900 million and U.S.$200 million, respectively. These financing agreements are aimed at promoting sustainable growth in Argentina, driven by innovation and focused on the creation of productive technology-based companies, support for entrepreneurs and access to private capital.
Between 2021 and 2025, the World Bank disbursed approximately U.S.$6.7 billion in loans to the Republic partly for activities designed to foster economic recovery, both at the national and provincial levels, including for infrastructure and education projects, as well as for various social development programs such as health and the environment. As of December 31, 2025, the aggregate principal amount outstanding under loans made by the World Bank was U.S.$12.8 billion, compared to U.S.$10.7 billion as of December 31, 2024. As of December 31, 2025, approximately U.S.$3.0 billion of committed loans from the World Bank remained undisbursed.
Between 2021 and 2025 Argentina made principal payments in an aggregate amount of U.S.$1.7 billion under World Bank loans, and a total of U.S.$2.2 billion on account of interest.
In February 2023, the World Bank approved additional financing for the Programa para la Mejora de la Inclusión Educativa en el Nivel Secundario y Superior (Improving Inclusion in Secondary and Higher Education program) for U.S.$300 million and the Segundo Proyecto de Hábitat y Suelo Urbano (Second Habitat and Urban Land Project) for U.S.$150 million.
In November 2024, the World Bank approved funding for Argentina’s following projects: (i) the Proyecto de Apoyo a la Sostenibilidad y Equidad del Transporte Público (Sustainability and Equity of Public Transport Project) for a total aggregate amount of U.S.$0.7 billion); (ii) the transition to a sustainable electricity sector for a total aggregate amount of U.S.$0.5 billion; (iii) the Desarrollo Integral de la Primera Infancia (Integrated Early Childhood Development) project for a total aggregate amount of U.S.$1.2 billion; and (iv) the Política Federal para Mejorar la Alfabetización Fundacional (Federal Policy for Enhancing Foundational Literacy) for a total aggregate amount of U.S.$0.5 billion.
IADB
In November 2022, the Republic entered into a U.S.$500 million loan agreement with the IADB, which was disbursed in December 2022. This loan focuses on supporting climate planning capacity, boosting green finance, and promoting the circular economy.
Between 2021 and 2025, the IADB disbursed approximately U.S.$11.1 billion in loans to Argentina, partly for activities designed to foster economic growth and partly for various social development programs such as health, infrastructure and education. As of December 31, 2025, the aggregate principal amount outstanding under loans made by the IADB was U.S.$19.3 billion, compared to U.S.$17.6 billion as of December 31, 2024. As of December 31, 2025, approximately U.S.$5.8 billion of IADB committed loans remained undisbursed.
During the first quarter of 2023, the IADB approved financing for the Programa de Ciberseguridad para Infraestructuras Críticas de Información (Cybersecurity for Critical Information Infrastructure Program) for U.S.$30 million, and the Programa de Apoyo a los Pequeños Productores Vitivinícolas de Argentina II (Support Program for Small Wine Producers in Argentina II or “PROVIAR II”) for U.S.$40 million. Further, the IADB approved additional financing for the Programa de Integración Social Urbana y Mejora de la Vivienda (Urban Social Integration and Housing Improvement Program) for U.S.$150 million.
On April 13, 2023, the IADB approved financing for the Línea de Crédito Condicional para Proyectos de Inversión (Conditional Credit Line for Investment Projects or “CCLIP”) for U.S.$200 million, to finance measures aimed at improving the Republic’s healthcare system.
Between November and December 2025, IADB approved financing for six new projects for a total aggregate amount of U.S.$702 million. The projects are aimed at (i) supporting Argentina’s integration to the OECD, (ii) urban revitalization and habitat improvement, (iii) state transformation and deregulation, and (iv) water resources and environmental management, among others.
FONPLATA
Between 2021 and 2025, FONPLATA disbursed an aggregate amount of U.S.$508 million to Argentina for economic development, infrastructure programs and social programs. As of December 31, 2025, the aggregate principal amount outstanding under loans made by FONPLATA was U.S.$599 million, compared to U.S.$646 million as of December 31, 2024. As of December 31, 2025, approximately U.S.$140 million in approved loans from FONPLATA remained undisbursed.
D-170
Between 2021 and 2025, Argentina made principal payments in an aggregate amount of U.S.$237 million under FONPLATA loans and U.S.$146 million on account of interest.
CAF
In December 2022, CAF approved two loans for USD 430 million for Argentina, which are intended to promote the development of productive rural roads that will benefit national interconnectivity and regional economies, and to finance climate change mitigation actions implemented by Pan American Energy.
Between 2021 and 2025, CAF disbursed approximately U.S.$4.9 billion to Argentina mostly in loans for infrastructure programs.
As of December 31, 2025, the aggregate principal amount outstanding under loans made by CAF was U.S.$4.8 billion, compared to U.S.$4.8 billion as of December 31, 2024. As of December 31, 2025, approximately U.S.$2.0 billion in approved loans from CAF remain undisbursed.
During the first quarter of 2023, CAF approved the disbursement of U.S.$540.0 million for the construction of gas pipelines and compressor plants, aimed at increasing the gas supply in the northern provinces of the Republic as well as gas export volumes to Chile and Brazil, which was finished in November 2024. Further, CAF approved the disbursement of U.S.$300.0 million for the Programa para la Promoción del Modelo Social de la Discapacidad y el Acceso a Derechos de las Personas con Discapacidad (Program for the Promotion of the Social Model of Disability and Access to Rights for Persons with Disabilities).
During 2024, CAF approved the disbursement of a total aggregate amount of U.S.$215 million for four provincial projects related to (i) governability, (ii) protection of native forests, (iii) road construction and (iv) access to education.
Between 2021 and 2025, Argentina made principal payments in an aggregate amount of U.S.$3.8 billion under CAF loans and U.S.$1.1 million on account of interest.
IFAD
Between 2021 and 2025, the International Fund for Agricultural Development (“IFAD”) disbursed an aggregate amount of U.S.$22 million to Argentina for economic development and social programs. As of December 31, 2025, the aggregate principal amount outstanding under loans made by IFAD was U.S.$38.9 million, compared to U.S.$40.4 million as of December 31, 2024. As of December 31, 2025, approximately U.S.$2.3 million in approved loans from IFAD remained undisbursed.
Between 2021 and 2025, Argentina made principal payments in an aggregate amount of U.S.$32 million under IFAD loans and U.S.$7 million on account of interest.
EIB
Between 2021 and 2025, the European Investment Bank (“EIB”) disbursed an aggregate amount of U.S.$174 million to Argentina for economic development and infrastructure. As of December 31, 2025, the aggregate principal amount outstanding under loans made by EIB was U.S.$222 million and U.S.$272 million in approved loans from EIB remained undisbursed.
Between 2021 and 2025, Argentina made principal payments in an aggregate amount of U.S.$57 million under EIB loans and U.S.$42 million on account of interest.
OFID
Between 2021 and 2025, the Organization of Petroleum Exporting Countries’ (“OPEC”) Fund for International Development (“OFID”) disbursed an aggregate amount of U.S.$58.0 million to Argentina for economic development programs. As of December 31, 2025, the aggregate principal amount outstanding under loans made by OFID was U.S.$135.9 million, compared to U.S.$146.0 million as of December 31, 2024. As of December 31, 2025, approximately U.S.$8.5 million in approved loans from OFID remained undisbursed.
Between 2021 and 2025, Argentina made principal payments in an aggregate amount of U.S.$58.0 million under OFID loans and U.S.$34.0 million on account of interest.
D-171
BCIE
Between 2021 and 2025, the Banco Centroamericano de Integración Económica (Central American Bank for Economic Integration or “BCIE”) disbursed approximately U.S.$938.0 million to Argentina mostly in loans for infrastructure programs. As of December 31, 2025, the aggregate principal amount outstanding under loans made by BCIE was U.S.$955.1 million, compared to U.S.$758.0 million as of December 31, 2024. As of December 31, 2025, U.S.$65.7 million in approved loans from BCIE remain undisbursed.
Bilateral Debt and Private Creditors’ Debt
Bilateral debt includes debt that is referred to as Paris Club debt and other bilateral debt. Paris Club debt includes all debt with country members of the Paris Club that has been restructured in negotiation rounds with members of the Paris Club. Other bilateral debt includes all other debt with sovereign governments. Substantially all of Argentina’s bilateral debt relates to debt owed to country members of the Paris Club and is treated under the Paris Club framework.
Private creditors’ debt is composed of debt with suppliers and debt with commercial banks. A portion of private creditors’ debt is guaranteed by export credit insurance granted by foreign government agencies and is generally treated under the Paris Club framework.
As of April 30, 2014, the total outstanding debt owed to members of the Paris Club amounted to U.S.$9,690 million, which consisted of U.S.$4,955 million in principal, U.S.$1,102 million in interest and U.S.$3,633 million in penalty interest. In May 2014, Argentina reached an agreement with the members of the Paris Club for the cancellation of the debt owed by Argentina in five years (the “Paris Club 2014 Settlement Agreement”), amounting to U.S.$9,690 million (U.S.$4,955 million in principal U.S.$1,102 million in interest and U.S.$3,633 million in penalty interest).
On April 7, 2020, the Minister of Economy sent the Paris Club members a proposal to modify the existing terms of the Paris Club 2014 Settlement Agreement, seeking mainly an extension of the maturity dates and a significant reduction in the interest rate. On June 22, 2021, the Minister of Economy announced that the Republic had obtained a “time bridge” within the framework of Paris Club negotiations, avoiding default. See “Recent Developments—Public Sector Debt—Debt Owed to Financial Institutions—Paris Club.”
On June 22, 2021, the Minister of Economy announced that the Republic had obtained a “time bridge” within the framework of Paris Club negotiations, avoiding default. The understanding provided that the Republic would have time through March 31, 2022 to reach a restructuring agreement with the Paris Club members, while it carried out efforts to reach an understanding with the IMF for the refinancing of the debt incurred under the SBA.
On May 30, 2022, the Government issued Decree No. 286/2022 announcing an agreement with the Paris Club to defer debt payments until the earlier of (i) the signing of a new agreement on the repayment of the outstanding obligations of the Republic or (ii) September 30, 2024.
On October 28, 2022, the Republic and the Paris Club creditors reached an agreement to amend the Paris Club 2014 Settlement Agreement, to reschedule an estimated stock of arrears of U.S.$1.9 billion. The repayment of the outstanding amounts under the Amended Paris Club Settlement Agreement is to be made in 13 installments over a six-year period.
On April 4, 2023, the Government reached an agreement with the Netherlands, Germany, Canada, Israel, Finland, Denmark and Austria under the framework of the Paris Club, to reschedule until 2028 the repayment of certain outstanding bonds.
Legal Proceedings
Following the Republic’s default on its debt at the end of 2001, creditors filed numerous lawsuits against the Republic in several jurisdictions, including the United States. Plaintiffs in these actions generally asserted that the Republic failed to make timely payments of interest and/or principal on their bonds, and sought judgments for the nominal value of and accrued interest on those bonds.
D-172
The Settlement
On February 5, 2016, the Republic published the terms of its proposal to settle eligible claims on Untendered Debt, including bonds in litigation in the United States, which was made subject to two conditions: first, obtaining approval by the Argentine Congress, and second, lifting the pari passu injunctions, first issued by the U.S. District Court for the Southern District of New York (the “New York District Court”) in 2012, which had barred the Republic from making payment on certain external indebtedness unless it made a ratable payment to those holders of defaulted debt who had been awarded such injunctions. The proposal was not available for time-barred claims.
Creditors who settled their claims pursuant to the Settlement Proposal agreed to dismiss with prejudice all litigation against the Republic, including all enforcement proceedings.
On March 31, 2016, the Argentine Congress passed the Debt Authorization Law. On April 22, 2016, Argentina issued U.S.$16.5 billion of new debt securities in the international capital markets, and applied U.S.$9.3 billion of the net proceeds to satisfy settlement payments on agreements with holders of approximately U.S.$4.2 billion principal amount of Untendered Debt. On April 22, 2016, the New York District Court ordered the vacatur of all pari passu injunctions.
On July 20, 2016, Argentina published settlement procedures for holders of eligible German law governed bonds implementing the Settlement Proposal for those bonds.
In December 2018, Argentina convened meetings of holders of its four remaining series of outstanding bonds governed by Japanese law, to vote upon proposals that if approved would result in the adoption of the standard Settlement Proposal to settle the clauses of 100% of the outstanding Samurai Bonds. The meetings took place in February 2019 and Argentina completed payments in June 2019.
To date, the Republic has reached agreements with most creditors that held Untendered Debt as of December 31, 2015, and stipulations of dismissal and orders of satisfaction of judgment have been filed and approved by the courts in numerous actions. The Republic continues to seek to resolve its outstanding litigation through settlements. See “Recent Developments—Public Sector Debt—Legal Proceedings—The Settlement.”
D-173
Individual litigation in the United States
Since April 2016, holders of Untendered Debt have brought claims against Argentina on various grounds. Where defenses were available, such as statute of limitation and other defenses, Argentina has invoked them obtaining the dismissal of many proceedings. Likewise, Argentina has successfully defeated attempts by holders of Untendered Debt to obtain remedies based on the alleged breach by Argentina of the pari passu clause.
In June 2021, a group of plaintiffs obtained an ex parte order of attachment of the Republic’s so-called reversionary interest in any excess collateral for the Republic’s secured Brady bonds. In August 2022, the New York District Court issued a ruling confirming the attachment. Plaintiffs subsequently also sought attachment and turnover of the Republic’s reversionary interest in the excess deutsche mark-denominated collateral, which the New York District Court granted on March 28, 2023. The Republic appealed and the Second Circuit Court of Appeals (the “Second Circuit”) affirmed the New York District Court’s attachment and turnover orders on August 21, 2024. On January 27, 2025, the U.S. Supreme Court denied the Republic’s petition for certiorari from that ruling. On January 29, 2025, plaintiffs filed an application for a writ of execution. In March 2025, approximately U.S.$209.8 million was turned over to plaintiffs in partial satisfaction of their judgments.
In one case in which the plaintiff received a judgment in December 2020 for U.S.$95.4 million, the plaintiff filed a motion for turnover of the Republic’s shareholding in YPF S.A. on May 3, 2024. On June 30, 2025, the New York District Court granted the plaintiff’s motion for turnover and ordered the Republic to transfer its Class A and D shares to a global custody account at the Bank of New York Mellon (“Turnover Order”). The Republic sought a stay of the Turnover Order pending appeal, which was denied by the New York District Court but granted by the Second Circuit. Briefing was completed on December 12, 2025 and the appeal remained pending as of December 31, 2025. See “Recent Developments—Public Sector Debt—Legal Proceedings—The Settlement.”
On July 28, 2023, a group of plaintiffs filed an action in the New York District Court seeking more than U.S.$35.8 million in principal on defaulted Republic-issued bonds, following a prior action by the same parties that had been dismissed. On September 30, 2024, the New York District Court dismissed the action as time-barred under New York’s six-year limitations period and because the plaintiffs were not entitled to sue on the bonds under Argentine law. The plaintiffs appealed to the Second Circuit on October 29, 2024, and the appeal was fully briefed in 2025, with oral argument held on September 17, 2025. The appeal remained pending as of December 31, 2025. See “Recent Developments—Public Sector Debt—Legal Proceedings—Individual litigation in the United States.”
In July 2024, summary judgment motions were filed by plaintiffs in cases originally brought between 2015 and 2019 on approximately U.S.$36.4 million principal amount of 1993 and 1994 FAA bonds. Judgments were entered on August 14, 2024, for a total of approximately U.S.$134 million (including principal and interest). See “Recent Developments—Public Sector Debt—Legal Proceedings—The Settlement.”
On July 3, 2025, the plaintiffs that had obtained the attachment of the excess Brady collateral filed “me-too” turnover motions mirroring those that resulted in the Turnover Order. Pursuant to a stipulation entered among the parties, on August 20, 2025 the New York District Court stayed briefing and further proceedings on plaintiffs’ me-too motions until the resolution of the ongoing appeal of the Turnover Order. See “Recent Developments—Public Sector Debt—Legal Proceedings—The Settlement.”
Separately, on October 17, 2025, the plaintiff with a judgment from December 2020 moved for turnover of the Republic’s ownership interests in Banco de la Nación Argentina and Aerolíneas Argentinas. Briefing before the New York District Court was completed on December 8, 2025. The motion was stayed pending the resolution of the appeal of the Turnover Order. See “Recent Developments—Public Sector Debt—Legal Proceedings—The Settlement.”
GDP warrant litigation (United States and United Kingdom)
Plaintiffs have brought litigation in connection with a dispute regarding the calculation method for payment on the GDP-linked warrants issued by the Republic in 2005 and 2010.
On January 14, 2019, a plaintiff filed a complaint in the New York District Court based on purported ownership of approximately U.S.$797 million notional amount of GDP-linked warrants, seeking approximately U.S.$83.7 million for non-payment of amounts allegedly due under such GDP-linked warrants for the year 2013, plus interest. On April 18, 2019, the Republic moved to dismiss the complaint. The New York District Court granted the Republic’s motion on January 7, 2020, but granted plaintiff leave to file an amended complaint, which it did on March 9, 2020.
D-174
In October 2019, three additional plaintiffs filed separate complaints in the New York District Court, basing their claims on purported respective ownership of approximately U.S.$181 million, U.S.$343 million, and U.S.$1.4 billion notional amount of GDP-linked warrants. In December 2019, another group of plaintiffs filed a complaint based on purported collective ownership of over U.S.$1 billion notional amount of GDP-linked warrants, seeking an amount in excess of U.S.$75 million, to be determined at trial, for non-payment of amounts allegedly due under such GDP-linked warrants for the year 2013, plus interest. Pursuant to a stipulation entered by the parties after the New York District Court’s January 7, 2020 dismissal decision, these plaintiffs filed their amended complaints between March 9 and March 23, 2020. All five actions were coordinated in April 2020 and proceeded on the schedule for the Republic’s motion to dismiss the amended complaints. On March 29, 2021, the New York District Court denied the Republic’s motion to dismiss the amended complaints in the five coordinated actions.
On December 10, 2020, additional plaintiffs filed a separate complaint in the New York District Court, basing their claim on purported ownership of approximately U.S.$126 million national amount of GDP-linked warrants. On May 19, 2021, the Republic moved to dismiss this complaint. On February 15, 2022, the New York District Court denied the Republic’s motion to dismiss the complaint. This action has proceeded in coordination with the other five GDP-linked warrants actions.
On April 14, 2023, the Republic filed its motion for summary judgment in the six coordinated actions. The plaintiffs filed their opposition to the Republic’s motion and their cross-motion for summary judgment on June 13, 2023. The motions were fully briefed by October 2, 2023.
On March 31, 2024, the New York District Court in the six coordinated U.S. GDP-linked warrants actions for the year 2013 granted the Republic’s summary judgment motion and closed the case. On April 29, 2024, plaintiffs filed their notice of appeal before the Second Circuit. Briefing was completed on January 31, 2025, and oral argument took place on June 9, 2025. On July 16, 2025, the Second Circuit entered a summary order and judgment affirming the New York District Court’s order of March 31, 2024, resulting in dismissal of the case.
On September 25, 2024, the same group of plaintiffs as in the six coordinated U.S. GDP-linked warrants actions for the year 2013 filed a new complaint in the New York District Court based on purported ownership of 2005 and 2010 GDP-linked warrants, seeking approximately U.S.$1.3 billion for non-payment of amounts allegedly due under such GDP-linked warrants for the year 2013, plus interest. The Republic filed its motion to dismiss on January 27, 2025. On February 24, 2025, the New York District Court entered a joint stipulation and order to dismiss the complaint without prejudice.
On December 13, 2023, a group of plaintiffs filed a complaint in the New York District Court based on purported ownership of 2005 and 2010 GDP-linked warrants, seeking an unspecified amount allegedly due under such GDP-linked warrants for years after 2013, plus interest. On July 2, 2024, the Republic moved to dismiss this action. The plaintiffs filed an amended complaint on October 22, 2024, which the Republic moved to dismiss on December 23, 2024. Briefing was completed on April 29, 2025. On September 29, 2025, the New York District Court ruled on the Republic’s motion to dismiss, granting it with respect to the individual holders’ claims and the trustee’s claims for reference years 2014 to 2016 and bad faith and prevention doctrine, and denying it in relation to the trustee’s claims regarding the Republic’s payment obligation. The Republic filed its answer on November 12, 2025. See “Recent Developments—Public Sector Debt—Legal Proceedings—GDP warrant litigation.”
In August 2019, three claimants filed a claim in the High Court of England invoking ownership of approximately 5.5 billion notional amount of GDP-linked warrants, seeking approximately 384.7 million for non-payment of amounts allegedly due under such GDP-linked warrants for the year 2013. By an order dated December 10, 2019, a fourth claimant was added to the claim invoking ownership of approximately 3.1 billion notional amount of GDP-linked warrants and the claimants were given permission to serve amended particulars of claim accordingly. Further amendments were subsequently made to the claim to reflect increases in the holdings of the securities of the claimants, and re-amended particulars of claim were filed on December 23, 2019, invoking ownership of approximately 9.2 billion notional amount of GDP-linked warrants, seeking approximately 645.3 million, plus interest, for non-payment of amounts allegedly due under such GDP-linked warrants for the year 2013.
On September 14, 2022, the claimants in the GDP-linked warrants proceedings in the United Kingdom filed a new amendment to their particulars of claim in which they pleaded two additional remedies as alternatives to their claim for non-payment of amounts allegedly due under the warrants for the year 2013: (i) alleged damages for breach of contract in the amount of approximately 779.1 million plus interest or (ii) relief on the basis that the warrants were legally frustrated, in an amount to be determined at trial, if any.
The trial in this matter took place between October 17, 2022 and November 18, 2022. The High Court of England rendered judgment on April 5, 2023, declaring that the total payment amount due for the Euro-denominated GDP-linked warrants for the year 2013 was approximately 1.3 billion, plus interest and costs.
On June 30, 2023, the Republic filed an application for permission to appeal the judgment to the English Court of Appeal. On June 12, 2024, the English Court of Appeal dismissed the Republic’s appeal. The Republic subsequently sought permission to appeal to the U.K. Supreme Court on July 10, 2024, but permission was refused on October 14, 2024. See “Recent Developments—Public Sector Debt—Legal Proceedings—GDP warrant litigation.”
D-175
On June 23, 2025, the plaintiffs in the GDP-linked warrant litigation in the United Kingdom filed an action in the U.S. District Court for the District of Columbia (the “D.C. District Court”) seeking to enforce the final money judgment obtained in that litigation. In accordance with an order issued by the High Court of England on July 25, 2025, the outstanding amount was approximately 1.5 billion as of June 30, 2025. See “Recent Developments—Public Sector Debt—Legal Proceedings—GDP warrant litigation.”
Efforts to attach or execute Argentine property in U.S. Litigation
In the United States, creditors’ execution remedies against a foreign state are limited by the United States Foreign Sovereign Immunities Act of 1976 (the “FSIA”) to assets of such foreign state that are used for a commercial activity in the United States, among other requirements. The FSIA also provides special protection from attachment and execution to reserves of foreign central banks and military and diplomatic property. While most attempts to execute property of the Republic or of alleged alter egos of the Republic have been rejected by the courts, in a few instances plaintiffs seeking payment under Argentina’s Untendered Debt succeeded in attaching and restraining assets of the Republic (discussed herein).
Proceedings for foreign recognition of U.S. judgments
Certain plaintiffs have sought, and in some instances obtained, recognition of their U.S. judgments in foreign courts, including in the United Kingdom, Luxembourg, Spain, France, Belgium, Switzerland, Italy, Ghana and Argentina. Most of these plaintiffs have settled their claims against Argentina.
Litigation in Germany
Several bondholders commenced proceedings in Germany seeking to obtain pari passu relief similar to the relief granted by New York Courts. German courts at both the trial and appellate level have declined to grant such relief.
Plaintiffs who try to execute on their judgments may not attach assets used for diplomatic or consular purposes, such as bank accounts of the Republic’s embassy and consulates. To the Republic’s knowledge, plaintiffs in Germany have succeeded in attaching monies of the Republic held with paying agents (for the payment of interest on other Government debt). Some creditors have also attached the Republic’s claims against its former German local counsel and against other plaintiffs (i.e., those who withdrew their claims against the Republic or lost their actions in whole or in part), who are liable for the Republic’s costs (statutory attorneys’ fees and, if applicable, court fees) under Germany’s “losing party pays” system, to the extent the amount of such claims had not been set off by those plaintiffs.
Certain plaintiffs have sought recognition of their German judgments in foreign courts, including the United States, Luxembourg and Spain.
Litigation in Japan
In furtherance of discussions maintained with the Commissioned Companies for Bondholders relating to the implementation of its February 2016 Settlement Proposal with holders of its outstanding bonds governed by Japanese law that had not been tendered in the 2010 Exchange Offer, in December 2018, Argentina convened meetings of holders of its four remaining series of outstanding bonds governed by Japanese law, to vote upon proposals that if approved would result in the adoption of the standard Settlement Proposal to settle the clauses of 100% of the outstanding Samurai Bonds.
The Republic held bondholder meetings on February 22, 2019 for each of the four series of the remaining bonds under Japanese law, during which bondholders approved, by the requisite majority, resolutions that rendered the standard option under the February 2016 Settlement Proposal binding on all holders of such series of bonds, representing an aggregate settlement amount of JPY2,817,000,000 for the four series.
On October 29, 2019, the Tokyo High Court ruled that the resolutions adopted by bondholders by requisite majority for each of the four series were valid and binding on all holders of the series whether or not they voted for such resolutions. On May 20, 2021, the two-year period for the bondholders to seek payment expired. On October 13, 2021, the Republic’s Japanese counsel received two letters from the Commissioned Companies for Bondholders informing the Republic that they offset what they believe the Republic owes them for the Commissioned Companies for Bondholders’ expenses against the remaining funds that the banks are holding following the expiration of the two-year payment period for the bondholders. The letters state that the Commissioned Companies for Bondholders’ expenses exceed the amount of the remaining funds, accordingly they are not returning any remaining funds and instead they request the Republic to pay the balance (JPY 12,924,927 for Shinsei Bank and JPY 9,799,783 for Mitsubishi UFJ Bank).
D-176
Litigation in Spain
On April 10, 2014, a plaintiff who obtained a judgment in Germany initiated proceedings before a court in Madrid in order to attach the Republic’s assets located in Spain. On May 14, 2015, the court permitted that plaintiff to execute its German judgment on the Republic’s property in Spain. In December 2015, the court denied the Republic’s request to vacate that order and the Republic appealed the ruling. On September 28, 2016, the Court of Appeals granted the Republic’s appeal and vacated the lower court’s execution order. On January 25, 2019, Spain’s highest court agreed to hear the plaintiff’s appeal of the September 28, 2016 ruling by the Court of Appeals. On October 8, 2019, the Spanish high court issued a ruling in the plaintiff’s favor. Based on this ruling, the plaintiff could bring enforcement proceedings in the lower court, which the Republic could contest on other grounds. On May 25, 2020, a Spanish lower court rejected a request for attachment by the plaintiff. The plaintiff filed an application for review of the decision, which was rejected on July 15, 2020. The plaintiff filed an application for clarification, which was rejected on October 26, 2020. On November 3, 2020, the plaintiff filed another request for reconsideration and asked that the Republic be ordered to identify assets subject to embargo. The court dismissed additional requests from the plaintiff regarding identification of assets subject to attachment on January 13, 2021, May 5, 2021, and June 2, 2021.
On October 5, 2022, a plaintiff holding two German judgments gave notice to the Republic that the plaintiff planned to initiate an action for execution. The Republic filed its opposition on December 16, 2022, which the Court denied on February 12, 2023. On February 23, 2023, the Republic filed an appeal for reconsideration, which the Court dismissed on April 17, 2023. On July 12, 2023, the court issued a resolution publishing a letter from the Ministry of Foreign Affairs, European Union and Cooperation. On July 18, 2023, the Republic filed a brief arguing that the lack of report warranted nullity of the proceedings, which, on October 19, 2023, the court rejected. On June 12, 2024, the court required Banco de la Nación Argentina deposit in the Judicial Deposits and Consignments Account of this Court 358,160.49 against the account corresponding to the Republic. On June 19, 2024, the Republic filed an appeal for reconsideration of the Court’s decision. On June 28, 2024, the Court issued a resolution recognizing the appeal for reconsideration and inviting plaintiff to present his response.
ICSID Arbitration
Argentina has been a party to arbitration proceedings under the 1965 Convention on the Settlement of Investment Disputes between States and Nationals of Other States (“ICSID Convention”), including as a result of measures implemented in 2001 and 2002 to address Argentina’s economic crisis.
Between 2013 and 2025, the Republic has settled ten final awards issued by ICSID tribunals against Argentina totaling approximately U.S.$1.25 billion, in principal, excluding interest and costs.
On August 24, 2021, a plaintiff filed an action in the D.C. District Court, seeking enforcement of an arbitral award issued against the Republic under the ICSID Convention. The Republic moved to dismiss on January 14, 2022. The Court denied the Republic’s motion to dismiss on August 19, 2024. The petitioner filed a motion for summary judgment on October 4, 2024, which the D.C. District Court granted on December 10, 2024, entering judgment in the amount of approximately U.S.$391 million, plus interest. The Republic appealed the D.C. District Court’s ruling on the motion to dismiss and briefing was completed on June 5, 2025. Oral argument before the D.C. Circuit Court of Appeals (the “D.C. Circuit”) was held on October 30, 2025. The appeal remained pending as of December 31, 2025. See “Recent Developments—Public Sector Debt—Legal Proceedings—ICSID Arbitration.”
On February 15, 2023, the Republic was notified of the same plaintiff’s attempt to have the same ICSID arbitral award recognized and enforced by the Madrid Civil Court No. 2. That action remains pending and plaintiff is currently pursuing asset discovery. In April 2023, the Republic received defective notification of the same plaintiff seeking to enforce the same award in the United Kingdom.
On September 20, 2021, another plaintiff filed an action in the D.C. District Court, seeking enforcement of an arbitral award issued against the Republic under the ICSID Convention. The plaintiff sought a judgment of approximately U.S.$21.3 million, plus interest. The Republic moved to dismiss on August 8, 2022. The D.C. District Court denied the Republic’s motion to dismiss on November 19, 2024. Plaintiff moved on January 8, 2025 for judgment on the pleadings to confirm its arbitral award, or in the alternative, summary judgment. On April 4, 2025, the D.C. District Court entered judgment in favor of plaintiff in the sum of approximately U.S.$21.3 million, plus interest. The Republic appealed on May 2, 2025. On June 2, 2025, the parties filed a joint motion to hold the proceedings in abeyance pending resolution of the appeal in the aforementioned ICSID award enforcement case filed on August 24, 2021. The court granted this motion on June 10, 2025. The appeal remained stayed as of December 31, 2025. See “Recent Developments—Public Sector Debt—Legal Proceedings—ICSID Arbitration.”
D-177
On December 7, 2021, other plaintiffs filed an action in Argentine courts, seeking enforcement of an arbitral award issued against the Republic under the ICSID Convention. The plaintiffs sought a judgment of approximately U.S.$1.0 million, plus interest. On June 13, 2023, the lower court rendered judgment granting enforcement of the award in the amount of approximately U.S.$1.0 million plus interest. On December 3, 2024, the court of appeals rejected plaintiffs’ appeal in relation to an issue of the budgetary provision made by the Government for compliance with the award. In September 2025, the Republic made payment of the June 13, 2023 judgment into the court account in the case file.
On January 14, 2025, the High Court of England issued a registration order granting certain claimants leave to register an award issued under the ICSID Convention for the purposes of enforcement. The claimants claim U.S.$225.7 million plus interest and costs. On August 1, 2025, the Republic applied to set aside the registration order. On August 22, 2025, the High Court of England issued an order to stay the proceedings pending judgment by the U.K. Supreme Court in two separate appeals to determine an issue that was material to the Republic’s set aside action. The stay lasted until 30 days after the U.K. Supreme Court’s judgment in those appeals was handed down. See “Recent Developments—Public Sector Debt—Legal Proceedings—ICSID Arbitration.”
On August 4, 2025, another plaintiff filed an action in the D.C. District Court, seeking enforcement of an arbitral award issued against the Republic under the ICSID Convention. The plaintiff seeks a judgment of approximately U.S.$824.4 million. See “Recent Developments—Public Sector Debt—Legal Proceedings—ICSID Arbitration.”
Other Arbitration
Claimants have also filed claims before arbitral tribunals under the rules of the United Nations Commission on International Trade Law (“UNCITRAL”) and under the rules of the International Chamber of Commerce (“ICC”).
Between 2013 and 2025, the Republic has settled three final UNCITRAL awards against Argentina totaling approximately U.S.$259.8 million in principal, excluding interest and costs.
See “Recent Developments—Public Sector Debt—Legal Proceedings—Other Arbitration.”
Other Non-Creditor Litigation in the U.S.
On April 8, 2015, Petersen Energía Inversora, S.A.U. and Petersen Energía, S.A.U. (the “Petersen Entities”) filed a claim against the Republic in the New York District Court in relation to the expropriation of YPF. The Petersen Entities sought compensatory damages arising out of an alleged breach of the bylaws of YPF by the Republic that allegedly occurred when it expropriated 51% of Class D shares of YPF. In September 2015, the Republic moved to dismiss the complaint, asserting, among other things, that the New York District Court lacks jurisdiction under the FSIA. On September 9, 2016, the New York District Court granted in part and denied in part the Republic’s motion to dismiss plaintiffs’ complaint. On July 10, 2018, the Second Circuit issued a decision affirming the New York District Court’s decision. On June 24, 2019, the U.S. Supreme Court denied Argentina’s petition for certiorari.
On November 3, 2016, Eton Park Capital Management, L.P., Eton Park Master Fund, Ltd. and Eton Park fund, L.P. (the “Eton Park Entities”) filed a complaint against the Republic seeking compensatory damages arising out of an alleged breach of the bylaws of YPF by the Republic resulting from the expropriation of 51% of Class D shares of YPF.
On August 30, 2019, the Republic filed a motion to dismiss the actions commenced by the Petersen and Eton Park Entities for forum non conveniens. On June 5, 2020, the New York District Court denied the motion. On July 20, 2020, the Court ordered a schedule for the consolidated Petersen and the Eton Park Entities’ complaints.
On April 14, 2022, the parties filed cross-motions for summary judgment. On March 30, 2023, the New York District Court granted summary judgment in favor of the Petersen and Eton Park Entities as to liability against the Republic. Trial was held from July 26 to July 28, 2023. On September 15, 2023, the Court entered a judgment against the Republic for U.S.$16.1 billion. The Republic appealed the judgment to the Second Circuit on October 10, 2023, and the Petersen and Eton Park Entities cross-appealed on October 18, 2023. Briefing was completed on the appeals on July 24, 2024. Oral argument before the Second Circuit was held on October 29, 2025. The appeal remained pending as of December 31, 2025.
Pending the appeal, enforcement of the New York District Court’s judgment was not stayed. The Republic and the Petersen and Eton Park Entities engaged in post-judgment discovery proceedings before the New York District Court. In addition, on June 30, 2025, the New York District Court granted the Petersen and Eton Park Entities’ turnover motion and ordered the Republic to transfer its Class D shares to a global custody account at the Bank of New York Mellon. The remaining developments were the same as in Turnover Order proceedings discussed above. The Second Circuit ordered the appeals regarding the Turnover Order across cases to proceed in tandem.
D-178
The Petersen and Eton Park Entities also sought recognition of the New York District Court’s judgment in Ireland, the United Kingdom, France, Luxembourg, Cyprus, Canada and Australia, which the Republic contested.
See “Recent Developments—Public Sector Debt—Legal Proceedings—Other Non-Creditor Litigation in the U.S.”
D-179