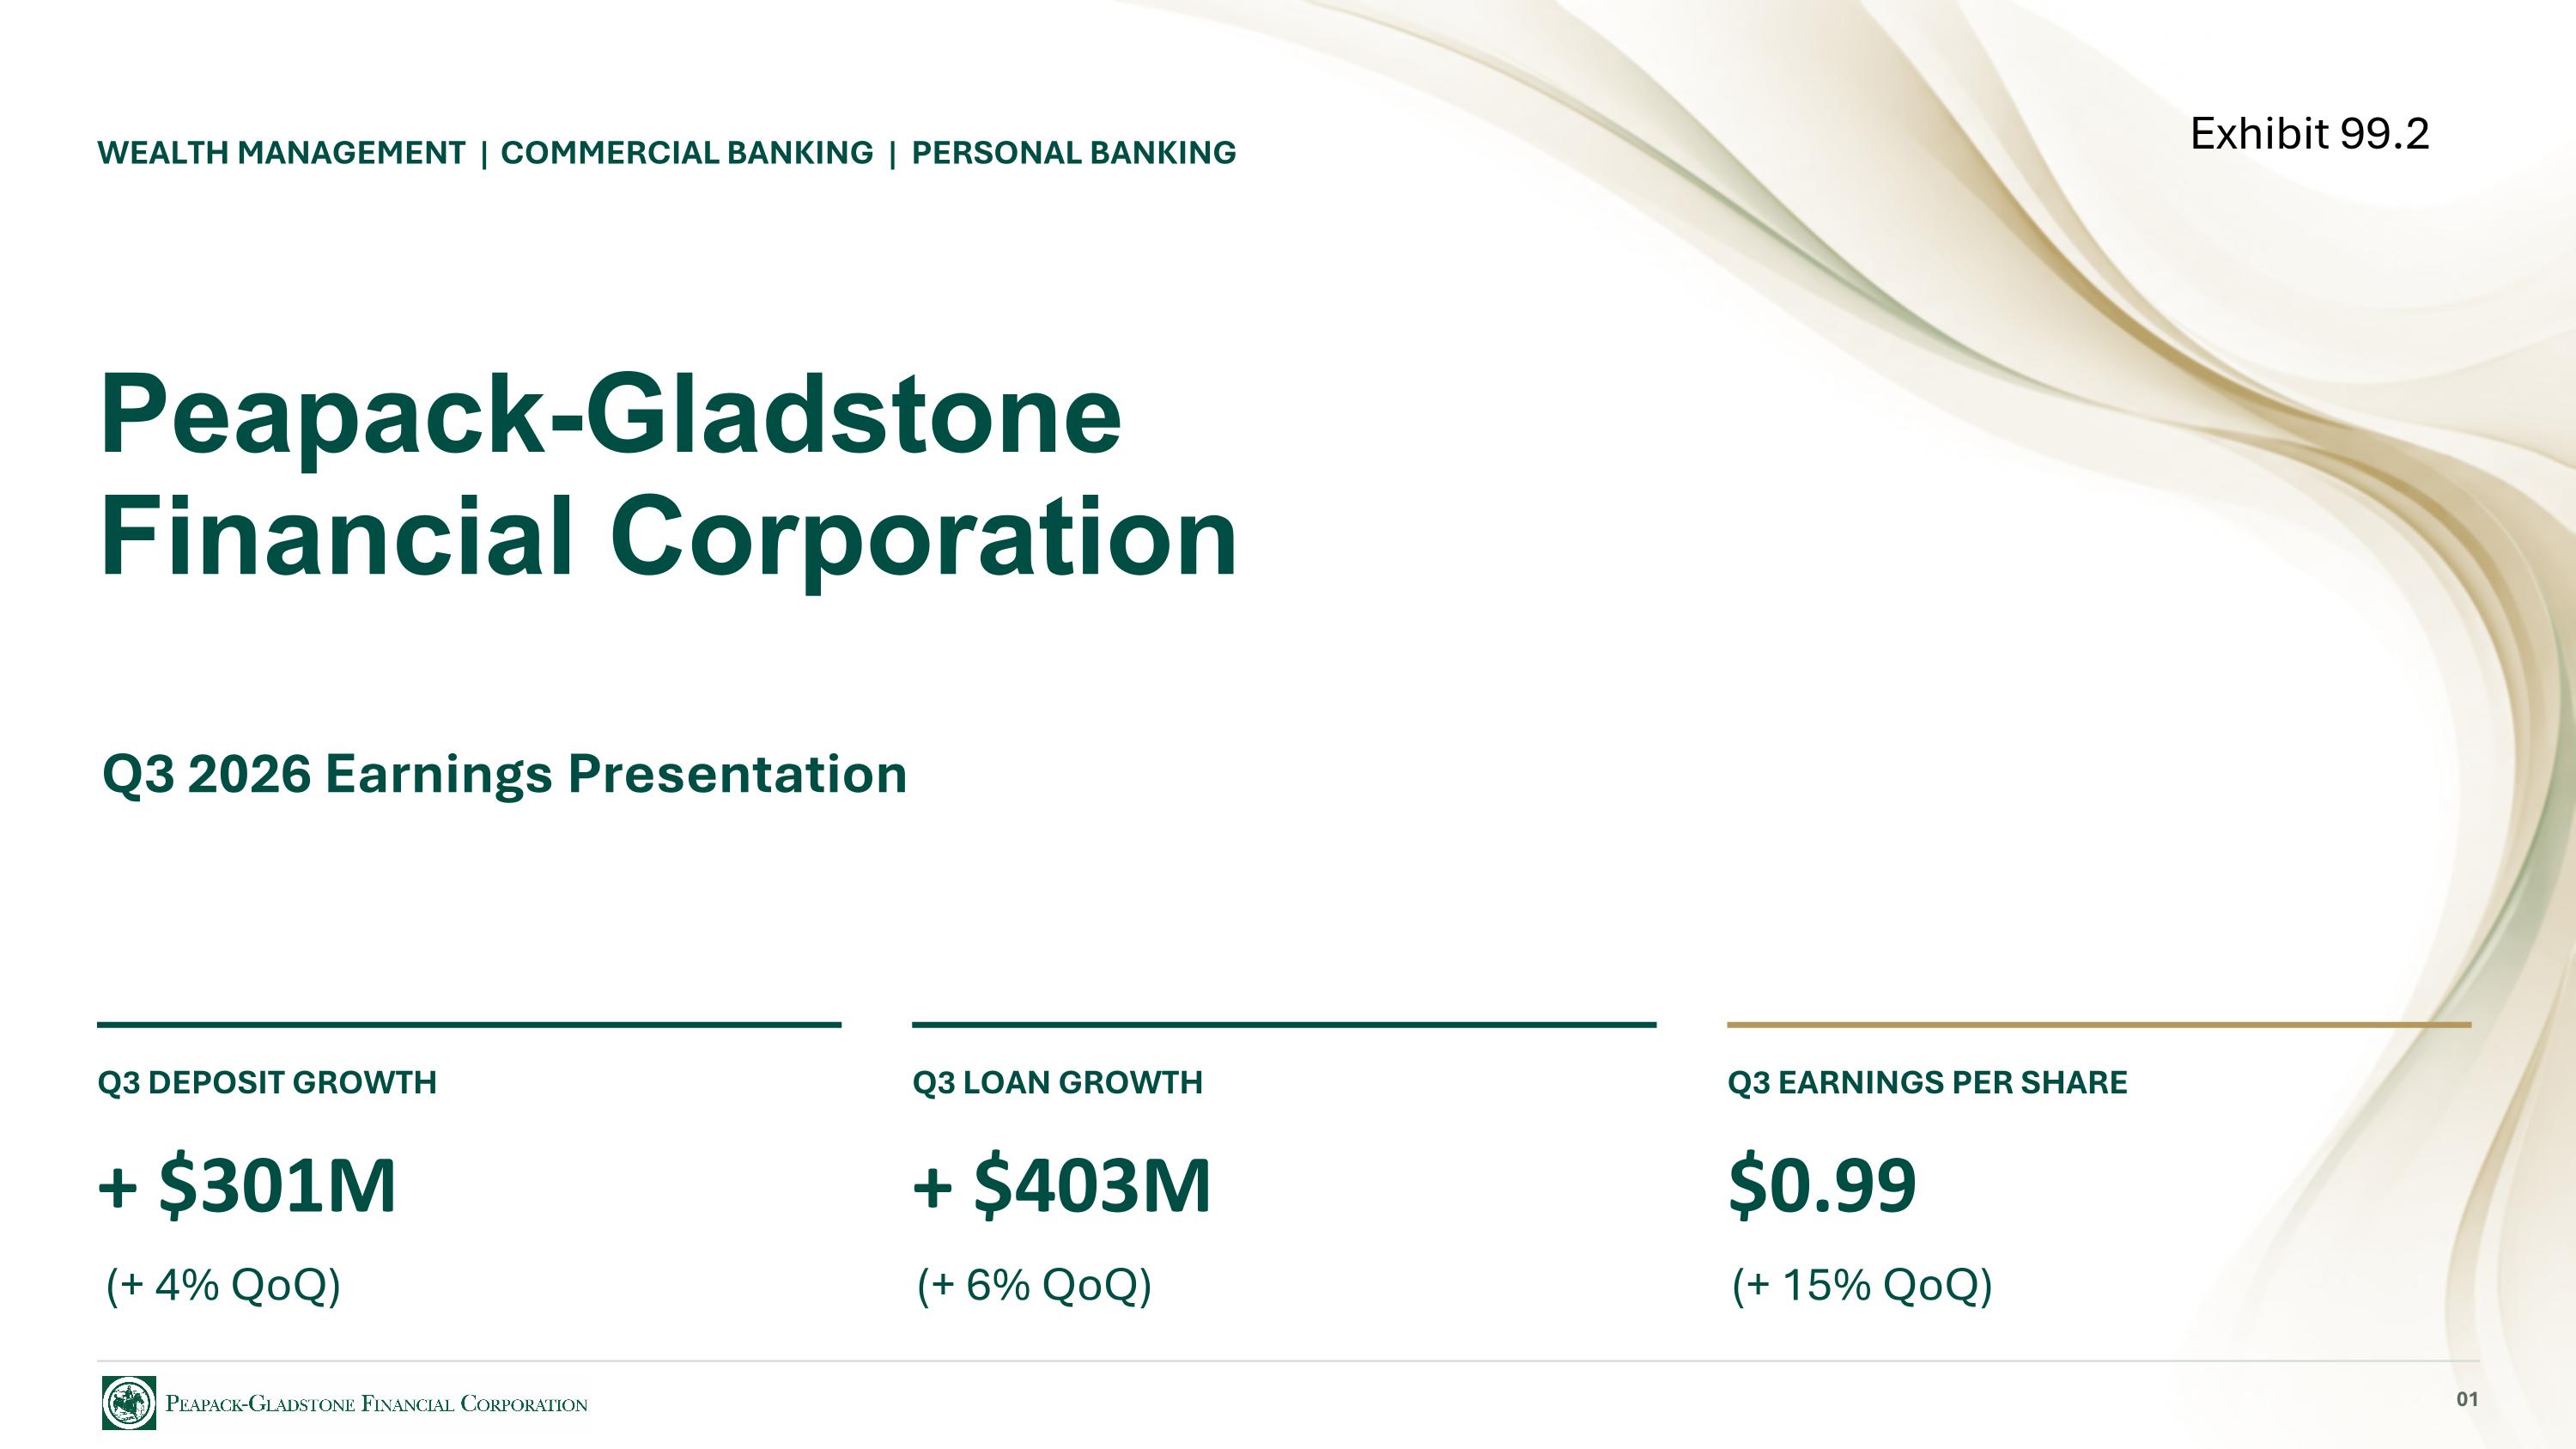
WEALTH MANAGEMENT | COMMERCIAL BANKING | PERSONAL BANKING Peapack-Gladstone Financial Corporation Q3 2026 Earnings Presentation Q3 DEPOSIT GROWTH + $301M Q3 LOAN GROWTH + $403M Q3 EARNINGS PER SHARE $0.99 01 (+ 4% QoQ) (+ 6% QoQ) (+ 15% QoQ) Exhibit 99.2
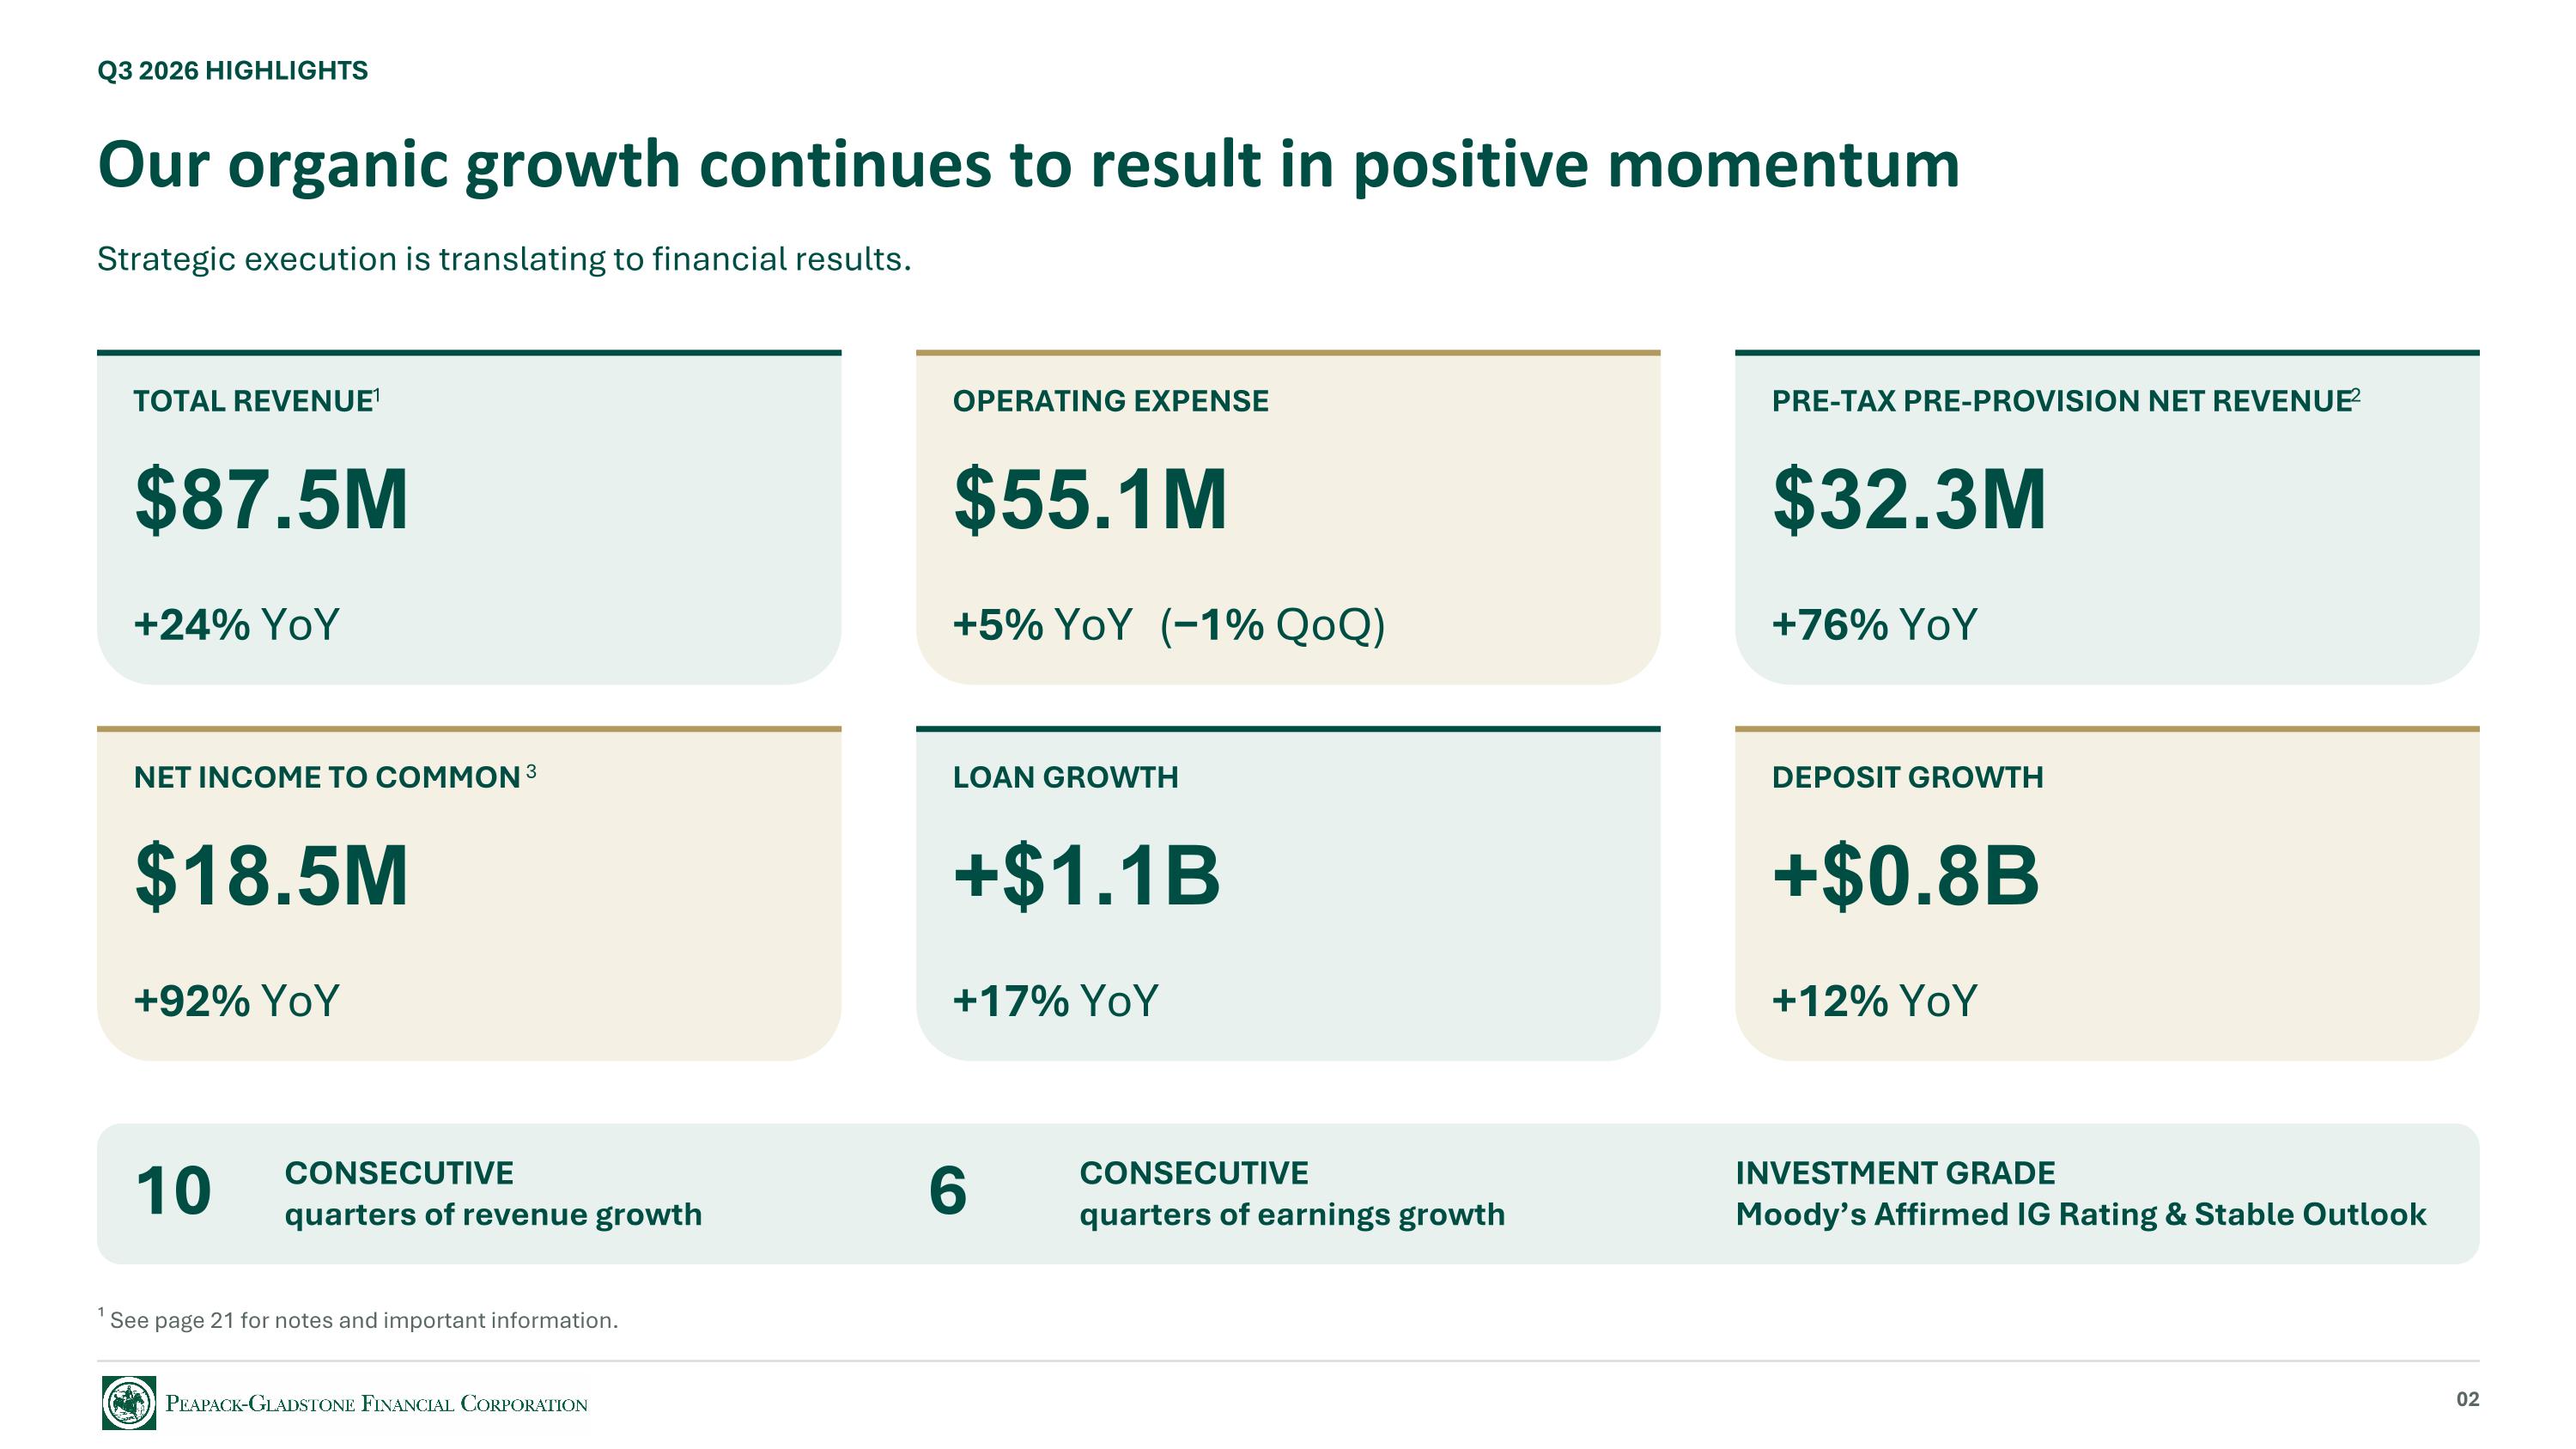
Q3 2026 HIGHLIGHTS Our organic growth continues to result in positive momentum TOTAL REVENUE1 $87.5M +24% YoY OPERATING EXPENSE $55.1M +5% YoY (−1% QoQ) PRE-TAX PRE-PROVISION NET REVENUE2 $32.3M +76% YoY NET INCOME TO COMMON 3 $18.5M +92% YoY LOAN GROWTH +$1.1B +17% YoY DEPOSIT GROWTH +$0.8B +12% YoY 10 CONSECUTIVE quarters of revenue growth 6 CONSECUTIVE quarters of earnings growth INVESTMENT GRADE Moody’s Affirmed IG Rating & Stable Outlook ¹ See page 21 for notes and important information. 02 Strategic execution is translating to financial results.
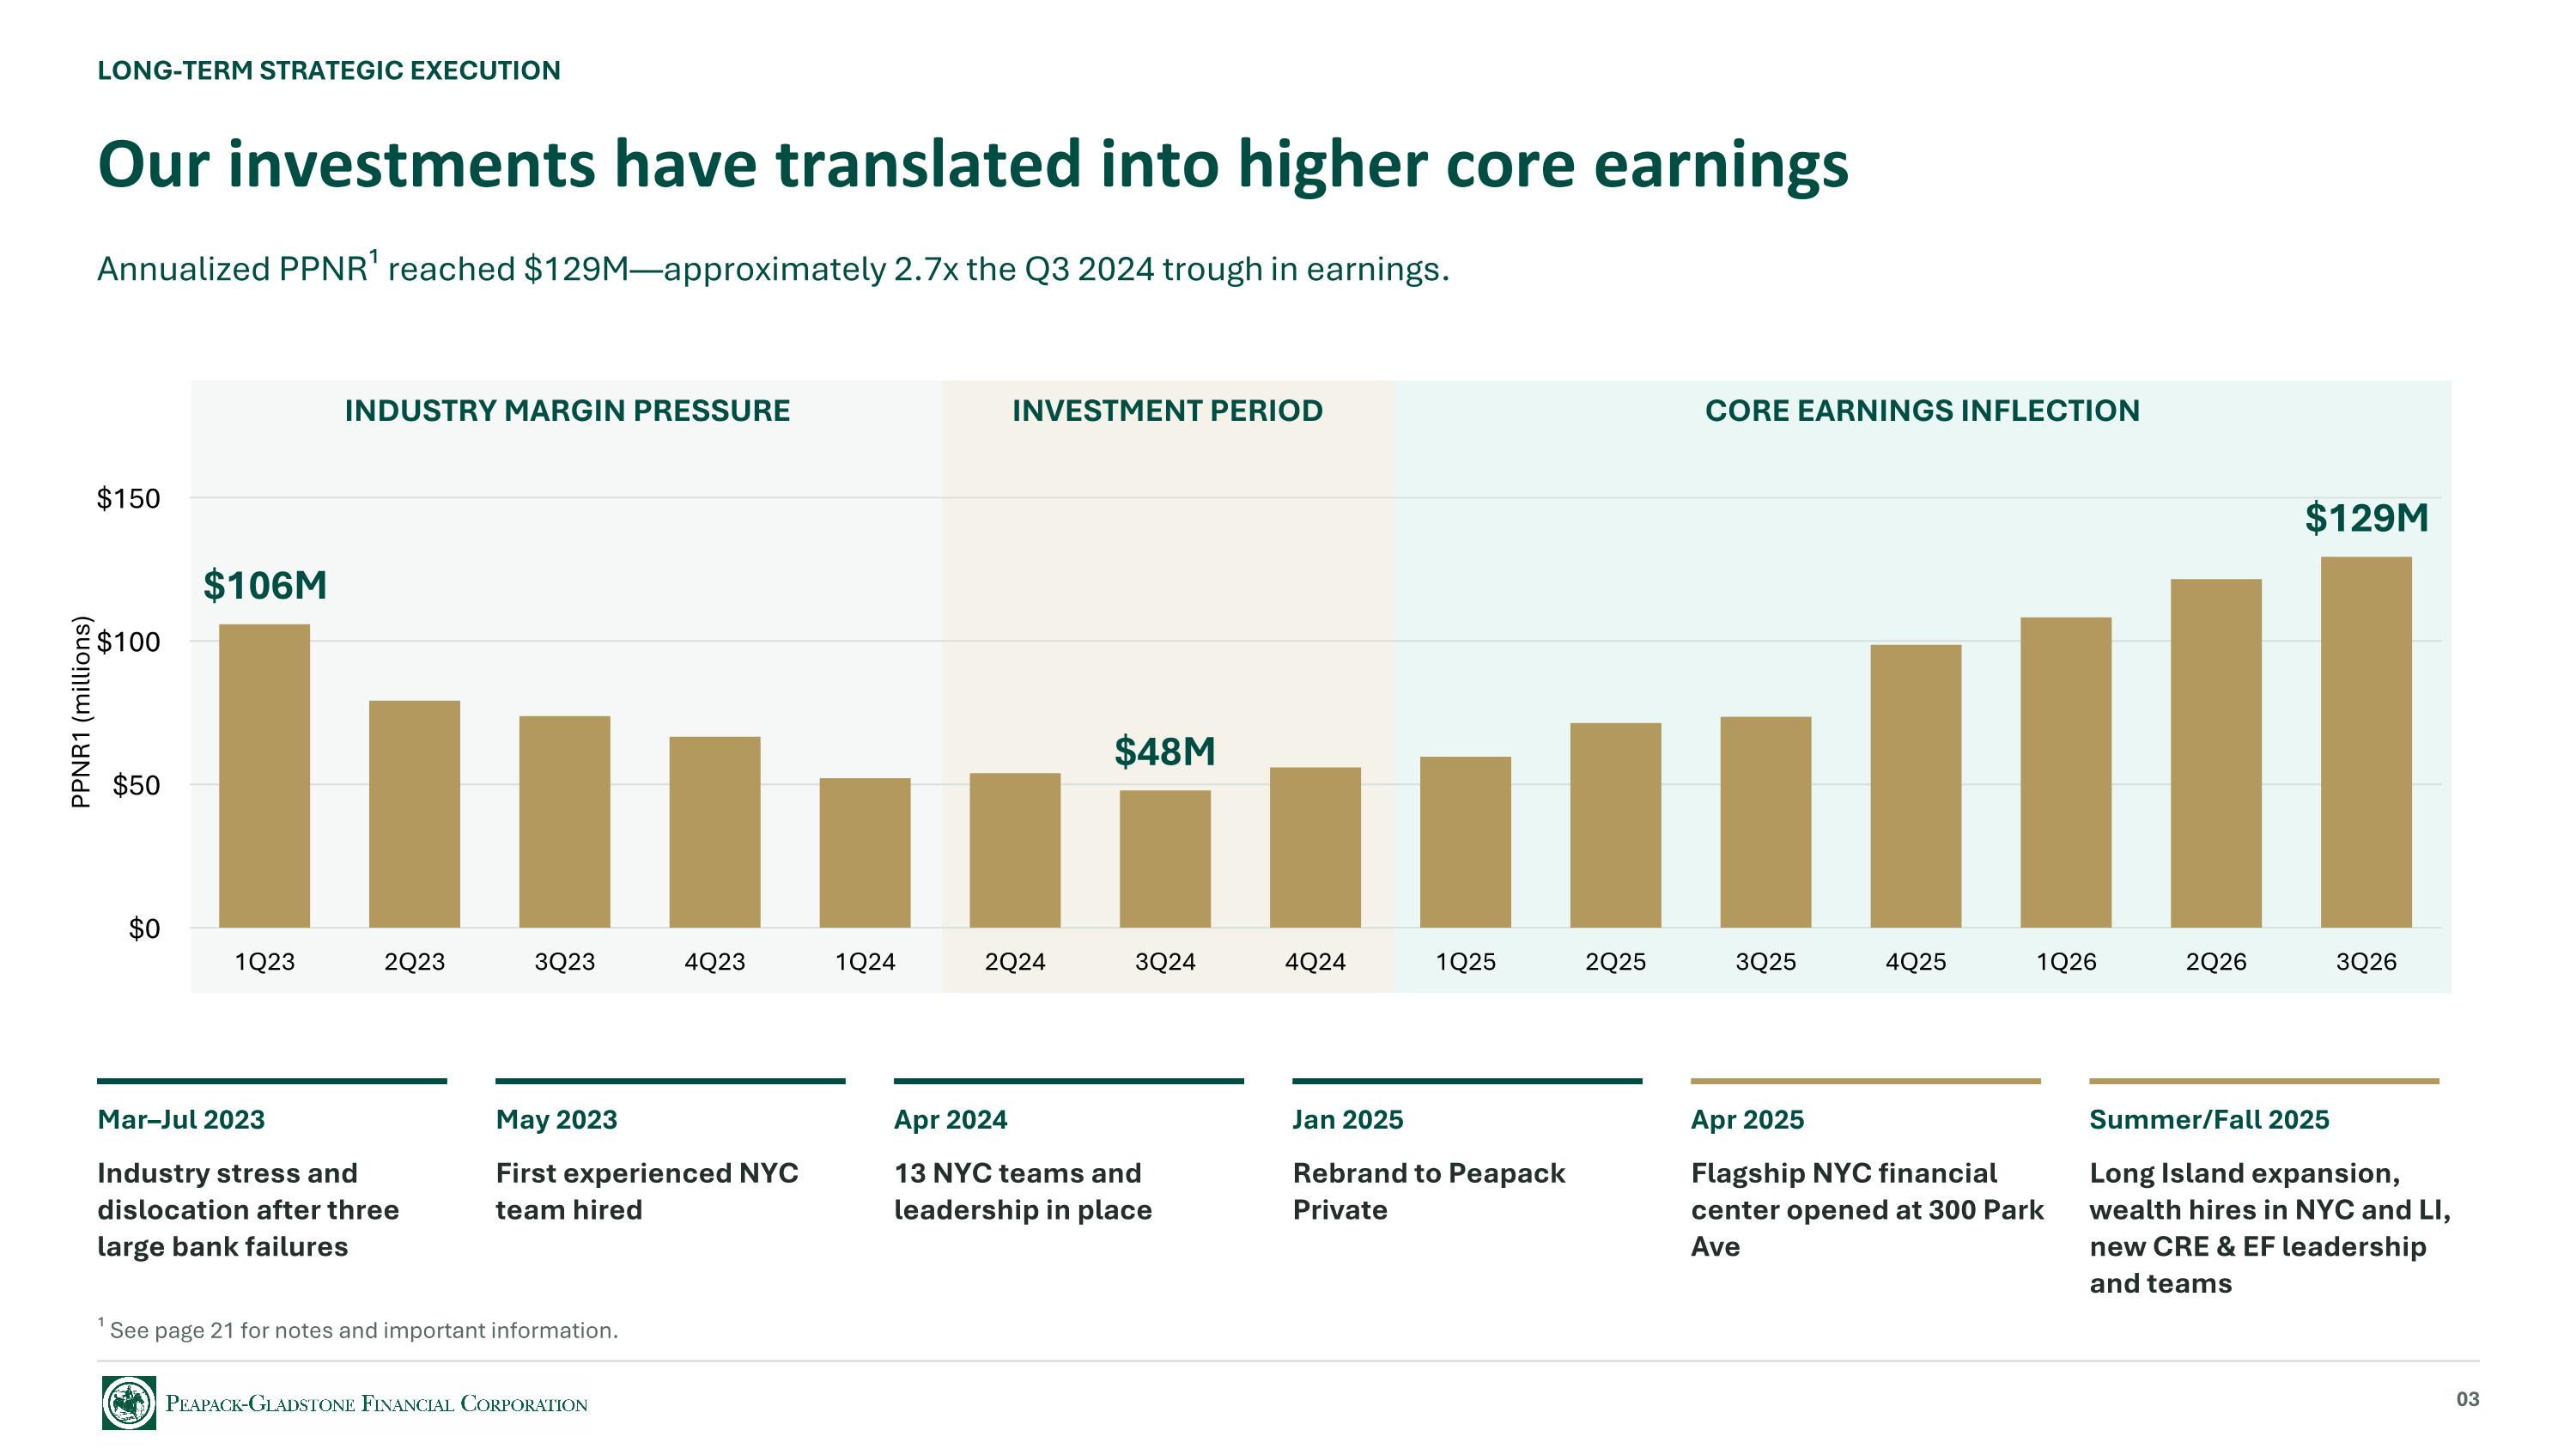
LONG-TERM STRATEGIC EXECUTION Our investments have translated into higher core earnings Annualized PPNR¹ reached $129M—approximately 2.7x the Q3 2024 trough in earnings. INDUSTRY MARGIN PRESSURE INVESTMENT PERIOD CORE EARNINGS INFLECTION ¹ See page 21 for notes and important information. 03 Mar–Jul 2023 Industry stress and dislocation after three large bank failures May 2023 First experienced NYC team hired Apr 2024 13 NYC teams and leadership in place Jan 2025 Rebrand to Peapack Private Apr 2025 Flagship NYC financial center opened at 300 Park Ave Summer/Fall 2025 Long Island expansion, wealth hires in NYC and LI, new CRE & EF leadership and teams
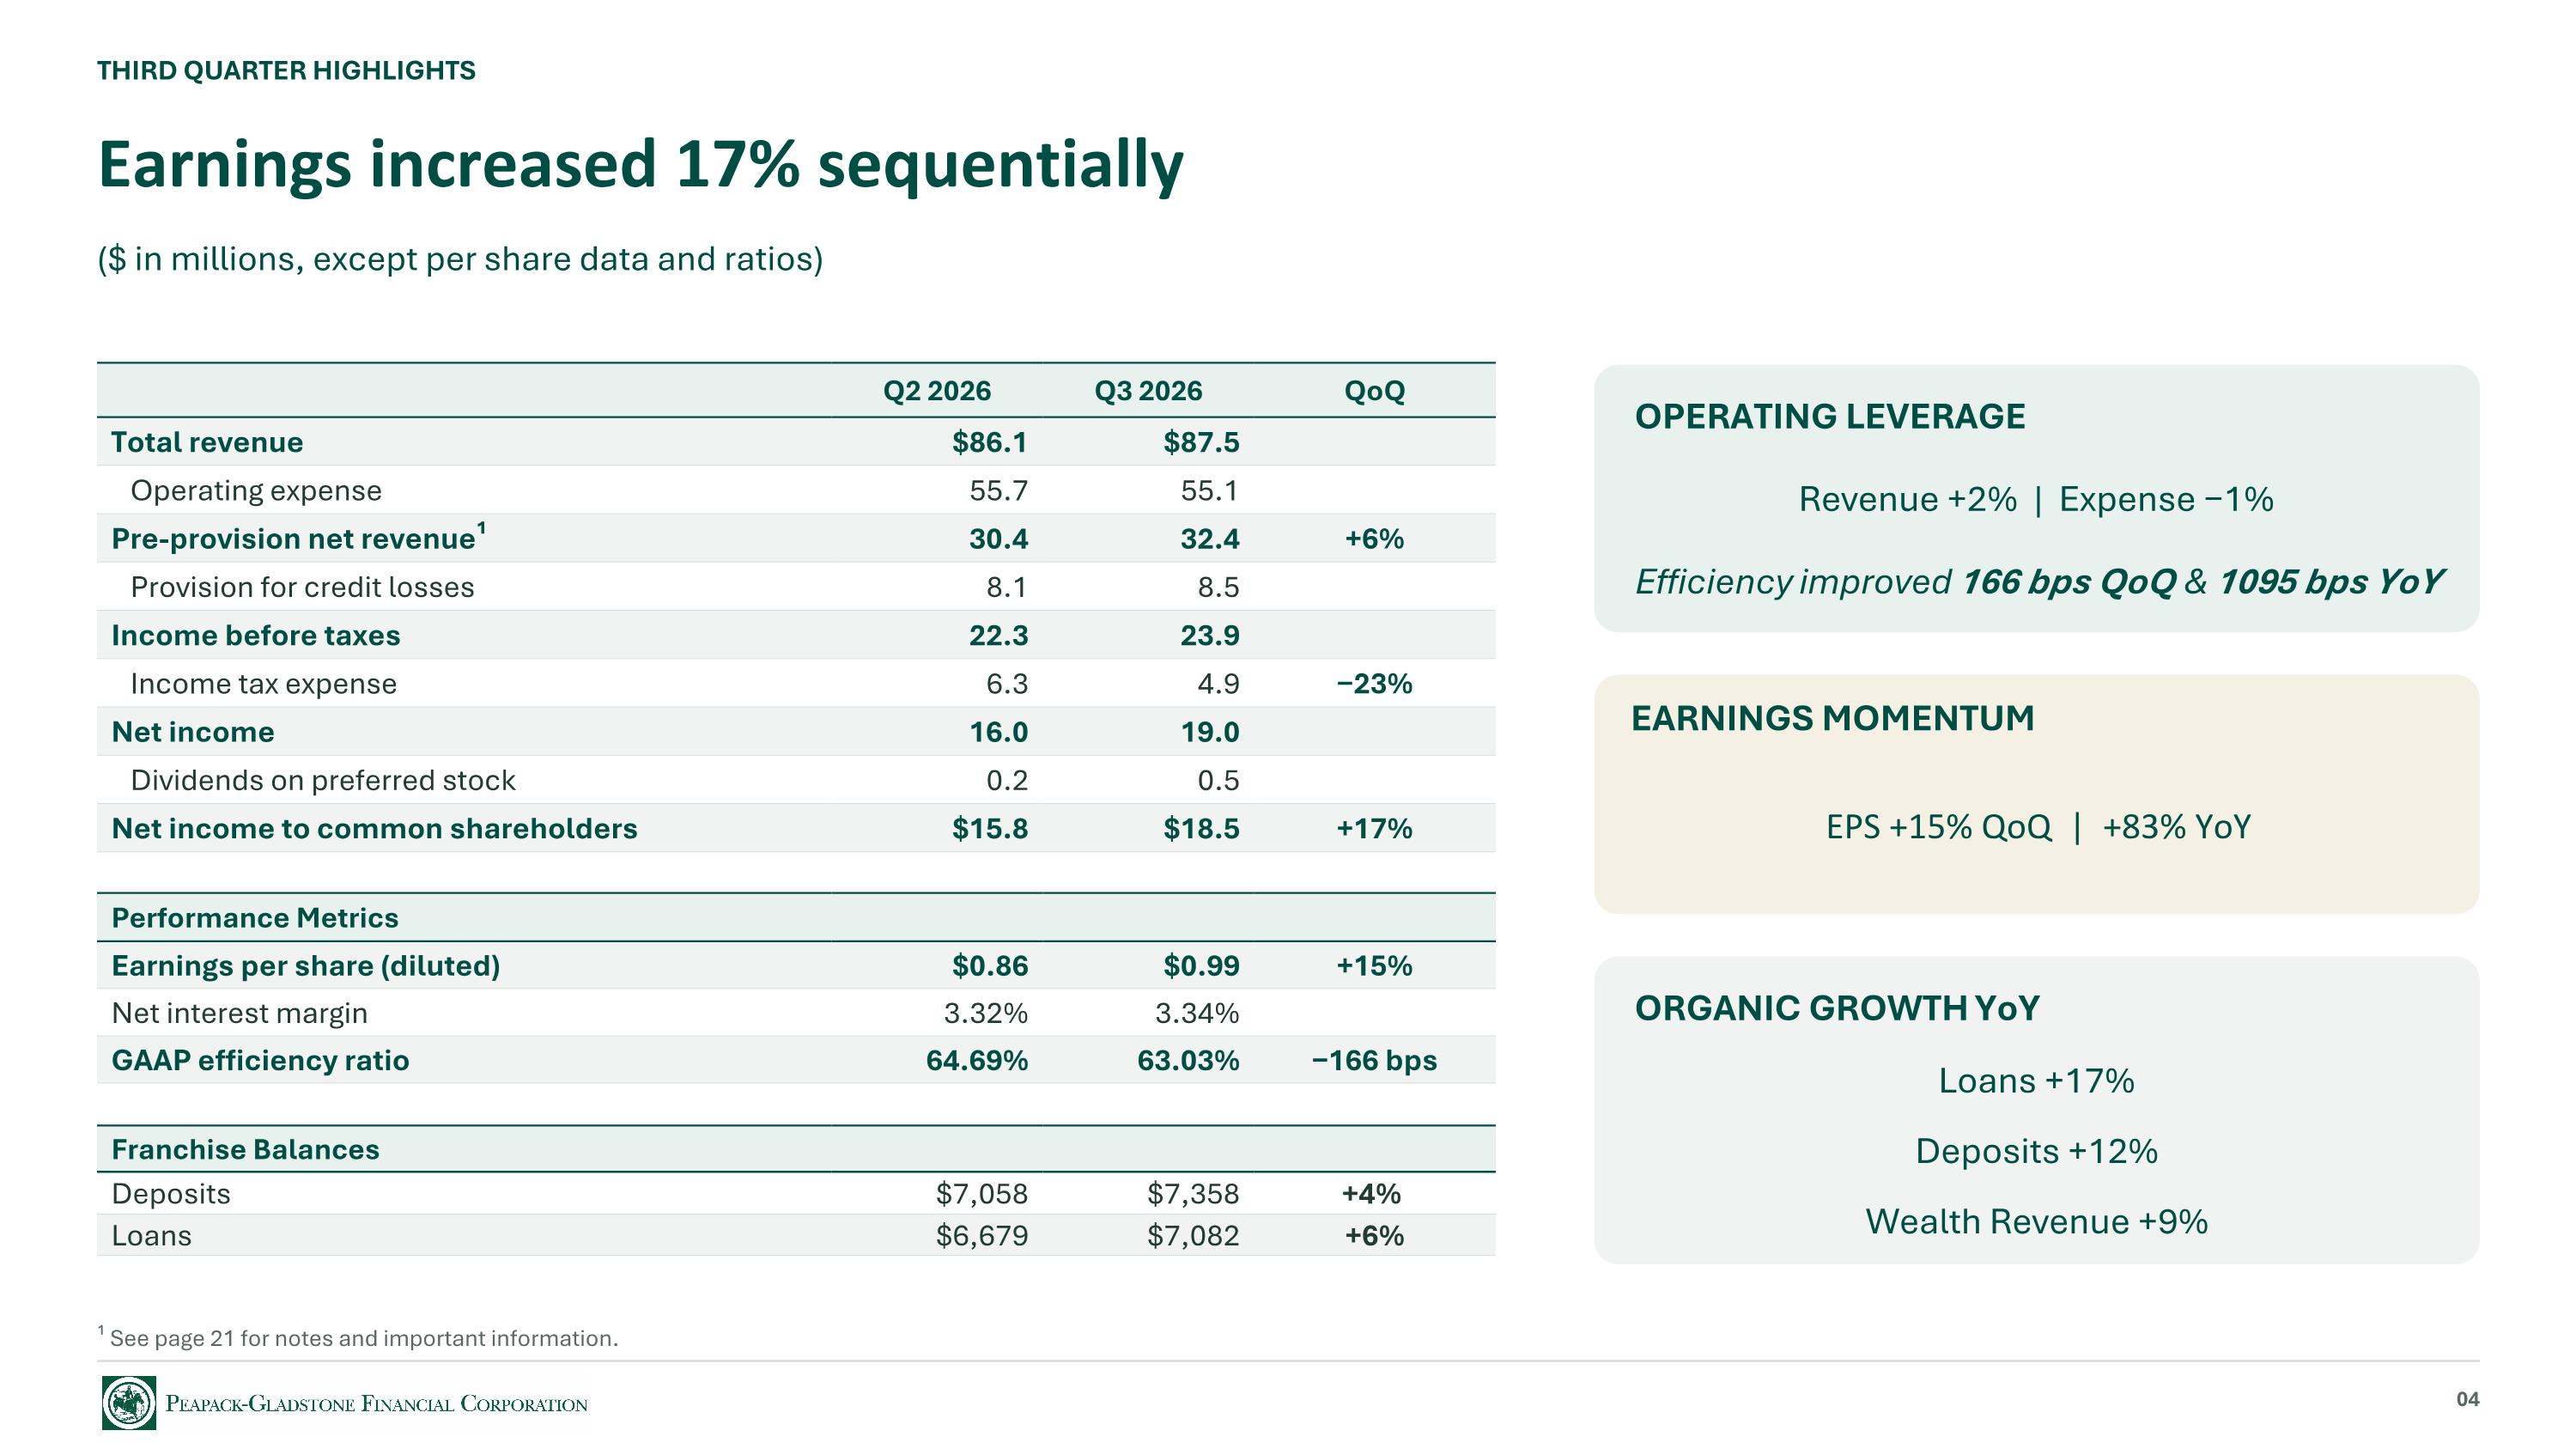
THIRD QUARTER HIGHLIGHTS Earnings increased 17% sequentially ($ in millions, except per share data and ratios) Q2 2026 Q3 2026 QoQ Total revenue $86.1 $87.5 Operating expense 55.7 55.1 Pre-provision net revenue¹ 30.4 32.4 +6% Provision for credit losses 8.1 8.5 Income before taxes 22.3 23.9 Income tax expense 6.3 4.9 −23% Net income 16.0 19.0 Dividends on preferred stock 0.2 0.5 Net income to common shareholders $15.8 $18.5 +17% Performance Metrics Earnings per share (diluted) $0.86 $0.99 +15% Net interest margin 3.32% 3.34% GAAP efficiency ratio 64.69% 63.03% −166 bps Franchise Balances Deposits $7,058 $7,358 +4% Loans $6,679 $7,082 +6% OPERATING LEVERAGE Revenue +2% | Expense −1% Efficiency improved 166 bps QoQ & 1095 bps YoY EARNINGS MOMENTUM EPS +15% QoQ | +83% YoY ORGANIC GROWTH YoY Loans +17% Deposits +12% Wealth Revenue +9% ¹ See page 21 for notes and important information. 04
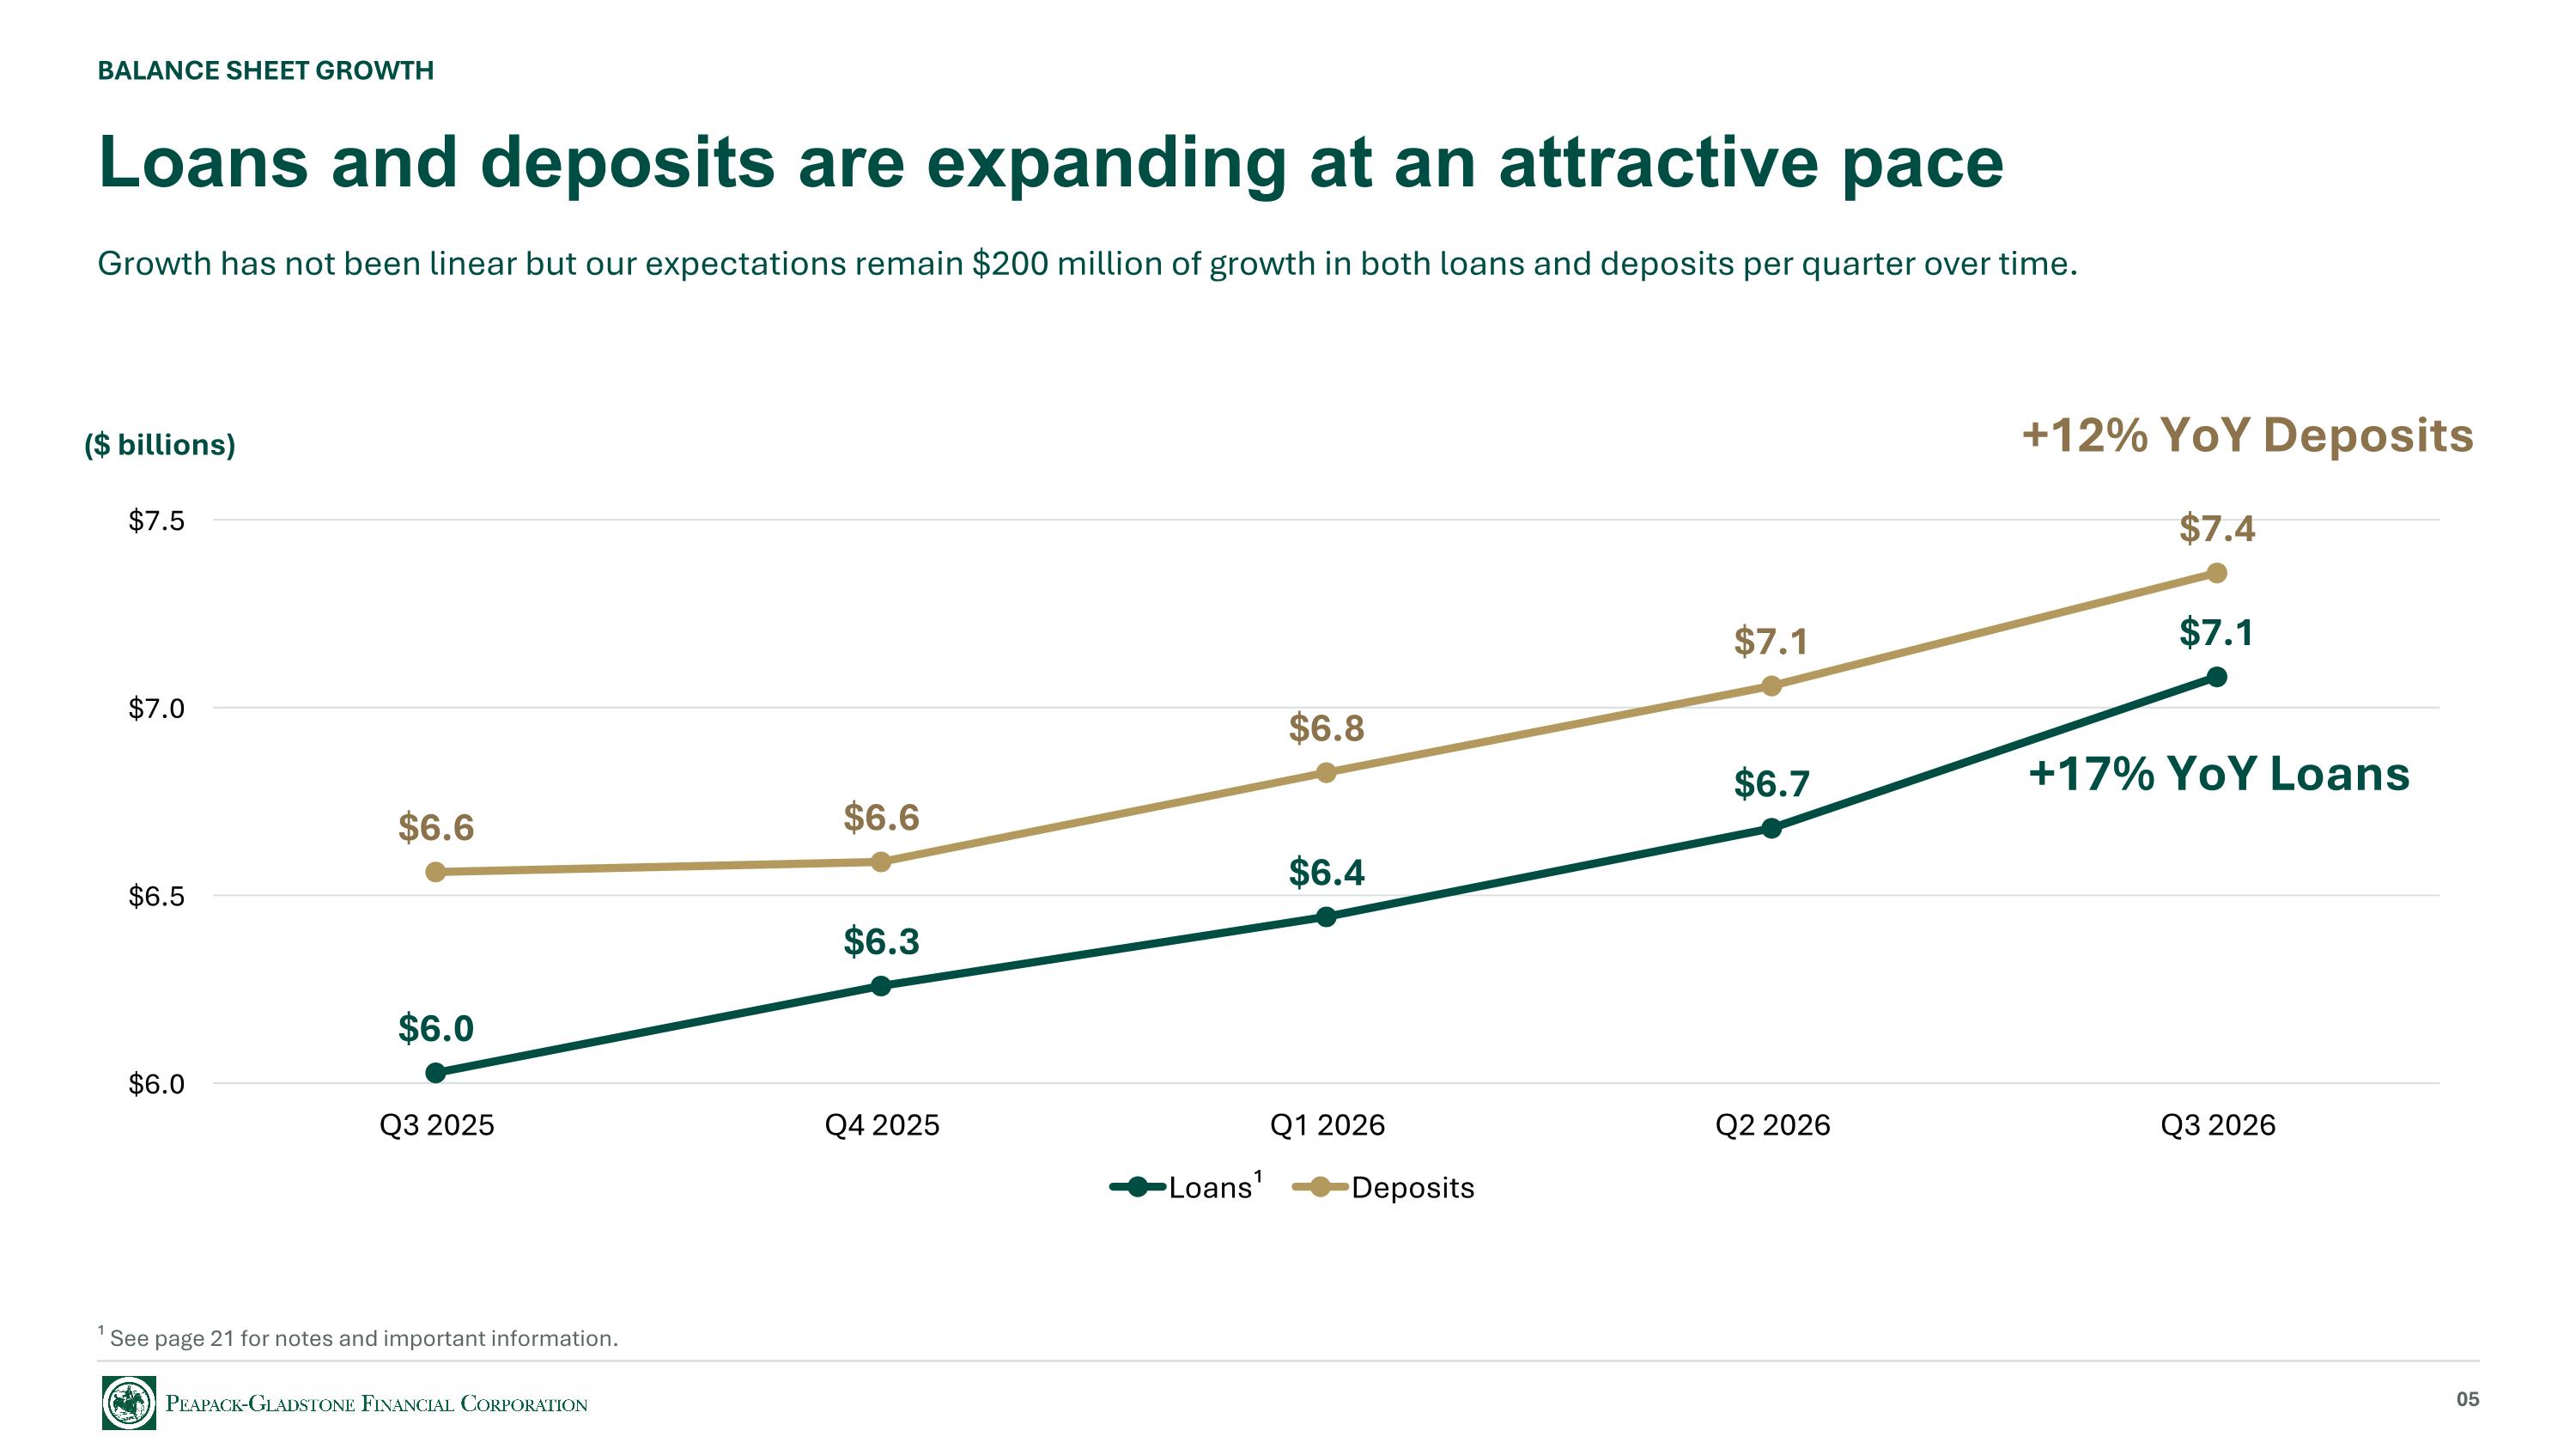
BALANCE SHEET GROWTH Loans and deposits are expanding at an attractive pace Growth has not been linear but our expectations remain $200 million of growth in both loans and deposits per quarter over time. 05 +17% YoY Loans +12% YoY Deposits ¹ See page 21 for notes and important information. ($ billions)
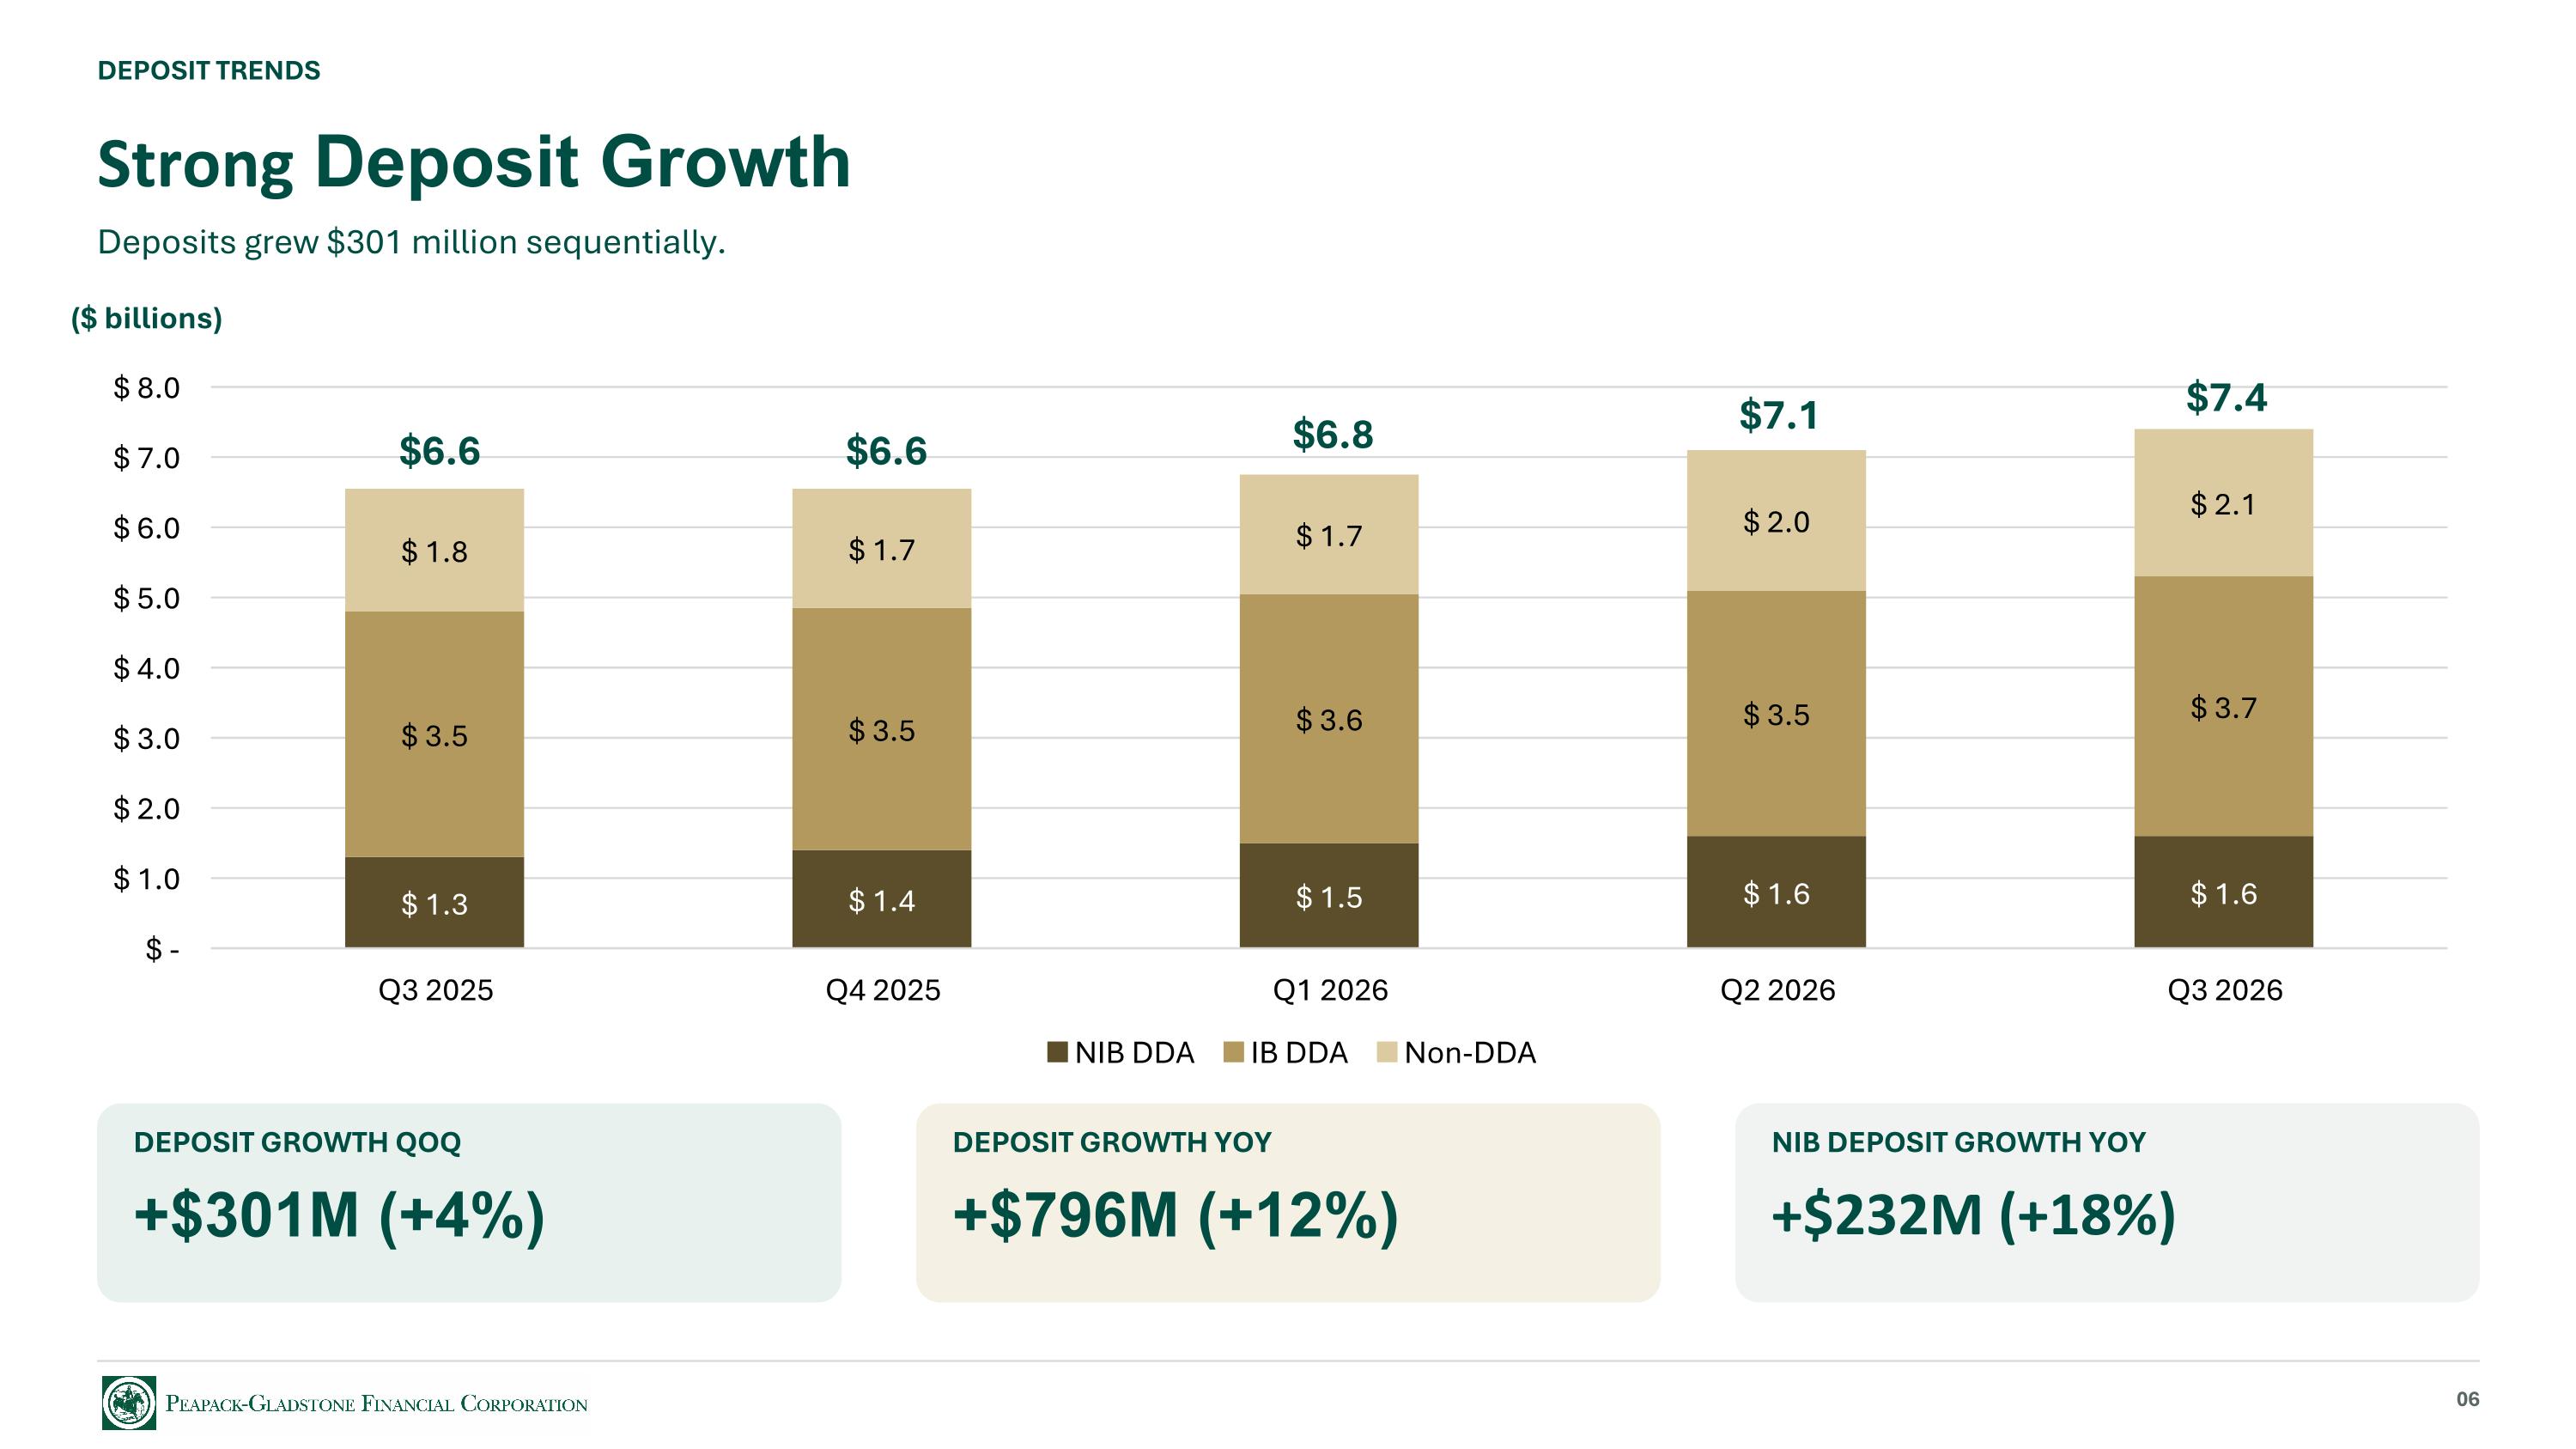
DEPOSIT TRENDS Strong Deposit Growth Deposits grew $301 million sequentially. DEPOSIT GROWTH QOQ +$301M (+4%) DEPOSIT GROWTH YOY +$796M (+12%) NIB DEPOSIT GROWTH YOY +$232M (+18%) 06 $6.6 $6.6 $6.8 $7.1 $7.4 ($ billions)
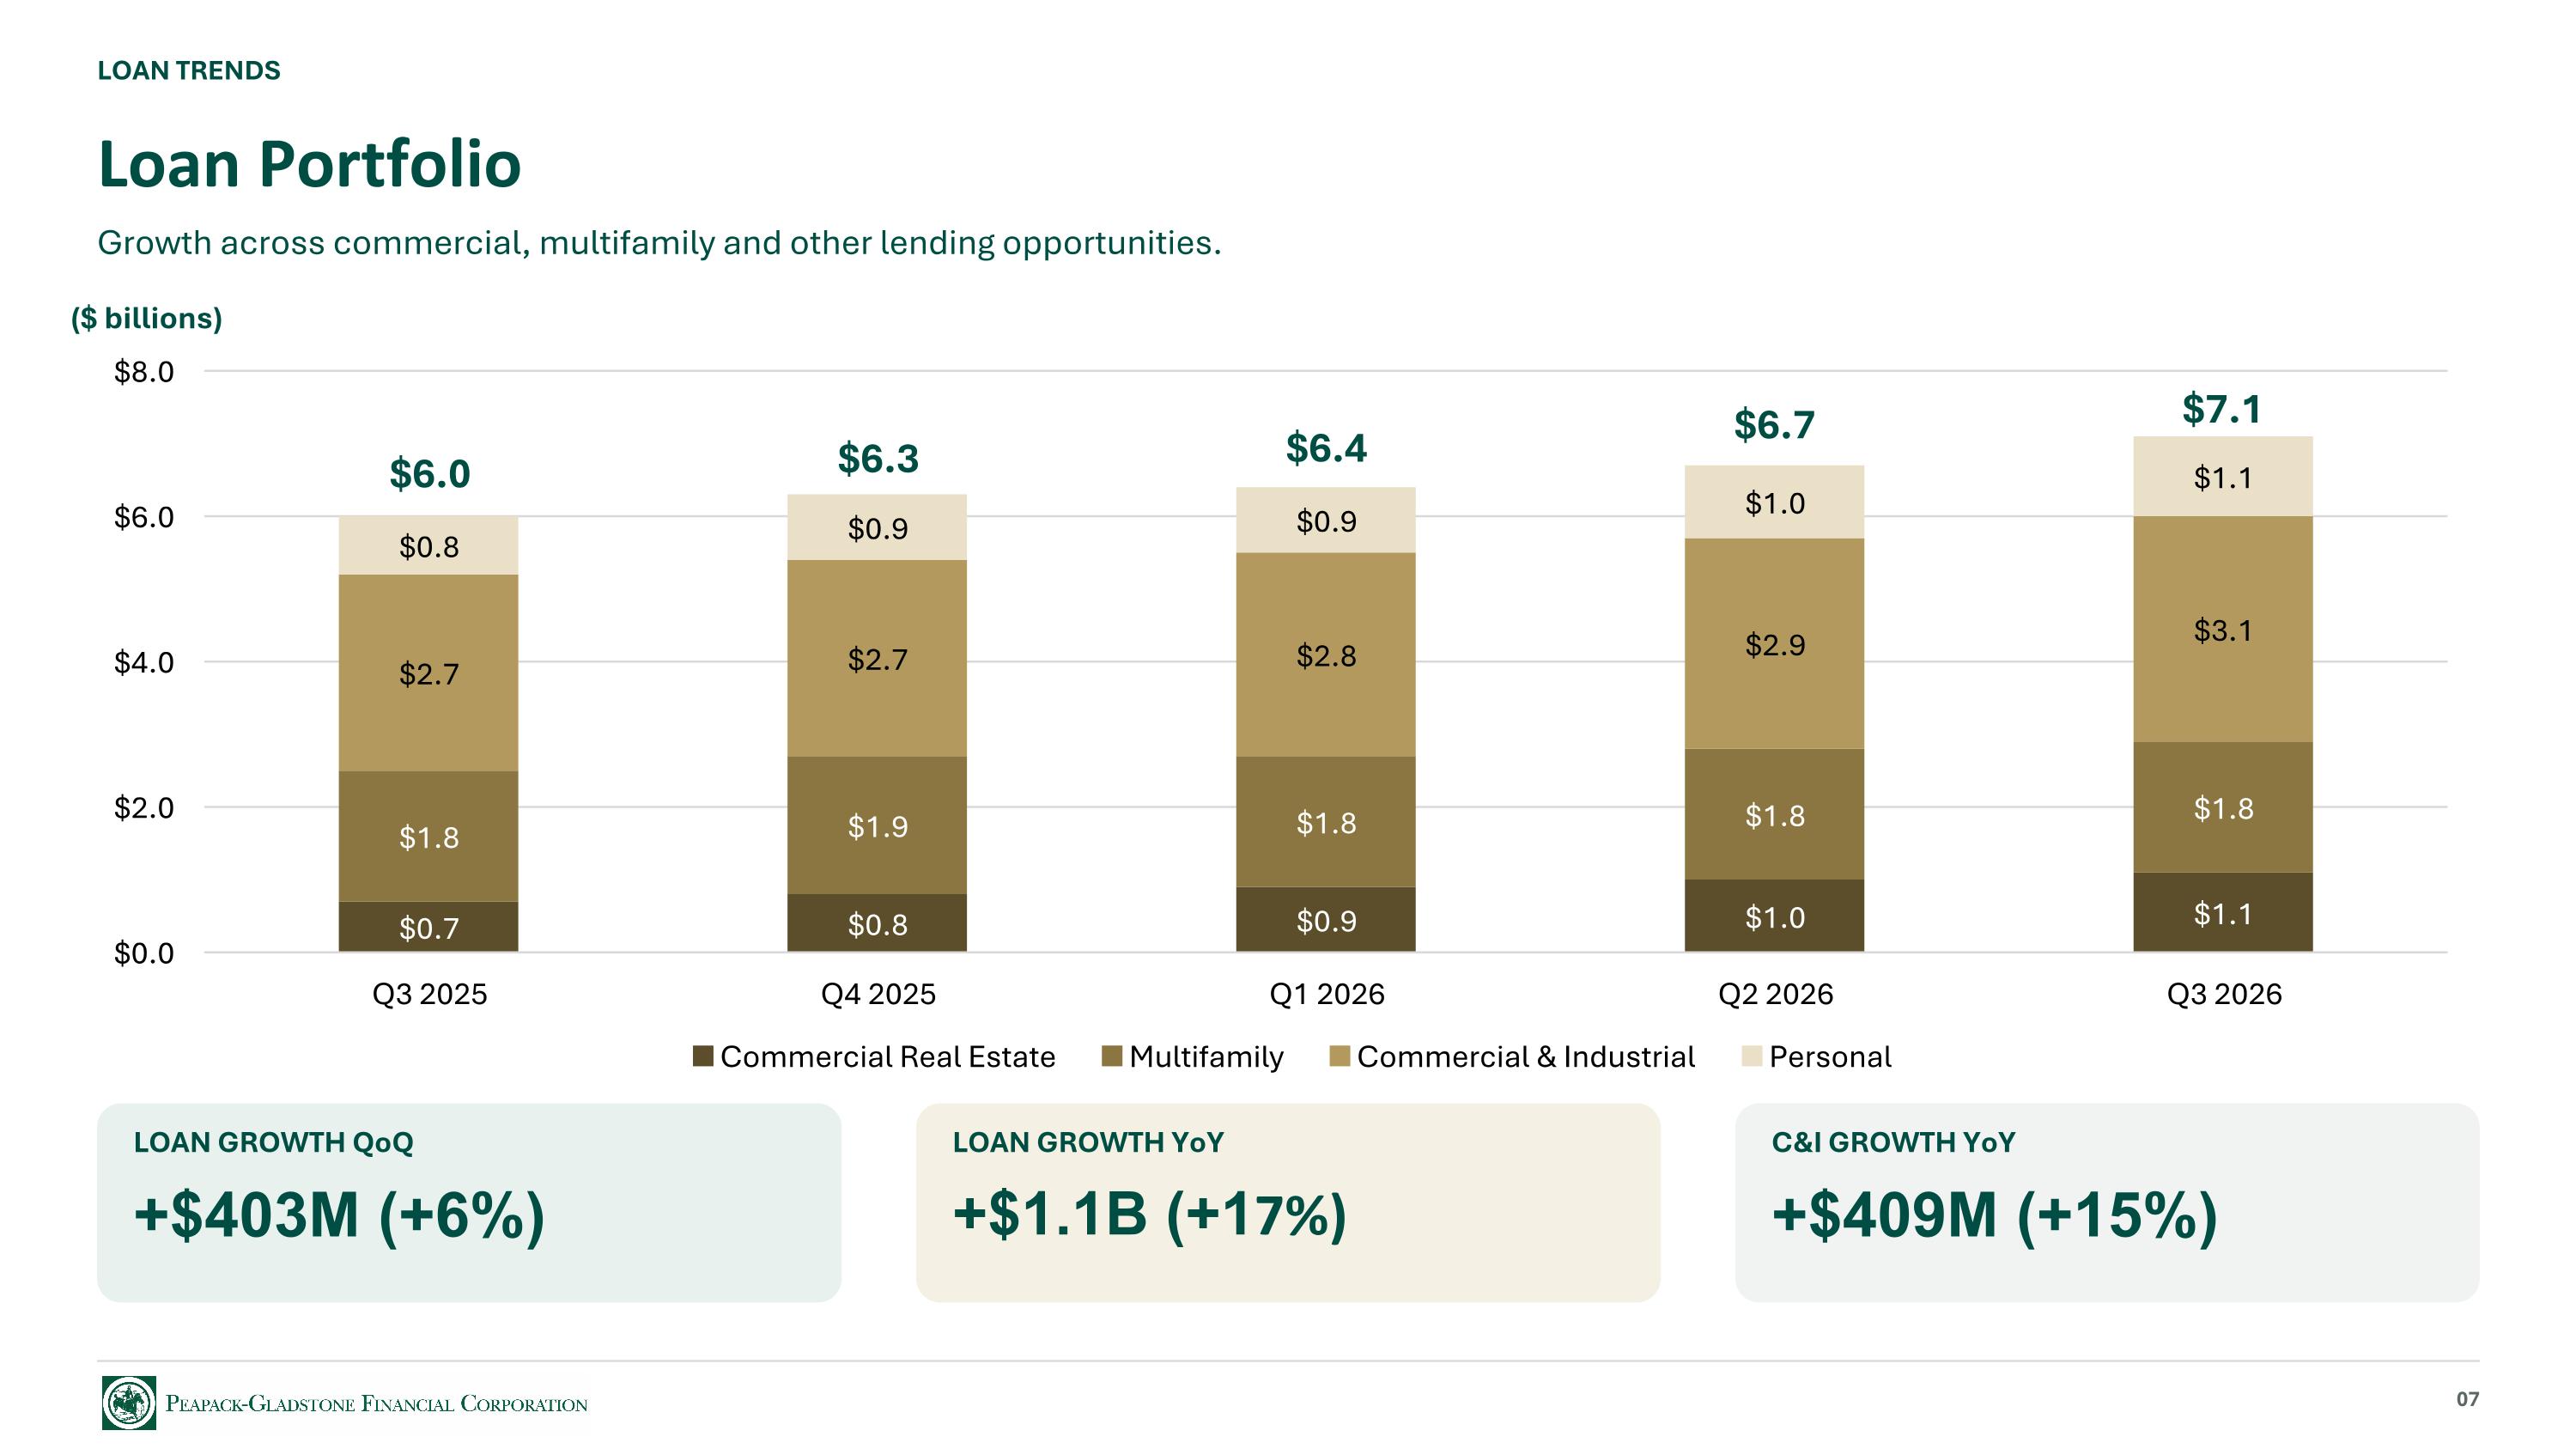
LOAN TRENDS Loan Portfolio Growth across commercial, multifamily and other lending opportunities. LOAN GROWTH QoQ +$403M (+6%) LOAN GROWTH YoY +$1.1B (+17%) C&I GROWTH YoY +$409M (+15%) 07 $6.0 $6.3 $6.4 $6.7 $7.1 ($ billions)
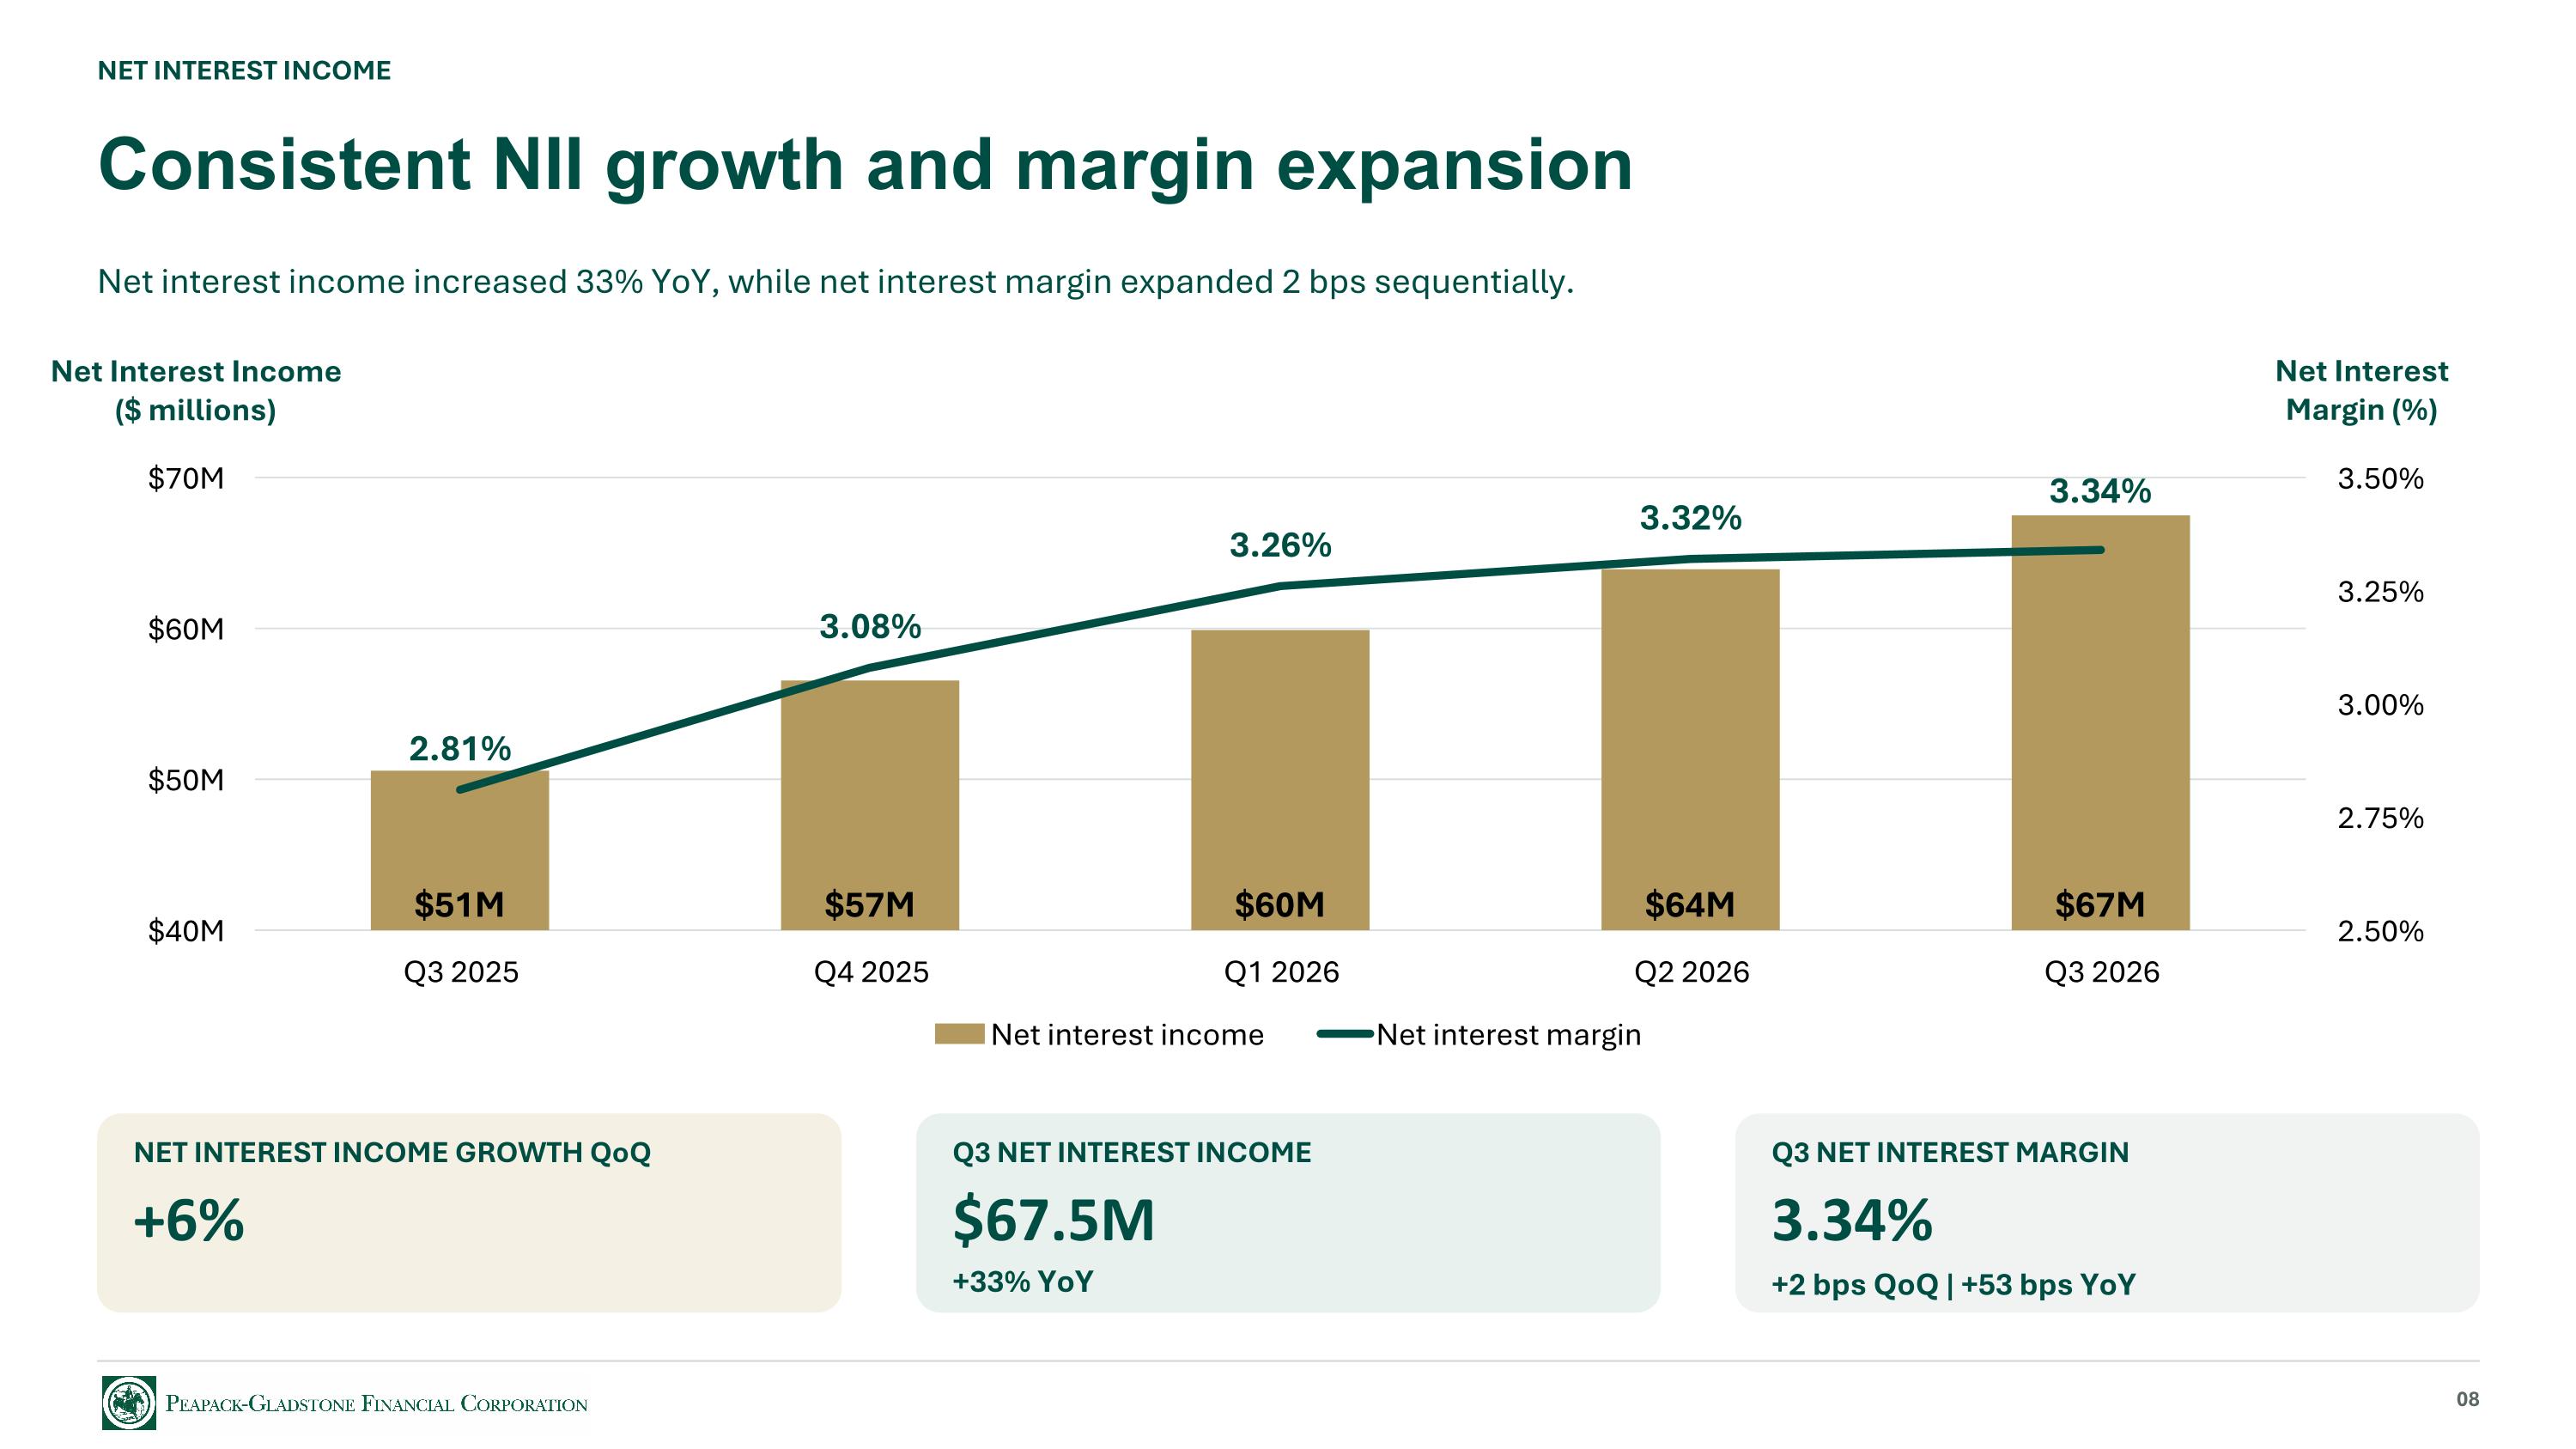
NET INTEREST INCOME Consistent NII growth and margin expansion Net interest income increased 33% YoY, while net interest margin expanded 2 bps sequentially. Net Interest Income ($ millions) Net Interest Margin (%) NET INTEREST INCOME GROWTH QoQ +6% Q3 NET INTEREST INCOME $67.5M Q3 NET INTEREST MARGIN 3.34% +2 bps QoQ | +53 bps YoY 08 +33% YoY
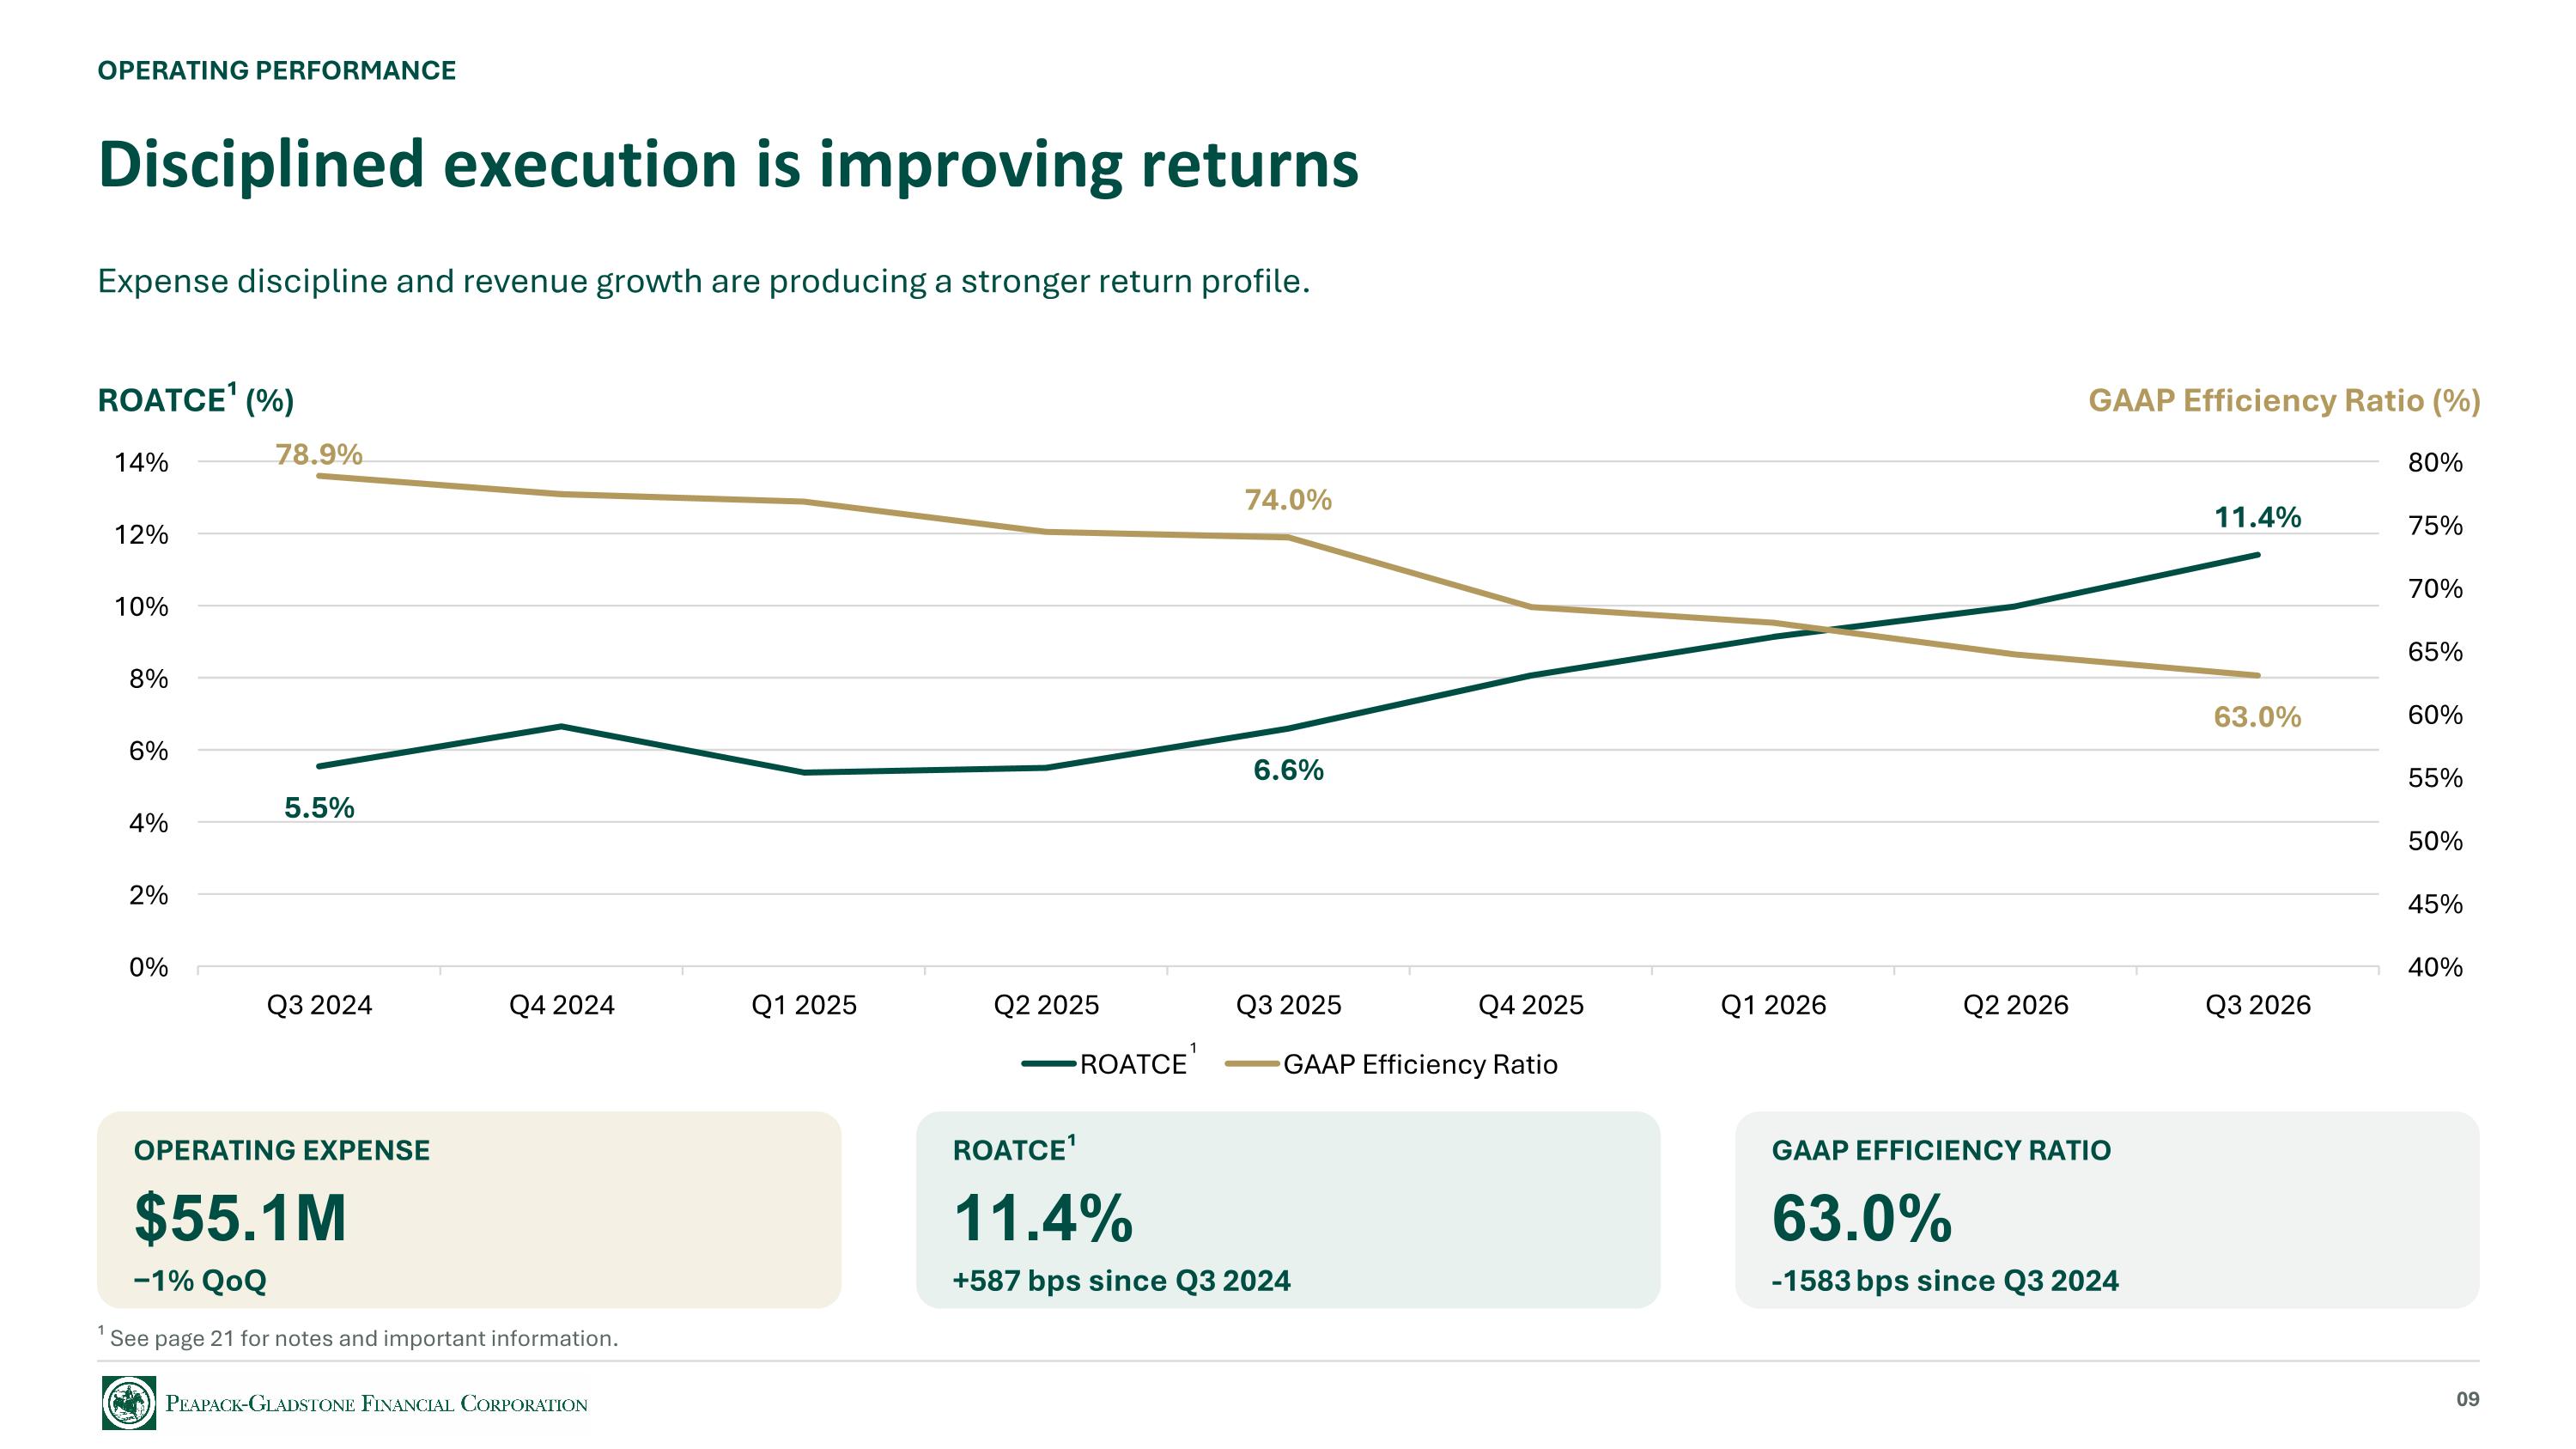
OPERATING PERFORMANCE Disciplined execution is improving returns Expense discipline and revenue growth are producing a stronger return profile. ROATCE¹ (%) GAAP Efficiency Ratio (%) OPERATING EXPENSE $55.1M −1% QoQ ROATCE¹ 11.4% +587 bps since Q3 2024 GAAP EFFICIENCY RATIO 63.0% -1583 bps since Q3 2024 09 ¹ See page 21 for notes and important information. 1
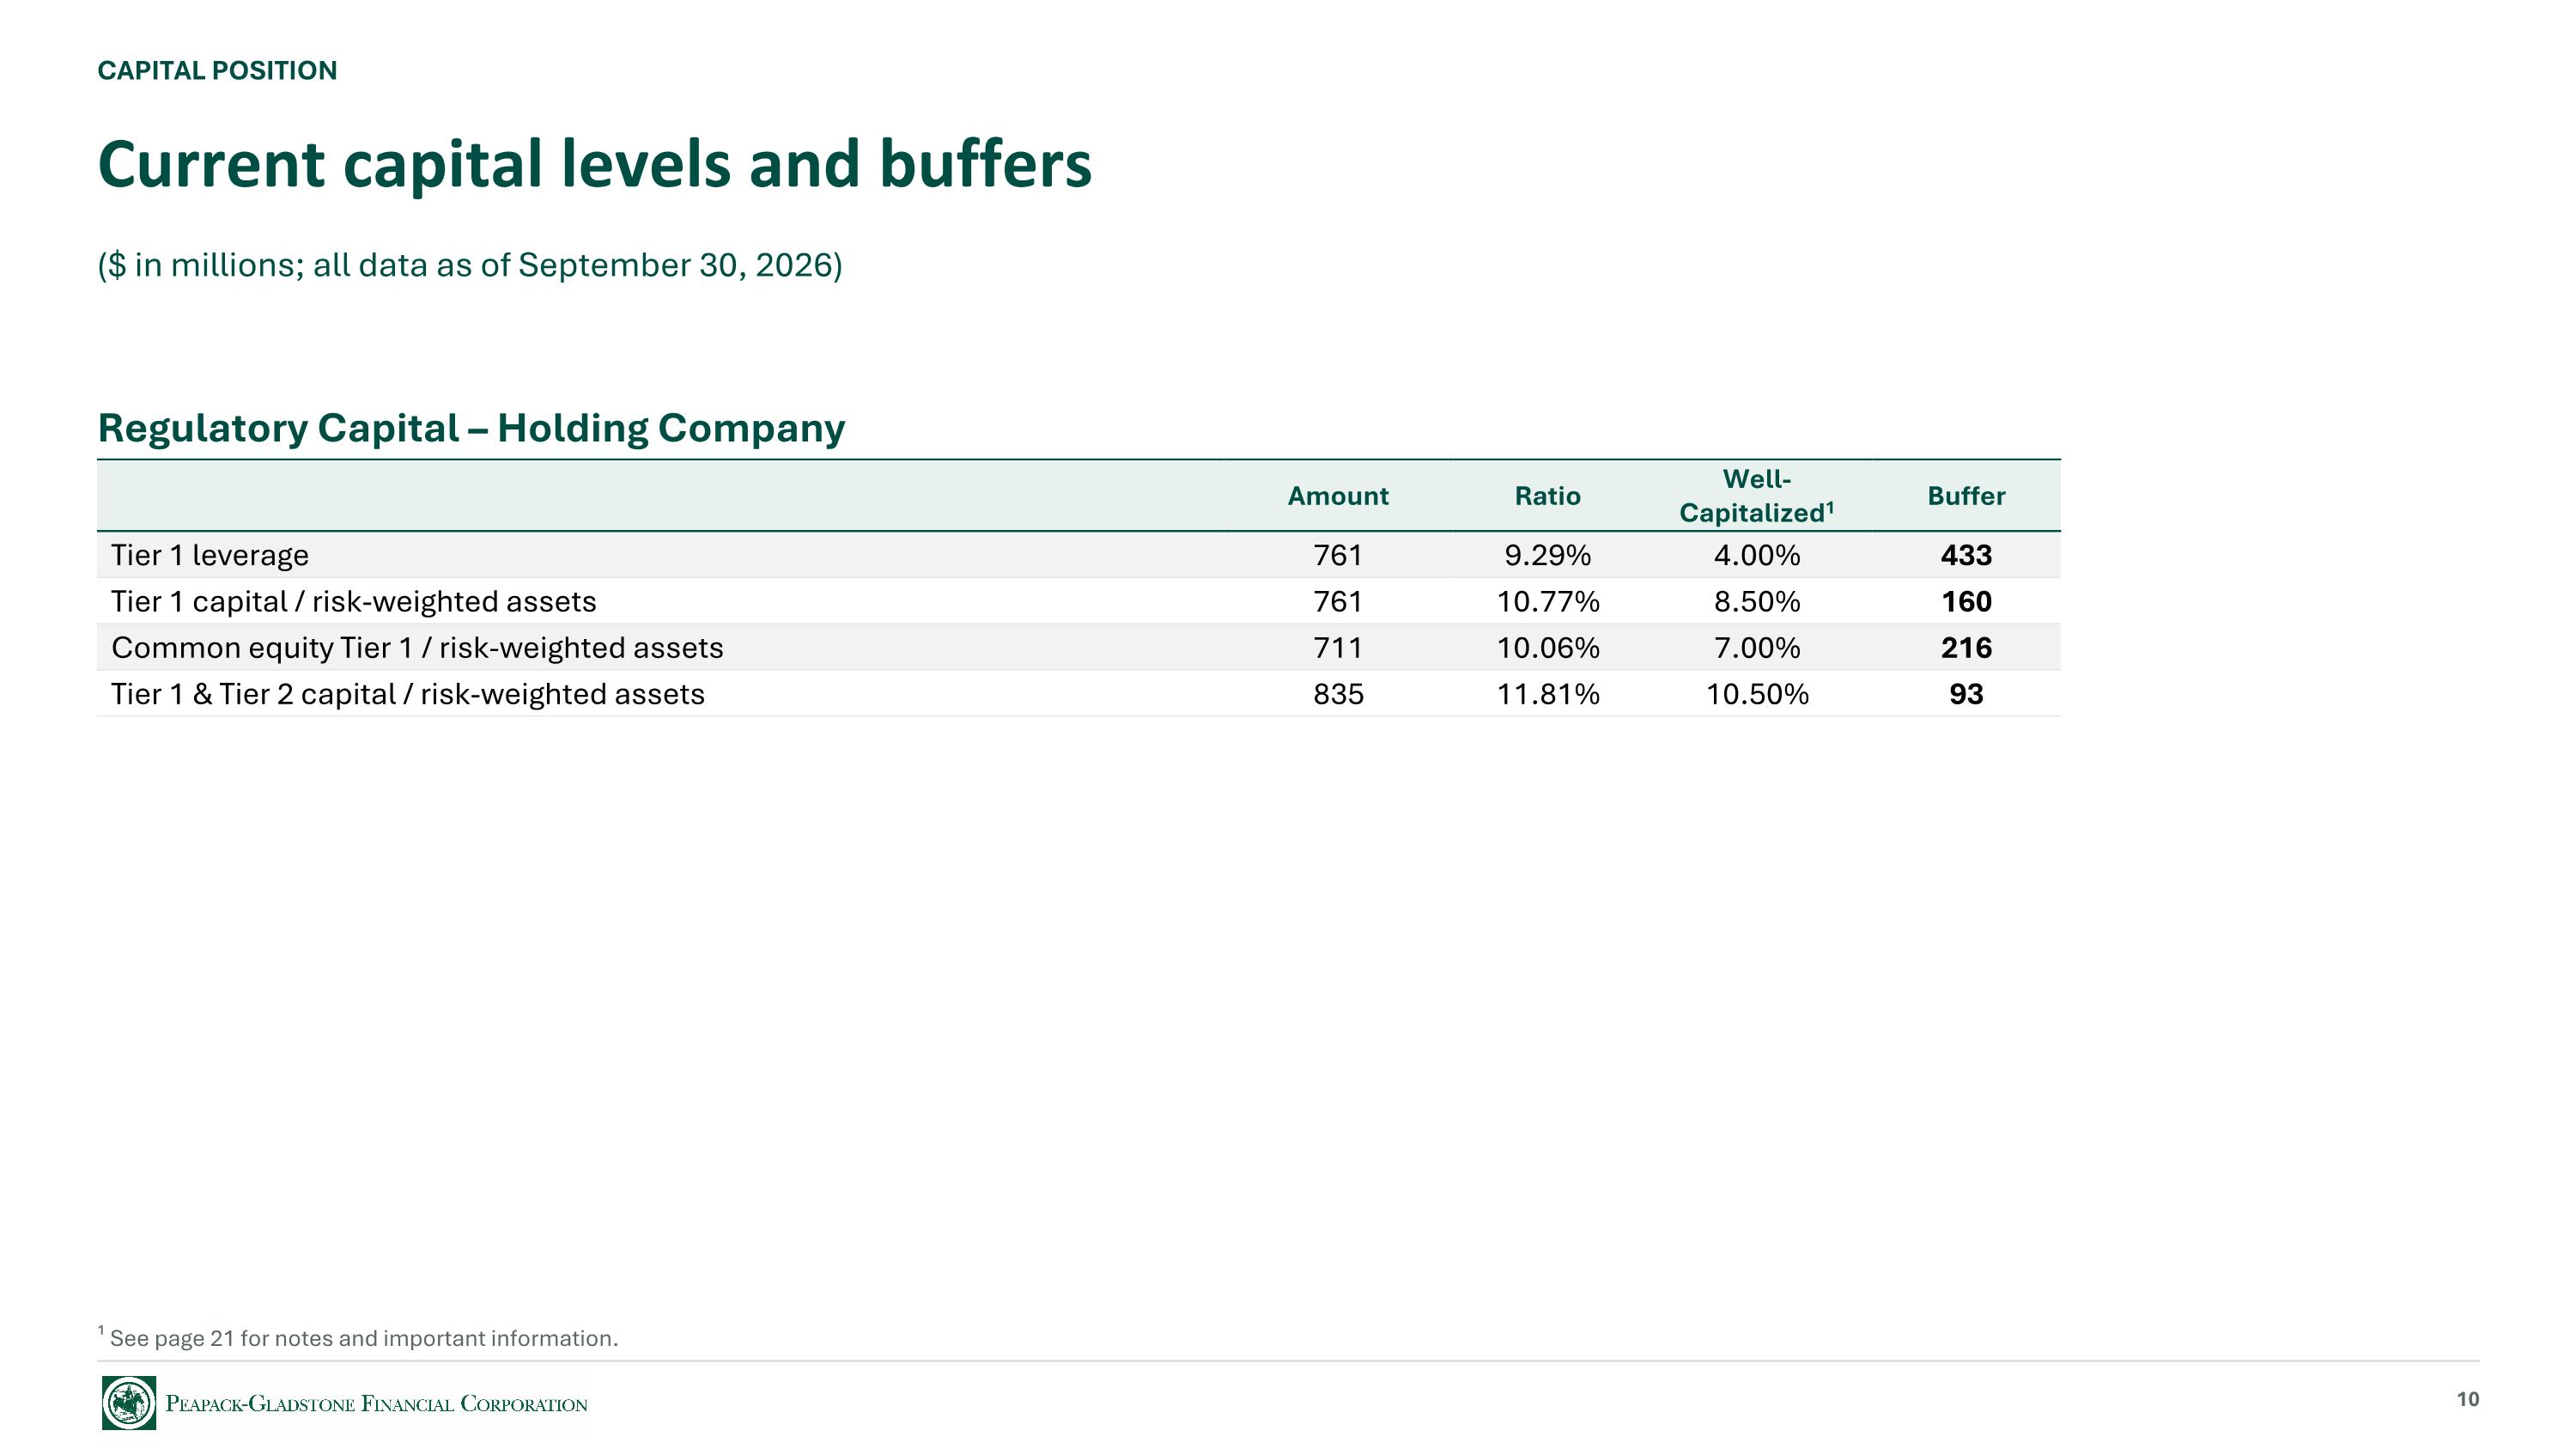
CAPITAL POSITION Current capital levels and buffers ($ in millions; all data as of September 30, 2026) ¹ See page 21 for notes and important information. 10 Regulatory Capital – Holding Company Amount Ratio Well-Capitalized1 Buffer Tier 1 leverage 761 9.29% 4.00% 433 Tier 1 capital / risk-weighted assets 761 10.77% 8.50% 160 Common equity Tier 1 / risk-weighted assets 711 10.06% 7.00% 216 Tier 1 & Tier 2 capital / risk-weighted assets 835 11.81% 10.50% 93
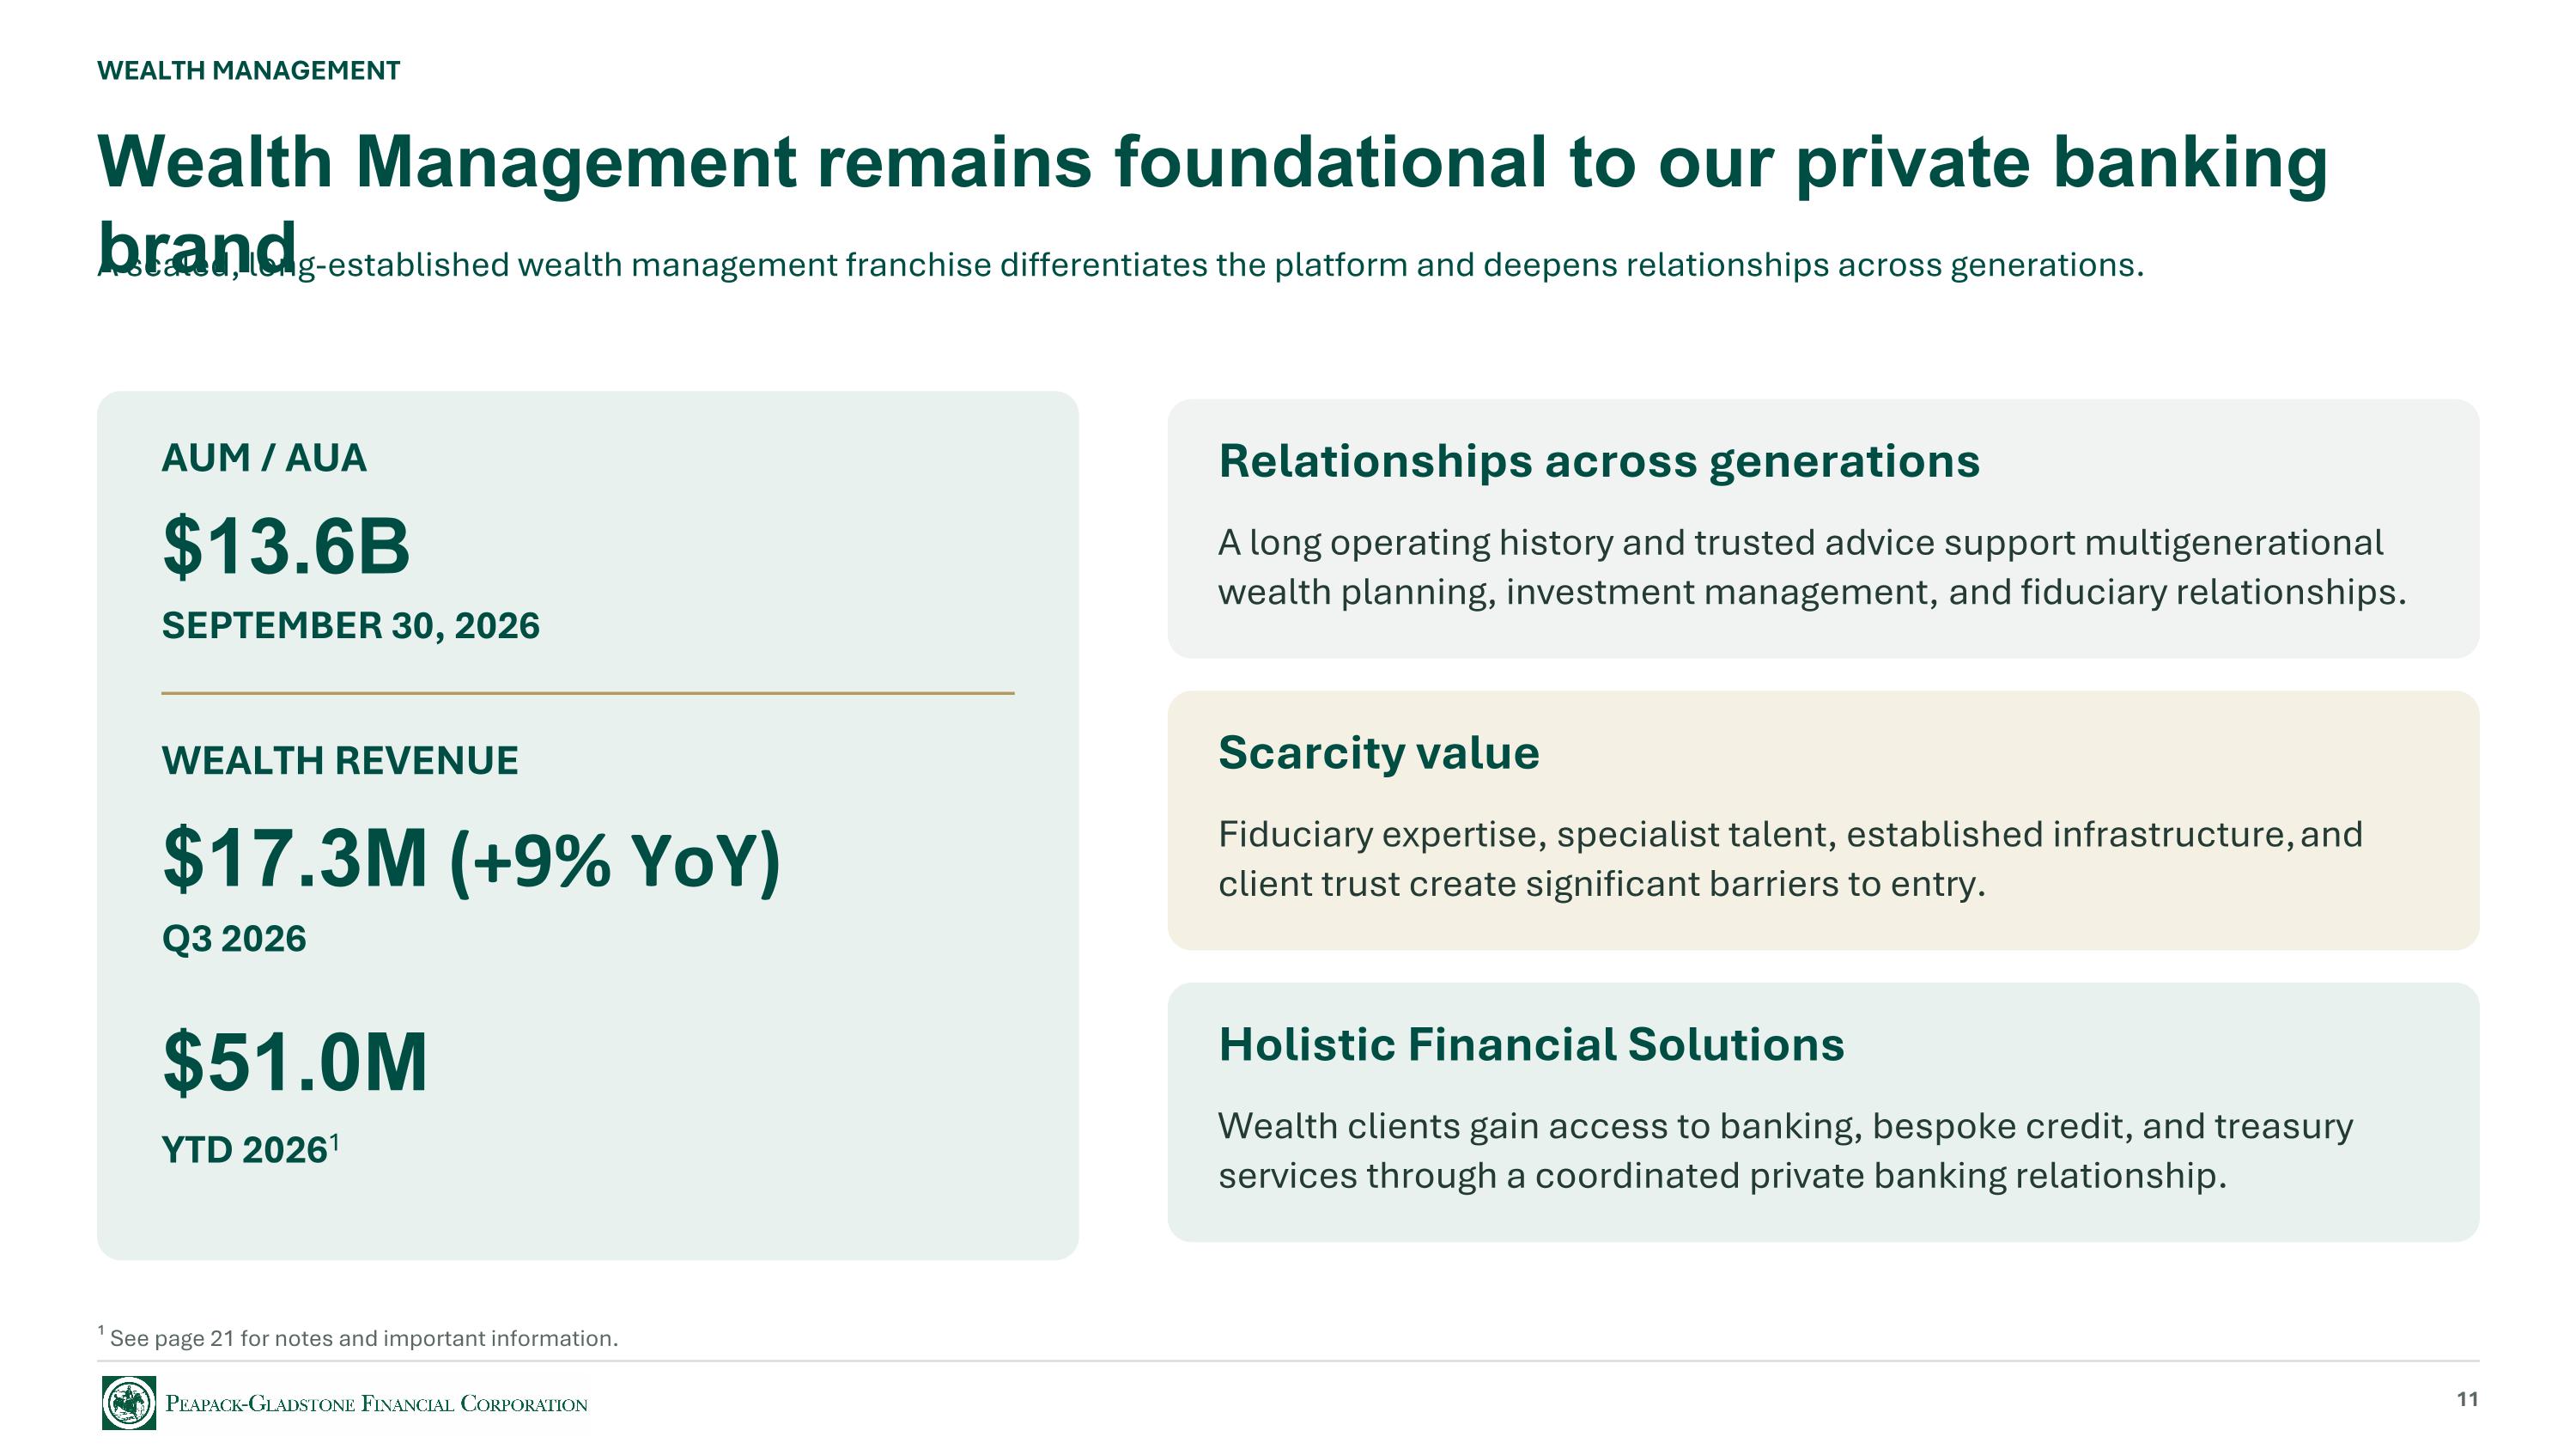
WEALTH MANAGEMENT Wealth Management remains foundational to our private banking brand A scaled, long-established wealth management franchise differentiates the platform and deepens relationships across generations. AUM / AUA $13.6B SEPTEMBER 30, 2026 WEALTH REVENUE $17.3M (+9% YoY) Q3 2026 Relationships across generations A long operating history and trusted advice support multigenerational wealth planning, investment management, and fiduciary relationships. Scarcity value Fiduciary expertise, specialist talent, established infrastructure, and client trust create significant barriers to entry. Holistic Financial Solutions Wealth clients gain access to banking, bespoke credit, and treasury services through a coordinated private banking relationship. 11 $51.0M YTD 20261 ¹ See page 21 for notes and important information.
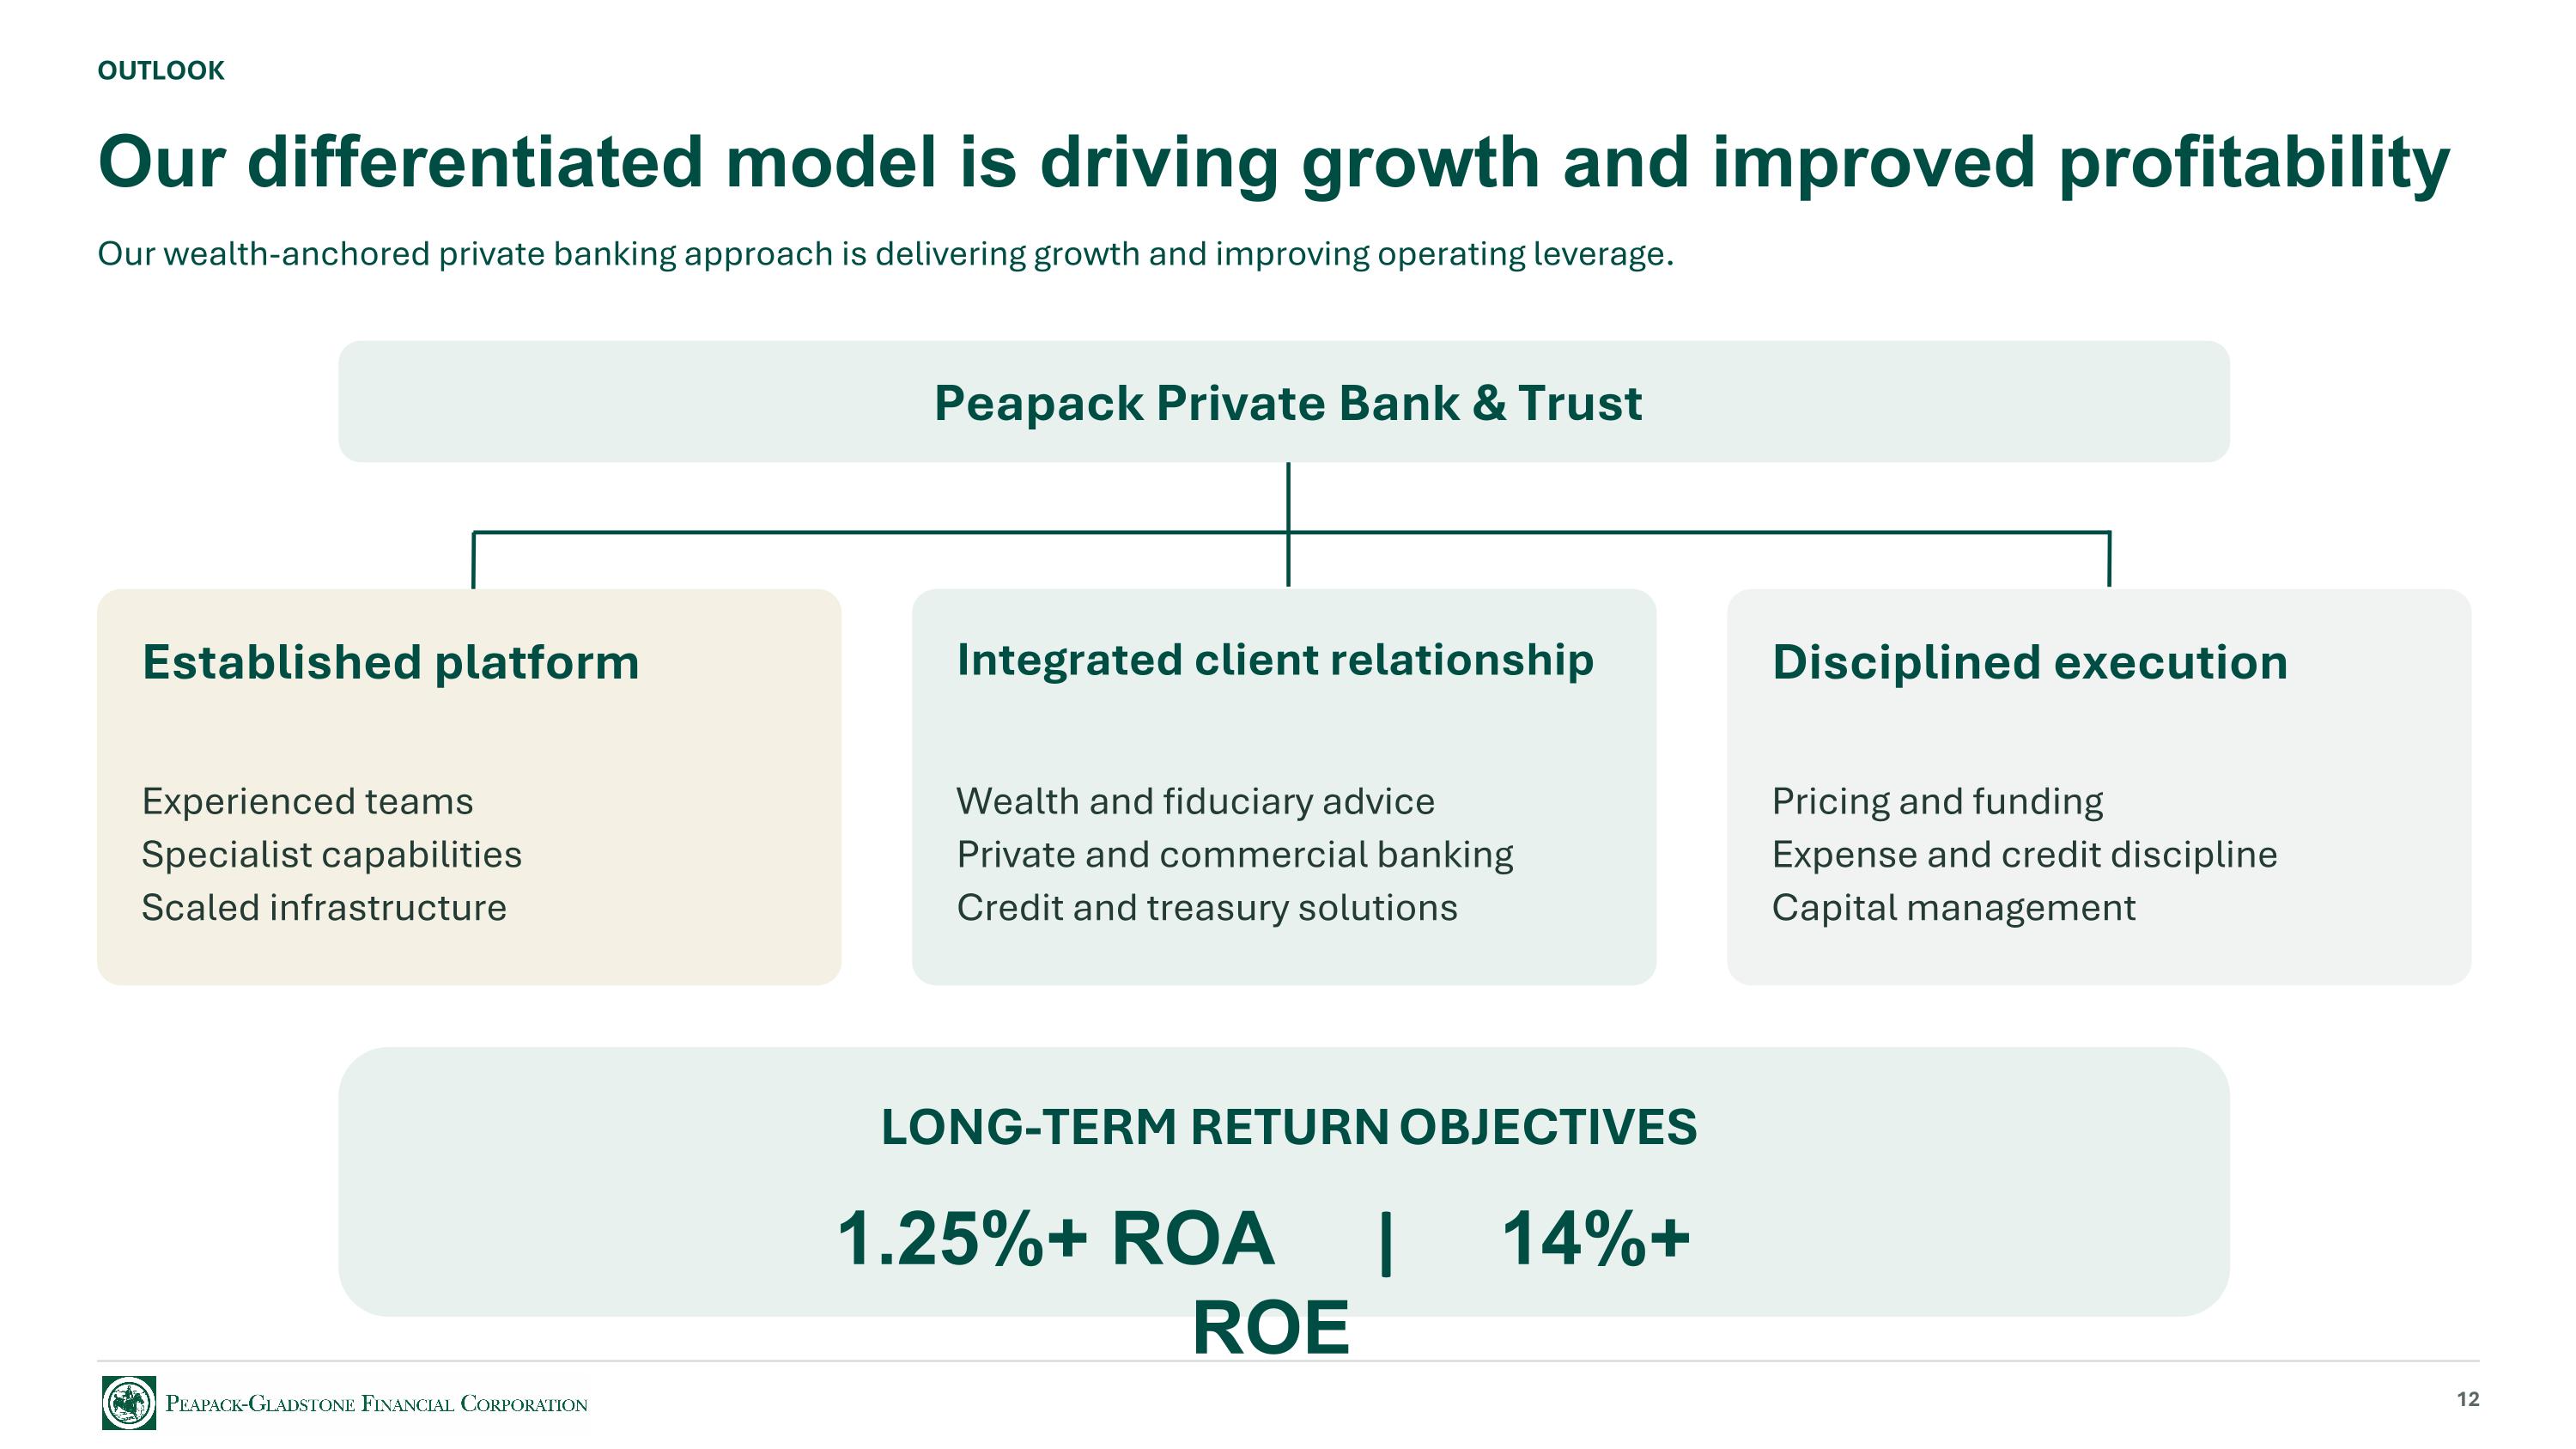
OUTLOOK Our differentiated model is driving growth and improved profitability Our wealth-anchored private banking approach is delivering growth and improving operating leverage. Established platform Experienced teams Specialist capabilities Scaled infrastructure Integrated client relationship Wealth and fiduciary advice Private and commercial banking Credit and treasury solutions Disciplined execution Pricing and funding Expense and credit discipline Capital management LONG-TERM RETURN OBJECTIVES 1.25%+ ROA | 14%+ ROE 12 Peapack Private Bank & Trust
IMPORTANT INFORMATION Statement Regarding Forward-Looking Information This presentation contains forward-looking statements within the meaning of the Private Securities Litigation Reform Act of 1995. Such statements are not historical facts and may include expressions about Management’s strategies and Management’s expectations about financial condition and operating results, new and existing programs and products, investments, relationships, opportunities and market conditions. These statements may be identified by such forward-looking terminology as “expect,” “look,” “believe,” “anticipate,” “may,” or similar statements or variations of such terms. Actual results may differ materially from such forward-looking statements. Factors that may cause actual results to differ materially from those contemplated by such forward-looking statements include, but are not limited to: 1) our ability to successfully grow our business and implement our strategic plan, including our ability to generate revenues to offset the increased personnel and other costs related to the strategic plan; 2) the impact of anticipated higher operating expenses in 2026 and beyond; 3) our ability to successfully integrate wealth management firm and team acquisitions; 4) our ability to successfully integrate our expanded employee base; 5) an unexpected decline in the economy, in particular in our New Jersey and New York market areas, including potential recessionary conditions; 6) declines in our net interest margin caused by the interest rate environment, including the shape of the yield curve and/or our highly competitive market; 7) adverse changes in securities markets; 8) impact from a pandemic event on our business, operations, customers, allowance for credit losses and capital levels; 9) higher than expected increases in our allowance for credit losses; 10) changes in the methodology and assumptions used to calculate the allowance for credit losses; 11) higher than expected increases in credit losses or in the level of delinquent, nonperforming, classified and criticized loans or charge-offs; 12) inflation and changes in interest rates, which may adversely impact our margins and yields, reduce the fair value of our financial instruments, reduce our loan originations and lead to higher operating costs; 13) decline in real estate values within our market areas; 14) legislative and regulatory actions (including the impact of the Dodd-Frank Wall Street Reform and Consumer Protection Act, Basel III and related regulations) that may result in increased compliance costs; 15) the imposition of tariffs, trade policies and other measures impacting our borrowers and/or the broader economy; 16) the impact of any federal government shutdown, debt ceiling impasses or fiscal uncertainty; 17) risks associated with cybersecurity threats, data breaches, ransomware attacks, or other failures in our operational or security systems and infrastructure, including the risks arising from our dependence on third-party service providers and vendors; 18) higher than expected FDIC insurance premiums; 19) adverse weather conditions; 20) the current or anticipated impact of military conflict, terrorism or other geopolitical events; 21) our inability to successfully generate new business in new geographic markets; 22) a reduction in our lower-cost funding sources; 23) changes in liquidity, including the size and composition of our deposit portfolio and the percentage of uninsured deposits in the portfolio; 24) our inability to adapt to technological changes; 25) claims and litigation pertaining to fiduciary responsibility, environmental laws and other matters; 26) our inability to retain key employees; 27) demand for loans and deposits in our market areas; 28) changes in New York City rent regulation law; 29) changes in governmental regulation, including, but not limited to, any increase in FDIC insurance premiums and changes in the monetary and fiscal policies of the U.S. Treasury and the Board of Governors of the Federal Reserve System; 30) changes in accounting policies and practices; and/or 31) other unexpected material adverse changes in our financial condition, operations or earnings. The Company undertakes no duty to update any forward-looking statement to conform the statement to actual results or changes in the Company’s expectations. Although we believe that the expectations reflected in the forward-looking statements are reasonable, the Company cannot guarantee future results, levels of activity, performance or achievements. 13

Q3 2026 INVESTOR PRESENTATION Appendix A Franchise, client experience, credit and capital 14
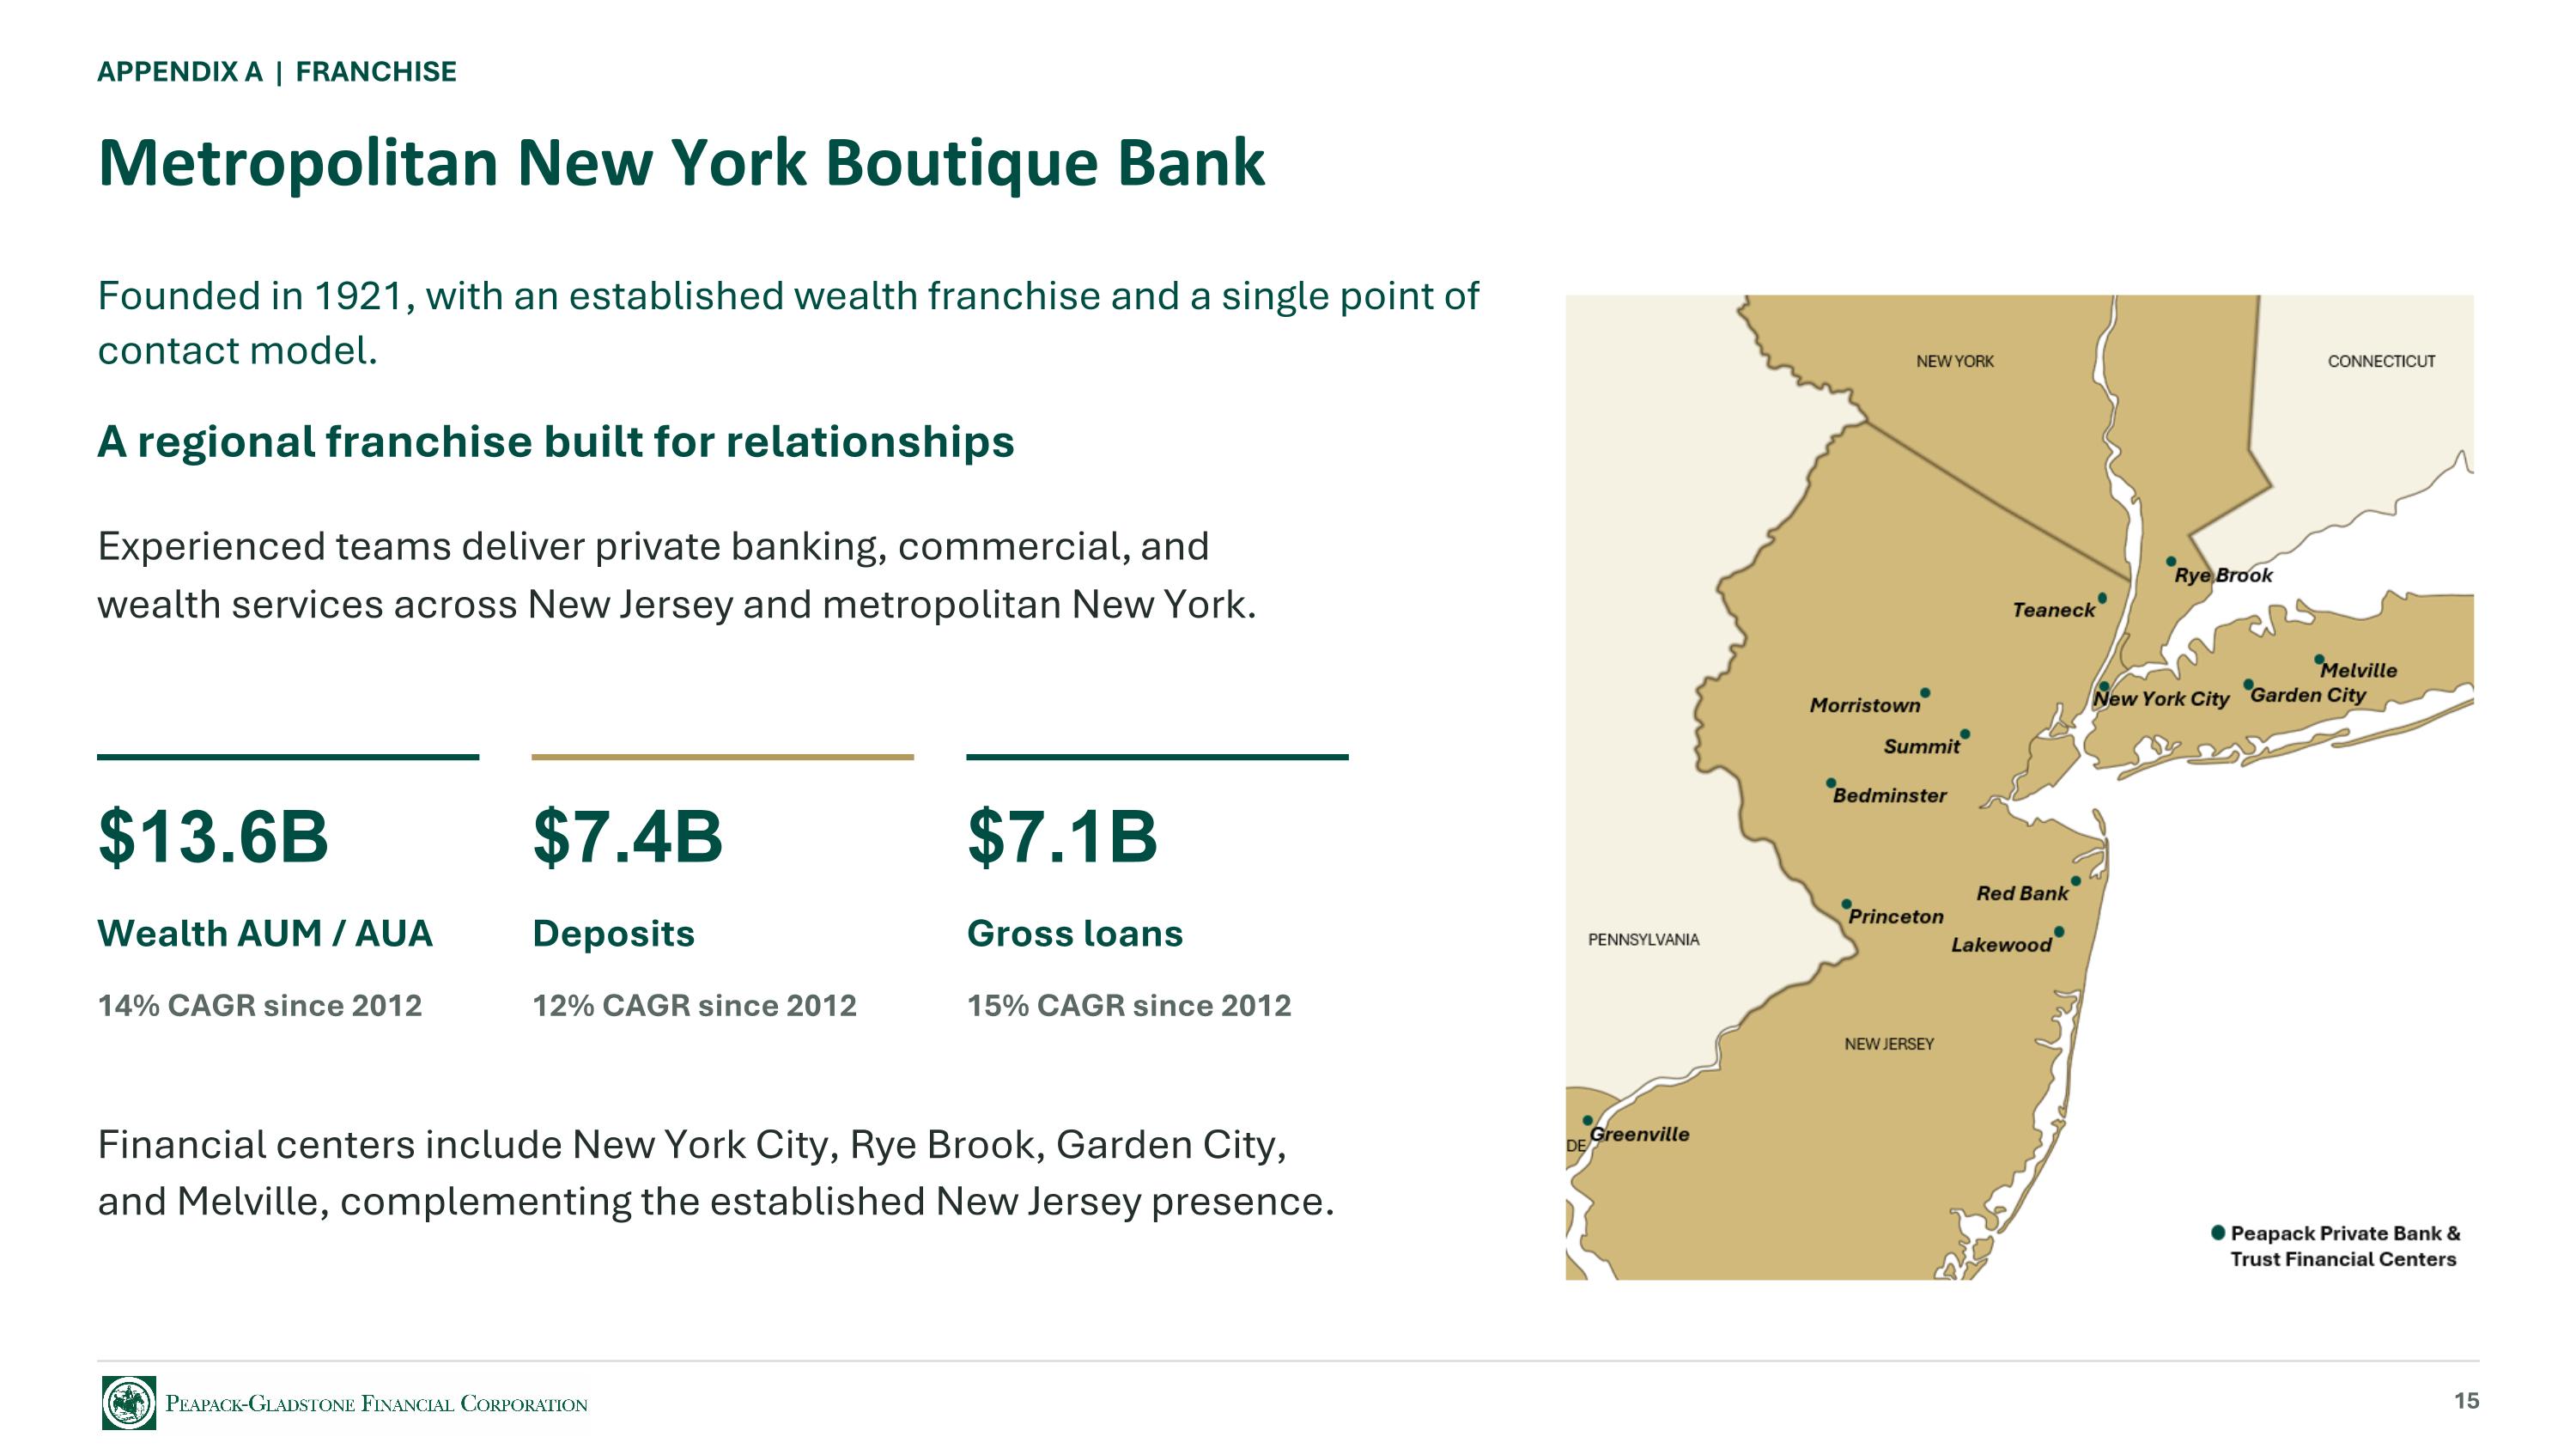
APPENDIX A | FRANCHISE Metropolitan New York Boutique Bank Founded in 1921, with an established wealth franchise and a single point of contact model. A regional franchise built for relationships Experienced teams deliver private banking, commercial, and wealth services across New Jersey and metropolitan New York. $13.6B Wealth AUM / AUA 14% CAGR since 2012 $7.4B Deposits 12% CAGR since 2012 $7.1B Gross loans 15% CAGR since 2012 Financial centers include New York City, Rye Brook, Garden City, and Melville, complementing the established New Jersey presence. 15
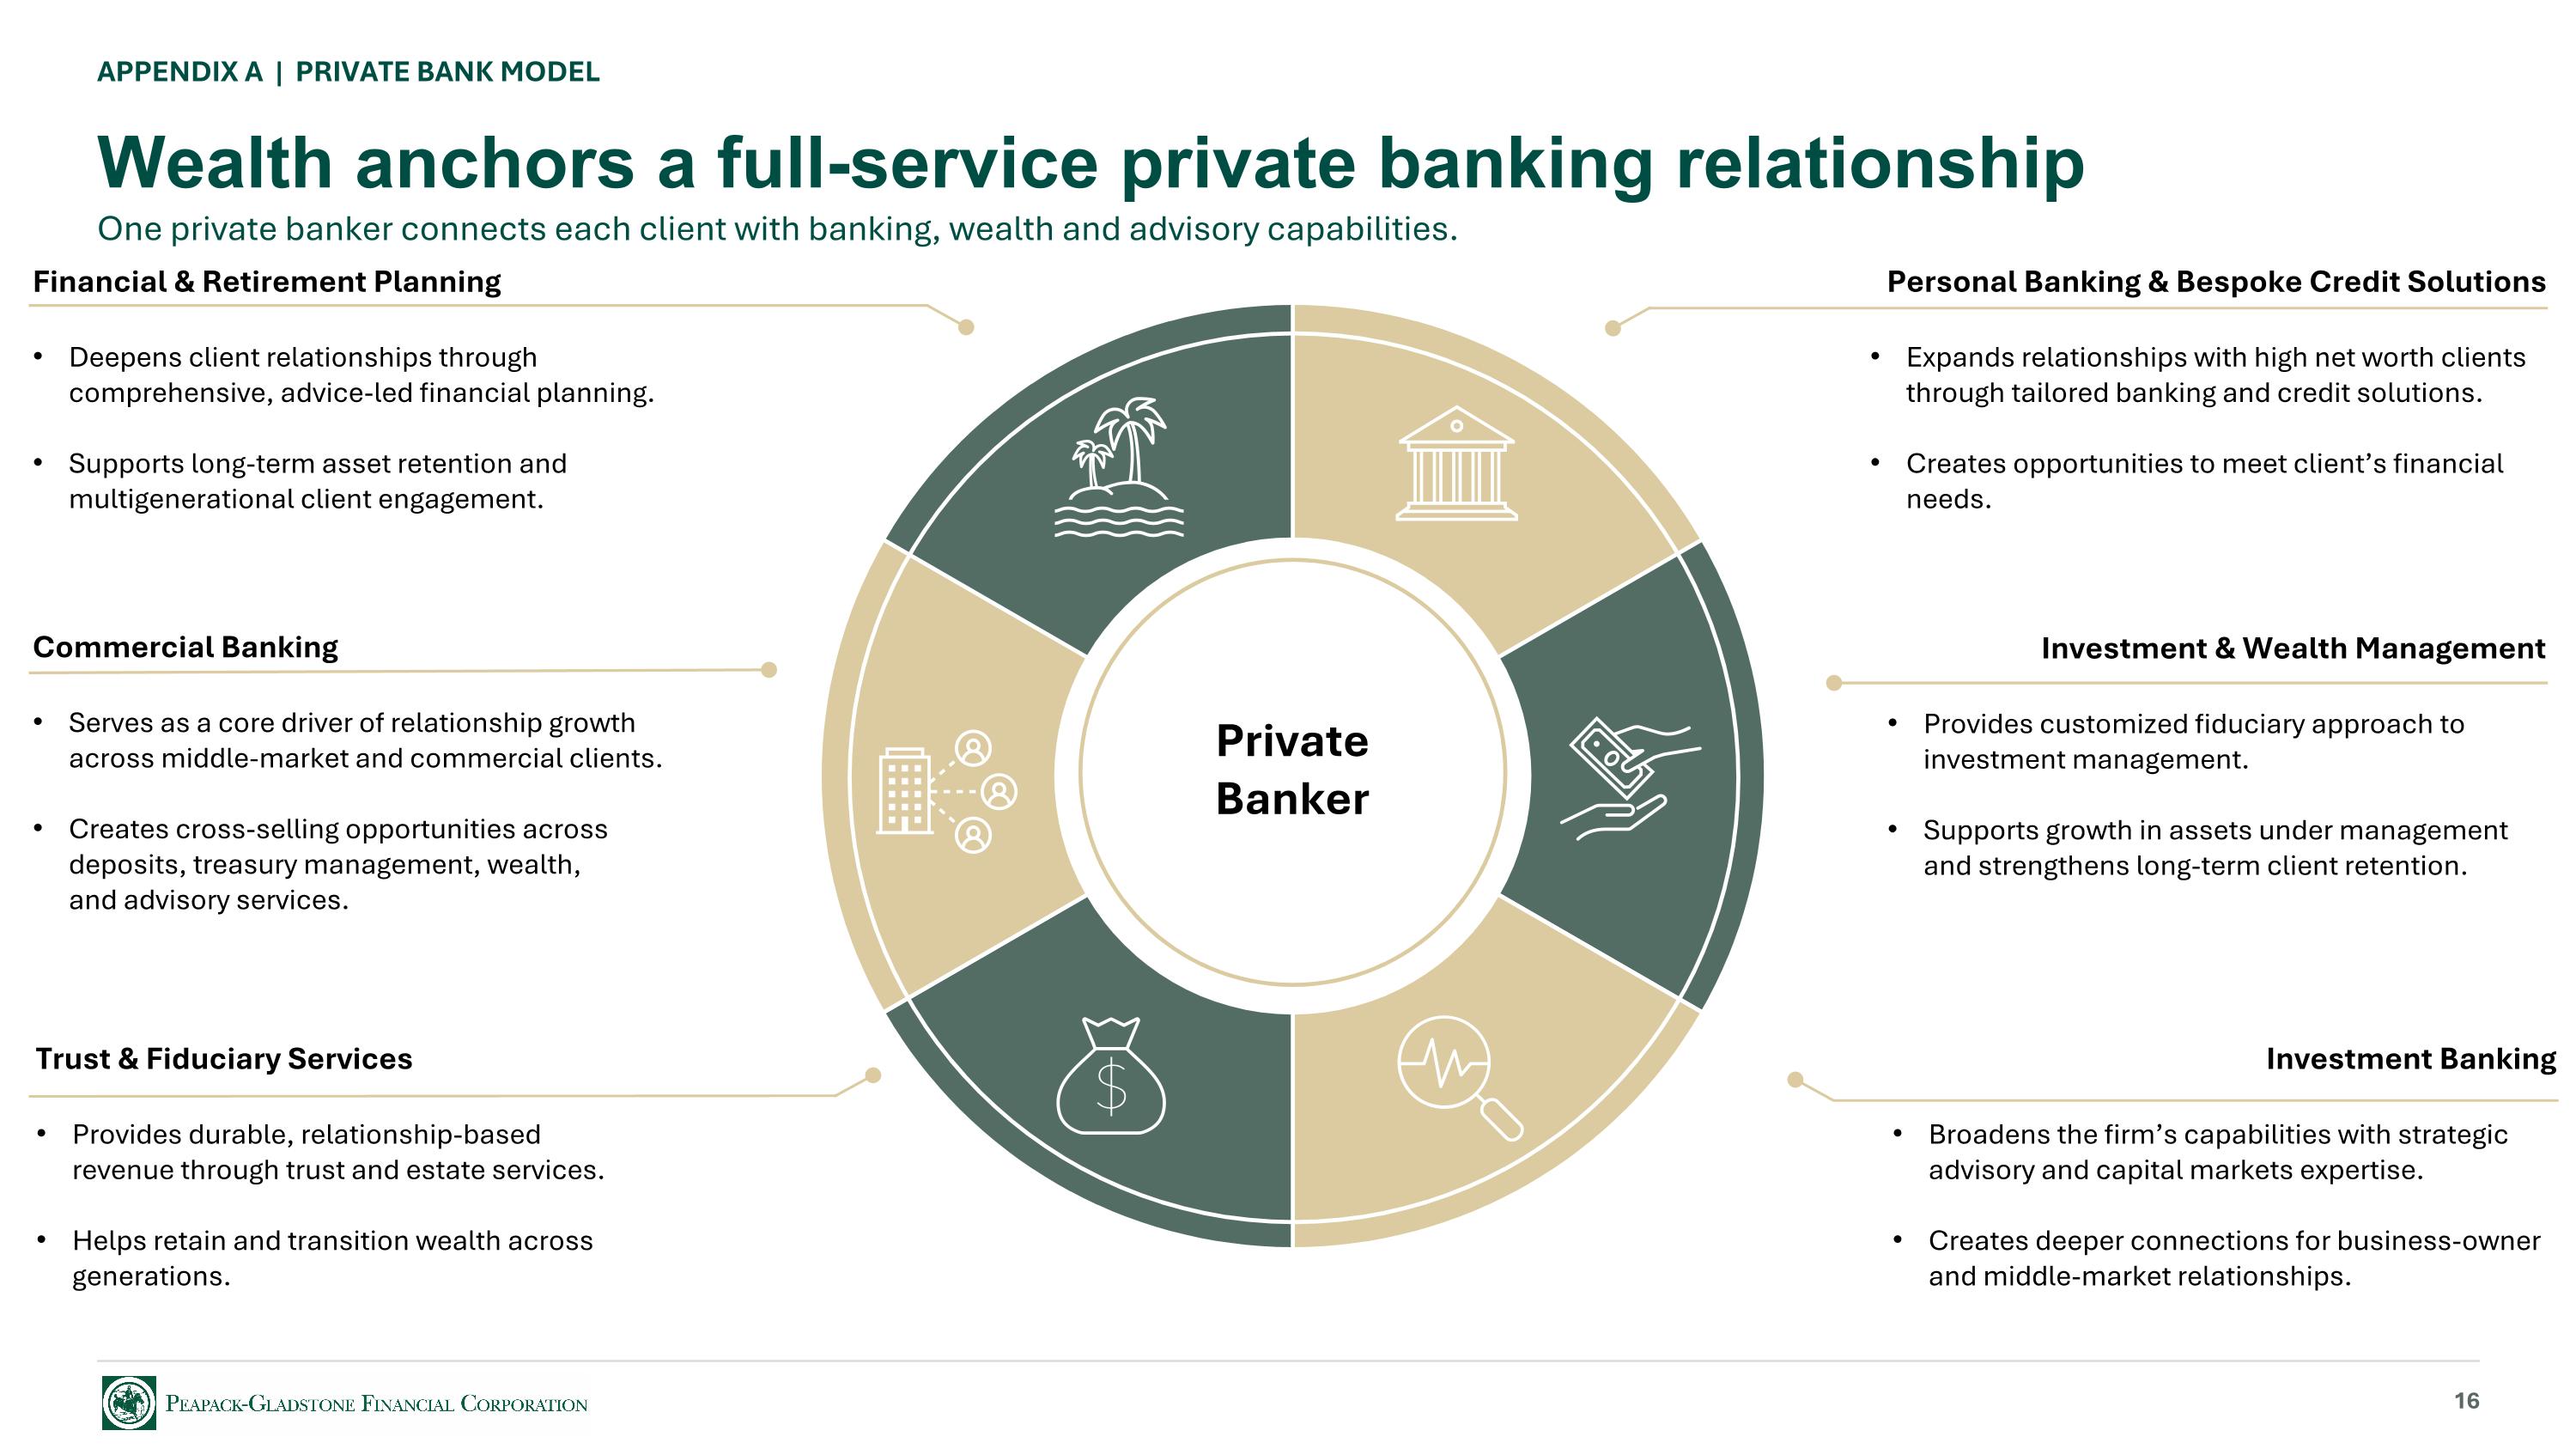
APPENDIX A | PRIVATE BANK MODEL Wealth anchors a full-service private banking relationship One private banker connects each client with banking, wealth and advisory capabilities. 16 Investment Banking Broadens the firm’s capabilities with strategic advisory and capital markets expertise. Creates deeper connections for business-owner and middle-market relationships. Trust & Fiduciary Services Provides durable, relationship-based revenue through trust and estate services. Helps retain and transition wealth across generations. Financial & Retirement Planning Deepens client relationships through comprehensive, advice-led financial planning. Supports long-term asset retention and multigenerational client engagement. Personal Banking & Bespoke Credit Solutions Expands relationships with high net worth clients through tailored banking and credit solutions. Creates opportunities to meet client’s financial needs. Investment & Wealth Management Provides customized fiduciary approach to investment management. Supports growth in assets under management and strengthens long-term client retention. Commercial Banking Serves as a core driver of relationship growth across middle-market and commercial clients. Creates cross-selling opportunities across deposits, treasury management, wealth, and advisory services. Private Banker
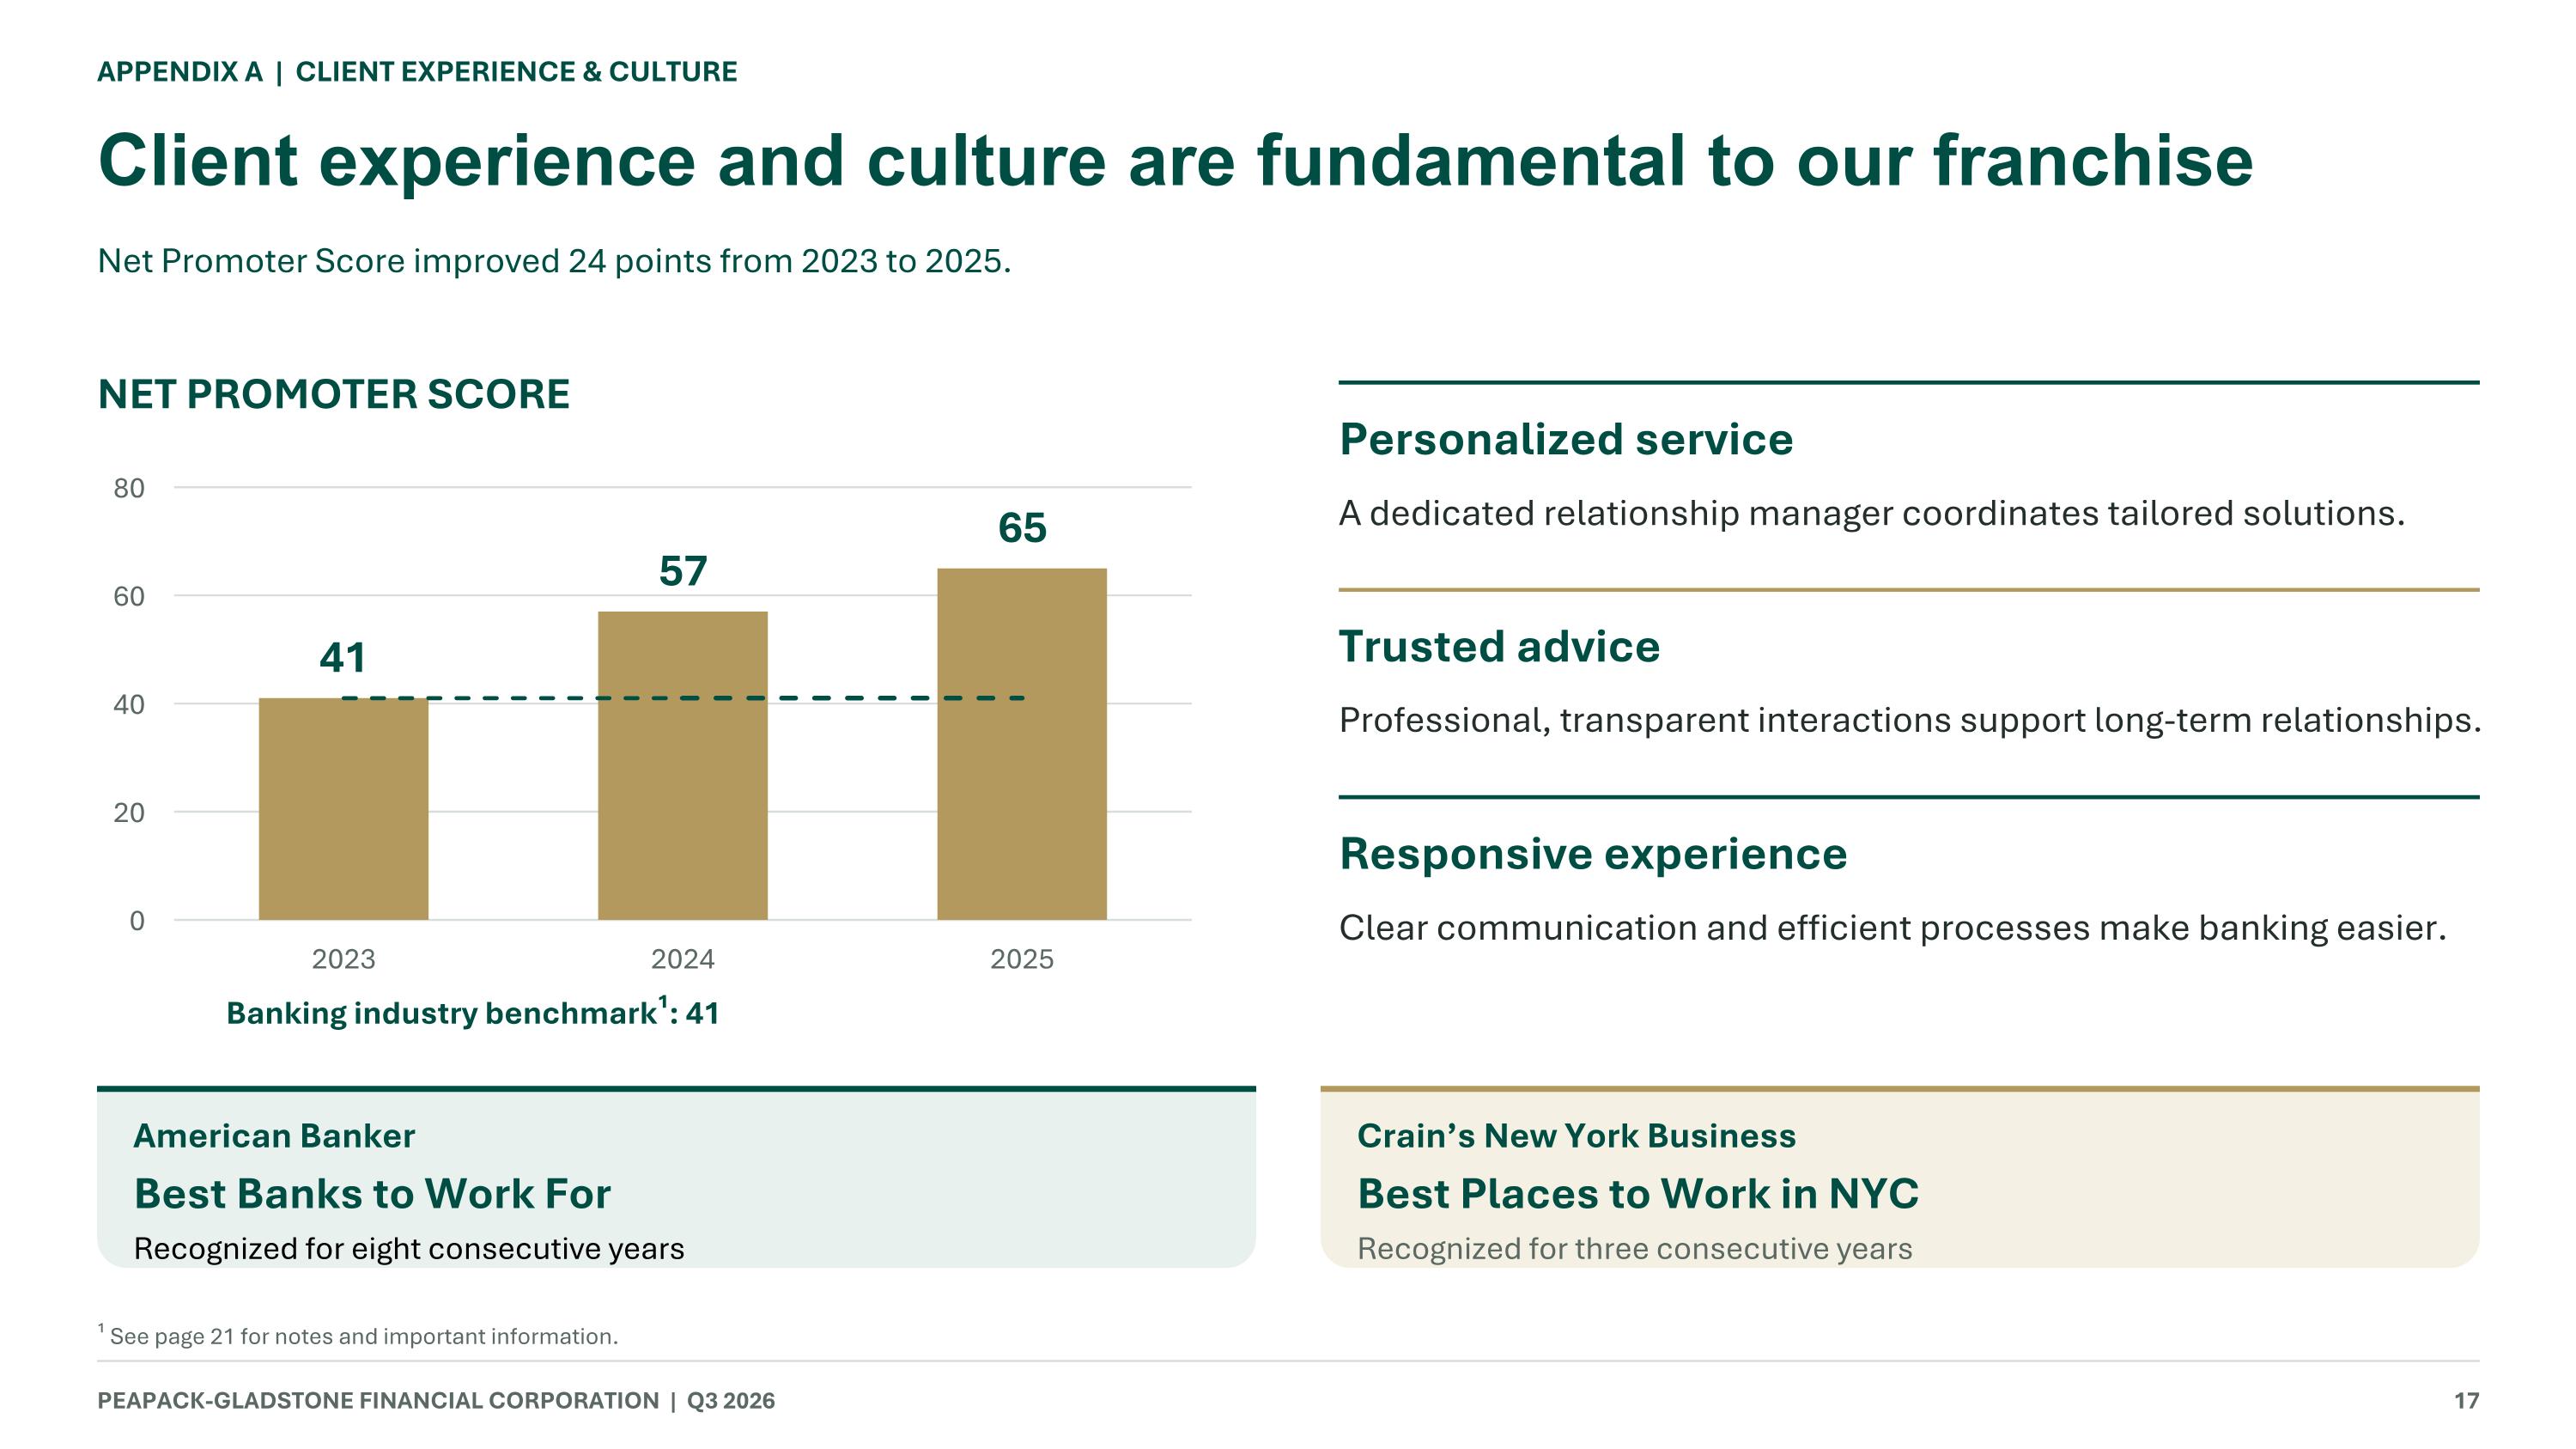
APPENDIX A | CLIENT EXPERIENCE & CULTURE Client experience and culture are fundamental to our franchise Net Promoter Score improved 24 points from 2023 to 2025. NET PROMOTER SCORE Banking industry benchmark¹: 41 Personalized service A dedicated relationship manager coordinates tailored solutions. Trusted advice Professional, transparent interactions support long-term relationships. Responsive experience Clear communication and efficient processes make banking easier. American Banker Best Banks to Work For Recognized for eight consecutive years Crain’s New York Business Best Places to Work in NYC Recognized for three consecutive years PEAPACK-GLADSTONE FINANCIAL CORPORATION | Q3 2026 17 ¹ See page 21 for notes and important information.
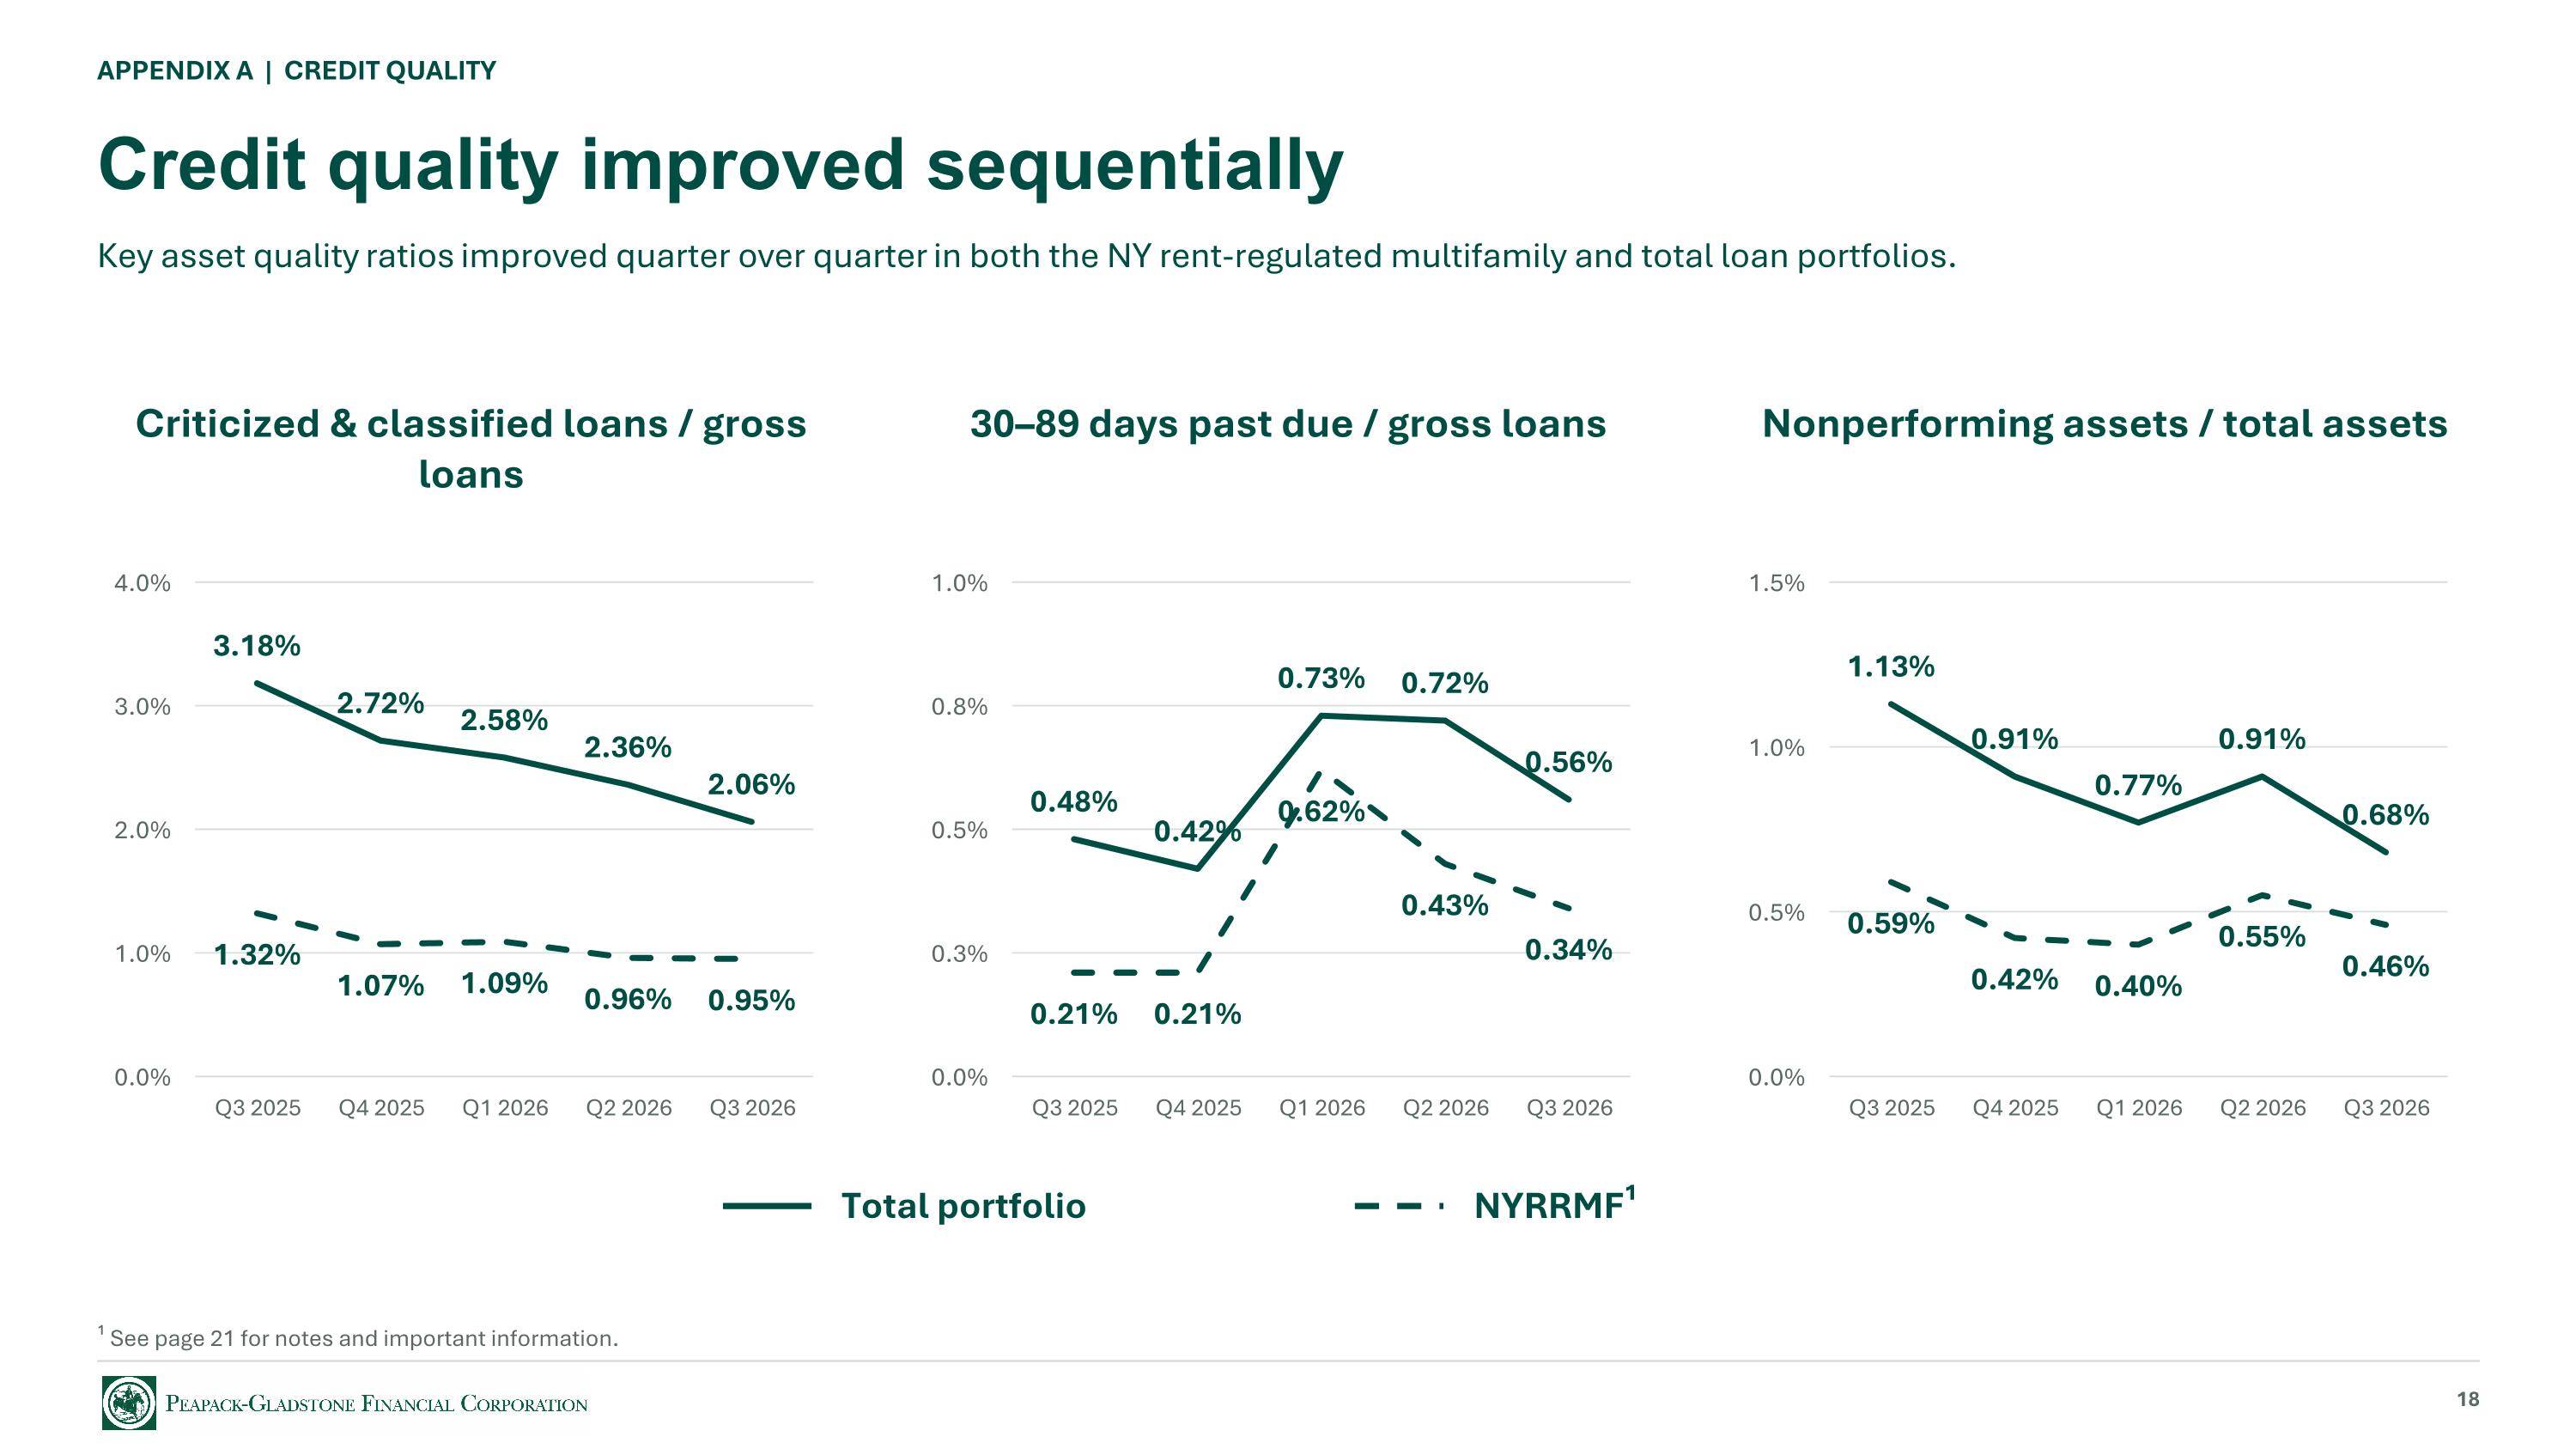
APPENDIX A | CREDIT QUALITY Credit quality improved sequentially Key asset quality ratios improved quarter over quarter in both the NY rent-regulated multifamily and total loan portfolios. Criticized & classified loans / gross loans 30–89 days past due / gross loans Nonperforming assets / total assets Total portfolio NYRRMF¹ 18 ¹ See page 21 for notes and important information.
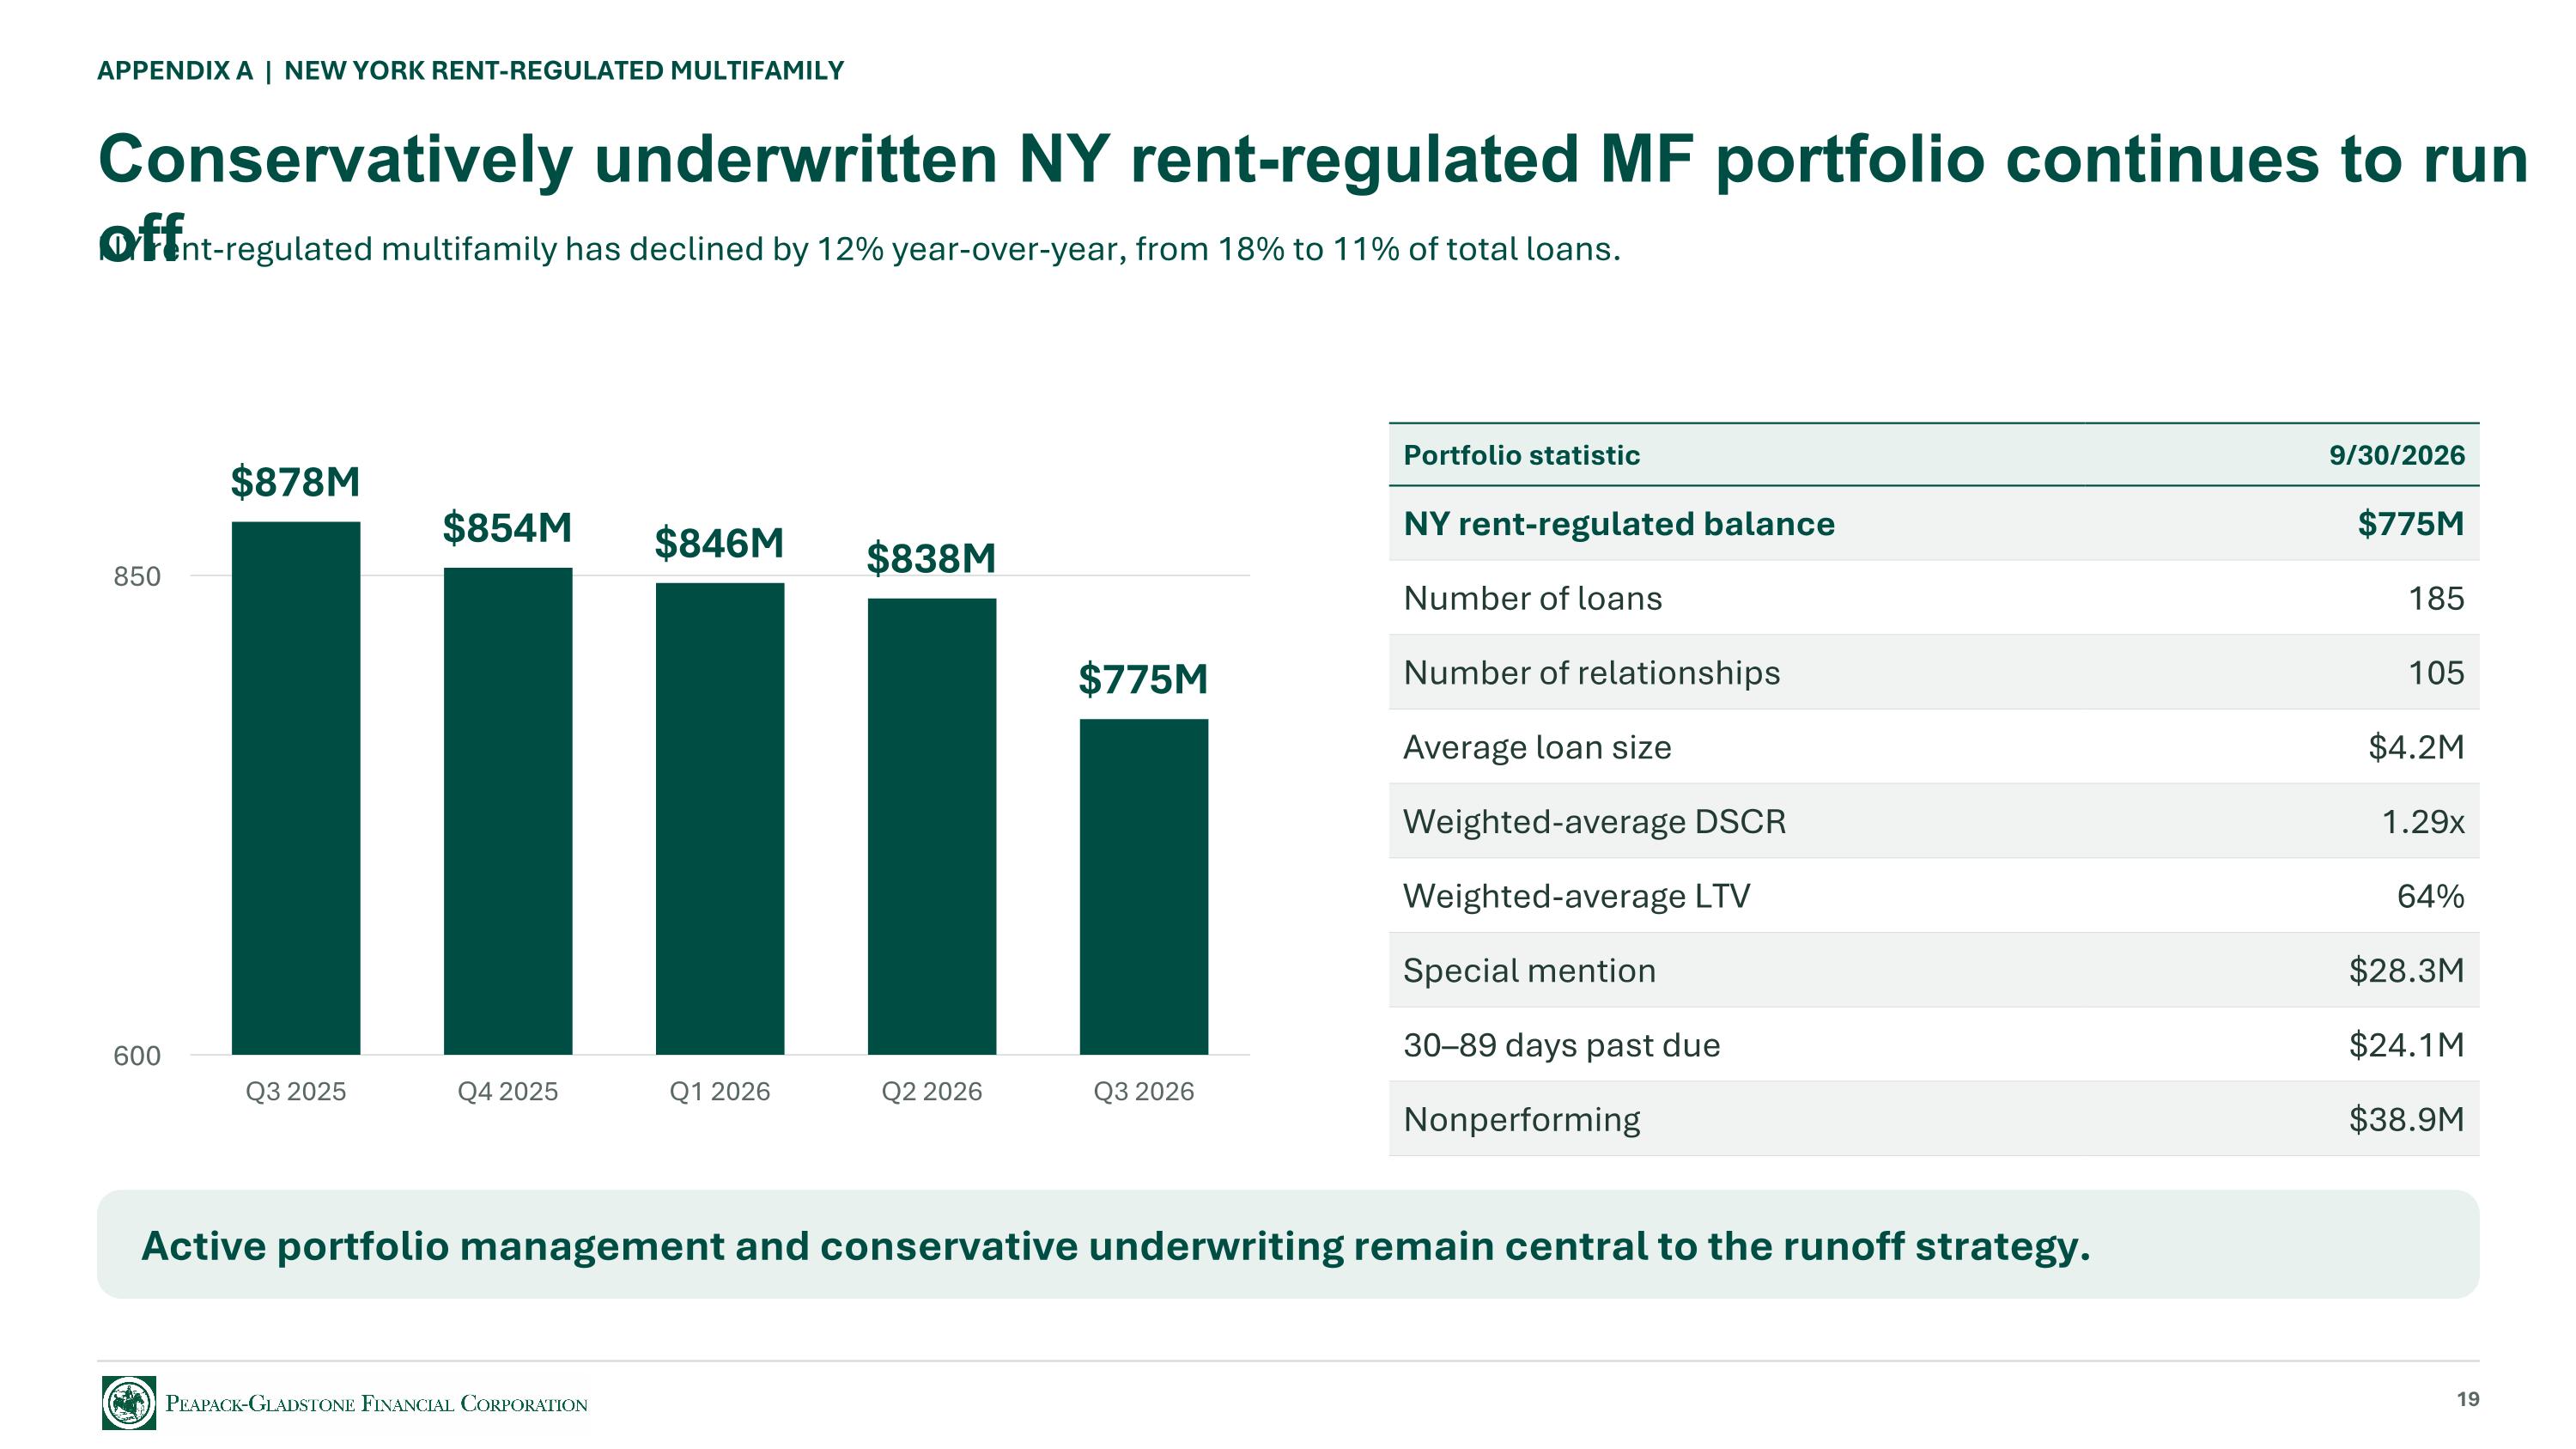
APPENDIX A | NEW YORK RENT-REGULATED MULTIFAMILY Conservatively underwritten NY rent-regulated MF portfolio continues to run off NY rent-regulated multifamily has declined by 12% year-over-year, from 18% to 11% of total loans. Portfolio statistic 9/30/2026 NY rent-regulated balance $775M Number of loans 185 Number of relationships 105 Average loan size $4.2M Weighted-average DSCR 1.29x Weighted-average LTV 64% Special mention $28.3M 30–89 days past due $24.1M Nonperforming $38.9M Active portfolio management and conservative underwriting remain central to the runoff strategy. 19

Q3 2026 INVESTOR PRESENTATION Appendix B Financial data, reconciliations and supporting tables 20
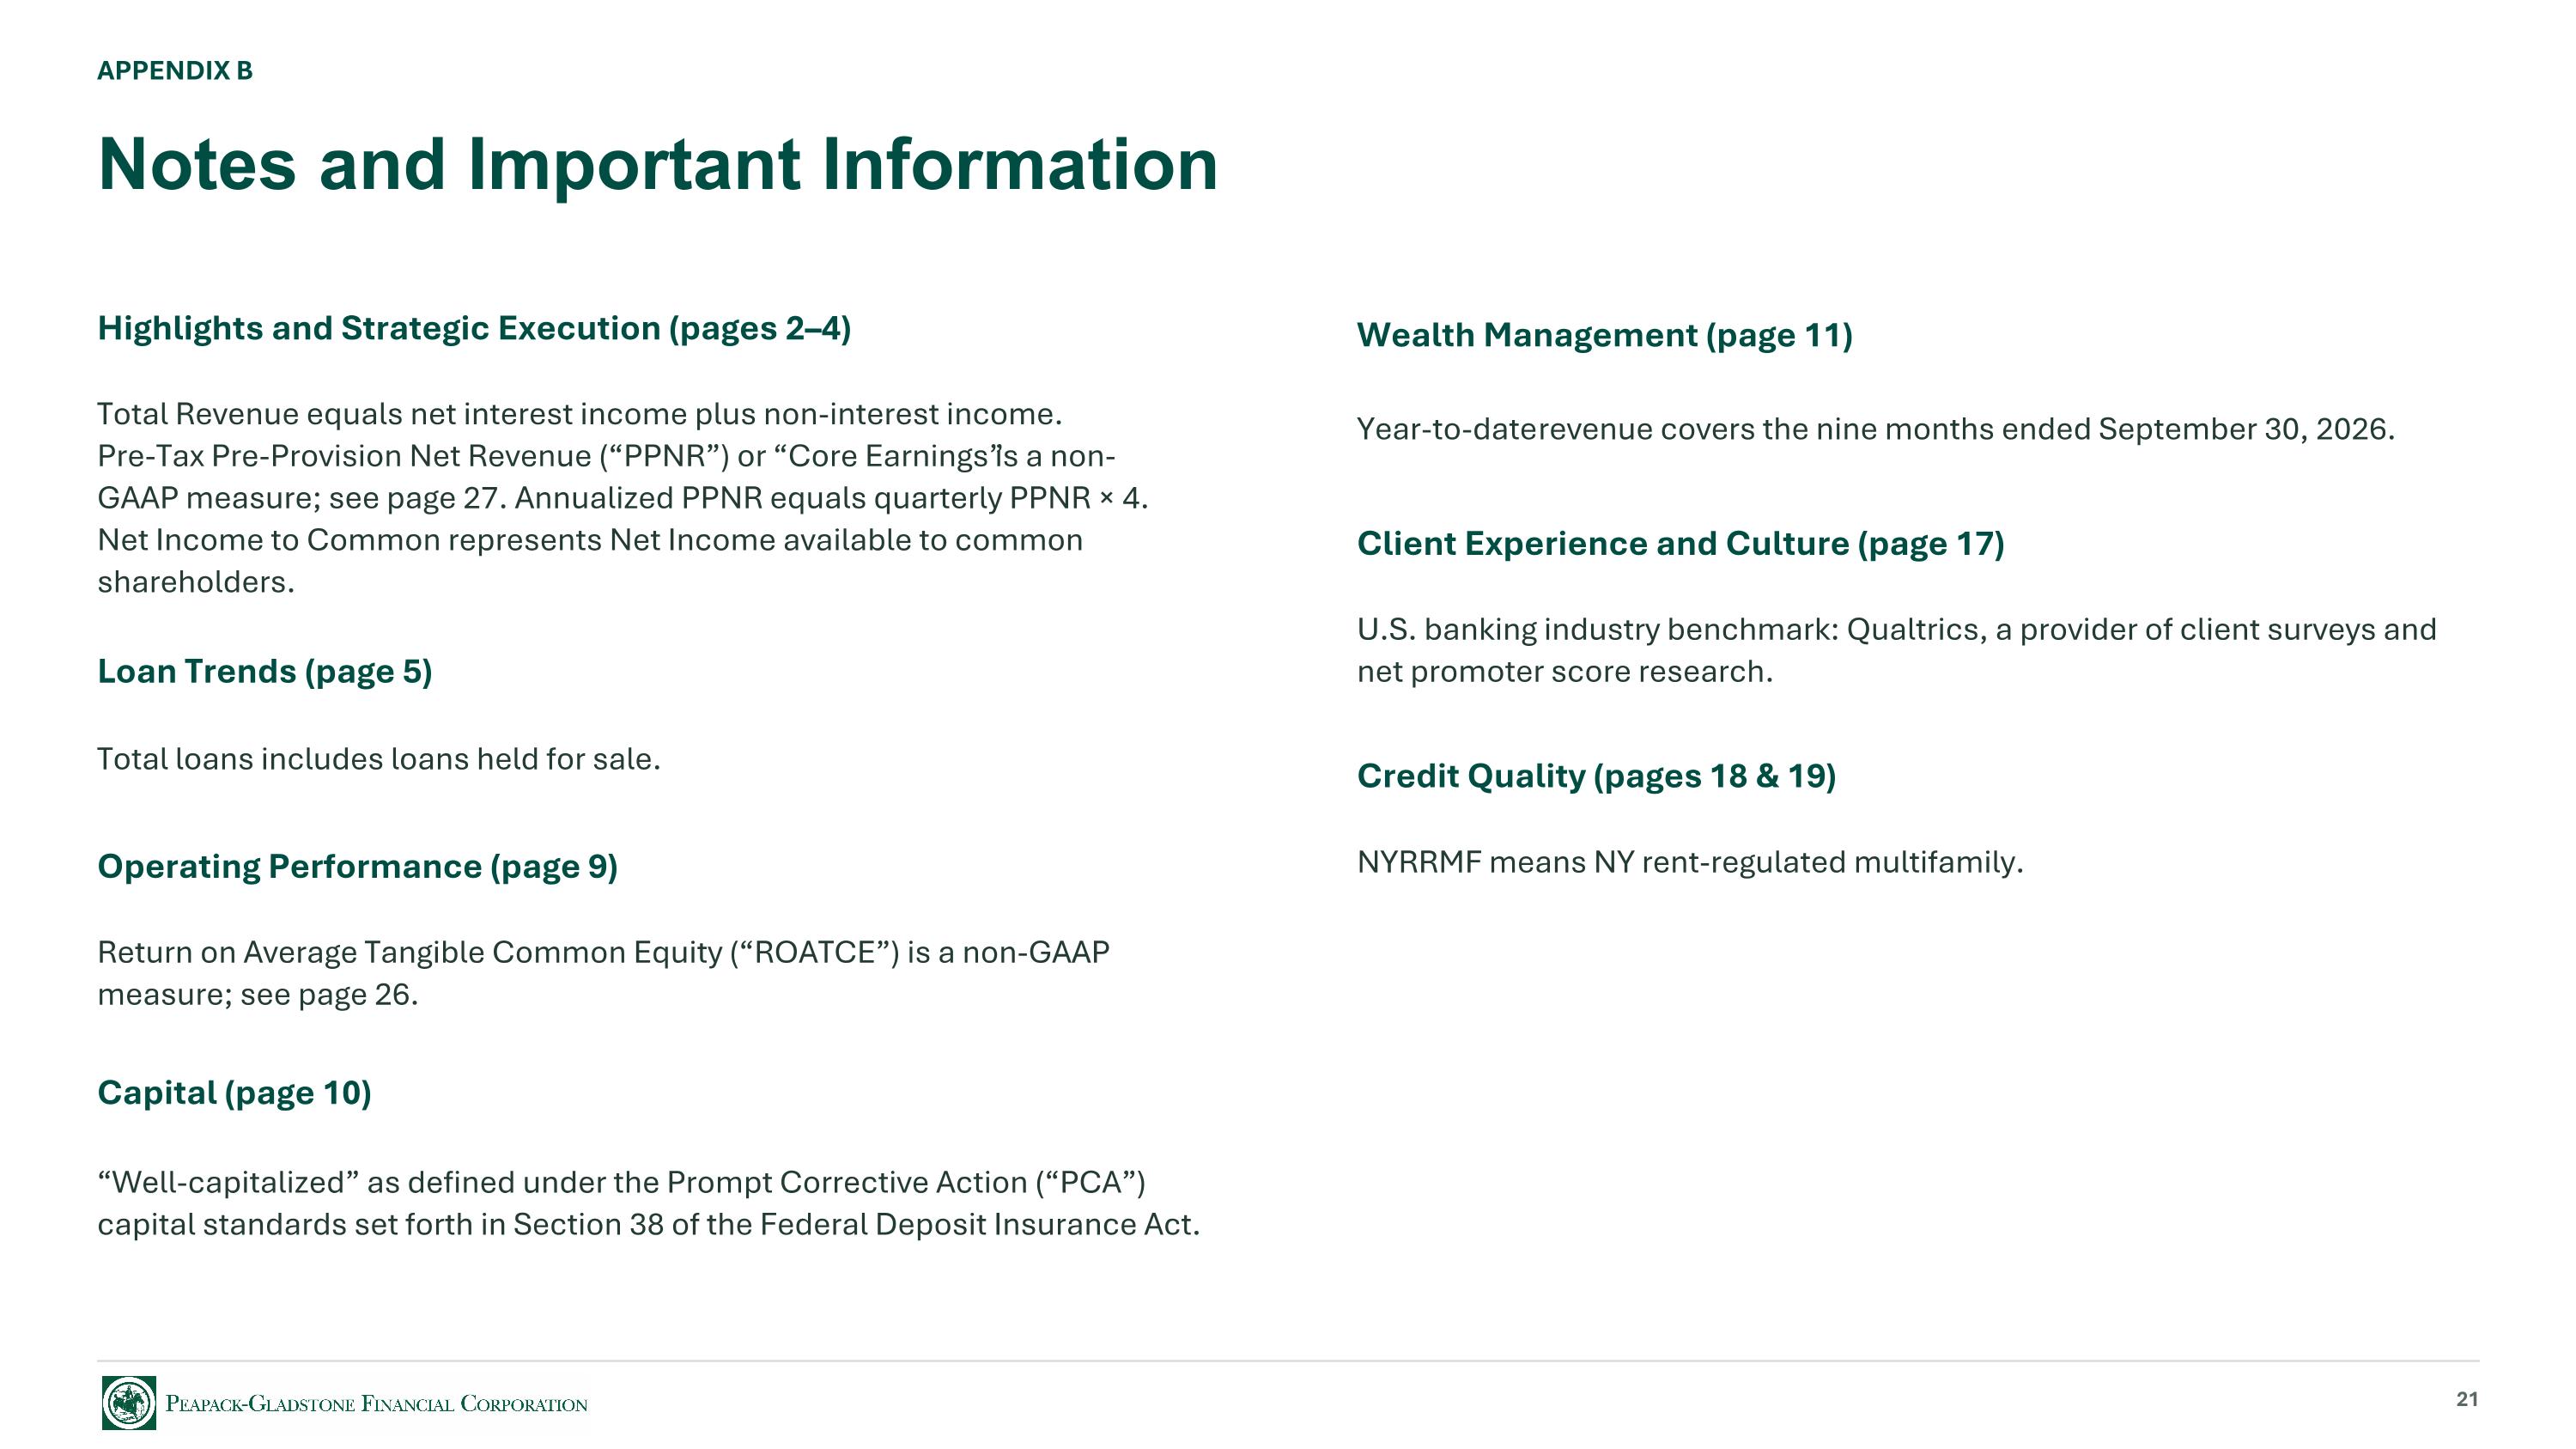
APPENDIX B Notes and Important Information Highlights and Strategic Execution (pages 2–4) Total Revenue equals net interest income plus non-interest income. Pre-Tax Pre-Provision Net Revenue (“PPNR”) or “Core Earnings” is a non-GAAP measure; see page 27. Annualized PPNR equals quarterly PPNR × 4. Net Income to Common represents Net Income available to common shareholders. Wealth Management (page 11) Year-to-date revenue covers the nine months ended September 30, 2026. Client Experience and Culture (page 17) U.S. banking industry benchmark: Qualtrics, a provider of client surveys and net promoter score research. Credit Quality (pages 18 & 19) NYRRMF means NY rent-regulated multifamily. 21 Loan Trends (page 5) Total loans includes loans held for sale. Operating Performance (page 9) Return on Average Tangible Common Equity (“ROATCE”) is a non-GAAP measure; see page 26. Capital (page 10) “Well-capitalized” as defined under the Prompt Corrective Action (“PCA”) capital standards set forth in Section 38 of the Federal Deposit Insurance Act.
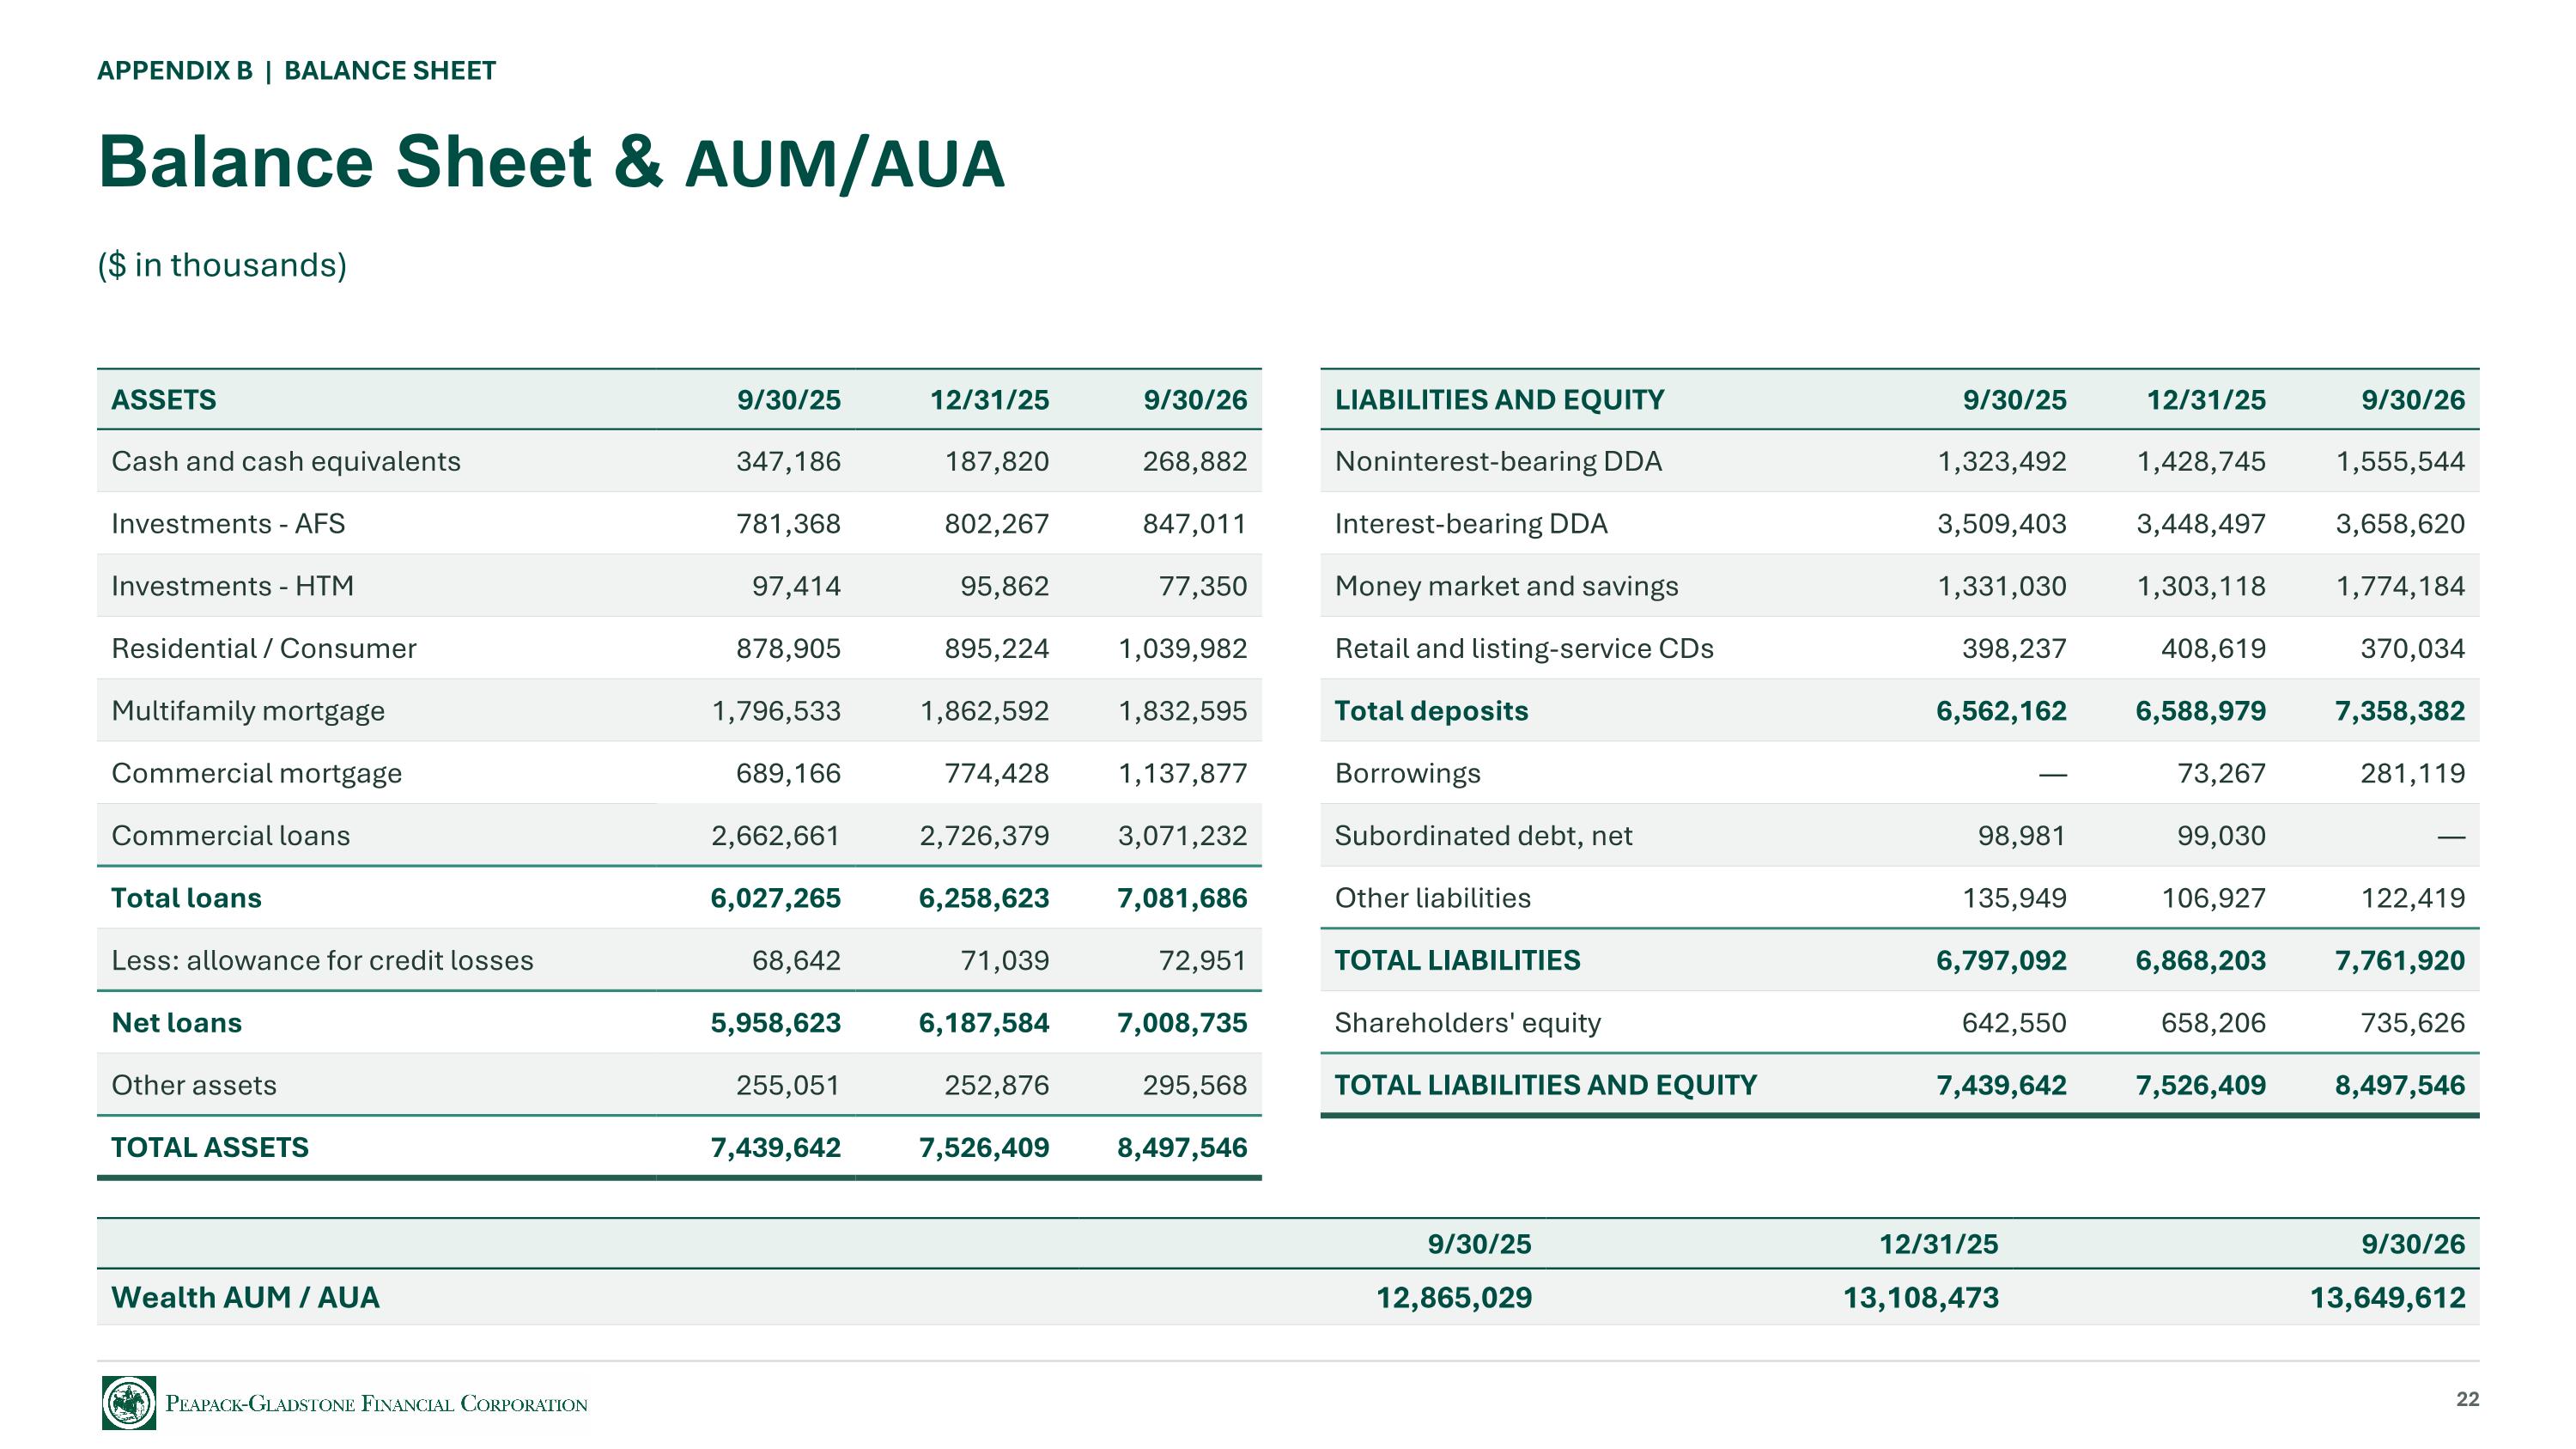
APPENDIX B | BALANCE SHEET Balance Sheet & AUM/AUA ($ in thousands) ASSETS 9/30/25 12/31/25 9/30/26 Cash and cash equivalents 347,186 187,820 268,882 Investments - AFS 781,368 802,267 847,011 Investments - HTM 97,414 95,862 77,350 Residential / Consumer 878,905 895,224 1,039,982 Multifamily mortgage 1,796,533 1,862,592 1,832,595 Commercial mortgage 689,166 774,428 1,137,877 Commercial loans 2,662,661 2,726,379 3,071,232 Total loans 6,027,265 6,258,623 7,081,686 Less: allowance for credit losses 68,642 71,039 72,951 Net loans 5,958,623 6,187,584 7,008,735 Other assets 255,051 252,876 295,568 TOTAL ASSETS 7,439,642 7,526,409 8,497,546 LIABILITIES AND EQUITY 9/30/25 12/31/25 9/30/26 Noninterest-bearing DDA 1,323,492 1,428,745 1,555,544 Interest-bearing DDA 3,509,403 3,448,497 3,658,620 Money market and savings 1,331,030 1,303,118 1,774,184 Retail and listing-service CDs 398,237 408,619 370,034 Total deposits 6,562,162 6,588,979 7,358,382 Borrowings — 73,267 281,119 Subordinated debt, net 98,981 99,030 — Other liabilities 135,949 106,927 122,419 TOTAL LIABILITIES 6,797,092 6,868,203 7,761,920 Shareholders' equity 642,550 658,206 735,626 TOTAL LIABILITIES AND EQUITY 7,439,642 7,526,409 8,497,546 9/30/25 12/31/25 9/30/26 Wealth AUM / AUA 12,865,029 13,108,473 13,649,612 22
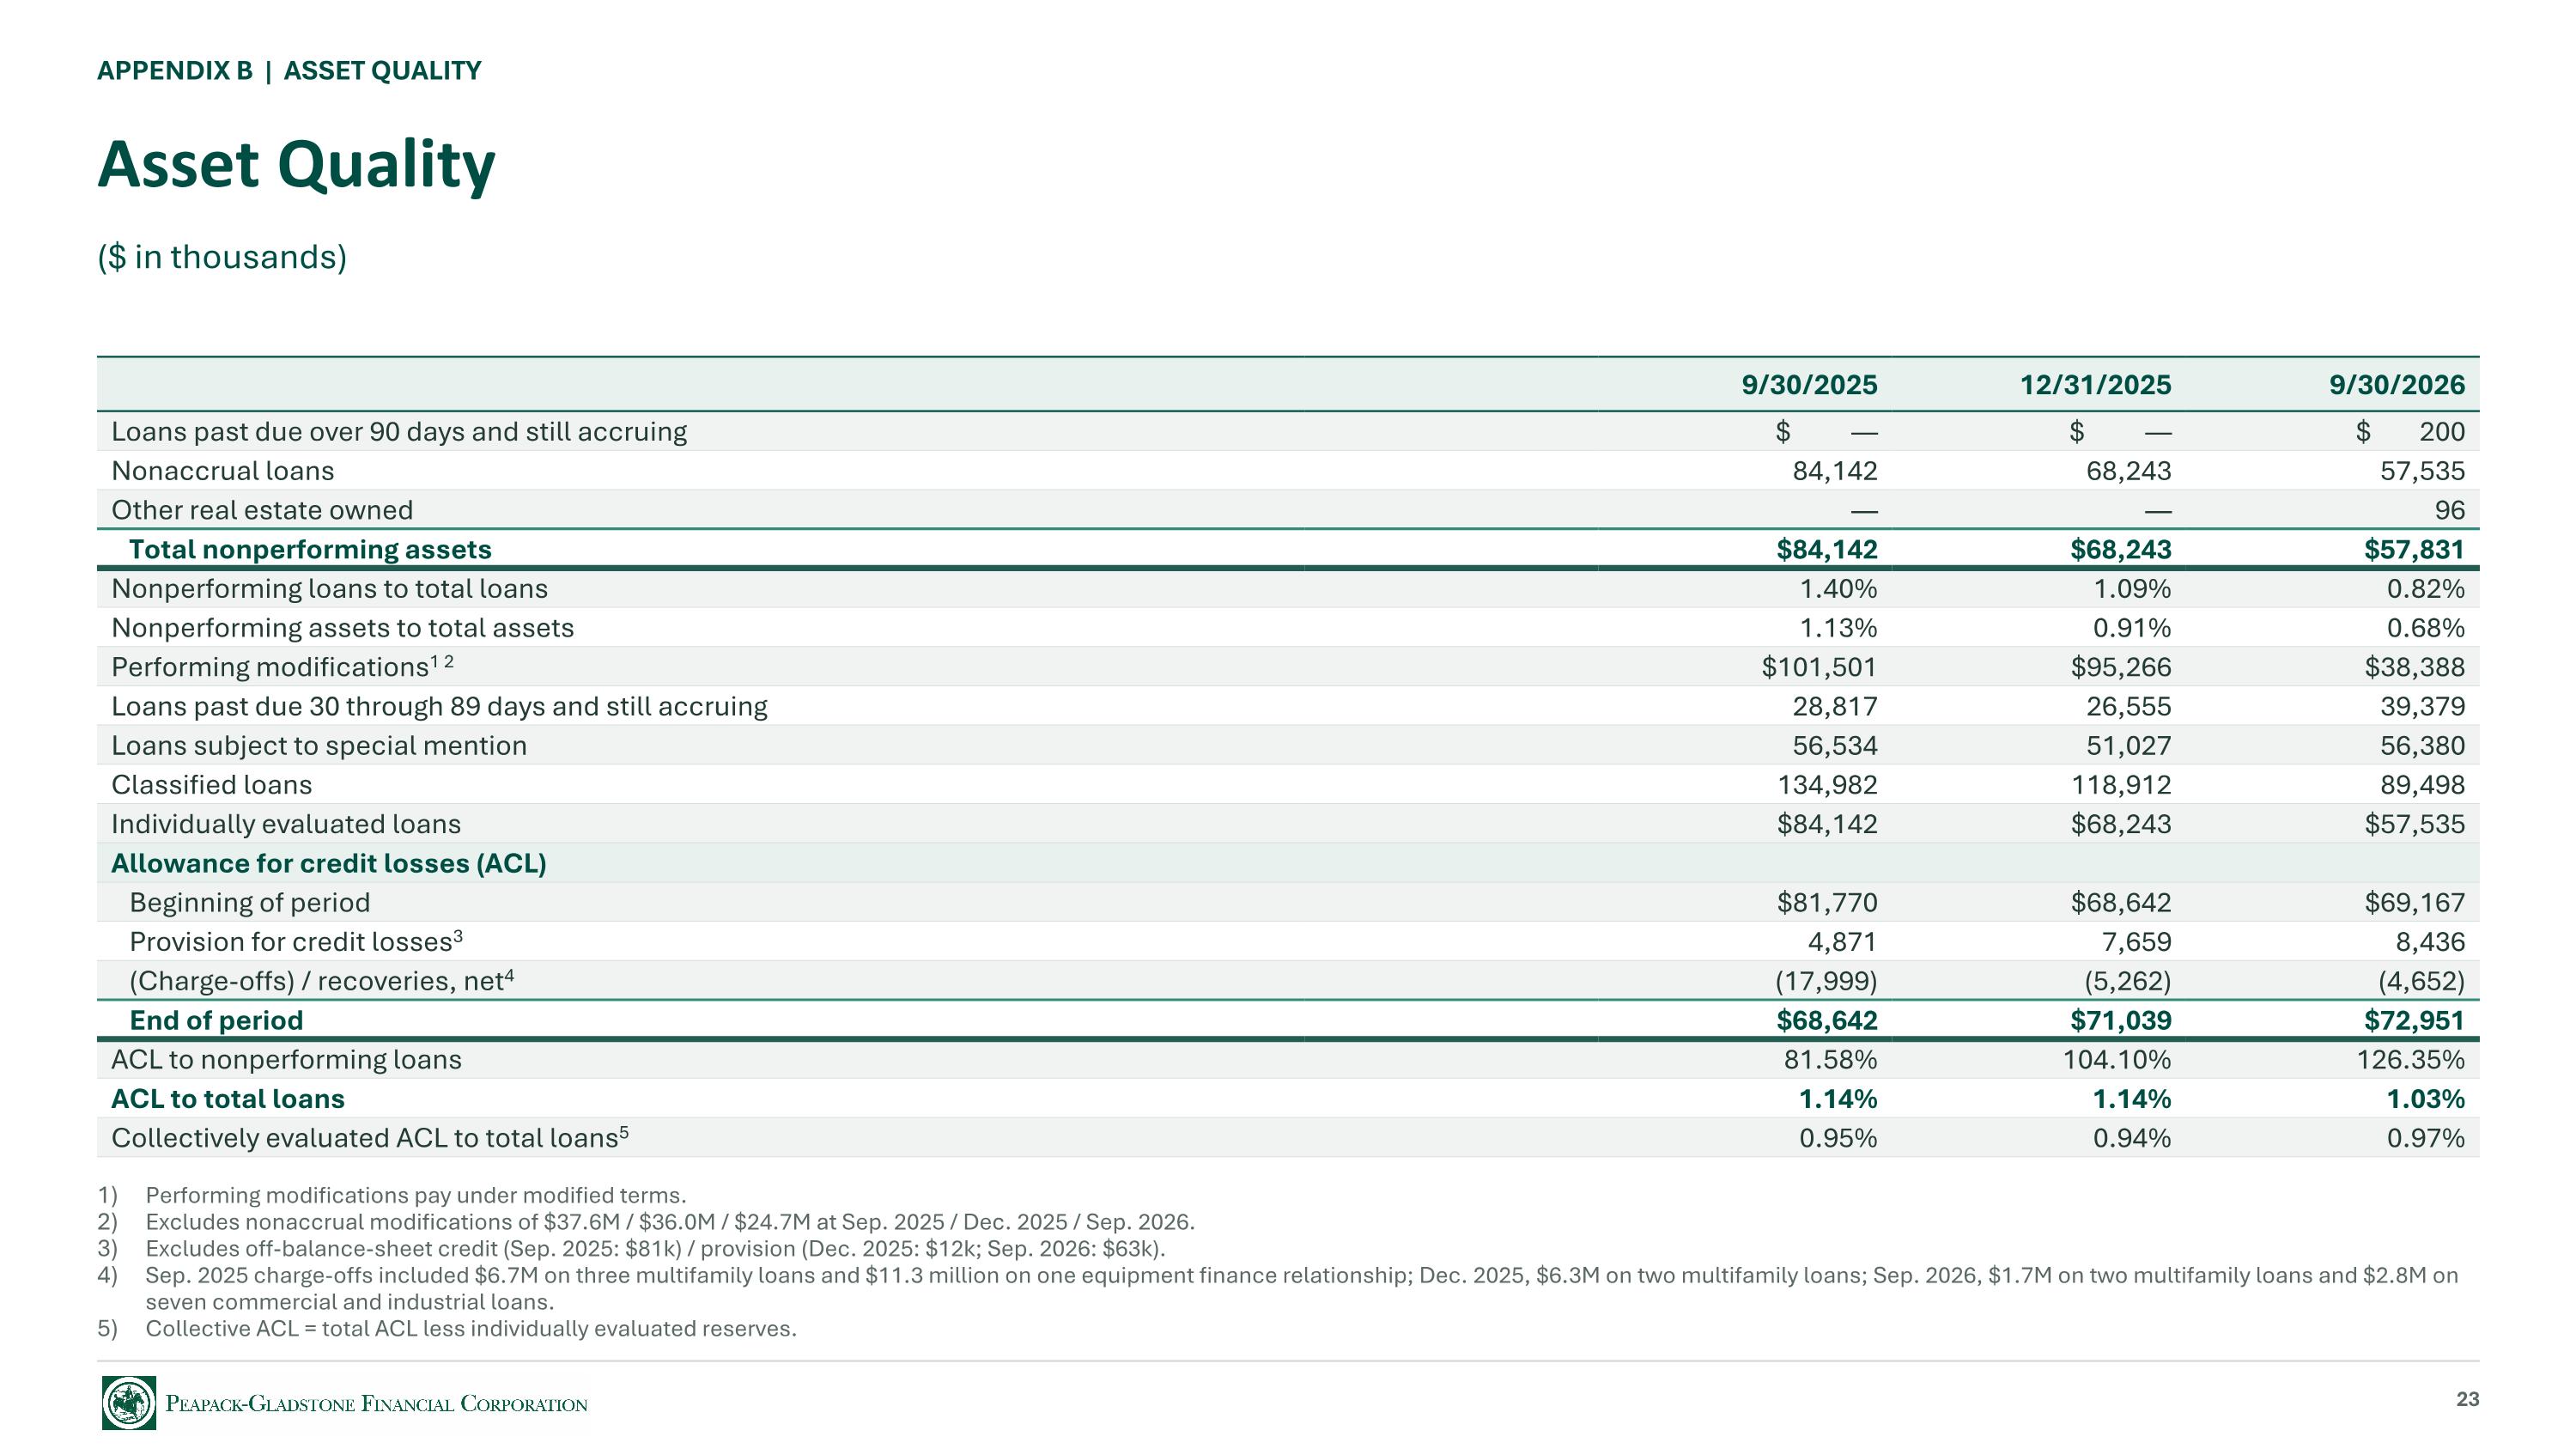
APPENDIX B | ASSET QUALITY Asset Quality ($ in thousands) 9/30/2025 12/31/2025 9/30/2026 Loans past due over 90 days and still accruing $ — $ — $ 200 Nonaccrual loans 84,142 68,243 57,535 Other real estate owned — — 96 Total nonperforming assets $84,142 $68,243 $57,831 Nonperforming loans to total loans 1.40% 1.09% 0.82% Nonperforming assets to total assets 1.13% 0.91% 0.68% Performing modifications1 2 $101,501 $95,266 $38,388 Loans past due 30 through 89 days and still accruing 28,817 26,555 39,379 Loans subject to special mention 56,534 51,027 56,380 Classified loans 134,982 118,912 89,498 Individually evaluated loans $84,142 $68,243 $57,535 Allowance for credit losses (ACL) Beginning of period $81,770 $68,642 $69,167 Provision for credit losses3 4,871 7,659 8,436 (Charge-offs) / recoveries, net4 (17,999) (5,262) (4,652) End of period $68,642 $71,039 $72,951 ACL to nonperforming loans 81.58% 104.10% 126.35% ACL to total loans 1.14% 1.14% 1.03% Collectively evaluated ACL to total loans5 0.95% 0.94% 0.97% Performing modifications pay under modified terms. Excludes nonaccrual modifications of $37.6M / $36.0M / $24.7M at Sep. 2025 / Dec. 2025 / Sep. 2026. Excludes off-balance-sheet credit (Sep. 2025: $81k) / provision (Dec. 2025: $12k; Sep. 2026: $63k). Sep. 2025 charge-offs included $6.7M on three multifamily loans and $11.3 million on one equipment finance relationship; Dec. 2025, $6.3M on two multifamily loans; Sep. 2026, $1.7M on two multifamily loans and $2.8M on seven commercial and industrial loans. Collective ACL = total ACL less individually evaluated reserves. 23
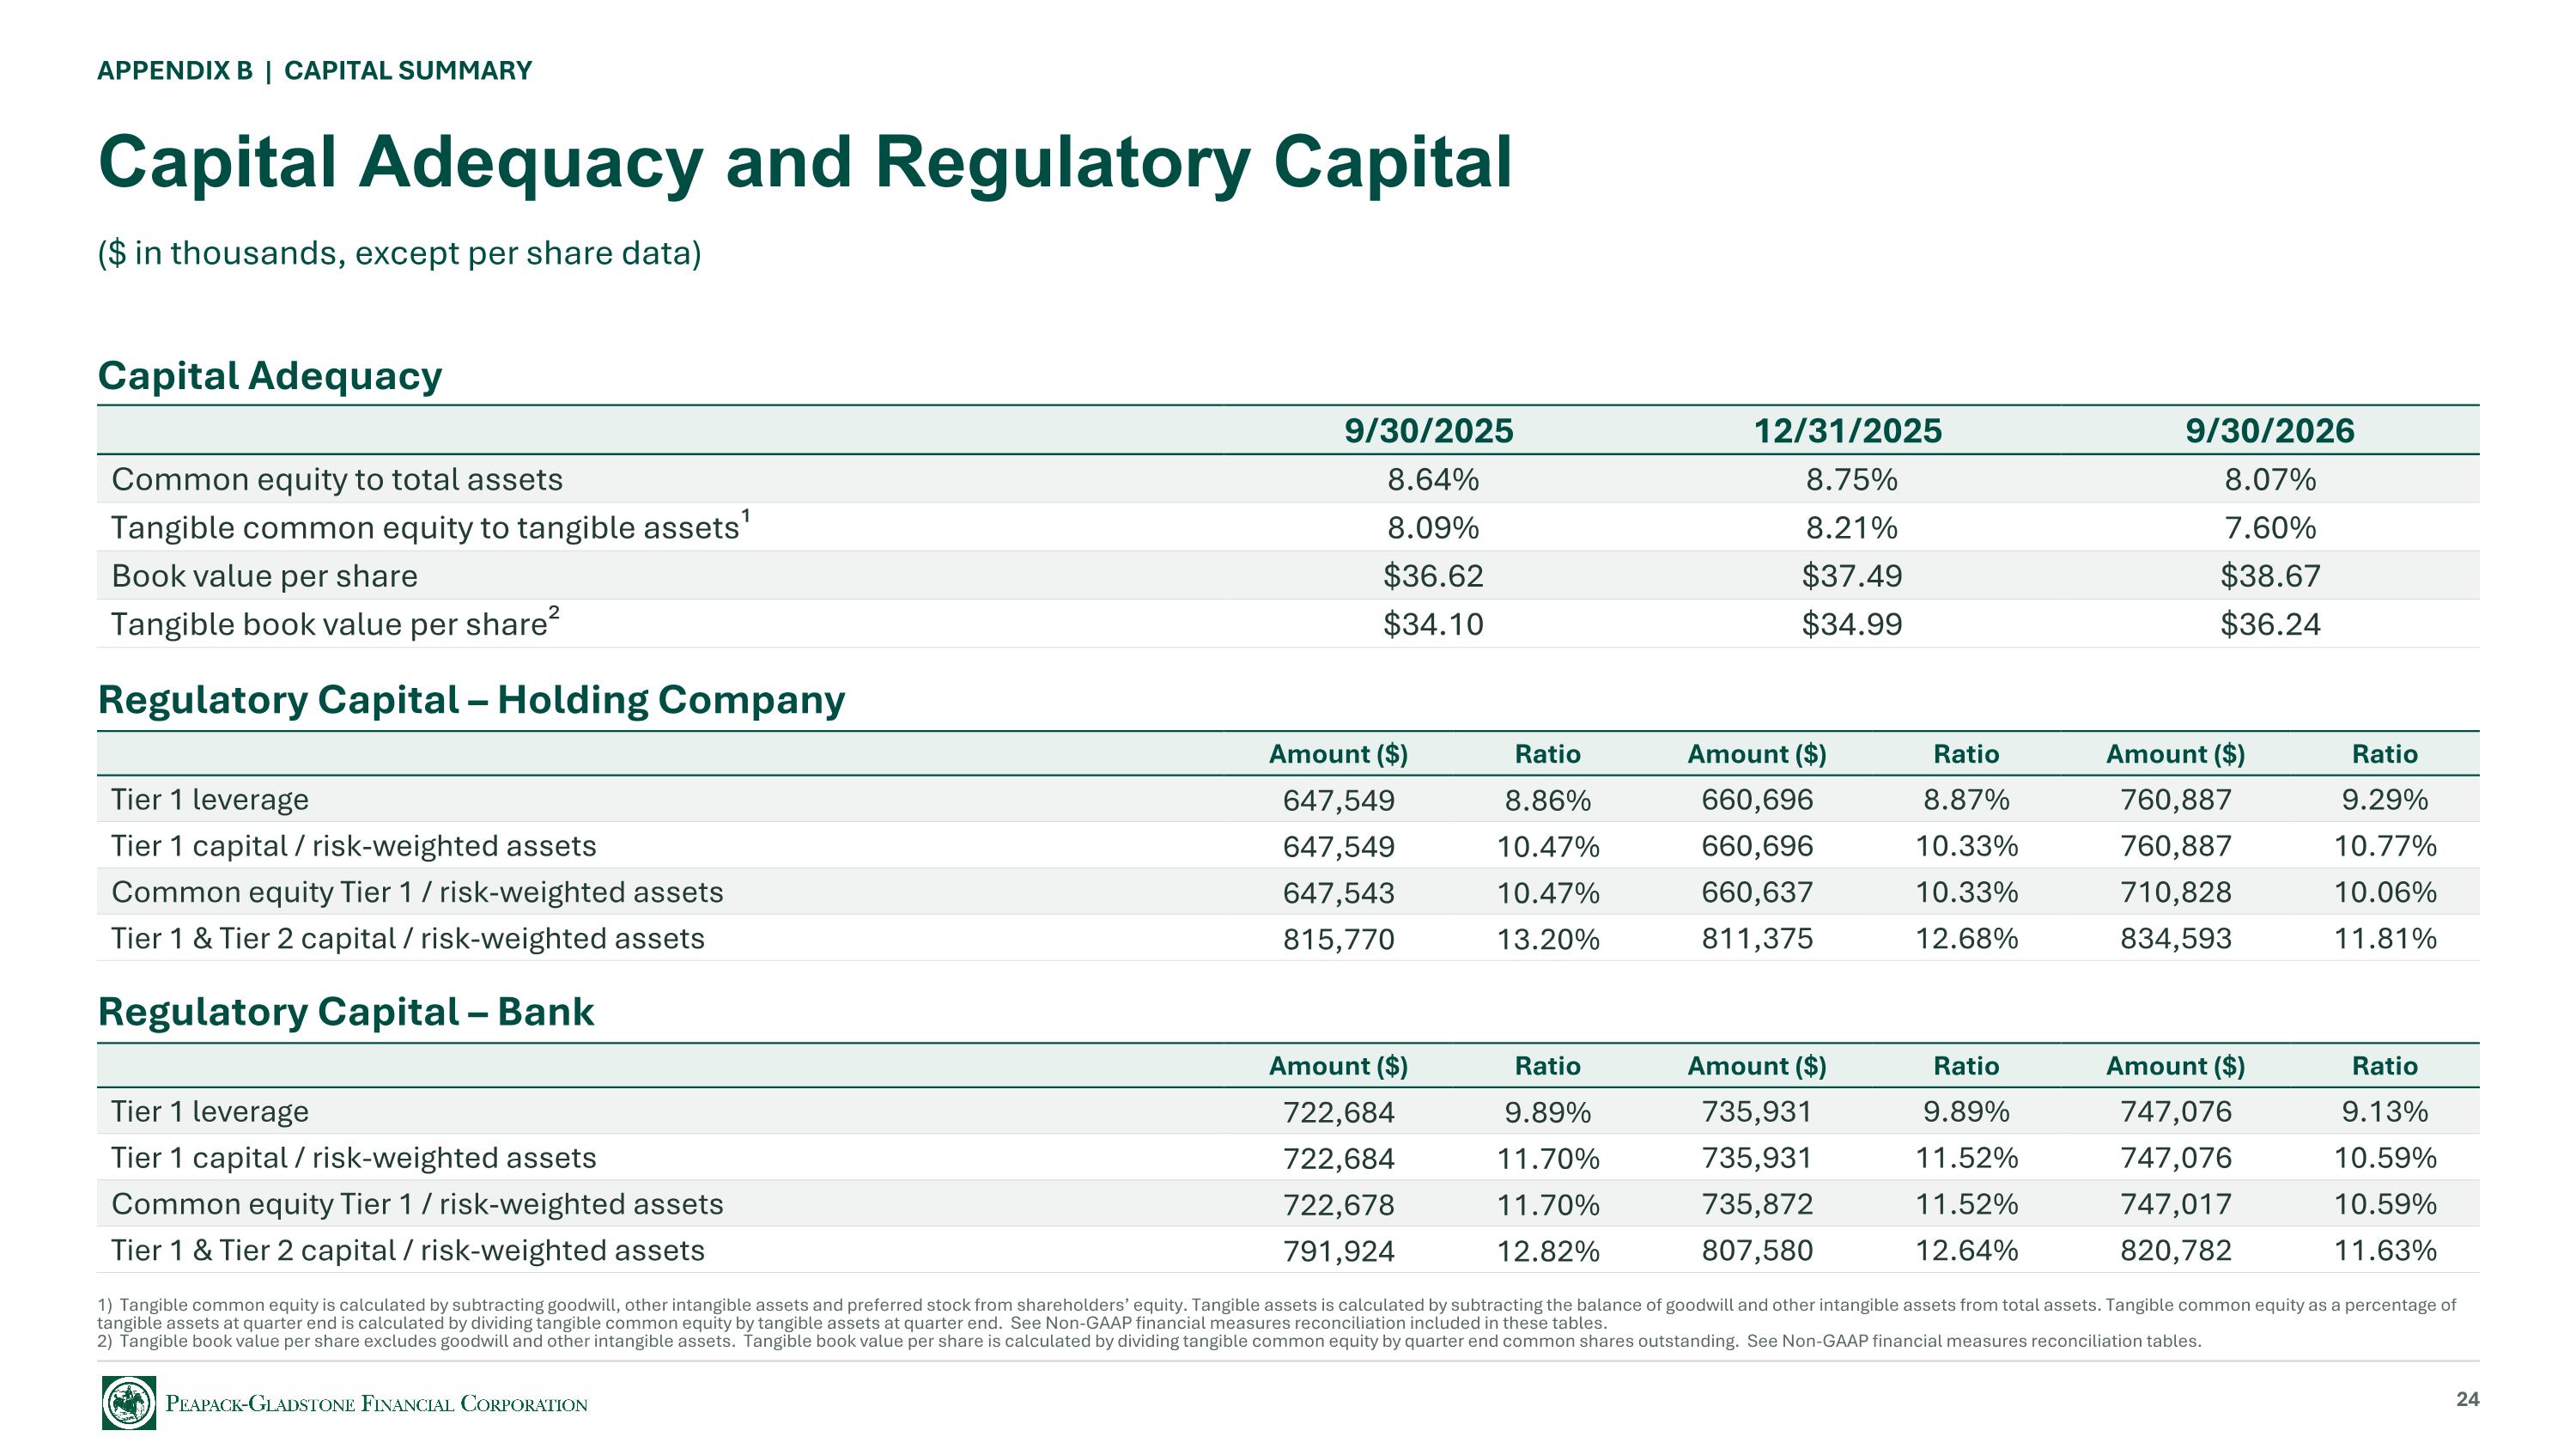
APPENDIX B | CAPITAL SUMMARY Capital Adequacy and Regulatory Capital ($ in thousands, except per share data) 9/30/2025 12/31/2025 9/30/2026 Common equity to total assets 8.64% 8.75% 8.07% Tangible common equity to tangible assets¹ 8.09% 8.21% 7.60% Book value per share $36.62 $37.49 $38.67 Tangible book value per share² $34.10 $34.99 $36.24 Regulatory Capital – Holding Company Amount ($) Ratio Amount ($) Ratio Amount ($) Ratio Tier 1 leverage 647,549 8.86% 660,696 8.87% 760,887 9.29% Tier 1 capital / risk-weighted assets 647,549 10.47% 660,696 10.33% 760,887 10.77% Common equity Tier 1 / risk-weighted assets 647,543 10.47% 660,637 10.33% 710,828 10.06% Tier 1 & Tier 2 capital / risk-weighted assets 815,770 13.20% 811,375 12.68% 834,593 11.81% Regulatory Capital – Bank Amount ($) Ratio Amount ($) Ratio Amount ($) Ratio Tier 1 leverage 722,684 9.89% 735,931 9.89% 747,076 9.13% Tier 1 capital / risk-weighted assets 722,684 11.70% 735,931 11.52% 747,076 10.59% Common equity Tier 1 / risk-weighted assets 722,678 11.70% 735,872 11.52% 747,017 10.59% Tier 1 & Tier 2 capital / risk-weighted assets 791,924 12.82% 807,580 12.64% 820,782 11.63% 1) Tangible common equity is calculated by subtracting goodwill, other intangible assets and preferred stock from shareholders’ equity. Tangible assets is calculated by subtracting the balance of goodwill and other intangible assets from total assets. Tangible common equity as a percentage of tangible assets at quarter end is calculated by dividing tangible common equity by tangible assets at quarter end. See Non-GAAP financial measures reconciliation included in these tables. 2) Tangible book value per share excludes goodwill and other intangible assets. Tangible book value per share is calculated by dividing tangible common equity by quarter end common shares outstanding. See Non-GAAP financial measures reconciliation tables. 24 Capital Adequacy
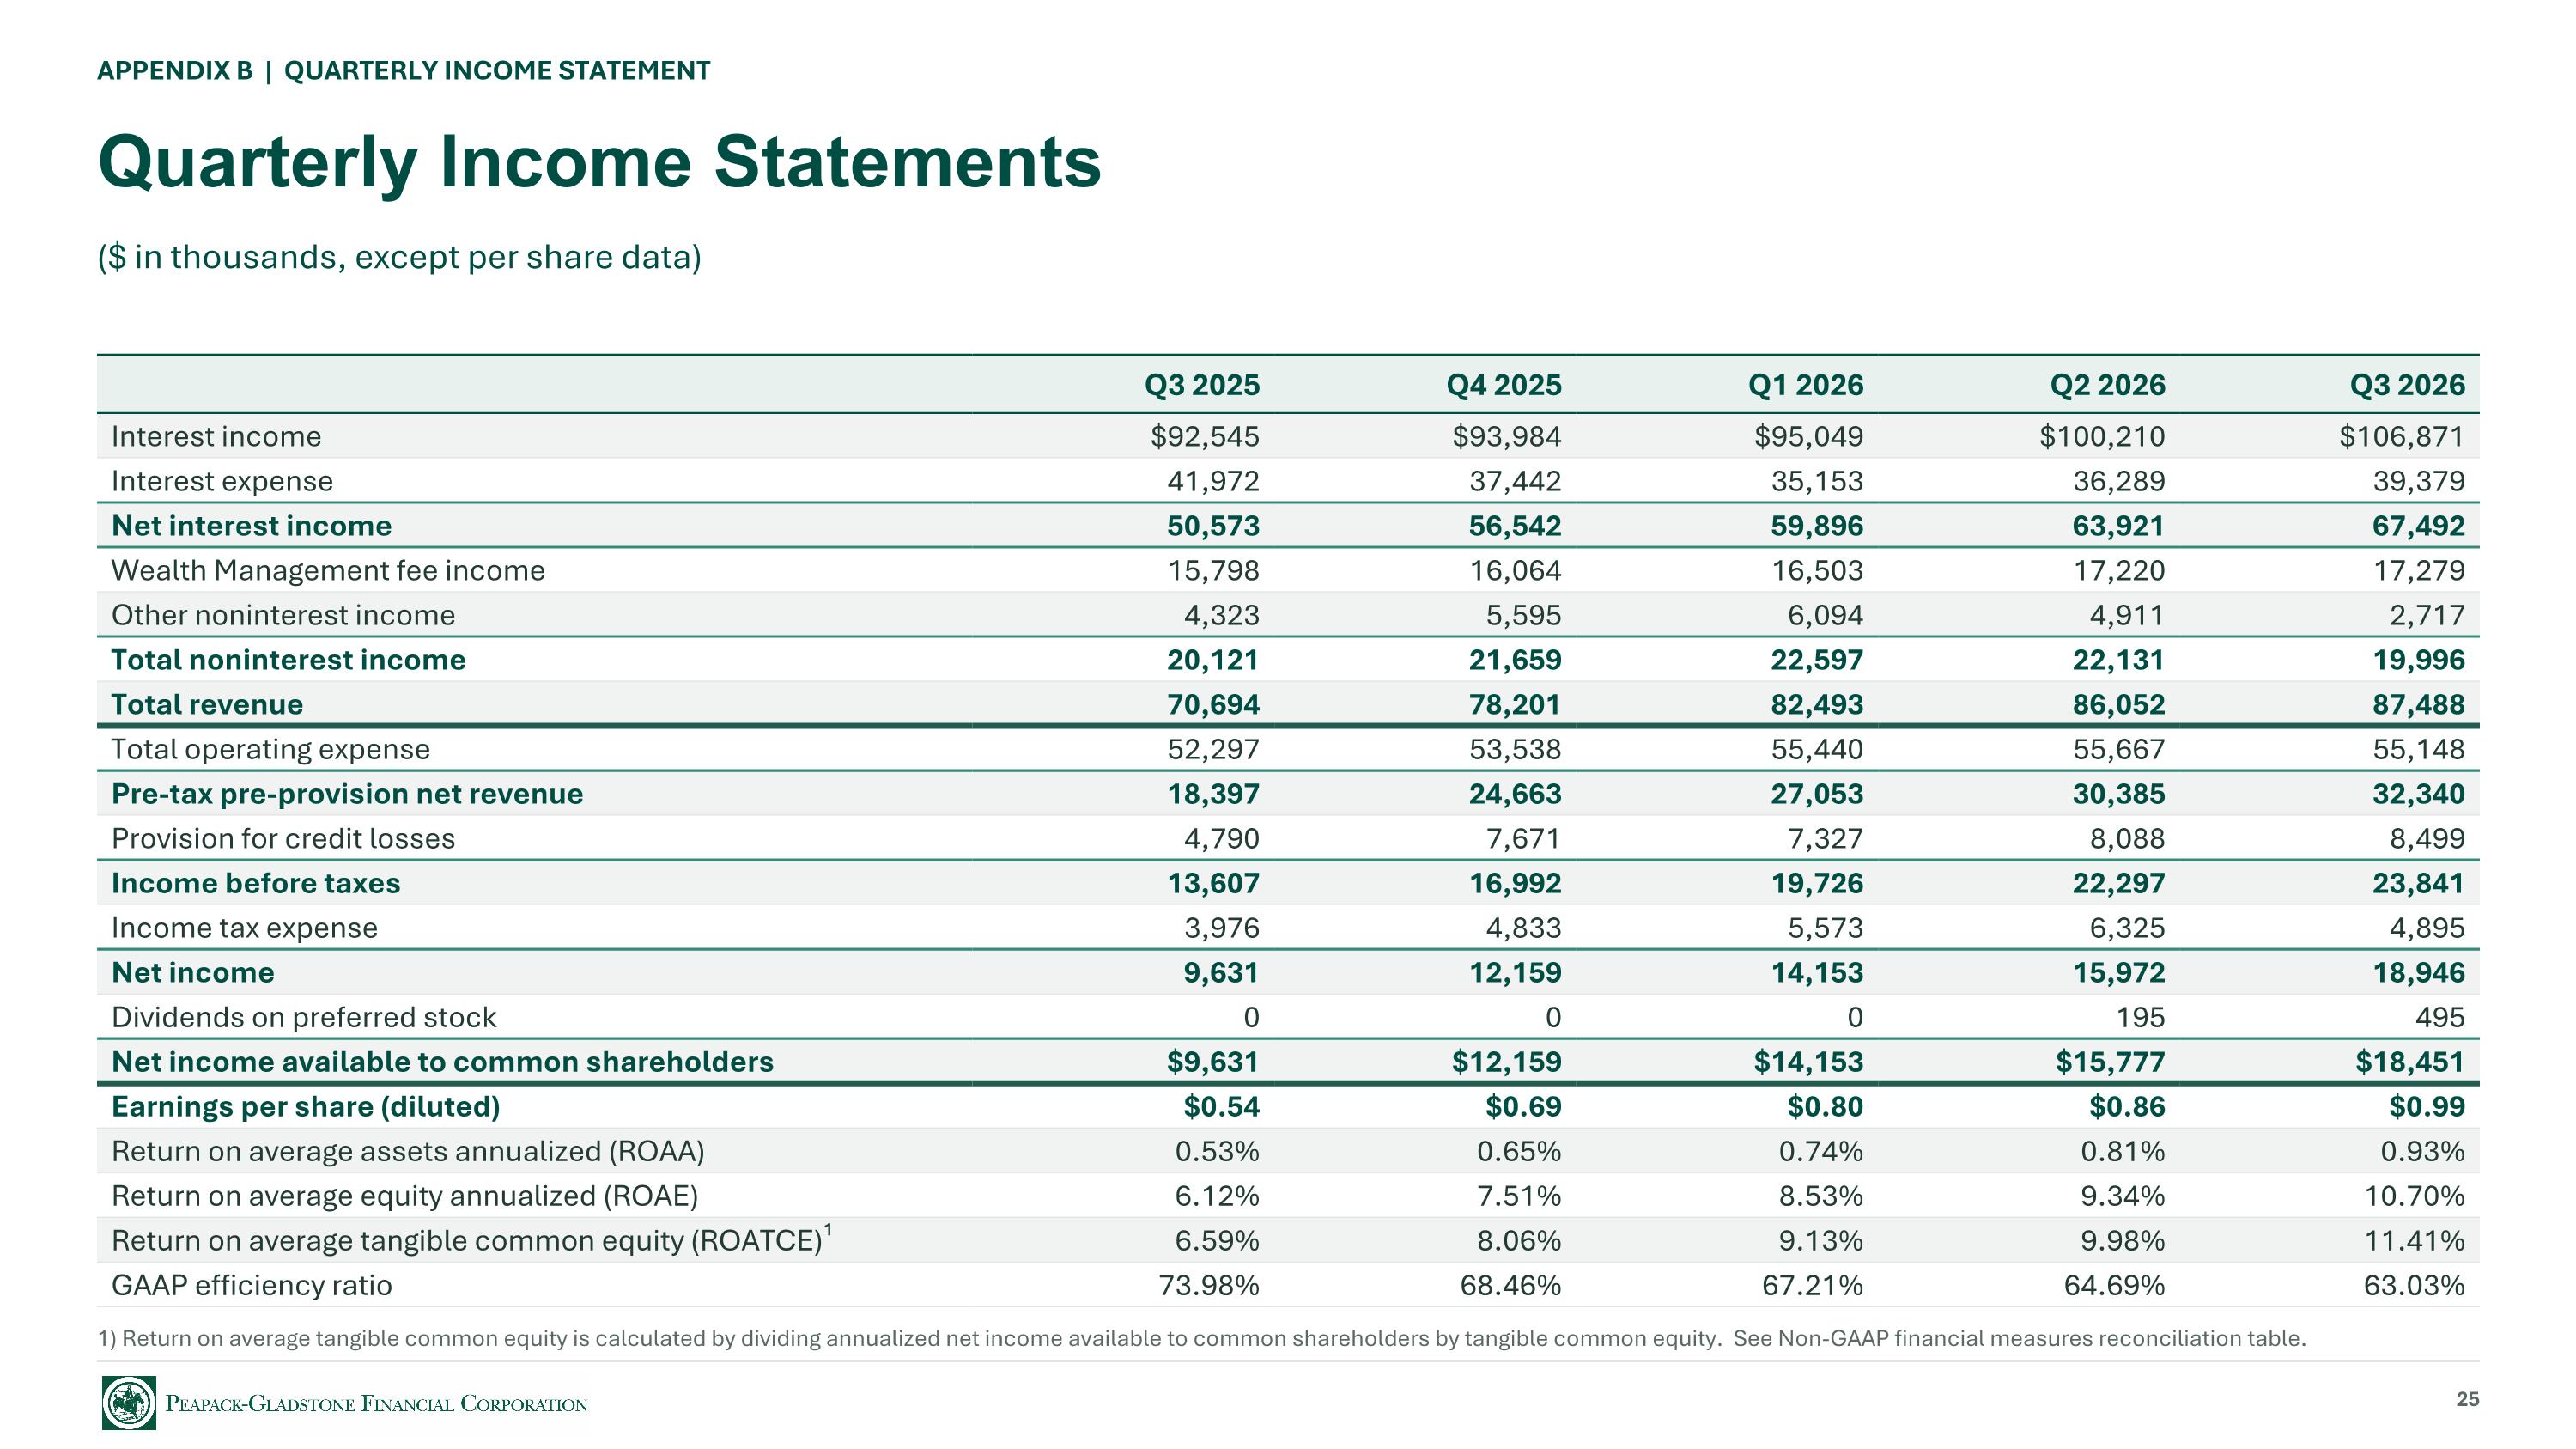
APPENDIX B | QUARTERLY INCOME STATEMENT Quarterly Income Statements ($ in thousands, except per share data) Q3 2025 Q4 2025 Q1 2026 Q2 2026 Q3 2026 Interest income $92,545 $93,984 $95,049 $100,210 $106,871 Interest expense 41,972 37,442 35,153 36,289 39,379 Net interest income 50,573 56,542 59,896 63,921 67,492 Wealth Management fee income 15,798 16,064 16,503 17,220 17,279 Other noninterest income 4,323 5,595 6,094 4,911 2,717 Total noninterest income 20,121 21,659 22,597 22,131 19,996 Total revenue 70,694 78,201 82,493 86,052 87,488 Total operating expense 52,297 53,538 55,440 55,667 55,148 Pre-tax pre-provision net revenue 18,397 24,663 27,053 30,385 32,340 Provision for credit losses 4,790 7,671 7,327 8,088 8,499 Income before taxes 13,607 16,992 19,726 22,297 23,841 Income tax expense 3,976 4,833 5,573 6,325 4,895 Net income 9,631 12,159 14,153 15,972 18,946 Dividends on preferred stock 0 0 0 195 495 Net income available to common shareholders $9,631 $12,159 $14,153 $15,777 $18,451 Earnings per share (diluted) $0.54 $0.69 $0.80 $0.86 $0.99 Return on average assets annualized (ROAA) 0.53% 0.65% 0.74% 0.81% 0.93% Return on average equity annualized (ROAE) 6.12% 7.51% 8.53% 9.34% 10.70% Return on average tangible common equity (ROATCE)¹ 6.59% 8.06% 9.13% 9.98% 11.41% GAAP efficiency ratio 73.98% 68.46% 67.21% 64.69% 63.03% 1) Return on average tangible common equity is calculated by dividing annualized net income available to common shareholders by tangible common equity. See Non-GAAP financial measures reconciliation table. 25
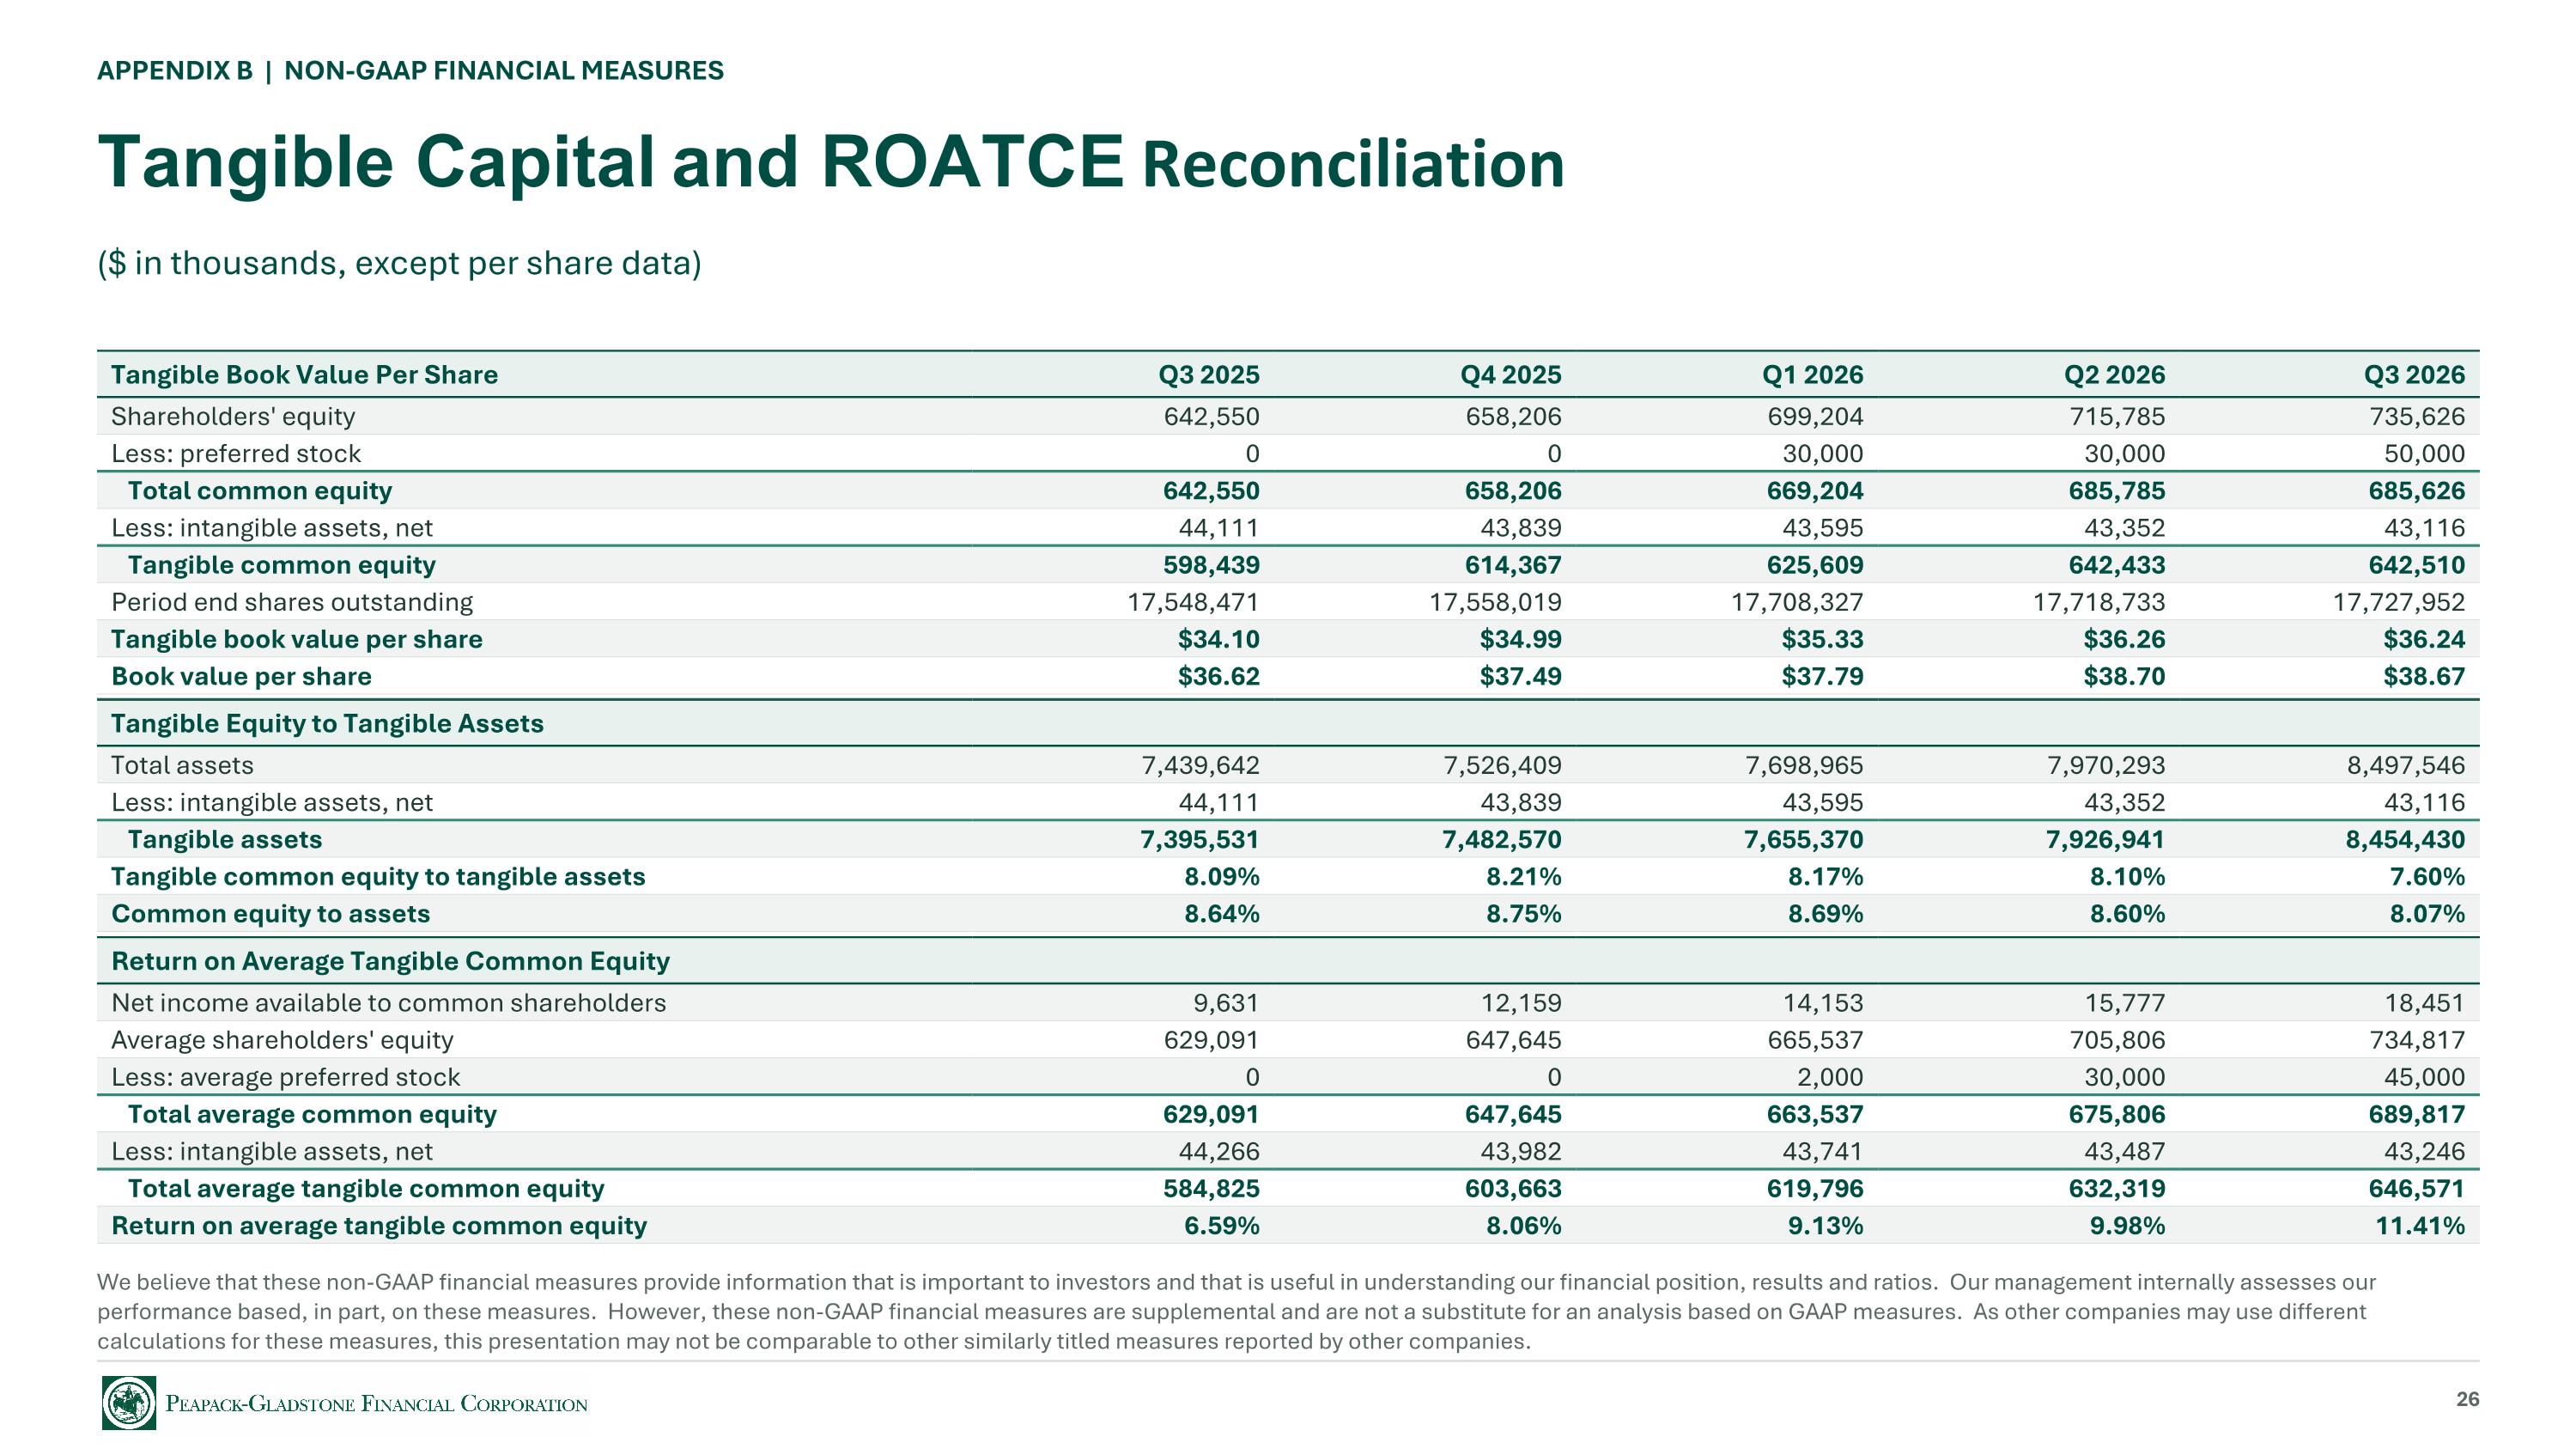
APPENDIX B | NON-GAAP FINANCIAL MEASURES Tangible Capital and ROATCE Reconciliation ($ in thousands, except per share data) Tangible Book Value Per Share Q3 2025 Q4 2025 Q1 2026 Q2 2026 Q3 2026 Shareholders' equity 642,550 658,206 699,204 715,785 735,626 Less: preferred stock 0 0 30,000 30,000 50,000 Total common equity 642,550 658,206 669,204 685,785 685,626 Less: intangible assets, net 44,111 43,839 43,595 43,352 43,116 Tangible common equity 598,439 614,367 625,609 642,433 642,510 Period end shares outstanding 17,548,471 17,558,019 17,708,327 17,718,733 17,727,952 Tangible book value per share $34.10 $34.99 $35.33 $36.26 $36.24 Book value per share $36.62 $37.49 $37.79 $38.70 $38.67 Tangible Equity to Tangible Assets Total assets 7,439,642 7,526,409 7,698,965 7,970,293 8,497,546 Less: intangible assets, net 44,111 43,839 43,595 43,352 43,116 Tangible assets 7,395,531 7,482,570 7,655,370 7,926,941 8,454,430 Tangible common equity to tangible assets 8.09% 8.21% 8.17% 8.10% 7.60% Common equity to assets 8.64% 8.75% 8.69% 8.60% 8.07% Return on Average Tangible Common Equity Net income available to common shareholders 9,631 12,159 14,153 15,777 18,451 Average shareholders' equity 629,091 647,645 665,537 705,806 734,817 Less: average preferred stock 0 0 2,000 30,000 45,000 Total average common equity 629,091 647,645 663,537 675,806 689,817 Less: intangible assets, net 44,266 43,982 43,741 43,487 43,246 Total average tangible common equity 584,825 603,663 619,796 632,319 646,571 Return on average tangible common equity 6.59% 8.06% 9.13% 9.98% 11.41% We believe that these non-GAAP financial measures provide information that is important to investors and that is useful in understanding our financial position, results and ratios. Our management internally assesses our performance based, in part, on these measures. However, these non-GAAP financial measures are supplemental and are not a substitute for an analysis based on GAAP measures. As other companies may use different calculations for these measures, this presentation may not be comparable to other similarly titled measures reported by other companies. 26
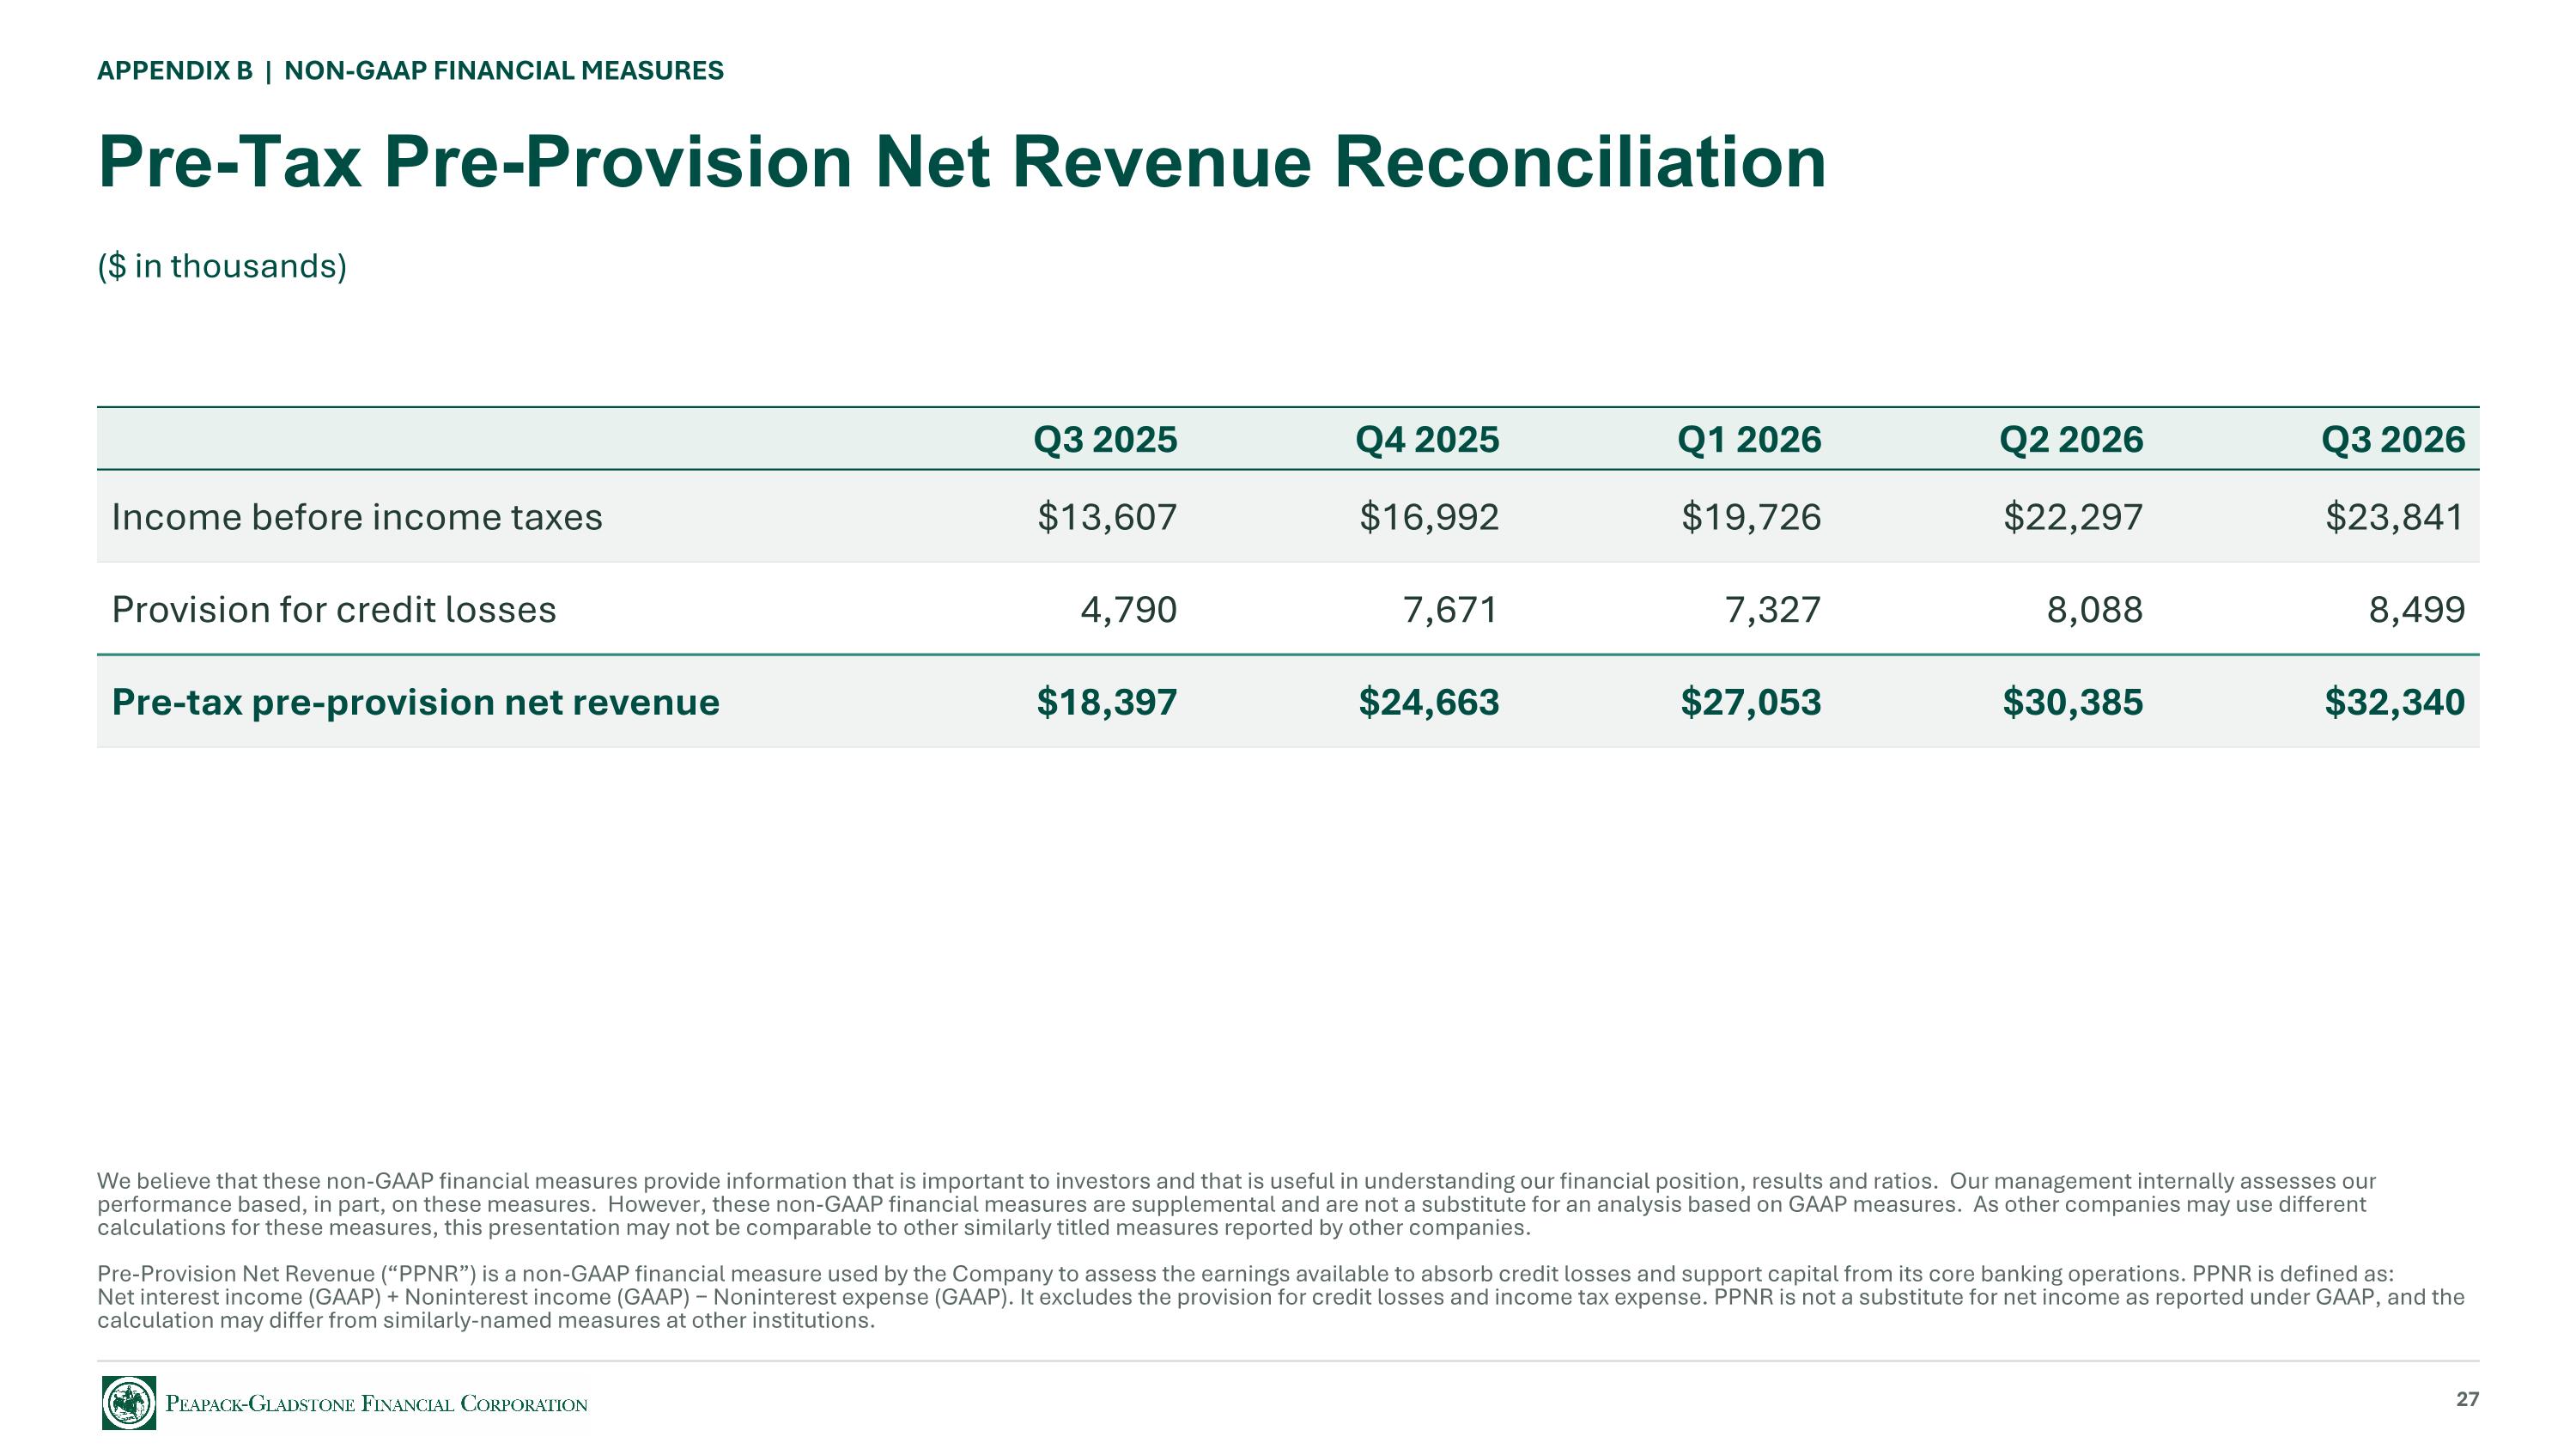
APPENDIX B | NON-GAAP FINANCIAL MEASURES Pre-Tax Pre-Provision Net Revenue Reconciliation ($ in thousands) Q3 2025 Q4 2025 Q1 2026 Q2 2026 Q3 2026 Income before income taxes $13,607 $16,992 $19,726 $22,297 $23,841 Provision for credit losses 4,790 7,671 7,327 8,088 8,499 Pre-tax pre-provision net revenue $18,397 $24,663 $27,053 $30,385 $32,340 We believe that these non-GAAP financial measures provide information that is important to investors and that is useful in understanding our financial position, results and ratios. Our management internally assesses our performance based, in part, on these measures. However, these non-GAAP financial measures are supplemental and are not a substitute for an analysis based on GAAP measures. As other companies may use different calculations for these measures, this presentation may not be comparable to other similarly titled measures reported by other companies. Pre-Provision Net Revenue (“PPNR”) is a non-GAAP financial measure used by the Company to assess the earnings available to absorb credit losses and support capital from its core banking operations. PPNR is defined as: Net interest income (GAAP) + Noninterest income (GAAP) − Noninterest expense (GAAP). It excludes the provision for credit losses and income tax expense. PPNR is not a substitute for net income as reported under GAAP, and the calculation may differ from similarly-named measures at other institutions. 27

Peapack-Gladstone Financial Corporation Investor Relations Contacts Douglas L. Kennedy President & Chief Executive Officer 908-719-6554 | dkennedy@peapackprivate.com Frank A. Cavallaro Senior EVP & Chief Financial Officer 908-306-8933 | fcavallaro@peapackprivate.com John P. Babcock Senior EVP & President, Peapack Private Wealth Management 908-719-3301 | jbabcock@peapackprivate.com Matthew P. Remo SVP | Managing Principal, Treasurer & Head of Corporate Finance 908-872-9899 | mremo@peapackprivate.com 500 Hills Drive, Suite 300 | Bedminster, NJ 07921 | 908-234-0700 | peapackprivate.com 28