Performance Management
|
Oct. 27, 2026 |
| Ocean Park Domestic ETF |
|
| Prospectus [Line Items] |
|
| Bar Chart and Performance Table [Heading] |
Performance:
|
| Performance Narrative [Text Block] |
The bar chart and performance table below show the variability of the Fund’s returns, which is some indication of the risks
of investing in the Fund. The bar chart shows performance of shares of the Fund for each full calendar year since the Fund’s inception.
The performance table compares the performance of the share class of the Fund over time to the performance of a broad-based securities
market index. You should be aware that the Fund’s past performance (before and after taxes) may not be an indication of how the
Fund will perform in the future. Updated performance information is available at no cost by calling 1-866-738-4363 or visiting https://www.oceanparketfs.com.
|
| Performance Past Does Not Indicate Future [Text] |
You should be aware that the Fund’s past performance (before and after taxes) may not be an indication of how the
Fund will perform in the future.
|
| Performance Information Illustrates Variability of Returns [Text] |
The bar chart and performance table below show the variability of the Fund’s returns, which is some indication of the risks
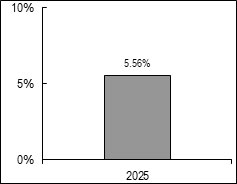
of investing in the Fund. The bar chart shows performance of shares of the Fund for each full calendar year since the Fund’s inception.
|
| Bar Chart [Heading] |
Performance
Bar Chart
Calendar Years Ended December 31
|
| Bar Chart [Table] |
|
| Bar Chart Closing [Text Block] |
| Best
Quarter: |
9/30/2025 |
7.03% |
| Worst
Quarter: |
3/31/2025 |
(5.04)% |
The
total return for Fund shares from January 1, 2026 to September 30, 2026 was 12.11%
|
| Year to Date Return, Label [Optional Text] |
The
total return for Fund shares
|
| Bar Chart, Year to Date Return |
12.11%
|
| Bar Chart, Year to Date Return, Date |
Sep. 30, 2026
|
| Highest Quarterly Return, Label [Optional Text] |
Best
Quarter:
|
| Highest Quarterly Return |
7.03%
|
| Highest Quarterly Return, Date |
Sep. 30, 2025
|
| Lowest Quarterly Return, Label [Optional Text] |
Worst
Quarter:
|
| Lowest Quarterly Return |
(5.04%)
|
| Lowest Quarterly Return, Date |
Mar. 31, 2025
|
| Performance Table Heading |
Performance
Table
Average
Annual Total Returns
(For
periods ended December 31, 2025)
|
| Performance Table Uses Highest Federal Rate |
After-tax
returns were calculated using the historical highest individual federal marginal income tax rates and do not reflect the impact of state
and local taxes.
|
| Performance Table Not Relevant to Tax Deferred |
Actual after-tax returns depend on an investor’s tax situation and may differ from those shown, and after-tax
returns shown are not relevant to investors who hold shares of the Fund through tax-deferred arrangements, such as 401(k) plans or Individual
Retirement Accounts (IRAs).
|
| Performance [Table] |
| |
One
Year |
Since
Inception
of the Fund |
| Return
before taxes |
5.56% |
7.61% |
| Return
after taxes on distributions |
5.38% |
7.42% |
| Return
after taxes on distributions and sale of Fund shares |
3.41% |
5.80% |
Morningstar
US Market TR USD*
(reflects no deduction for fees, expense or taxes) |
17.35% |
15.71% |
| * | Morningstar
U.S. Market Index: The index measures the performance of US securities and targets 97% market capitalization coverage of the investable
universe. It is a diversified broad market index. |
|
| Index No Deduction for Fees, Expenses, or Taxes [Text] |
reflects no deduction for fees, expense or taxes
|
| Performance Table Closing [Text Block] |
After-tax
returns were calculated using the historical highest individual federal marginal income tax rates and do not reflect the impact of state
and local taxes. Actual after-tax returns depend on an investor’s tax situation and may differ from those shown, and after-tax
returns shown are not relevant to investors who hold shares of the Fund through tax-deferred arrangements, such as 401(k) plans or Individual
Retirement Accounts (IRAs).
|
| Performance Availability Website Address [Text] |
https://www.oceanparketfs.com
|
| Performance Availability Phone [Text] |
1-866-738-4363
|
| Ocean Park International ETF |
|
| Prospectus [Line Items] |
|
| Bar Chart and Performance Table [Heading] |
Performance:
|
| Performance Narrative [Text Block] |
The bar chart and performance table below show the variability of the Fund’s returns, which is some indication of the risks
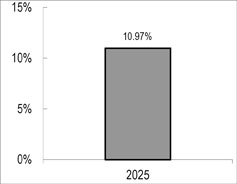
of investing in the Fund. The bar chart shows performance of shares of the Fund for each full calendar year since the Fund’s inception.
The performance table compares the performance of the share class of the Fund over time to the performance of a broad-based securities
market index. You should be aware that the Fund’s past performance (before and after taxes) may not be an indication of how the
Fund will perform in the future. Updated performance information is available at no cost by calling 1-866-738-4363 or visiting https://www.oceanparketfs.com.
|
| Performance Past Does Not Indicate Future [Text] |
You should be aware that the Fund’s past performance (before and after taxes) may not be an indication of how the
Fund will perform in the future.
|
| Performance Information Illustrates Variability of Returns [Text] |
The bar chart and performance table below show the variability of the Fund’s returns, which is some indication of the risks
of investing in the Fund. The bar chart shows performance of shares of the Fund for each full calendar year since the Fund’s inception.
|
| Bar Chart [Heading] |
Performance
Bar Chart
Calendar
Years Ended December 31
|
| Bar Chart [Table] |
|
| Bar Chart Closing [Text Block] |
| Best
Quarter: |
9/30/2025 |
6.90% |
| Worst
Quarter: |
3/31/2025 |
(2.52)% |
The
total return for Fund shares from January 1, 2026 to September 30, 2026 was 9.84%
|
| Year to Date Return, Label [Optional Text] |
The
total return for Fund shares
|
| Bar Chart, Year to Date Return |
9.84%
|
| Bar Chart, Year to Date Return, Date |
Sep. 30, 2026
|
| Highest Quarterly Return, Label [Optional Text] |
Best
Quarter:
|
| Highest Quarterly Return |
6.90%
|
| Highest Quarterly Return, Date |
Sep. 30, 2025
|
| Lowest Quarterly Return, Label [Optional Text] |
Worst
Quarter:
|
| Lowest Quarterly Return |
(2.52%)
|
| Lowest Quarterly Return, Date |
Mar. 31, 2025
|
| Performance Table Heading |
Performance
Table
Average
Annual Total Returns
(For
periods ended December 31, 2025)
|
| Performance Table Uses Highest Federal Rate |
After-tax
returns were calculated using the historical highest individual federal marginal income tax rates and do not reflect the impact of state
and local taxes.
|
| Performance Table Not Relevant to Tax Deferred |
Actual after-tax returns depend on an investor’s tax situation and may differ from those shown, and after-tax
returns shown are not relevant to investors who hold shares of the Fund through tax-deferred arrangements, such as 401(k) plans or Individual
Retirement Accounts (IRAs).
|
| Performance [Table] |
| |
One
Year |
Since
Inception
of the Fund |
| Return
before taxes |
10.97% |
5.14% |
| Return
after taxes on distributions |
10.18% |
4.15% |
| Return
after taxes on distributions and sale of Fund shares |
6.90% |
3.67% |
Morningstar
Global Markets ex US NR Index*
(reflects no deduction for fees, expense or taxes) |
31.59% |
18.48% |
| * | Morningstar
Global Markets ex-US NR Index: The index measures the performance of the stocks located in the developed and emerging countries across
the world (excluding the United States) as defined by Morningstar. Stocks in the index are weighted by their float capital, which removes
corporate cross ownership, government holdings and other locked-in shares. |
|
| Index No Deduction for Fees, Expenses, or Taxes [Text] |
reflects no deduction for fees, expense or taxes
|
| Performance Table Closing [Text Block] |
After-tax
returns were calculated using the historical highest individual federal marginal income tax rates and do not reflect the impact of state
and local taxes. Actual after-tax returns depend on an investor’s tax situation and may differ from those shown, and after-tax
returns shown are not relevant to investors who hold shares of the Fund through tax-deferred arrangements, such as 401(k) plans or Individual
Retirement Accounts (IRAs).
|
| Performance Availability Website Address [Text] |
https://www.oceanparketfs.com
|
| Performance Availability Phone [Text] |
1-866-738-4363
|
| Ocean Park Diversified Income ETF |
|
| Prospectus [Line Items] |
|
| Bar Chart and Performance Table [Heading] |
Performance:
|
| Performance Narrative [Text Block] |
The bar chart and performance table below show the variability of the Fund’s returns, which is some indication of the risks
of investing in the Fund. The bar chart shows performance of shares of the Fund for each full calendar year since the Fund’s inception.
The performance table compares the performance of the share class of the Fund over time to the performance of a broad based securities
market index. You should be aware that the Fund’s past performance (before and after taxes) may not be an indication of how the
Fund will perform in the future. Updated performance information is available at no cost by calling 1 866 738 4363 or visiting https://www.oceanparketfs.com.
|
| Performance Past Does Not Indicate Future [Text] |
You should be aware that the Fund’s past performance (before and after taxes) may not be an indication of how the
Fund will perform in the future.
|
| Performance Information Illustrates Variability of Returns [Text] |
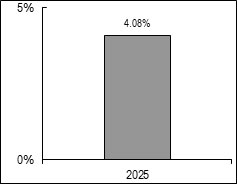
The bar chart and performance table below show the variability of the Fund’s returns, which is some indication of the risks
of investing in the Fund.
|
| Bar Chart [Heading] |
Performance
Bar Chart
Calendar
Years Ended December 31
|
| Bar Chart [Table] |
|
| Bar Chart Closing [Text Block] |
| Best
Quarter: |
9/30/2025 |
3.15% |
| Worst
Quarter: |
3/31/2025 |
(0.80)% |
The
total return for Fund shares from January 1, 2026 to September 30, 2026 was 0.25%
|
| Year to Date Return, Label [Optional Text] |
The
total return for Fund shares
|
| Bar Chart, Year to Date Return |
0.25%
|
| Bar Chart, Year to Date Return, Date |
Sep. 30, 2026
|
| Highest Quarterly Return, Label [Optional Text] |
Best
Quarter:
|
| Highest Quarterly Return |
3.15%
|
| Highest Quarterly Return, Date |
Sep. 30, 2025
|
| Lowest Quarterly Return, Label [Optional Text] |
Worst
Quarter:
|
| Lowest Quarterly Return |
(0.80%)
|
| Lowest Quarterly Return, Date |
Mar. 31, 2025
|
| Performance Table Heading |
Performance
Table
Average
Annual Total Returns
(For
periods ended December 31, 2025)
|
| Performance Table Uses Highest Federal Rate |
After-tax
returns were calculated using the historical highest individual federal marginal income tax rates and do not reflect the impact of state
and local taxes.
|
| Performance Table Not Relevant to Tax Deferred |
Actual after-tax returns depend on an investor’s tax situation and may differ from those shown, and after-tax
returns shown are not relevant to investors who hold shares of the Fund through tax-deferred arrangements, such as 401(k) plans or Individual
Retirement Accounts (IRAs).
|
| Performance [Table] |
| |
One
Year |
Since
Inception
of the Fund |
| Return
before taxes |
4.08% |
5.00% |
| Return
after taxes on distributions |
2.40% |
3.17% |
| Return
after taxes on distributions and sale of Fund shares |
2.42% |
3.06% |
Bloomberg
U.S. Aggregate Bond Index*
(reflects no deduction for fees, expense or taxes) |
7.30% |
5.72% |
| * | The
Bloomberg U.S. Aggregate Bond Index, an unmanaged, broad based market capitalization weighted index, has been selected as the Fund’s
benchmark index. The Bloomberg U.S. Aggregate Bond Index is commonly used as a benchmark by both passive and active investors to measure
portfolio performance relative to the U.S. dollar denominated investment grade fixed-rate taxable bond market. The index includes Treasuries,
government-related and corporate securities, MBS (agency fixed-rate pass-throughs), ABS and CMBS (agency and non-agency). The index does
not take into account charges, fees and other expenses, and investors cannot invest directly in an index. |
|
| Performance Table Closing [Text Block] |
After-tax
returns were calculated using the historical highest individual federal marginal income tax rates and do not reflect the impact of state
and local taxes. Actual after-tax returns depend on an investor’s tax situation and may differ from those shown, and after-tax
returns shown are not relevant to investors who hold shares of the Fund through tax-deferred arrangements, such as 401(k) plans or Individual
Retirement Accounts (IRAs).
|
| Performance Availability Website Address [Text] |
https://www.oceanparketfs.com
|
| Performance Availability Phone [Text] |
1 866 738 4363
|
| Ocean Park High Income ETF |
|
| Prospectus [Line Items] |
|
| Bar Chart and Performance Table [Heading] |
Performance:
|
| Performance Narrative [Text Block] |
The bar chart and performance table below show the variability of the Fund’s returns, which is some indication of the risks
of investing in the Fund. The bar chart shows performance of shares of the Fund for each full calendar year since the Fund’s inception.
The performance table compares the performance of the share class of the Fund over time to the performance of a broad based securities
market index. You should be aware that the Fund’s past performance (before and after taxes) may not be an indication of how the
Fund will perform in the future. Updated performance information is available at no cost by calling 1 866 738 4363 or visiting https://www.oceanparketfs.com.
|
| Performance Past Does Not Indicate Future [Text] |
You should be aware that the Fund’s past performance (before and after taxes) may not be an indication of how the
Fund will perform in the future.
|
| Performance Information Illustrates Variability of Returns [Text] |
The bar chart and performance table below show the variability of the Fund’s returns, which is some indication of the risks
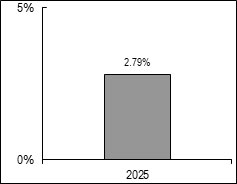
of investing in the Fund. The bar chart shows performance of shares of the Fund for each full calendar year since the Fund’s inception.
|
| Bar Chart [Heading] |
Performance
Bar Chart
Calendar
Years Ended December 31
|
| Bar Chart [Table] |
|
| Bar Chart Closing [Text Block] |
| Best
Quarter: |
9/30/2025 |
2.61% |
| Worst
Quarter: |
3/31/2025 |
(0.78)% |
The
total return for Fund shares from January 1, 2026 to September 30, 2026 was (1.54)%
|
| Year to Date Return, Label [Optional Text] |
The
total return for Fund shares
|
| Bar Chart, Year to Date Return |
(1.54%)
|
| Bar Chart, Year to Date Return, Date |
Sep. 30, 2026
|
| Highest Quarterly Return, Label [Optional Text] |
Best
Quarter:
|
| Highest Quarterly Return |
2.61%
|
| Highest Quarterly Return, Date |
Sep. 30, 2025
|
| Lowest Quarterly Return, Label [Optional Text] |
Worst
Quarter:
|
| Lowest Quarterly Return |
(0.78%)
|
| Lowest Quarterly Return, Date |
Mar. 31, 2025
|
| Performance Table Heading |
Performance
Table
Average
Annual Total Returns
(For
periods ended December 31, 2025)
|
| Performance Table Uses Highest Federal Rate |
After-tax
returns were calculated using the historical highest individual federal marginal income tax rates and do not reflect the impact of state
and local taxes.
|
| Performance Table Not Relevant to Tax Deferred |
Actual after-tax returns depend on an investor’s tax situation and may differ from those shown, and after-tax
returns shown are not relevant to investors who hold shares of the Fund through tax-deferred arrangements, such as 401(k) plans or Individual
Retirement Accounts (IRAs).
|
| Performance [Table] |
| |
One
Year |
Since
Inception
of the Fund |
| Return
before taxes |
2.79% |
4.15% |
| Return
after taxes on distributions |
0.33% |
1.70% |
| Return
after taxes on distributions and sale of Fund shares |
1.68% |
2.16% |
Bloomberg U.S. Aggregate Bond Index*
(reflects no deduction for fees, expense or taxes) |
7.30% |
5.72% |
| * | The
Bloomberg U.S. Aggregate Bond Index, an unmanaged, broad-based market capitalization weighted index, has been selected as the Fund’s
benchmark index. The Bloomberg U.S. Aggregate Bond Index is commonly used as a benchmark by both passive and active investors to measure
portfolio performance relative to the U.S. dollar-denominated investment grade fixed-rate taxable bond market. The index includes Treasuries,
government-related and corporate securities, MBS (agency fixed-rate pass-throughs), ABS and CMBS (agency and non-agency). The index does
not take into account charges, fees and other expenses, and investors cannot invest directly in an index. |
|
| Index No Deduction for Fees, Expenses, or Taxes [Text] |
reflects no deduction for fees, expense or taxes
|
| Performance Table Closing [Text Block] |
After-tax
returns were calculated using the historical highest individual federal marginal income tax rates and do not reflect the impact of state
and local taxes. Actual after-tax returns depend on an investor’s tax situation and may differ from those shown, and after-tax
returns shown are not relevant to investors who hold shares of the Fund through tax-deferred arrangements, such as 401(k) plans or Individual
Retirement Accounts (IRAs).
|
| Performance Availability Website Address [Text] |
https://www.oceanparketfs.com
|
| Performance Availability Phone [Text] |
1 866 738 4363
|