earnings presentation • Third Quarter 2026 Exhibit 99.2
forward looking statements disclosure 2 Certain statements in this presentation constitute “forward-looking statements” within the meaning of the Private Securities Litigation Reform Act of 1995, Section 27A of the Securities Act of 1933, as amended, and Rule 175 promulgated thereunder, and Section 21E of the Securities Exchange Act of 1934, as amended, and Rule 3b-6 promulgated thereunder, which statements involve inherent risks and uncertainties. Examples of forward-looking statements include, but are not limited to, statements regarding the operations of First Financial Bancorp. and its subsidiaries (the “Company”, “First Financial”, “we”, “us”, or “our”), such as (i) our future operating or financial performance, including revenues, income or loss and earnings per share, (ii) future common stock dividends, (iii) our capital structure, including future capital levels, (iv) our plans, objectives and strategies, and (v) the uncertainties and assumptions that underlie our forward-looking statements. Such statements are often characterized by the use of qualified words (and their derivatives) such as “may,” “will,” “anticipate,” “could,” “should,” “would,” “believe,” “contemplate,” “expect,” “estimate,” “continue,” “plan,” “project” and “intend,” as well as words of similar meaning or other statements concerning opinions or judgment of First Financial or their respective management about future events. Forward-looking statements are based on assumptions as of the time they are made and are subject to risks, uncertainties and other factors that are difficult to predict with regard to timing, extent, likelihood and degree of occurrence, which could cause actual results to differ materially from anticipated results expressed or implied by such forward-looking statements. Such risks, uncertainties and assumptions include, among others, the following: • economic, market, liquidity, credit, interest rate, operational and technological risks associated with First Financial’s business; • future credit quality and performance, including our expectations regarding future loan losses and our allowance for credit losses; • the effect of and changes in policies and laws or regulatory agencies, including the Dodd-Frank Wall Street Reform and Consumer Protection Act and other legislation and regulation relating to the banking industry; • management’s ability to effectively execute its business plans; • pursuit of mergers and acquisitions, including costs or difficulties related to any acquisitions and/or integrations of any acquired companies; • the possibility that any of the anticipated benefits of First Financial’s prior, in process, or contemplated acquisitions will not be realized or will not be realized within the expected time period; • the possibility that any of acquisitions that have not yet been consummated, such as the acquisition of Finward Bancorp, is not consummated for any reason, including the failure to satisfy any closing conditions, termination of a merger agreement by either party, or the failure to receive any required regulatory or shareholder approvals; • the effect of changes in accounting policies and practices; • changes in consumer spending, borrowing and saving and changes in unemployment; • changes in customers’ performance and creditworthiness; • the costs and effects of litigation and of unexpected or adverse outcomes in such litigation; • current and future economic and market conditions, including the effects of changes in housing prices, fluctuations in unemployment rates, U.S. fiscal debt, budget and tax matters, geopolitical matters, trade and tariff policies, and any slowdown in global economic growth; • our capital and liquidity requirements (including under regulatory capital standards, such as the Basel III capital standards) and our ability to generate capital internally or raise capital on favorable terms; • financial services reform and other current, pending or future legislation or regulation that could have a negative effect on our revenue and businesses, including the Dodd-Frank Act and other legislation and regulation relating to bank products and services; • the effect of the current interest rate environment or changes in interest rates or in the level or composition of our assets or liabilities on our net interest income, net interest margin and our mortgage originations, mortgage servicing rights and mortgage loans held for sale; the effect of a fall in stock market prices on our brokerage, asset and wealth management businesses; • a failure in or breach of our operational or security systems or infrastructure, or those of our third-party vendors or other service providers, including as a result of cyber attacks; • the effect of changes in the level of checking or savings account deposits on our funding costs and net interest margin; and • our ability to develop and execute effective business plans and strategies.
forward looking statements disclosure 3 These factors are not necessarily all of the factors that could cause First Financial’s actual results, performance or achievements to differ materially from those expressed in or implied by any of the forward-looking statements. Other factors, including unknown or unpredictable factors, also could harm the results of First Financial. Although First Financial believes that its expectations with respect to forward-looking statements are based upon reasonable assumptions within the bounds of its existing knowledge of its business and operations, there can be no assurance that actual results of First Financial will not differ materially from any projected future results expressed or implied by such forward-looking statements. Additional factors that could cause results to differ materially from those described above can be found in First Financial’s most recent annual report on Form 10-K for the fiscal year ended December 31, 2025, quarterly reports on Form 10-Q, and other documents subsequently filed by First Financial with the Securities Exchange Commission (“SEC”). Investors are cautioned not to rely too heavily on any such forward-looking statements. First Financial urges you to consider all of these risks, uncertainties and other factors carefully in evaluating all such forward-looking statements made by First Financial. Forward-looking statements speak only as of the date they are made, and First Financial undertakes no obligation to update or clarify these forward-looking statements, whether as a result of new information, future events or otherwise, except to the extent required by applicable law. Non-GAAP Financial Measures This presentation contains certain financial information determined by methods other than in accordance with accounting principles generally accepted in the United States (GAAP). Such non-GAAP financial information should be considered supplemental to, and not as a substitute for, or superior to, financial measures calculated in accordance with GAAP. However, we believe that non-GAAP reporting provides meaningful information and therefore we use it to supplement our GAAP information. We have chosen to provide this supplemental information to investors, analysts and other interested parties to enable them to perform additional analyses of operating results, to illustrate the results of operations giving effect to the non-GAAP adjustments and to provide an additional measure of performance. We believe this information is helpful in understanding the results of operations separate and apart from items that may, or could, have a disproportional positive or negative impact in any given period. For a reconciliation of the differences between the non-GAAP financial measures and the most comparable GAAP measures, please refer to the reconciliation tables in the appendix at the end of this presentation.
forward looking statements disclosure 4 No Offer or Solicitation This presentation does not constitute an offer to sell or the solicitation of an offer to buy any securities or the solicitation of any vote or approval with respect to the proposed transaction between First Financial and Finward. No offer of securities shall be made except by means of a prospectus meeting the requirements of the Securities Act of 1933, as amended, and no offer to sell or solicitation of an offer to buy shall be made in any jurisdiction in which such offer, solicitation or sale would be unlawful prior to registration or qualification under the securities laws of such jurisdiction. Important Additional Information and Where to Find It In connection with the proposed transaction, First Financial filed a Registration Statement on Form S-4 (the “Registration Statement”) with the SEC to register the shares of First Financial capital stock to be issued in connection with the proposed transaction, which became effective with the SEC on September 28, 2026. The Registration Statement includes a proxy statement of Finward and a prospectus of First Financial (the “Proxy Statement/Prospectus”), and First Financial and Finward may file with the SEC other relevant documents concerning the proposed transaction. BEFORE MAKING ANY VOTING OR INVESTMENT DECISION, INVESTORS AND SHAREHOLDERS ARE URGED TO READ THE REGISTRATION STATEMENT AND PROXY STATEMENT/PROSPECTUS REGARDING THE PROPOSED TRANSACTION AND ANY OTHER RELEVANT DOCUMENTS FILED WITH THE SEC, AS WELL AS ANY AMENDMENTS OR SUPPLEMENTS TO THOSE DOCUMENTS, BECAUSE THEY WILL CONTAIN IMPORTANT INFORMATION ABOUT FIRST FINANCIAL, FINWARD AND THE PROPOSED TRANSACTION AND RELATED MATTERS. A copy of the Registration Statement, Proxy Statement/Prospectus, as well as other filings containing information about First Financial and Finward, may be obtained, free of charge, at the SEC’s website (www.sec.gov). Copies of documents filed with the SEC by First Financial will be made available free of charge in the "Investor Relations" section of First Financial's website, https://www.bankatfirst.com/about/investor-relations.html. Copies of documents filed with the SEC by Finward will be made available free of charge in the "Investor Relations" section of Finward's website, https://www.investorrelations.ibankpeoples.com. The information on First Financial’s and Finward’s websites is not, and shall not be deemed to be, a part of this communication or incorporated into other filings either First Financial makes with the SEC. Participants in the Solicitation First Financial, Finward and certain of their respective directors, executive officers, management and employees may be deemed to be participants in the solicitation of proxies in respect of the proposed transaction between First Financial and Finward. Information concerning First Financial’s participants is set forth in the Proxy Statement, dated April 16, 2026, for First Financial’s 2026 annual meeting of stockholders as filed with the SEC on Schedule 14A. Information concerning Finward’s participants is set forth in the Proxy Statement, dated April 3, 2026, for Finward’s 2026 annual meeting of stockholders as filed with the SEC on Schedule 14A. Additional information regarding the participants in the solicitation of proxies in respect of the proposed transaction and interests of participants of First Financial and Finward in the solicitation of proxies in respect of the proposed transaction is included in the Registration Statement and Proxy Statement/Prospectus to be filed with the SEC. Free copies of these documents, when available, may be obtained as described in the preceding paragraph.
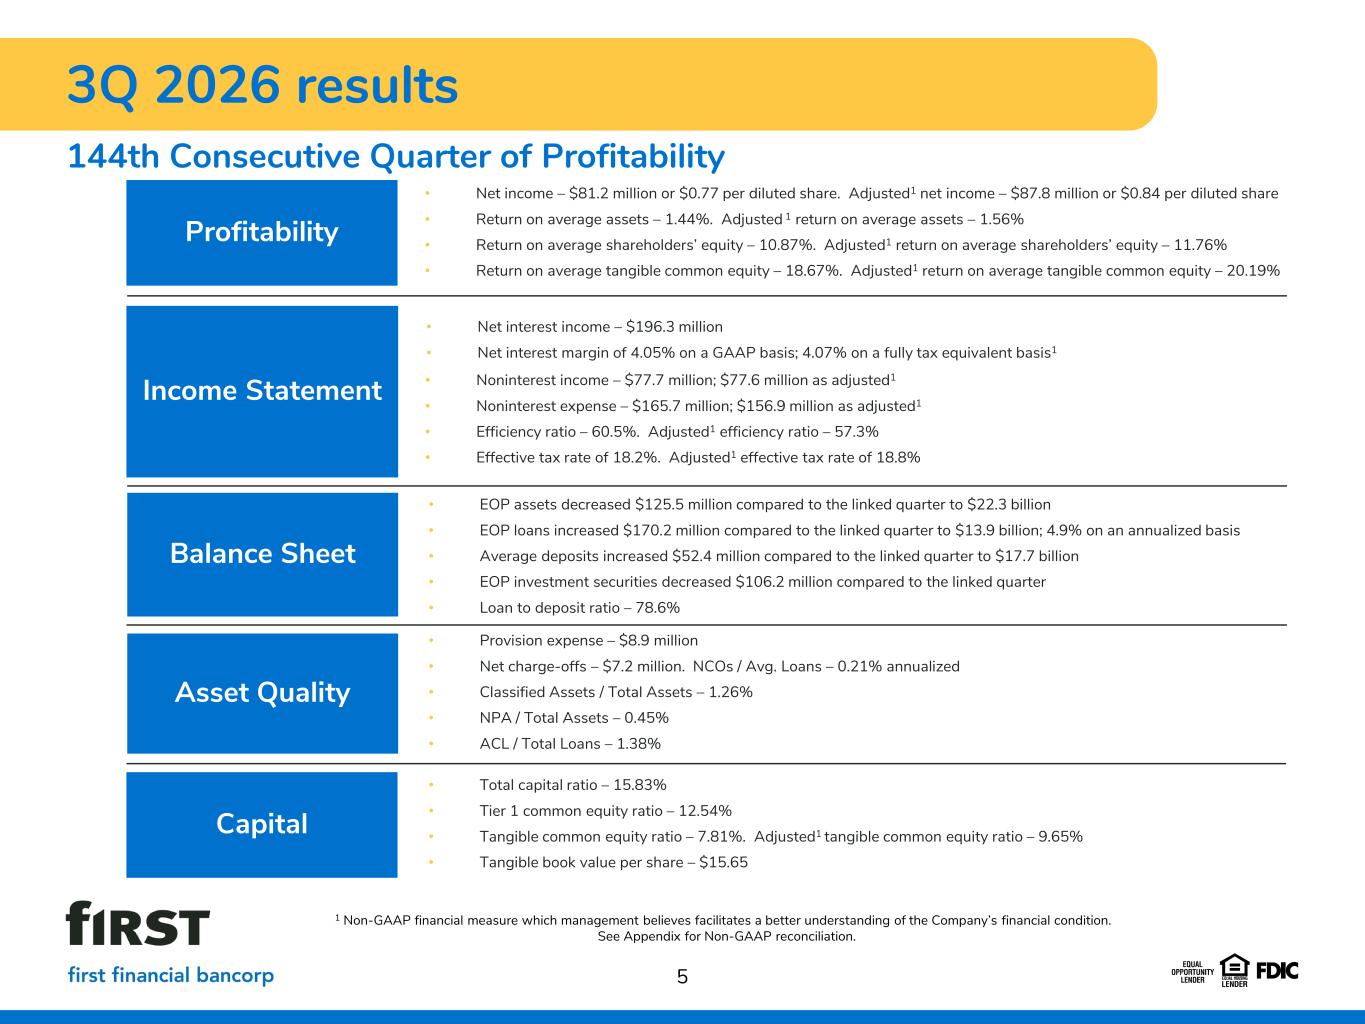
3Q 2026 results 144th Consecutive Quarter of Profitability 5 • EOP assets decreased $125.5 million compared to the linked quarter to $22.3 billion • EOP loans increased $170.2 million compared to the linked quarter to $13.9 billion; 4.9% on an annualized basis • Average deposits increased $52.4 million compared to the linked quarter to $17.7 billion • EOP investment securities decreased $106.2 million compared to the linked quarter • Loan to deposit ratio – 78.6% Balance Sheet Profitability Asset Quality Income Statement Capital • Noninterest income – $77.7 million; $77.6 million as adjusted1 • Noninterest expense – $165.7 million; $156.9 million as adjusted1 • Efficiency ratio – 60.5%. Adjusted1 efficiency ratio – 57.3% • Effective tax rate of 18.2%. Adjusted1 effective tax rate of 18.8% • Net interest income – $196.3 million • Net interest margin of 4.05% on a GAAP basis; 4.07% on a fully tax equivalent basis1 • Net income – $81.2 million or $0.77 per diluted share. Adjusted1 net income – $87.8 million or $0.84 per diluted share • Return on average assets – 1.44%. Adjusted 1 return on average assets – 1.56% • Return on average shareholders’ equity – 10.87%. Adjusted1 return on average shareholders’ equity – 11.76% • Return on average tangible common equity – 18.67%. Adjusted1 return on average tangible common equity – 20.19% • Provision expense – $8.9 million • Net charge-offs – $7.2 million. NCOs / Avg. Loans – 0.21% annualized • Classified Assets / Total Assets – 1.26% • NPA / Total Assets – 0.45% • ACL / Total Loans – 1.38% • Total capital ratio – 15.83% • Tier 1 common equity ratio – 12.54% • Tangible common equity ratio – 7.81%. Adjusted1 tangible common equity ratio – 9.65% • Tangible book value per share – $15.65 1 Non-GAAP financial measure which management believes facilitates a better understanding of the Company’s financial condition. See Appendix for Non-GAAP reconciliation.
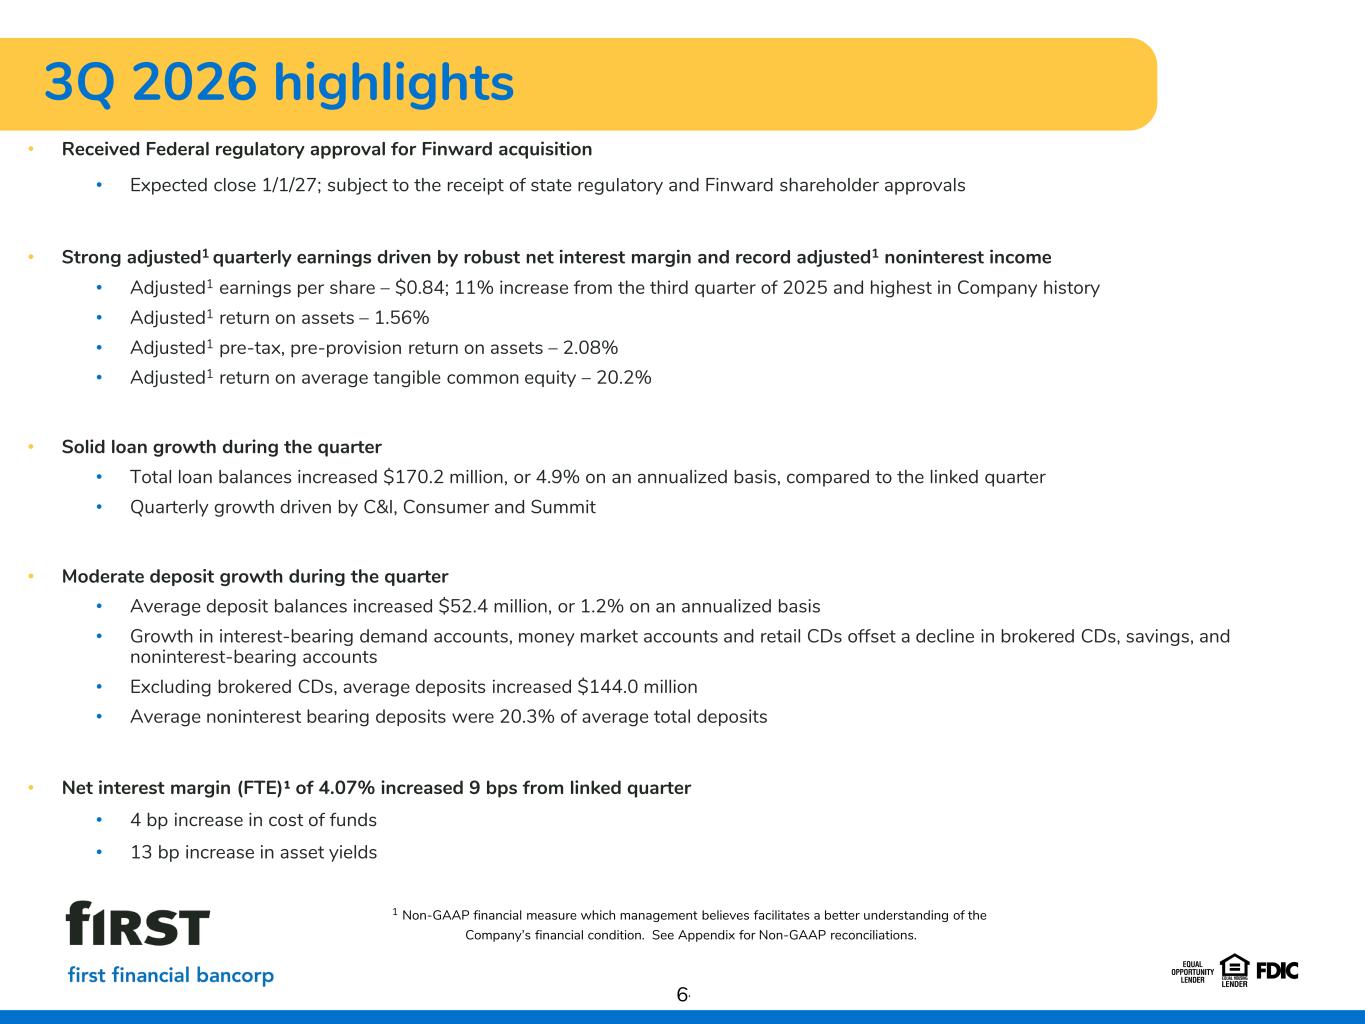
3Q 2026 highlights • Received Federal regulatory approval for Finward acquisition • Expected close 1/1/27; subject to the receipt of state regulatory and Finward shareholder approvals • Strong adjusted1 quarterly earnings driven by robust net interest margin and record adjusted1 noninterest income • Adjusted1 earnings per share – $0.84; 11% increase from the third quarter of 2025 and highest in Company history • Adjusted1 return on assets – 1.56% • Adjusted1 pre-tax, pre-provision return on assets – 2.08% • Adjusted1 return on average tangible common equity – 20.2% • Solid loan growth during the quarter • Total loan balances increased $170.2 million, or 4.9% on an annualized basis, compared to the linked quarter • Quarterly growth driven by C&I, Consumer and Summit • Moderate deposit growth during the quarter • Average deposit balances increased $52.4 million, or 1.2% on an annualized basis • Growth in interest-bearing demand accounts, money market accounts and retail CDs offset a decline in brokered CDs, savings, and noninterest-bearing accounts • Excluding brokered CDs, average deposits increased $144.0 million • Average noninterest bearing deposits were 20.3% of average total deposits • Net interest margin (FTE)¹ of 4.07% increased 9 bps from linked quarter • 4 bp increase in cost of funds • 13 bp increase in asset yields 6 1 Non-GAAP financial measure which management believes facilitates a better understanding of the Company’s financial condition. See Appendix for Non-GAAP reconciliations. .
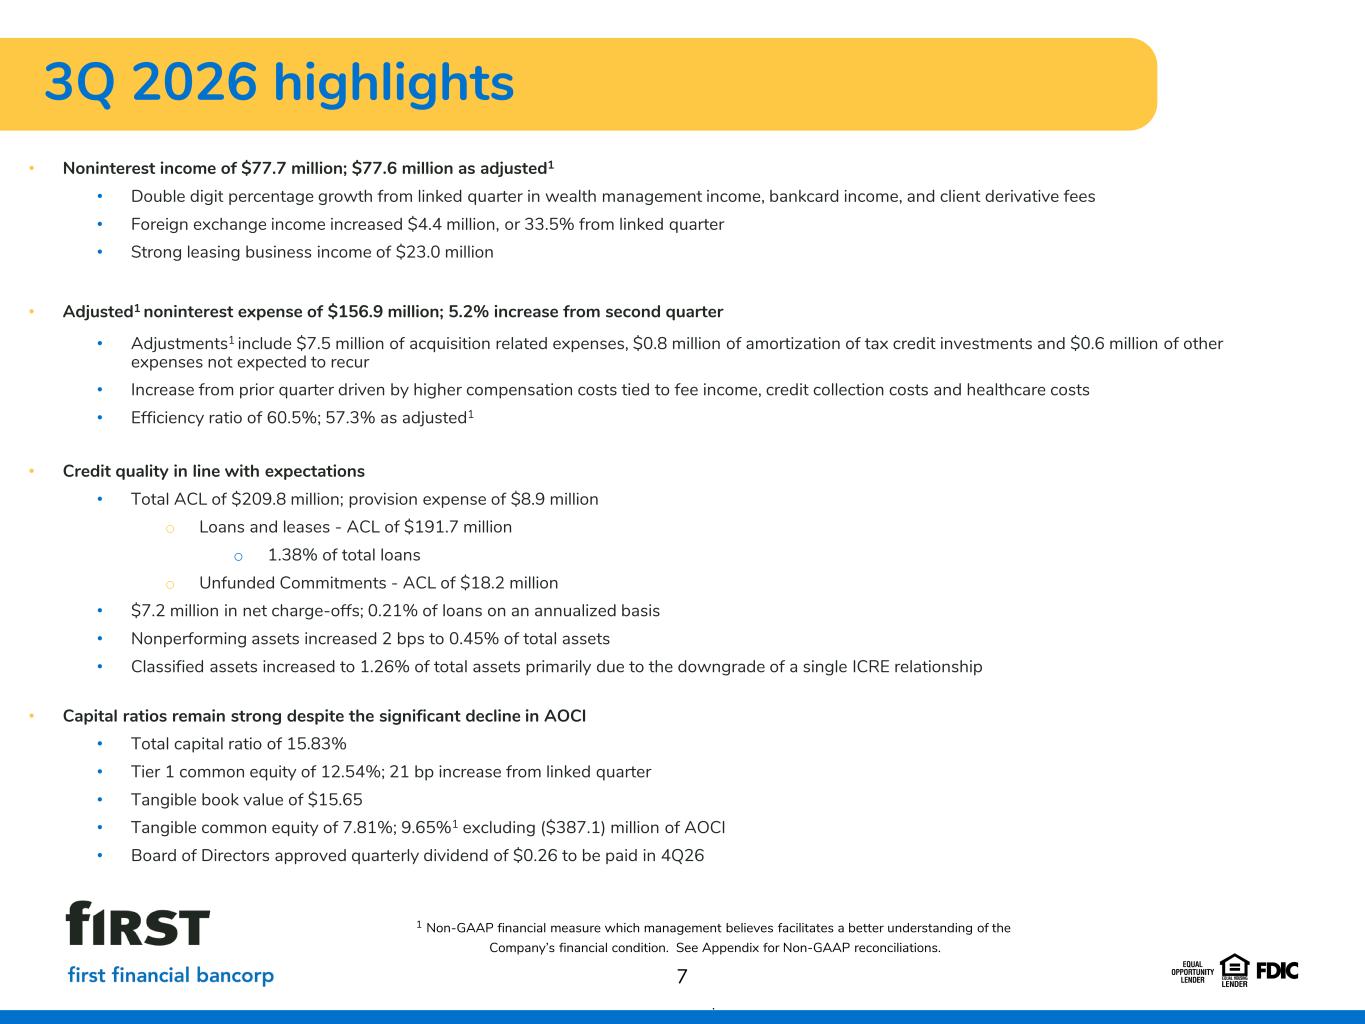
• Noninterest income of $77.7 million; $77.6 million as adjusted1 • Double digit percentage growth from linked quarter in wealth management income, bankcard income, and client derivative fees • Foreign exchange income increased $4.4 million, or 33.5% from linked quarter • Strong leasing business income of $23.0 million • Adjusted1 noninterest expense of $156.9 million; 5.2% increase from second quarter • Adjustments1 include $7.5 million of acquisition related expenses, $0.8 million of amortization of tax credit investments and $0.6 million of other expenses not expected to recur • Increase from prior quarter driven by higher compensation costs tied to fee income, credit collection costs and healthcare costs • Efficiency ratio of 60.5%; 57.3% as adjusted1 • Credit quality in line with expectations • Total ACL of $209.8 million; provision expense of $8.9 million o Loans and leases - ACL of $191.7 million o 1.38% of total loans o Unfunded Commitments - ACL of $18.2 million • $7.2 million in net charge-offs; 0.21% of loans on an annualized basis • Nonperforming assets increased 2 bps to 0.45% of total assets • Classified assets increased to 1.26% of total assets primarily due to the downgrade of a single ICRE relationship • Capital ratios remain strong despite the significant decline in AOCI • Total capital ratio of 15.83% • Tier 1 common equity of 12.54%; 21 bp increase from linked quarter • Tangible book value of $15.65 • Tangible common equity of 7.81%; 9.65%1 excluding ($387.1) million of AOCI • Board of Directors approved quarterly dividend of $0.26 to be paid in 4Q26 3Q 2026 highlights 7 1 Non-GAAP financial measure which management believes facilitates a better understanding of the Company’s financial condition. See Appendix for Non-GAAP reconciliations. .
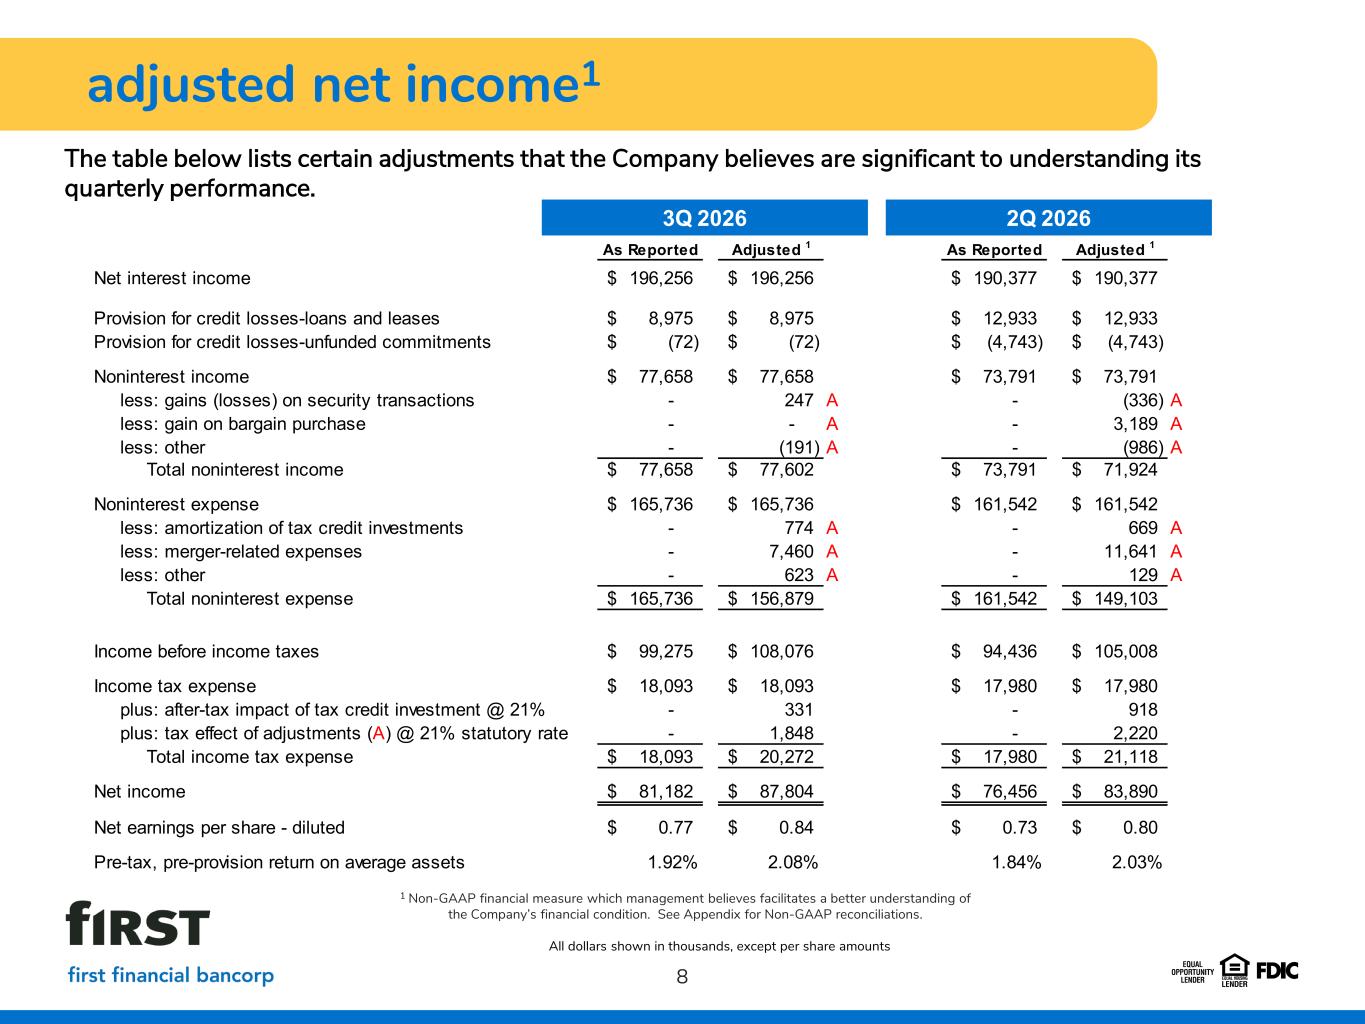
As Reported Adjusted 1 As Reported Adjusted 1 Net interest income 196,256$ 196,256$ 190,377$ 190,377$ Provision for credit losses-loans and leases 8,975$ 8,975$ 12,933$ 12,933$ Provision for credit losses-unfunded commitments (72)$ (72)$ (4,743)$ (4,743)$ Noninterest income 77,658$ 77,658$ 73,791$ 73,791$ less: gains (losses) on security transactions - 247 A - (336) A - - A - 3,189 A less: other - (191) A - (986) A Total noninterest income 77,658$ 77,602$ 73,791$ 71,924$ Noninterest expense 165,736$ 165,736$ 161,542$ 161,542$ less: amortization of tax credit investments - 774 A - 669 A less: merger-related expenses - 7,460 A - 11,641 A less: other - 623 A - 129 A Total noninterest expense 165,736$ 156,879$ 161,542$ 149,103$ Income before income taxes 99,275$ 108,076$ 94,436$ 105,008$ Income tax expense 18,093$ 18,093$ 17,980$ 17,980$ plus: after-tax impact of tax credit investment @ 21% - 331 - 918 plus: tax effect of adjustments (A) @ 21% statutory rate - 1,848 - 2,220 Total income tax expense 18,093$ 20,272$ 17,980$ 21,118$ Net income 81,182$ 87,804$ 76,456$ 83,890$ Net earnings per share - diluted 0.77$ 0.84$ 0.73$ 0.80$ Pre-tax, pre-provision return on average assets 1.92% 2.08% 1.84% 2.03% 3Q 2026 2Q 2026 less: gain on bargain purchase adjusted net income1 8 1 Non-GAAP financial measure which management believes facilitates a better understanding of the Company’s financial condition. See Appendix for Non-GAAP reconciliations. All dollars shown in thousands, except per share amounts The table below lists certain adjustments that the Company believes are significant to understanding its quarterly performance.
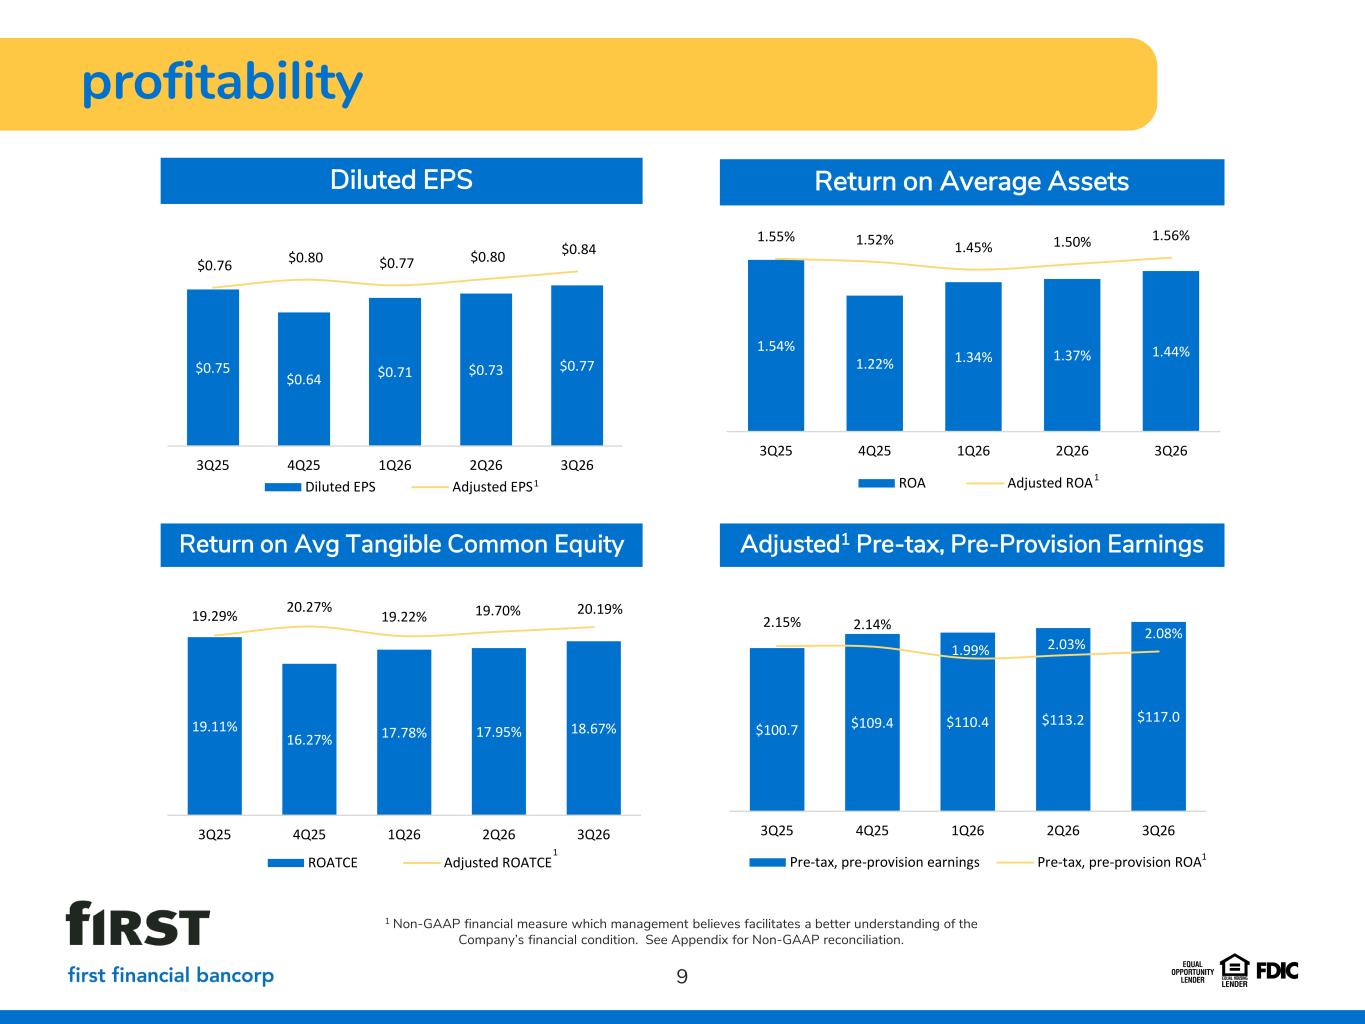
profitability 9 Return on Average Assets Return on Avg Tangible Common Equity Diluted EPS 1 Non-GAAP financial measure which management believes facilitates a better understanding of the Company’s financial condition. See Appendix for Non-GAAP reconciliation. Adjusted1 Pre-tax, Pre-Provision Earnings $0.77$0.73$0.71$0.64 $0.75 $0.84 $0.80 $0.77 $0.80 $0.76 3Q262Q261Q264Q253Q25 Diluted EPS Adjusted EPS1 1.44%1.37%1.34%1.22% 1.54% 1.56%1.50%1.45%1.52%1.55% 3Q262Q261Q264Q253Q25 ROA Adjusted ROA1 18.67%17.95%17.78%16.27% 19.11% 20.19%19.70%19.22% 20.27%19.29% 3Q262Q261Q264Q253Q25 ROATCE Adjusted ROATCE 1 $117.0$113.2$110.4$109.4$100.7 2.08% 2.03%1.99% 2.14%2.15% 3Q262Q261Q264Q253Q25 Pre-tax, pre-provision earnings Pre-tax, pre-provision ROA1
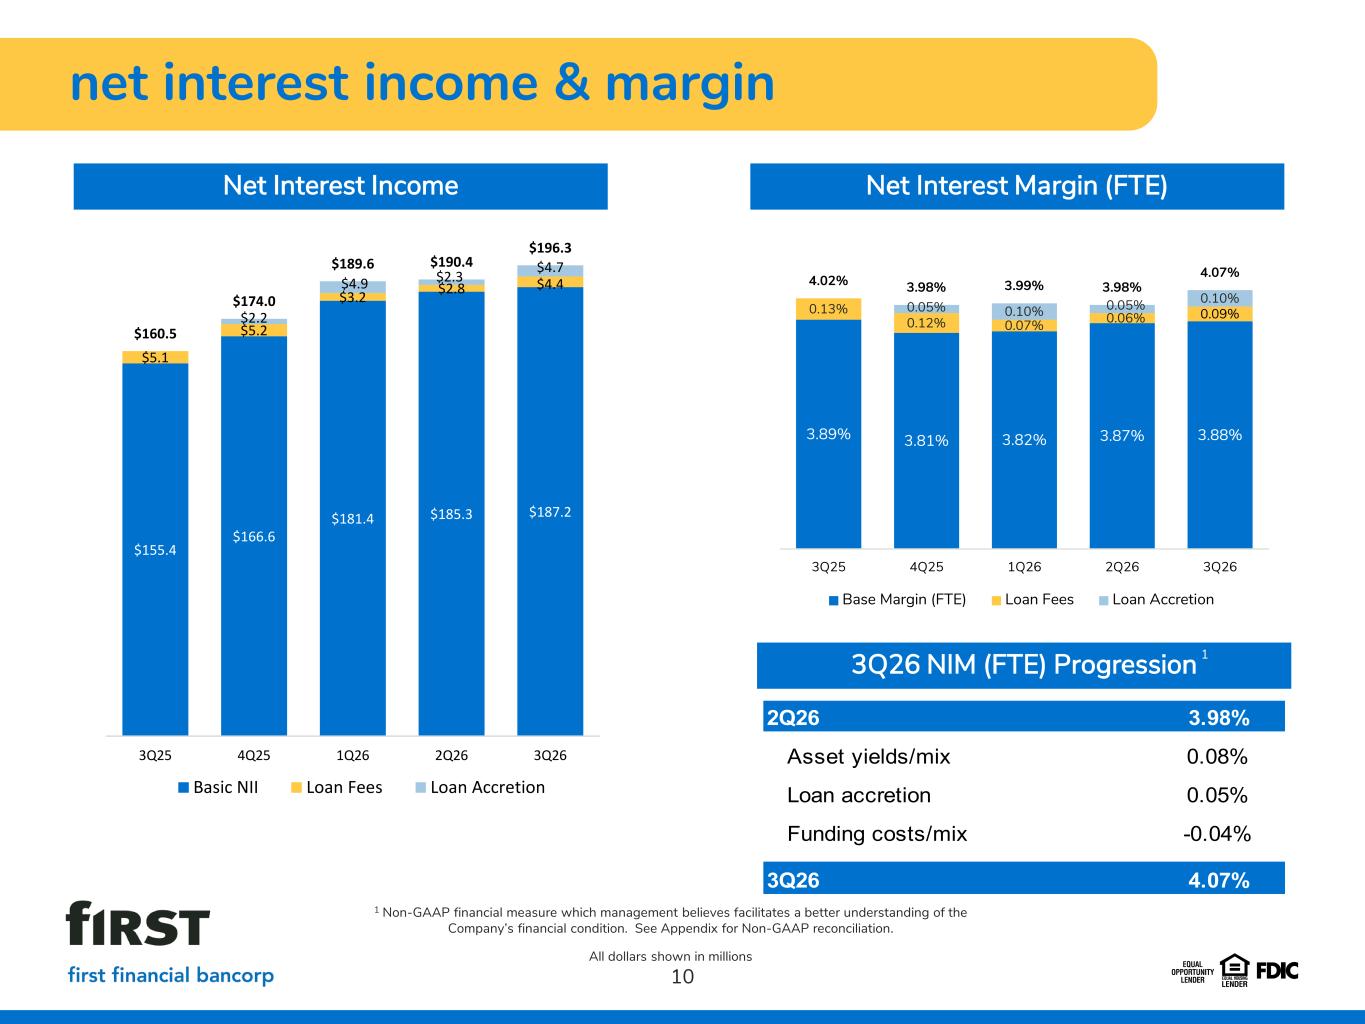
3.88%3.87%3.82%3.81%3.89% 0.09%0.06%0.07%0.12% 0.13% 0.10%0.05%0.10%0.05% 4.07% 3.98%3.99%3.98%4.02% 3Q262Q261Q264Q253Q25 Base Margin (FTE) Loan Fees Loan Accretion net interest income & margin 10 3Q26 NIM (FTE) Progression All dollars shown in millions 1 1 1 Non-GAAP financial measure which management believes facilitates a better understanding of the Company’s financial condition. See Appendix for Non-GAAP reconciliation. 1 Net Interest Income 2Q26 3.98% Asset yields/mix 0.08% Loan accretion 0.05% Funding costs/mix -0.04% 3Q26 4.07% $187.2$185.3$181.4 $166.6 $155.4 $4.4$2.8$3.2 $5.2 $5.1 $4.7$2.3$4.9 $2.2 $196.3 $190.4$189.6 $174.0 $160.5 3Q262Q261Q264Q253Q25 Basic NII Loan Fees Loan Accretion Net Interest Margin (FTE)
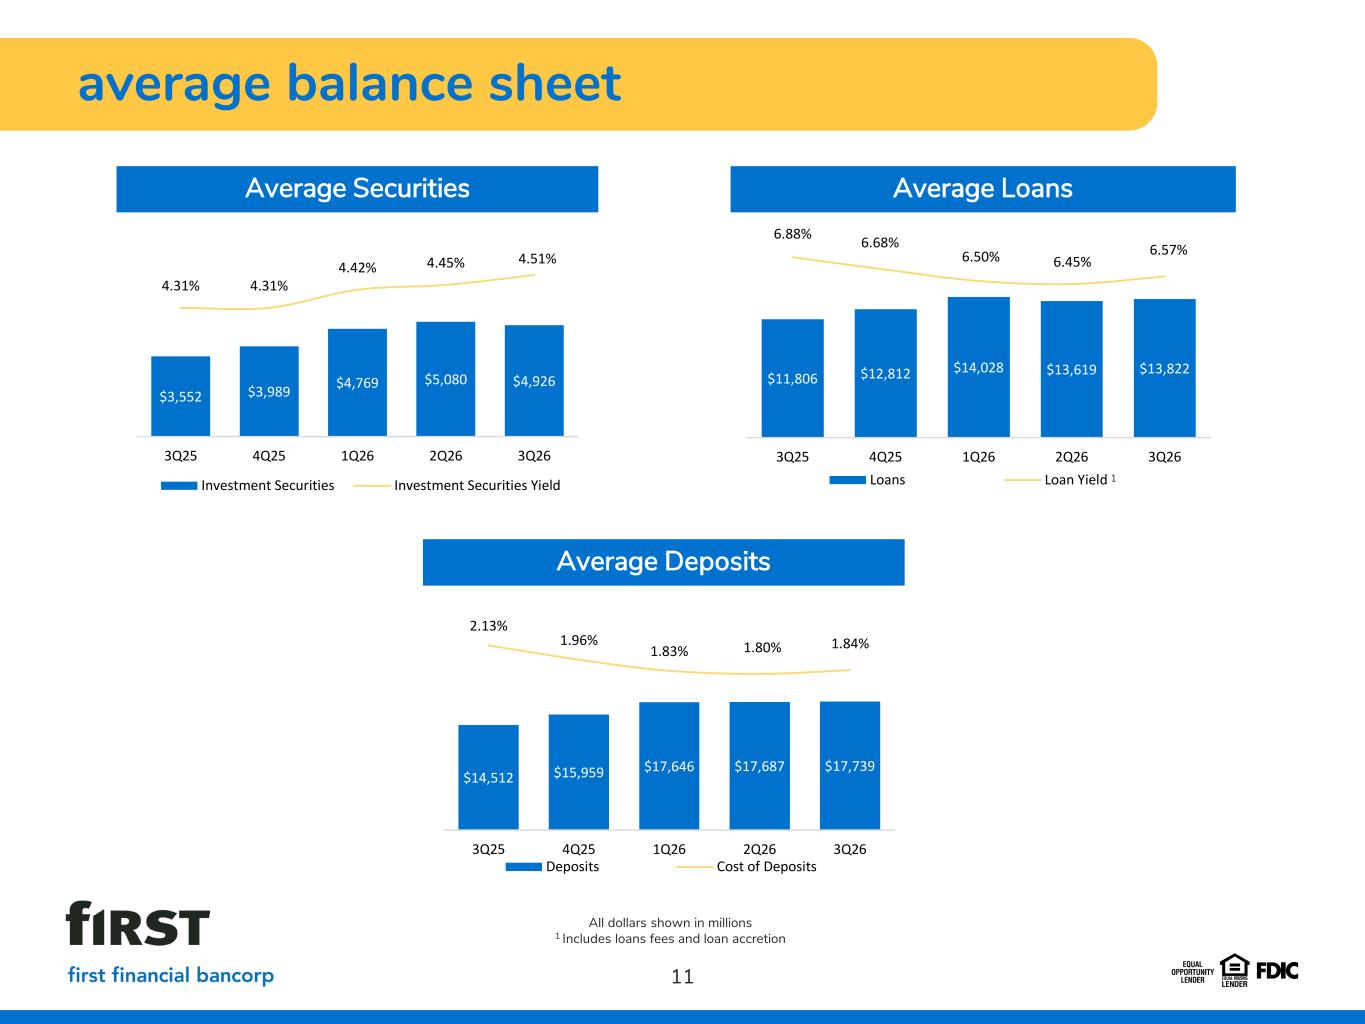
$13,822$13,619$14,028$12,812$11,806 6.57% 6.45%6.50% 6.68%6.88% 3Q262Q261Q264Q253Q25 Loans Loan Yield average balance sheet 11 All dollars shown in millions 1 Includes loans fees and loan accretion Average Securities Average Loans 1 Average Deposits $4,926$5,080$4,769$3,989$3,552 4.51%4.45%4.42% 4.31%4.31% 3Q262Q261Q264Q253Q25 Investment Securities Investment Securities Yield $17,739$17,687$17,646$15,959$14,512 1.84%1.80%1.83% 1.96% 2.13% 3Q262Q261Q264Q253Q25 Deposits Cost of Deposits
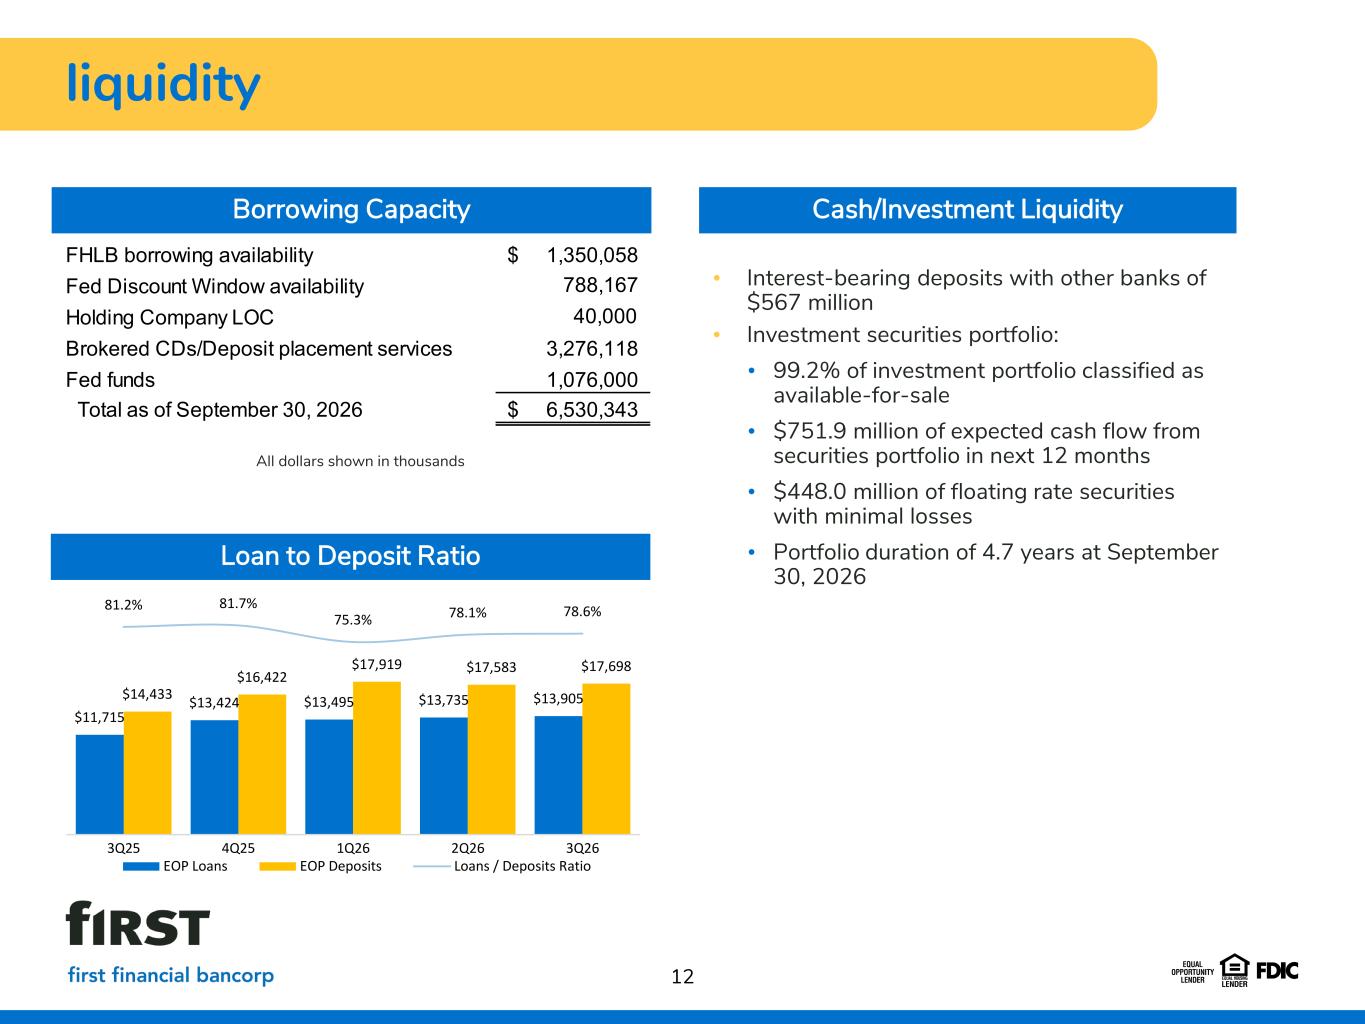
12 Borrowing Capacity • Interest-bearing deposits with other banks of $567 million • Investment securities portfolio: • 99.2% of investment portfolio classified as available-for-sale • $751.9 million of expected cash flow from securities portfolio in next 12 months • $448.0 million of floating rate securities with minimal losses • Portfolio duration of 4.7 years at September 30, 2026 liquidity Cash/Investment Liquidity All dollars shown in thousands Loan to Deposit Ratio $11,715 $13,424 $13,495 $13,735 $13,905$14,433 $16,422 $17,919 $17,583 $17,698 81.2% 81.7% 75.3% 78.1% 78.6% 3Q25 4Q25 1Q26 2Q26 3Q26 EOP Loans EOP Deposits Loans / Deposits Ratio FHLB borrowing availability 1,350,058$ Fed Discount Window availability 788,167 Holding Company LOC 40,000 Brokered CDs/Deposit placement services 3,276,118 Fed funds 1,076,000 Total as of September 30, 2026 6,530,343$
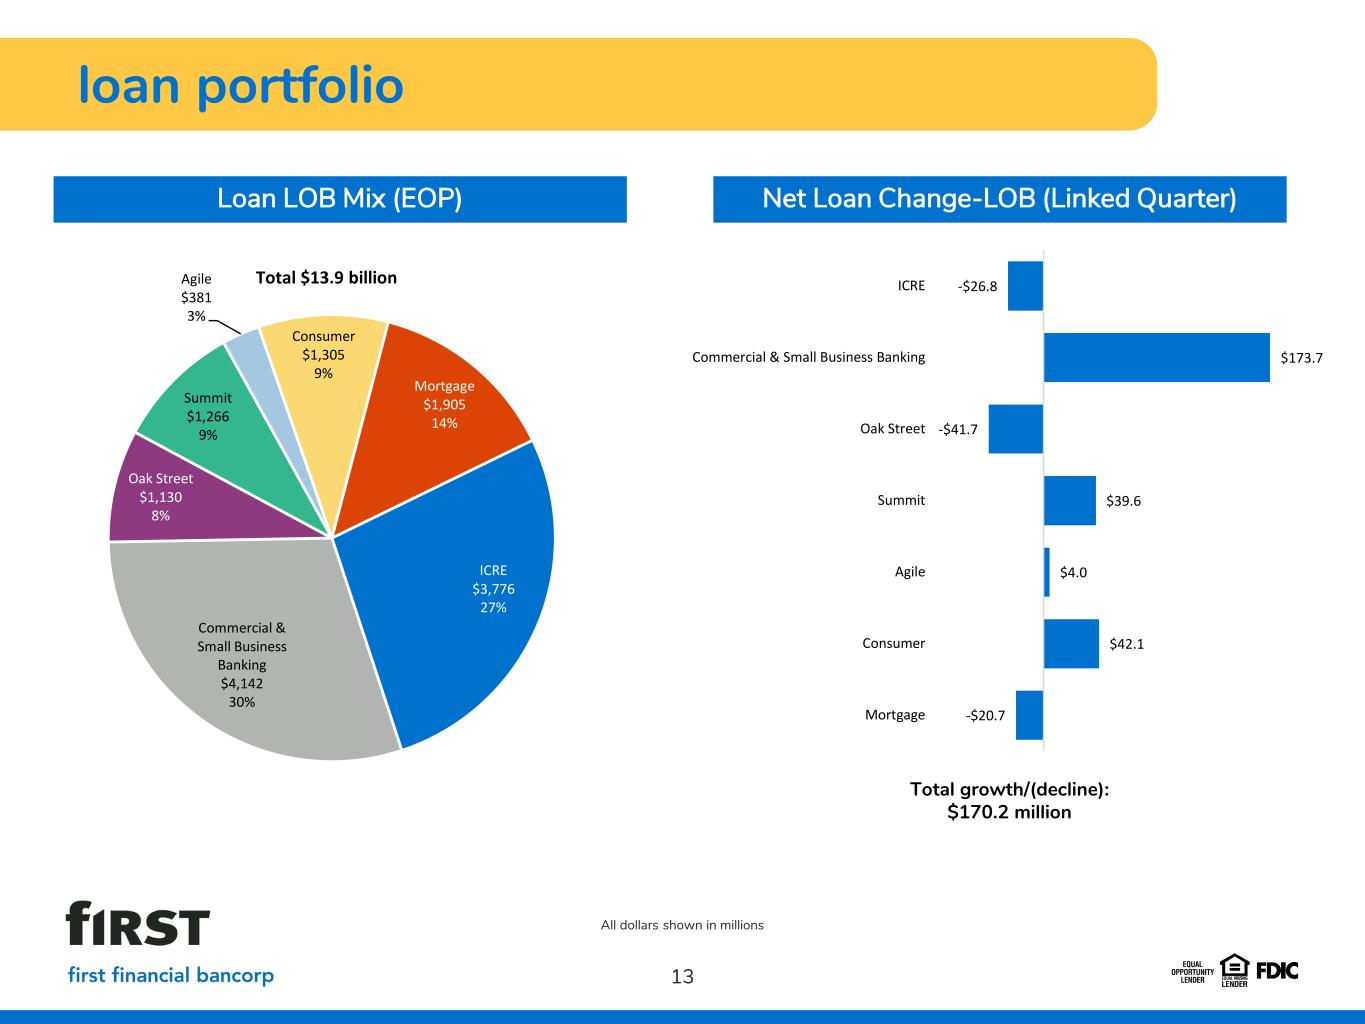
loan portfolio 13 Loan LOB Mix (EOP) Net Loan Change-LOB (Linked Quarter) All dollars shown in millions Total growth/(decline): $170.2 million ICRE $3,776 27% Commercial & Small Business Banking $4,142 30% Oak Street $1,130 8% Summit $1,266 9% Agile $381 3% Consumer $1,305 9% Mortgage $1,905 14% Total $13.9 billion -$26.8 $173.7 -$41.7 $39.6 $4.0 $42.1 -$20.7 ICRE Commercial & Small Business Banking Oak Street Summit Agile Consumer Mortgage
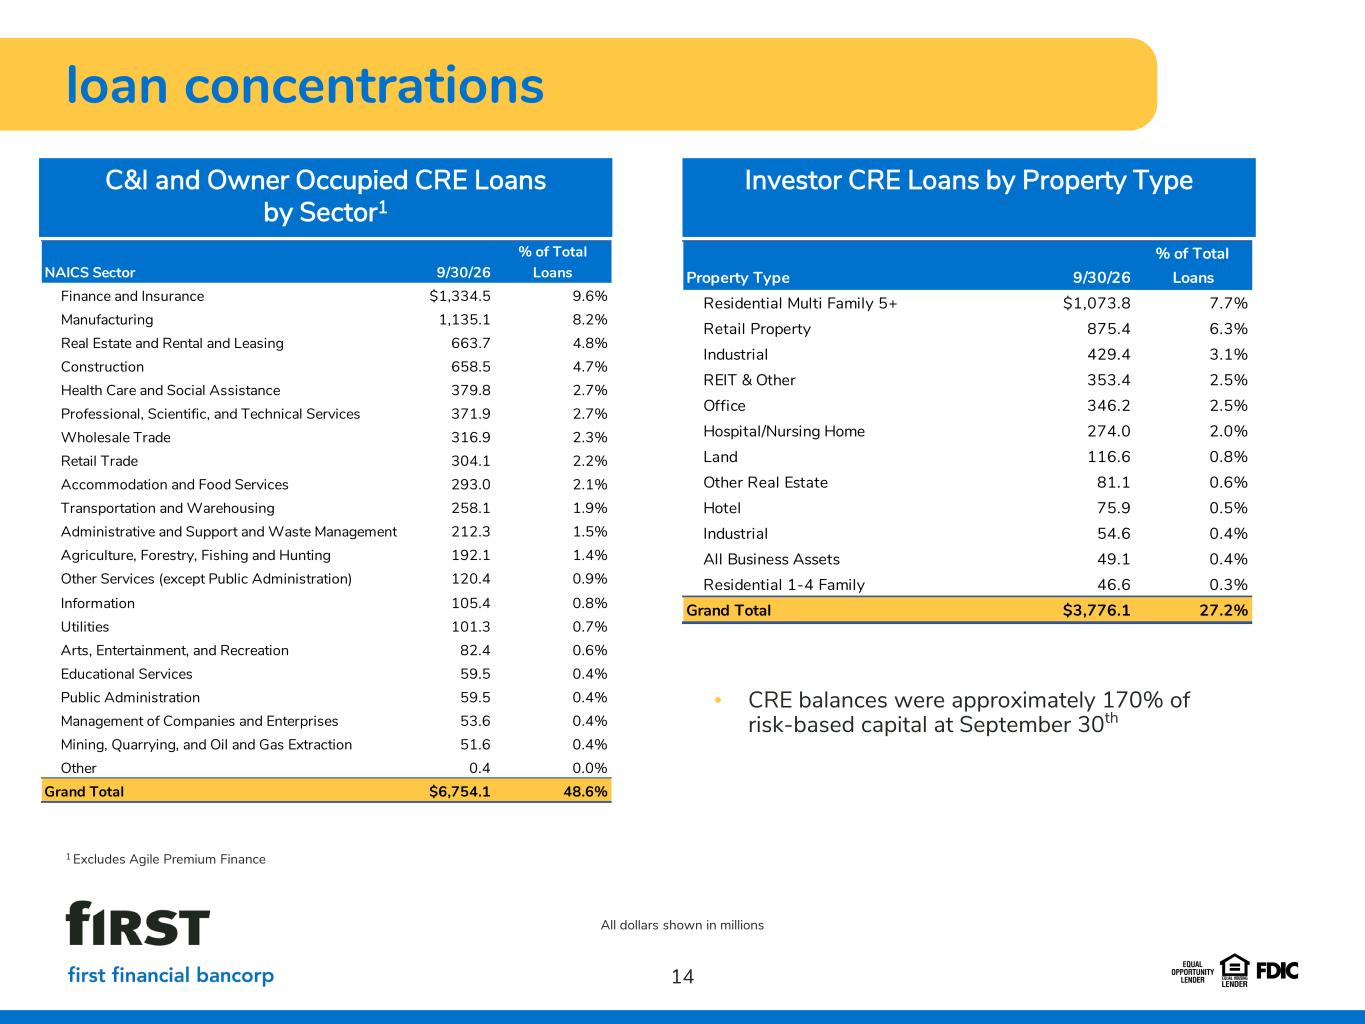
loan concentrations 14 C&I and Owner Occupied CRE Loans by Sector1 Investor CRE Loans by Property Type All dollars shown in millions 1 Excludes Agile Premium Finance • CRE balances were approximately 170% of risk-based capital at September 30th NAICS Sector 9/30/26 % of Total Loans Finance and Insurance $1,334.5 9.6% Manufacturing 1,135.1 8.2% Real Estate and Rental and Leasing 663.7 4.8% Construction 658.5 4.7% Health Care and Social Assistance 379.8 2.7% Professional, Scientific, and Technical Services 371.9 2.7% Wholesale Trade 316.9 2.3% Retail Trade 304.1 2.2% Accommodation and Food Services 293.0 2.1% Transportation and Warehousing 258.1 1.9% Administrative and Support and Waste Management 212.3 1.5% Agriculture, Forestry, Fishing and Hunting 192.1 1.4% Other Services (except Public Administration) 120.4 0.9% Information 105.4 0.8% Utilities 101.3 0.7% Arts, Entertainment, and Recreation 82.4 0.6% Educational Services 59.5 0.4% Public Administration 59.5 0.4% Management of Companies and Enterprises 53.6 0.4% Mining, Quarrying, and Oil and Gas Extraction 51.6 0.4% Other 0.4 0.0% Grand Total $6,754.1 48.6% Property Type 9/30/26 % of Total Loans Residential Multi Family 5+ $1,073.8 7.7% Retail Property 875.4 6.3% Industrial 429.4 3.1% REIT & Other 353.4 2.5% Office 346.2 2.5% Hospital/Nursing Home 274.0 2.0% Land 116.6 0.8% Other Real Estate 81.1 0.6% Hotel 75.9 0.5% Industrial 54.6 0.4% All Business Assets 49.1 0.4% Residential 1-4 Family 46.6 0.3% Grand Total $3,776.1 27.2%
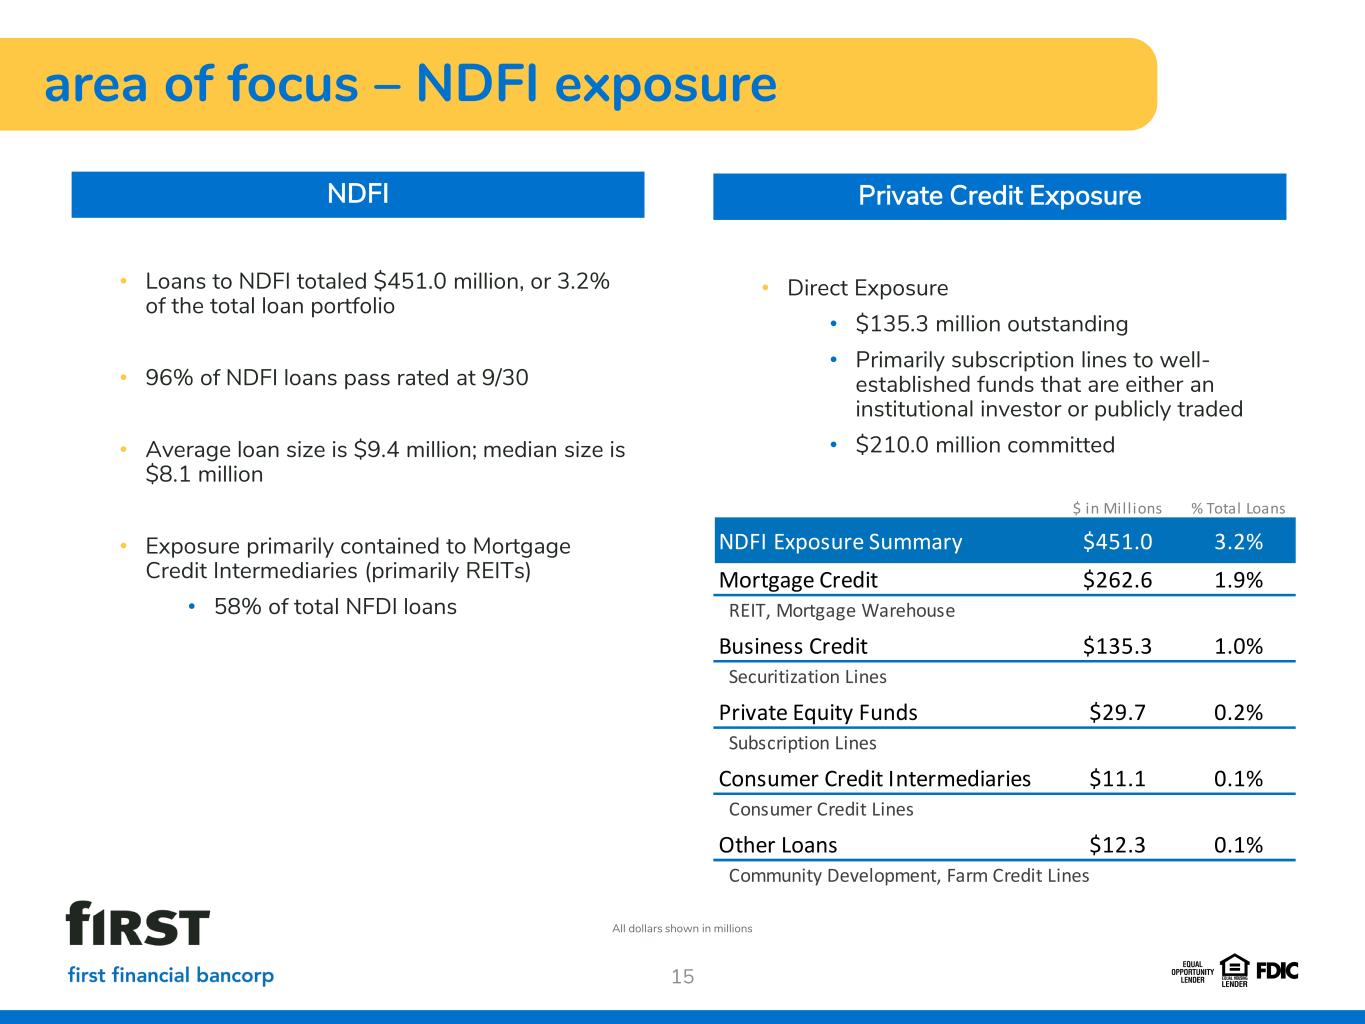
area of focus – NDFI exposure 15 All dollars shown in millions NDFI Private Credit Exposure • Direct Exposure • $135.3 million outstanding • Primarily subscription lines to well- established funds that are either an institutional investor or publicly traded • $210.0 million committed • Loans to NDFI totaled $451.0 million, or 3.2% of the total loan portfolio • 96% of NDFI loans pass rated at 9/30 • Average loan size is $9.4 million; median size is $8.1 million • Exposure primarily contained to Mortgage Credit Intermediaries (primarily REITs) • 58% of total NFDI loans $ in Mill ions % Total Loans NDFI Exposure Summary $451.0 3.2% Mortgage Credit $262.6 1.9% REIT, Mortgage Warehouse Business Credit $135.3 1.0% Securitization Lines Private Equity Funds $29.7 0.2% Subscription Lines Consumer Credit Intermediaries $11.1 0.1% Consumer Credit Lines Other Loans $12.3 0.1% Community Development, Farm Credit Lines
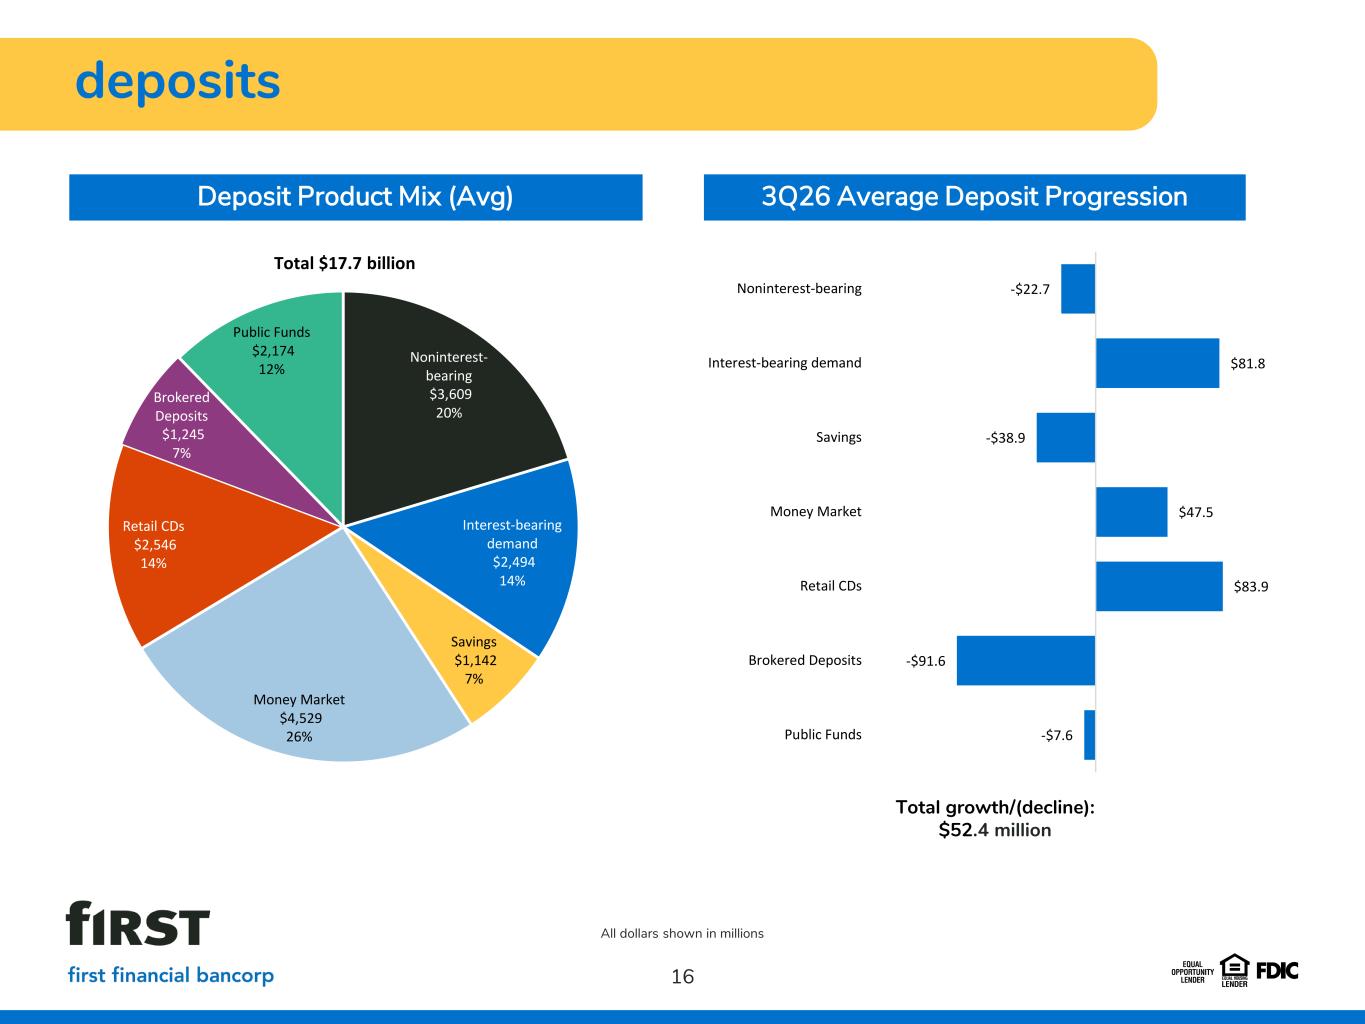
deposits 16 Deposit Product Mix (Avg) 3Q26 Average Deposit Progression All dollars shown in millions Total growth/(decline): $52.4 million Noninterest- bearing $3,609 20% Interest-bearing demand $2,494 14% Savings $1,142 7% Money Market $4,529 26% Retail CDs $2,546 14% Brokered Deposits $1,245 7% Public Funds $2,174 12% Total $17.7 billion -$22.7 $81.8 -$38.9 $47.5 $83.9 -$91.6 -$7.6 Noninterest-bearing Interest-bearing demand Savings Money Market Retail CDs Brokered Deposits Public Funds
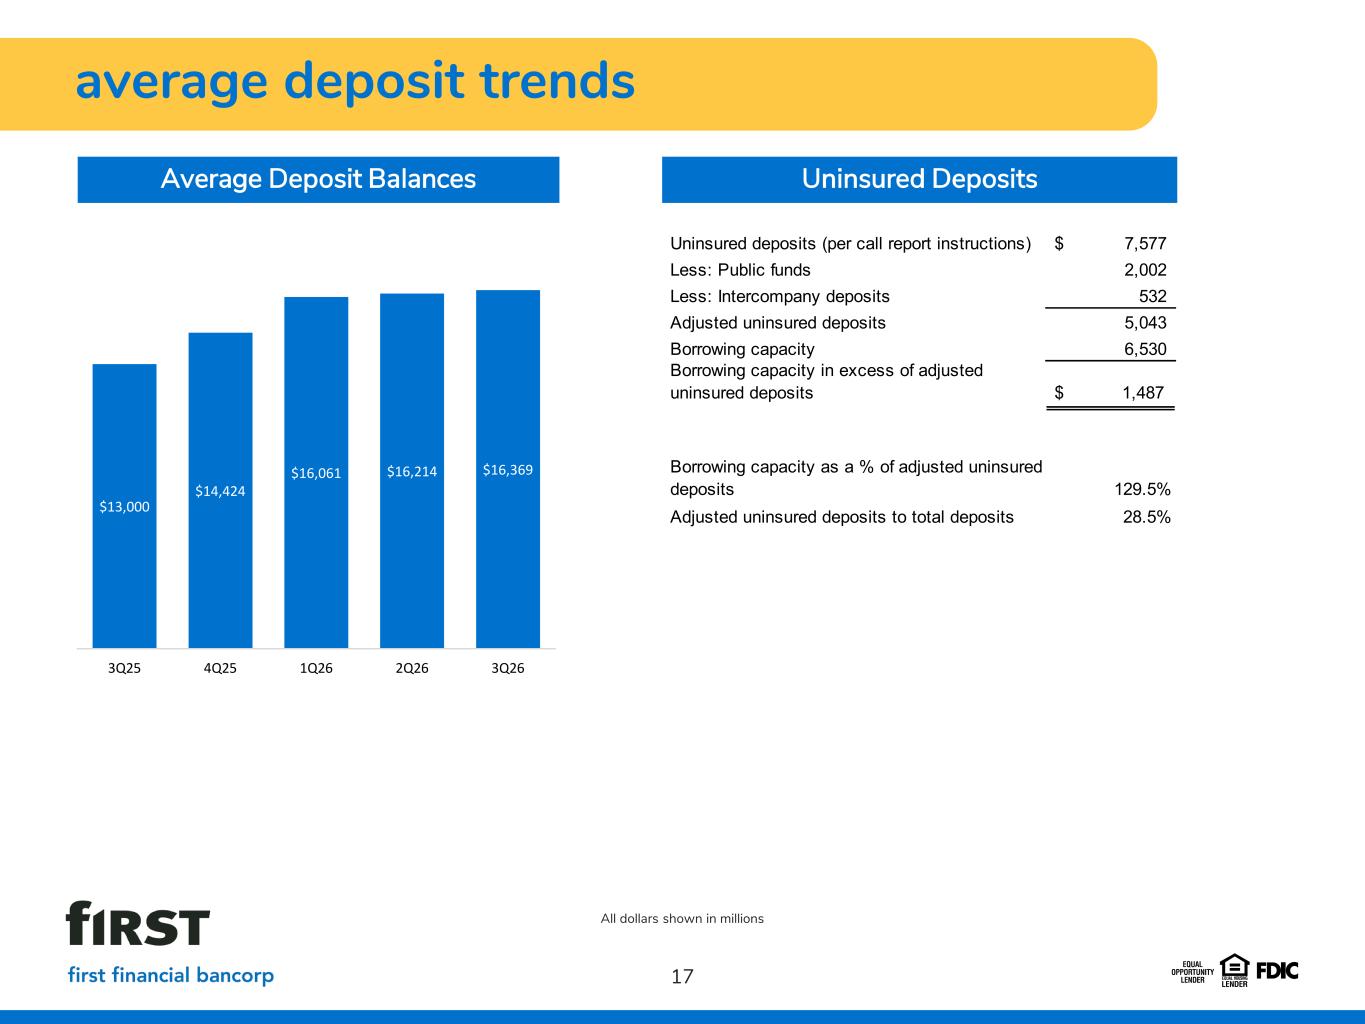
average deposit trends 17 All dollars shown in millions Average Deposit Balances Uninsured Deposits $16,369$16,214$16,061 $14,424 $13,000 3Q262Q261Q264Q253Q25 Uninsured deposits (per call report instructions) 7,577$ Less: Public funds 2,002 Less: Intercompany deposits 532 Adjusted uninsured deposits 5,043 Borrowing capacity 6,530 Borrowing capacity in excess of adjusted uninsured deposits $ 1,487 Borrowing capacity as a % of adjusted uninsured deposits 129.5% Adjusted uninsured deposits to total deposits 28.5%
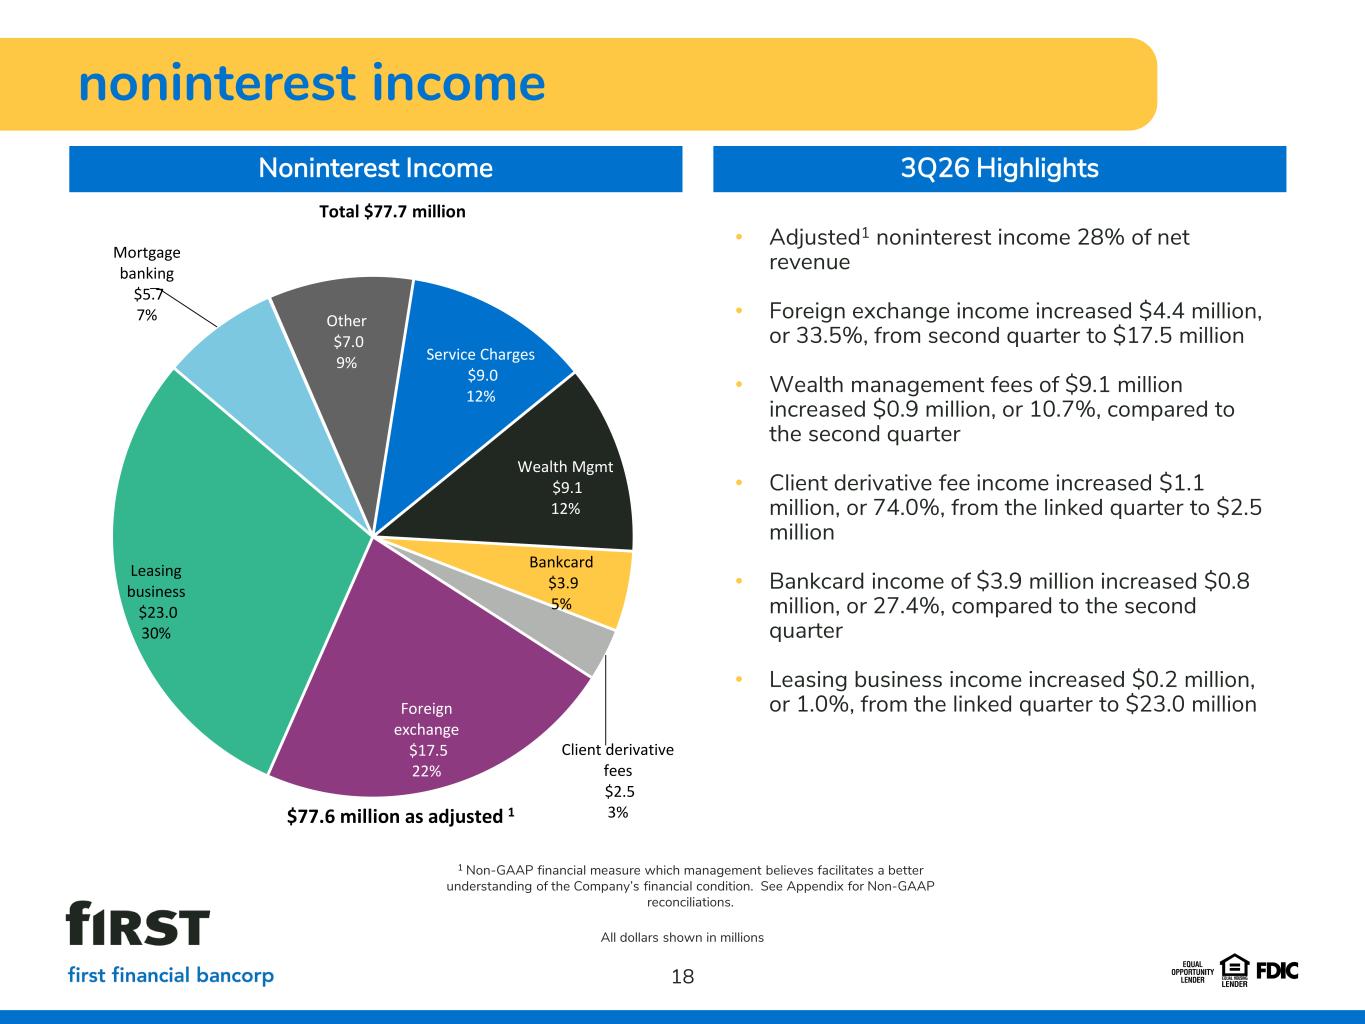
noninterest income 18 Noninterest Income 1 Non-GAAP financial measure which management believes facilitates a better understanding of the Company’s financial condition. See Appendix for Non-GAAP reconciliations. 3Q26 Highlights • Adjusted1 noninterest income 28% of net revenue • Foreign exchange income increased $4.4 million, or 33.5%, from second quarter to $17.5 million • Wealth management fees of $9.1 million increased $0.9 million, or 10.7%, compared to the second quarter • Client derivative fee income increased $1.1 million, or 74.0%, from the linked quarter to $2.5 million • Bankcard income of $3.9 million increased $0.8 million, or 27.4%, compared to the second quarter • Leasing business income increased $0.2 million, or 1.0%, from the linked quarter to $23.0 million All dollars shown in millions Service Charges $9.0 12% Wealth Mgmt $9.1 12% Bankcard $3.9 5% Client derivative fees $2.5 3% Foreign exchange $17.5 22% Leasing business $23.0 30% Mortgage banking $5.7 7% Other $7.0 9% Total $77.7 million $77.6 million as adjusted 1
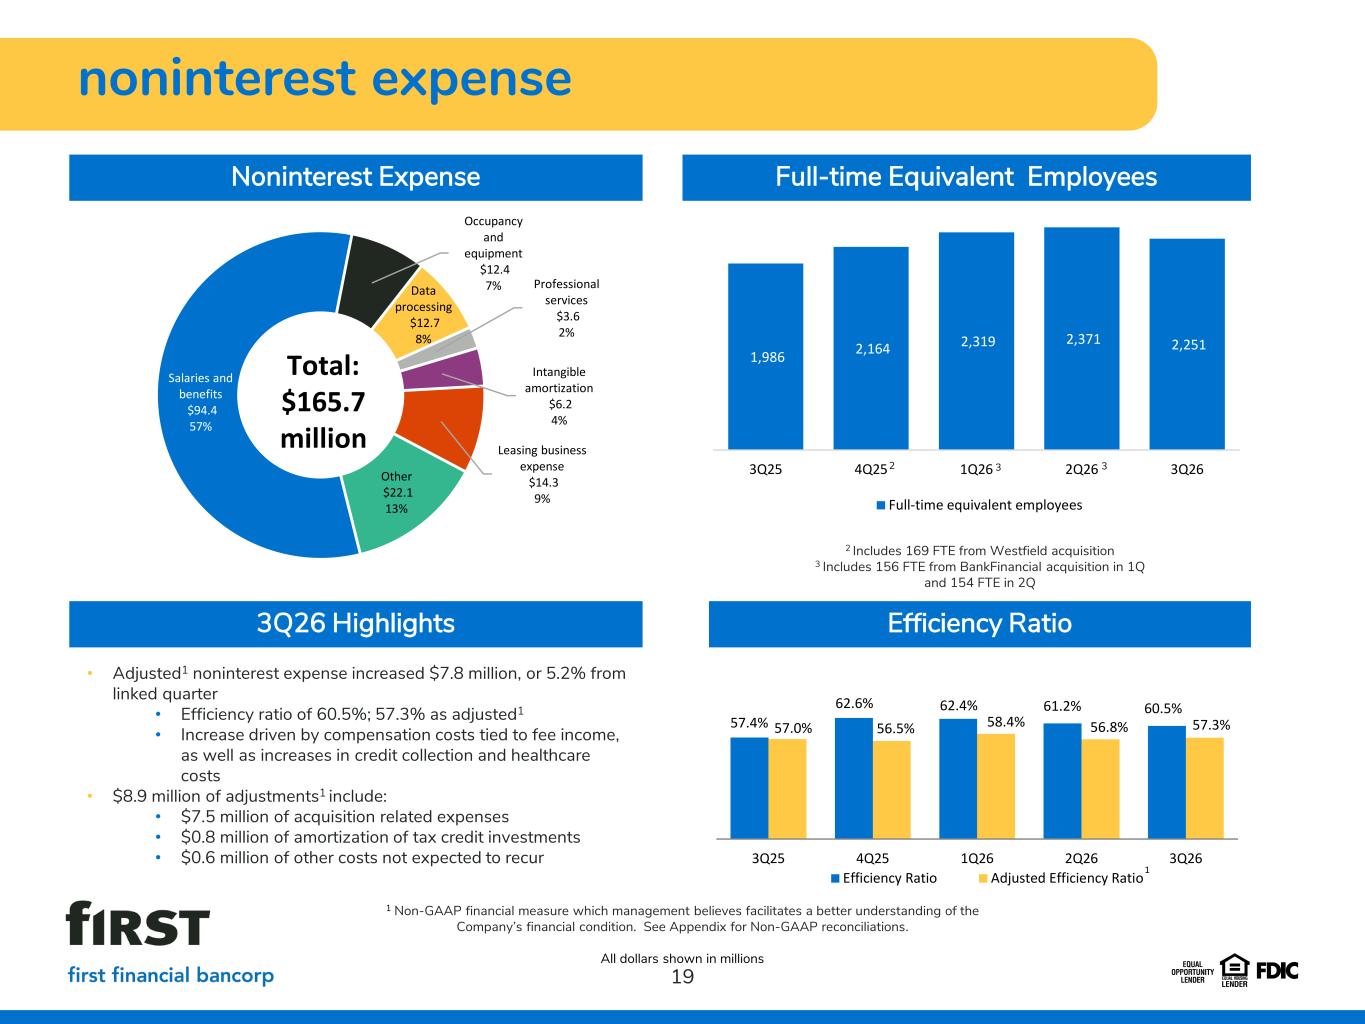
noninterest expense 19 Noninterest Expense 3Q26 Highlights 1 Non-GAAP financial measure which management believes facilitates a better understanding of the Company’s financial condition. See Appendix for Non-GAAP reconciliations. All dollars shown in millions • Adjusted1 noninterest expense increased $7.8 million, or 5.2% from linked quarter • Efficiency ratio of 60.5%; 57.3% as adjusted1 • Increase driven by compensation costs tied to fee income, as well as increases in credit collection and healthcare costs • $8.9 million of adjustments1 include: • $7.5 million of acquisition related expenses • $0.8 million of amortization of tax credit investments • $0.6 million of other costs not expected to recur Full-time Equivalent Employees 2 Includes 169 FTE from Westfield acquisition 3 Includes 156 FTE from BankFinancial acquisition in 1Q and 154 FTE in 2Q 2 3 Efficiency Ratio Salaries and benefits $94.4 57% Occupancy and equipment $12.4 7%Data processing $12.7 8% Professional services $3.6 2% Intangible amortization $6.2 4% Leasing business expense $14.3 9% Other $22.1 13% Total: $165.7 million 2,251 2,371 2,319 2,164 1,986 3Q262Q261Q264Q253Q25 Full-time equivalent employees 2 3 3 57.4% 62.6% 62.4% 61.2% 60.5% 57.0% 56.5% 58.4% 56.8% 57.3% 3Q25 4Q25 1Q26 2Q26 3Q26 Efficiency Ratio Adjusted Efficiency Ratio 1
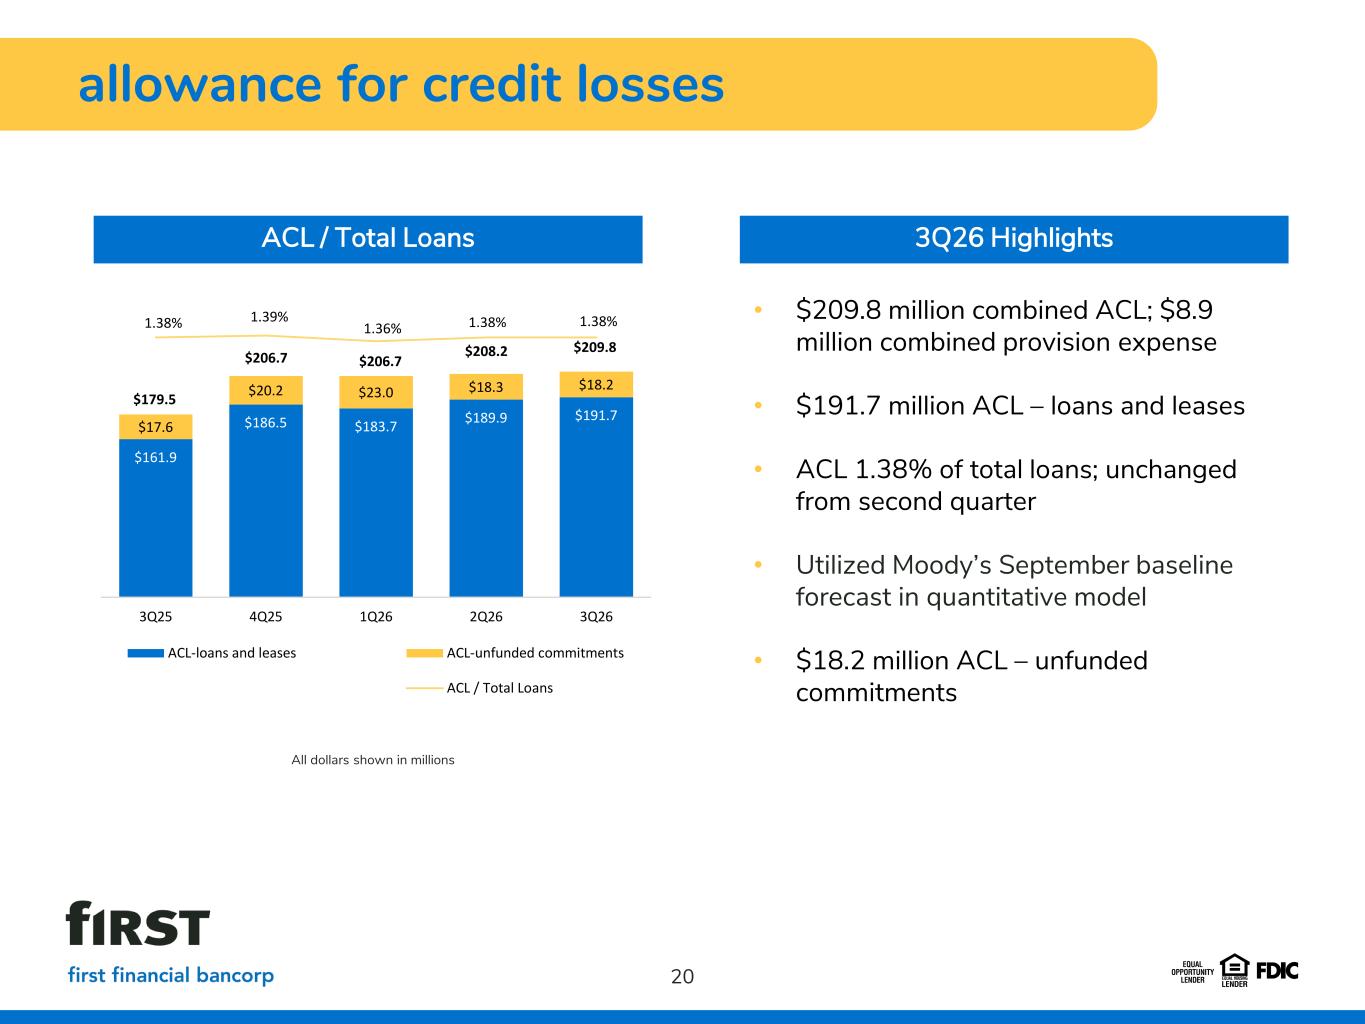
allowance for credit losses 20 3Q26 Highlights All dollars shown in millions • $209.8 million combined ACL; $8.9 million combined provision expense • $191.7 million ACL – loans and leases • ACL 1.38% of total loans; unchanged from second quarter • Utilized Moody’s September baseline forecast in quantitative model • $18.2 million ACL – unfunded commitments ACL / Total Loans $161.9 $186.5 $183.7 $189.9 $191.7 $17.6 $20.2 $23.0 $18.3 $18.2 $179.5 $206.7 $206.7 $208.2 $209.8 1.38% 1.39% 1.36% 1.38% 1.38% 3Q25 4Q25 1Q26 2Q26 3Q26 ACL-loans and leases ACL-unfunded commitments ACL / Total Loans
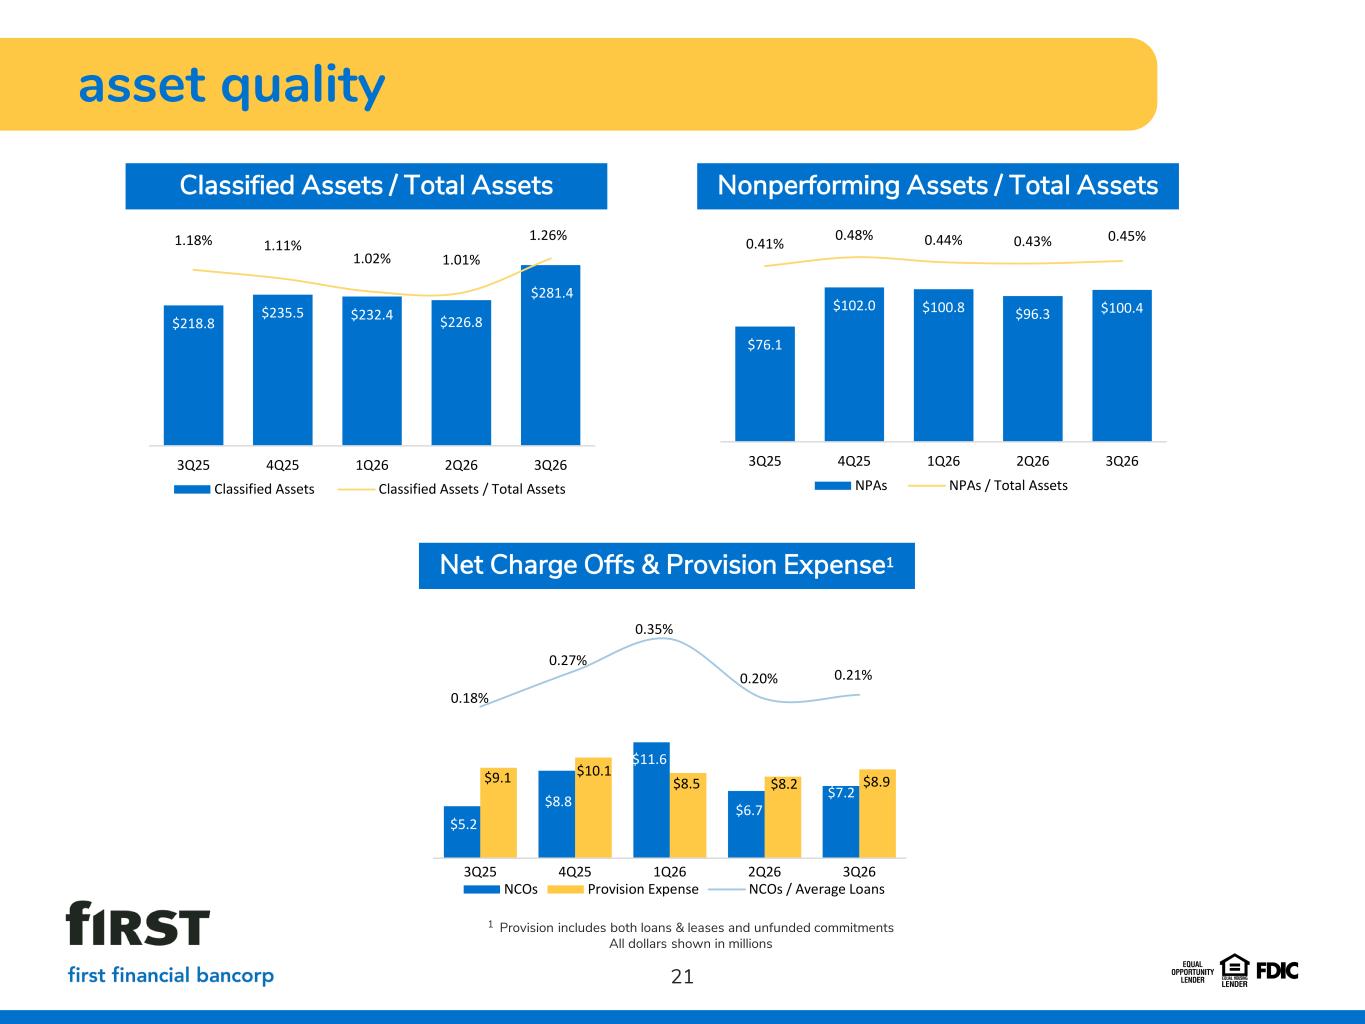
asset quality 21 Classified Assets / Total Assets 1 Provision includes both loans & leases and unfunded commitments All dollars shown in millions Nonperforming Assets / Total Assets Net Charge Offs & Provision Expense1 $6.0 $5.2 $8.8 $11.6 $6.7 $9.8 $9.1 $10.1 $8.5 $8.2 0.20% 0.35% 0.27% 0.18% 0.21% 2Q25 3Q25 4Q25 1Q26 2Q26 NCOs Provision Expense NCOs / Average Loans $5.2 $8.8 $11.6 $6.7 7 2 $9.1 $10.1 $8.5 $8.2 .9 0.21%0.20% 0.35% 0.27% 0.18% 3 4 1 6 2 3 $281.4 $226.8$232.4$235.5 $218.8 1.26% 1.01%1.02% 1.11%1.18% 3Q262Q261Q264Q253Q25 Classified Assets Classified Assets / Total Assets $100.4$96.3$100.8$102.0 $76.1 0.45%0.43%0.44%0.48%0.41% 3Q262Q261Q264Q253Q25 NPAs NPAs / Total Assets
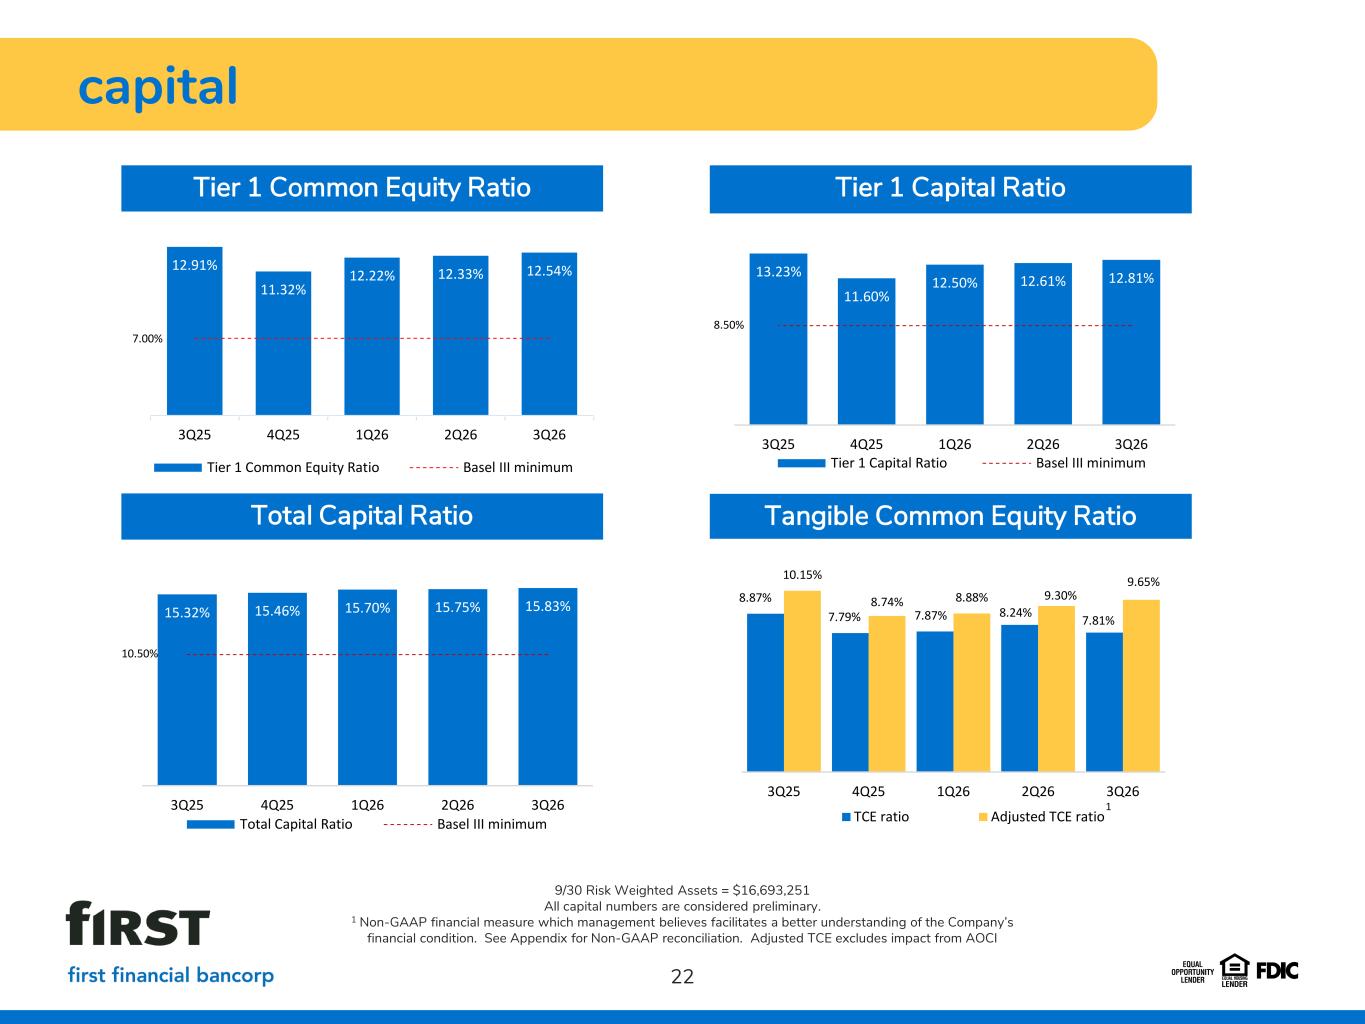
capital 22 Tangible Common Equity Ratio 9/30 Risk Weighted Assets = $16,693,251 All capital numbers are considered preliminary. 1 Non-GAAP financial measure which management believes facilitates a better understanding of the Company’s financial condition. See Appendix for Non-GAAP reconciliation. Adjusted TCE excludes impact from AOCI Tier 1 Common Equity Ratio 8.87% 7.79% 7.87% 8.24% 7.81% 10.15% 8.74% 8.88% 9.30% 9.65% 3Q25 4Q25 1Q26 2Q26 3Q26 TCE ratio Adjusted TCE ratio 1 12.54%12.33%12.22% 11.32% 12.91% 7.00% 3Q262Q261Q264Q253Q25 Tier 1 Common Equity Ratio Basel III minimum 12.81%12.61%12.50% 11.60% 13.23% 8.50% 3Q262Q261Q264Q253Q25 Tier 1 Capital Ratio Basel III minimum Tier 1 Capital Ratio 15.83%15.75%15.70%15.46%15.32% 10.50% 3Q262Q261Q264Q253Q25 Total Capital Ratio Basel III minimum Total Capital Ratio
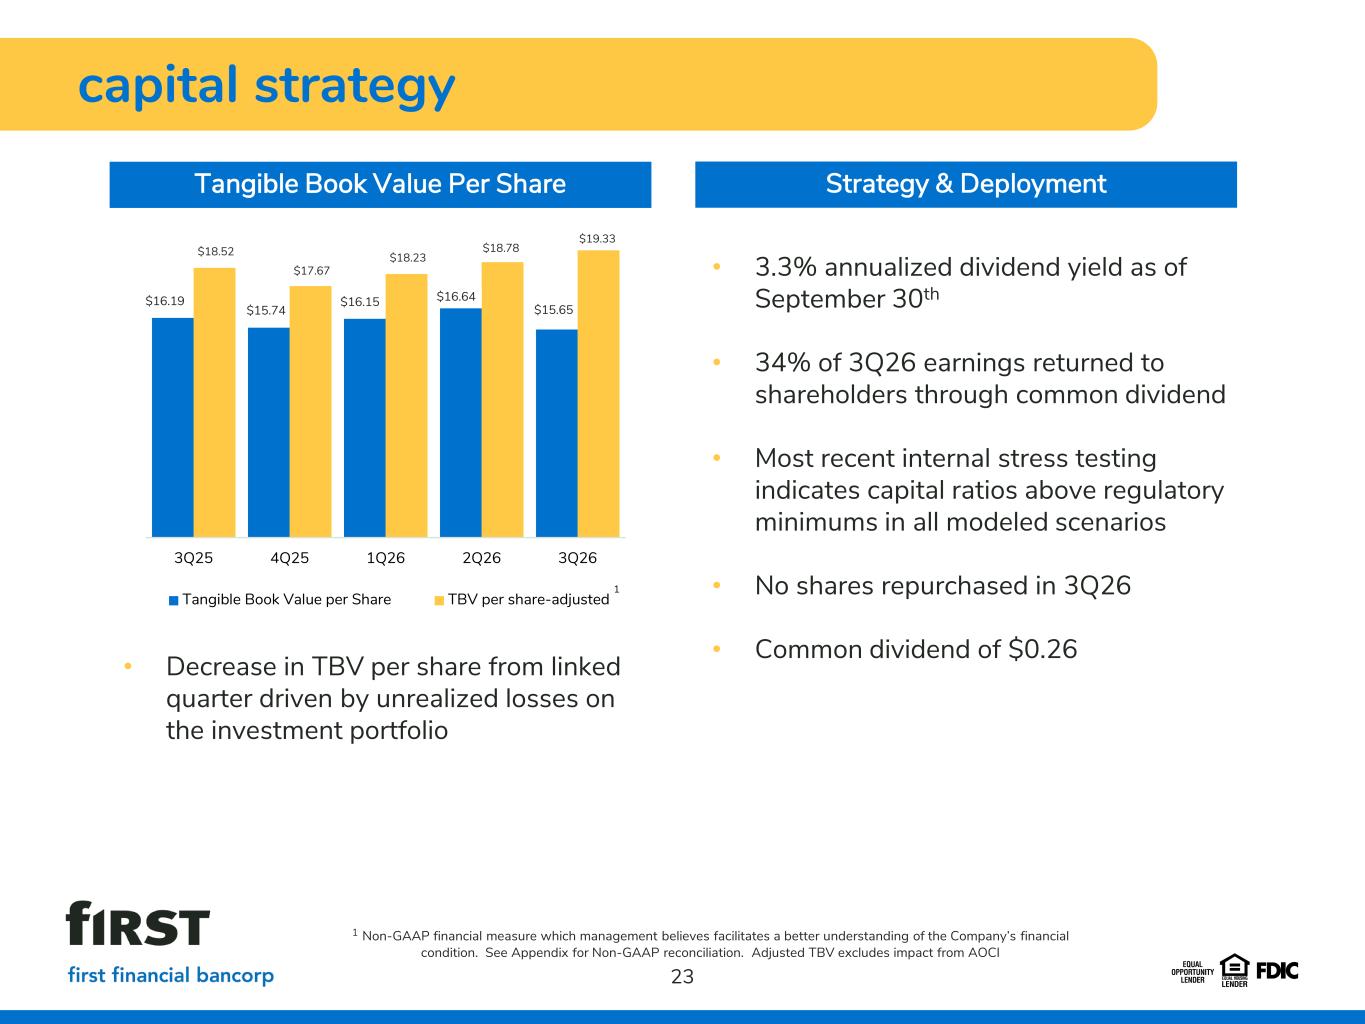
capital strategy 23 Strategy & DeploymentTangible Book Value Per Share • 3.3% annualized dividend yield as of September 30th • 34% of 3Q26 earnings returned to shareholders through common dividend • Most recent internal stress testing indicates capital ratios above regulatory minimums in all modeled scenarios • No shares repurchased in 3Q26 • Common dividend of $0.26• Decrease in TBV per share from linked quarter driven by unrealized losses on the investment portfolio 1 Non-GAAP financial measure which management believes facilitates a better understanding of the Company’s financial condition. See Appendix for Non-GAAP reconciliation. Adjusted TBV excludes impact from AOCI $16.19 $15.74 $16.15 $16.64 $15.65 $18.52 $17.67 $18.23 $18.78 $19.33 3Q25 4Q25 1Q26 2Q26 3Q26 Tangible Book Value per Share TBV per share-adjusted 1
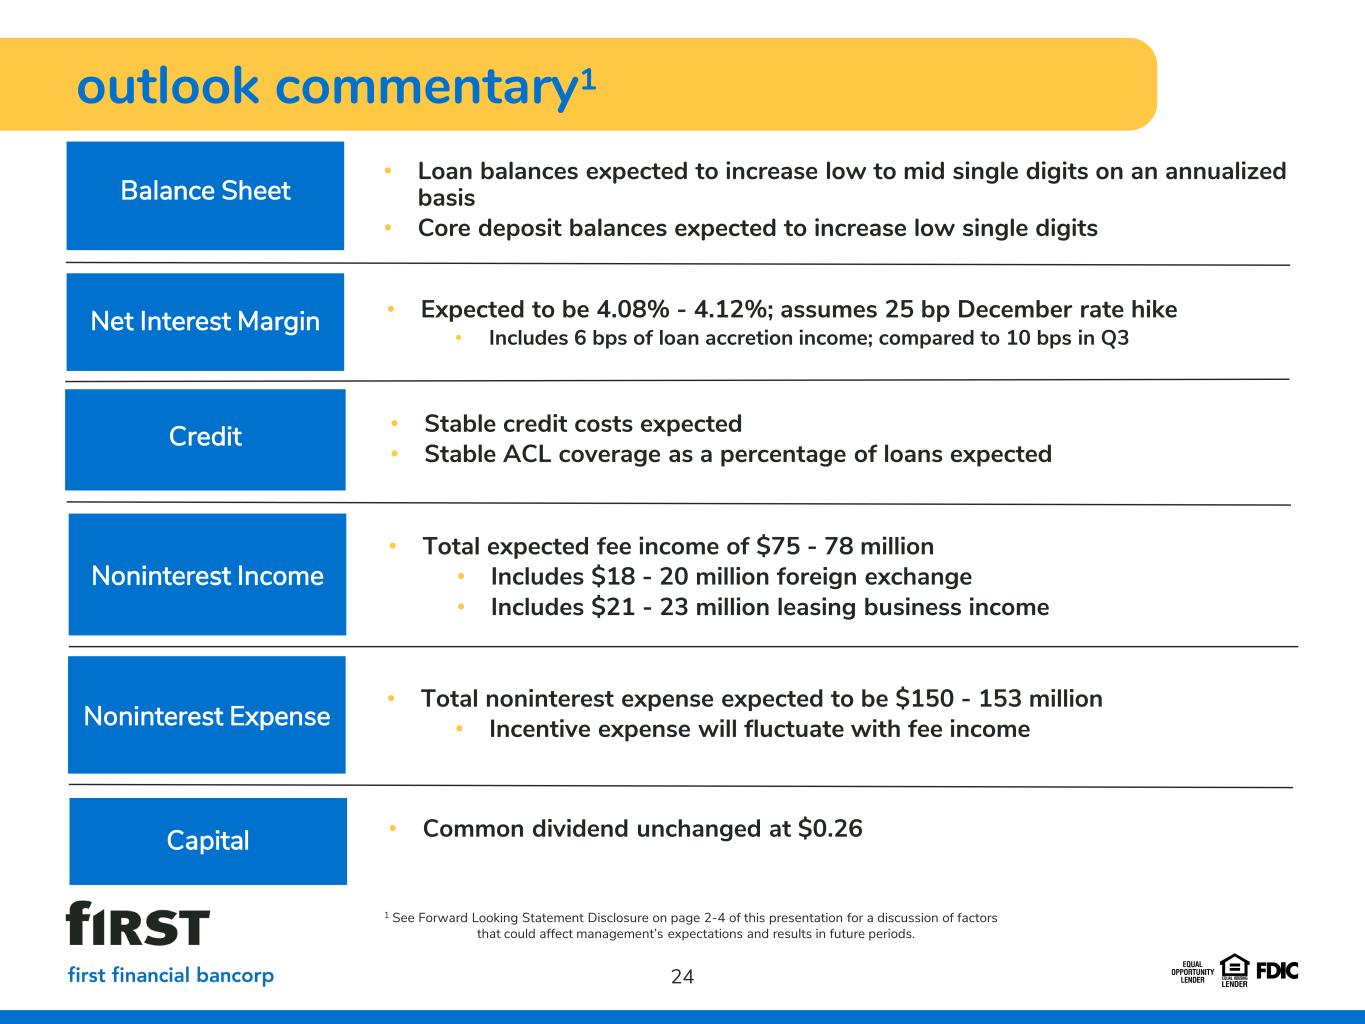
outlook commentary1 • Loan balances expected to increase low to mid single digits on an annualized basis • Core deposit balances expected to increase low single digits 24 • Total noninterest expense expected to be $150 - 153 million • Incentive expense will fluctuate with fee income Noninterest Expense Net Interest Margin Balance Sheet Credit • Stable credit costs expected • Stable ACL coverage as a percentage of loans expected Noninterest Income • Total expected fee income of $75 - 78 million • Includes $18 - 20 million foreign exchange • Includes $21 - 23 million leasing business income 1 See Forward Looking Statement Disclosure on page 2-4 of this presentation for a discussion of factors that could affect management’s expectations and results in future periods. • Expected to be 4.08% - 4.12%; assumes 25 bp December rate hike • Includes 6 bps of loan accretion income; compared to 10 bps in Q3 Capital • Common dividend unchanged at $0.26 Noninterest Expense Net Inte argin Bala eet it Noninterest Income
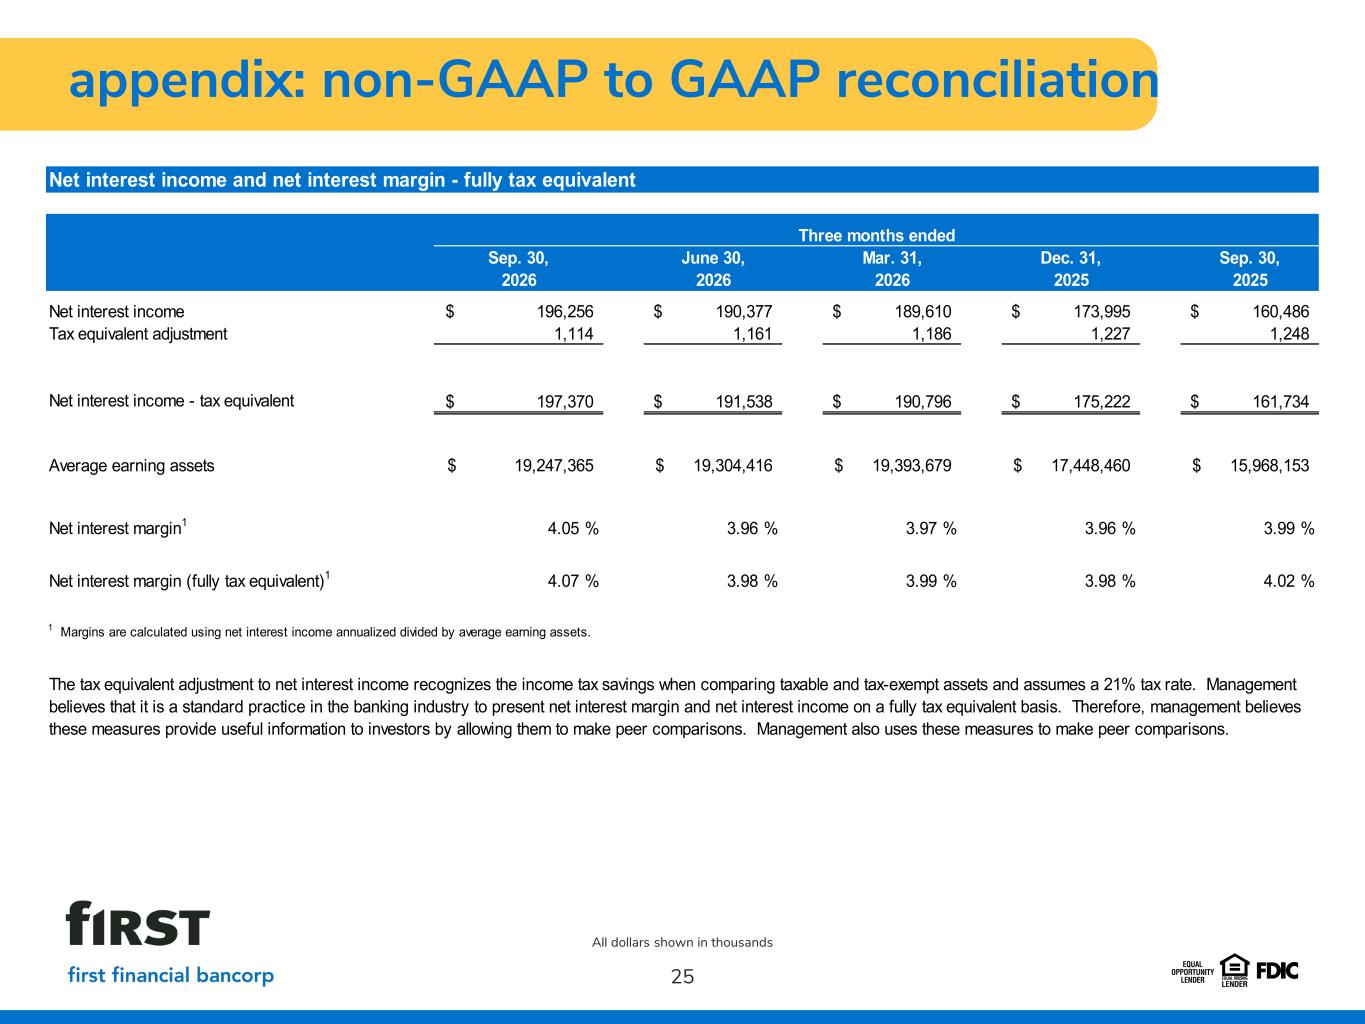
appendix: non-GAAP to GAAP reconciliation 25 All dollars shown in thousands Net interest income and net interest margin - fully tax equivalent Sep. 30, June 30, Mar. 31, Dec. 31, Sep. 30, 2026 2026 2026 2025 2025 Net interest income 196,256$ 190,377$ 189,610$ 173,995$ 160,486$ Tax equivalent adjustment 1,114 1,161 1,186 1,227 1,248 Net interest income - tax equivalent 197,370$ 191,538$ 190,796$ 175,222$ 161,734$ Average earning assets 19,247,365$ 19,304,416$ 19,393,679$ 17,448,460$ 15,968,153$ Net interest margin1 4.05 % 3.96 % 3.97 % 3.96 % 3.99 % Net interest margin (fully tax equivalent)1 4.07 % 3.98 % 3.99 % 3.98 % 4.02 % Three months ended 1 Margins are calculated using net interest income annualized divided by average earning assets. The tax equivalent adjustment to net interest income recognizes the income tax savings when comparing taxable and tax-exempt assets and assumes a 21% tax rate. Management believes that it is a standard practice in the banking industry to present net interest margin and net interest income on a fully tax equivalent basis. Therefore, management believes these measures provide useful information to investors by allowing them to make peer comparisons. Management also uses these measures to make peer comparisons.
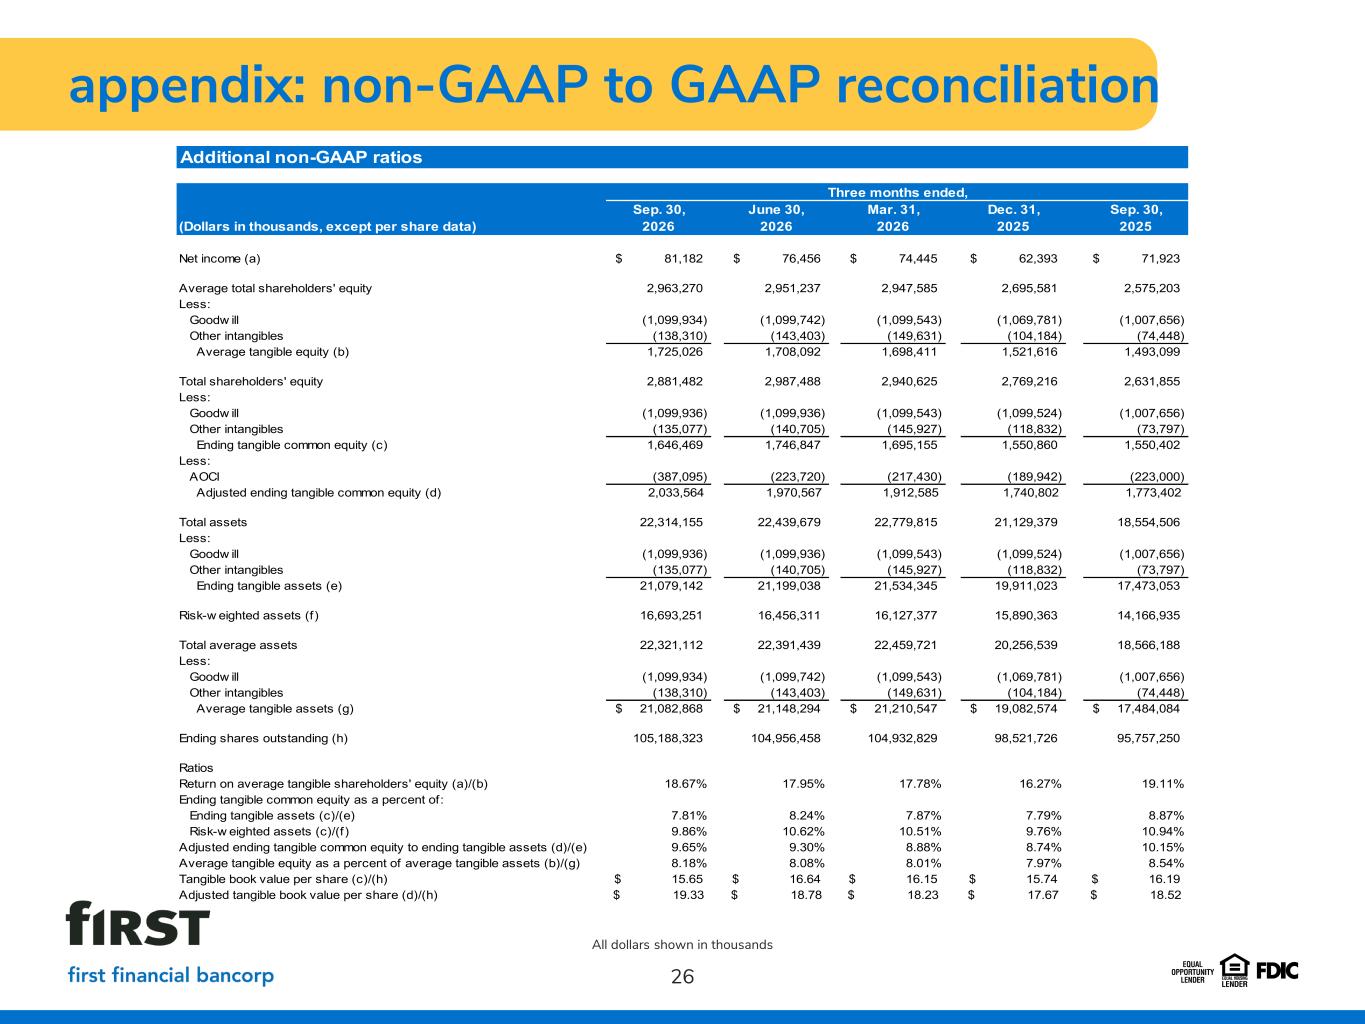
appendix: non-GAAP to GAAP reconciliation 26 All dollars shown in thousands Additional non-GAAP ratios Sep. 30, June 30, Mar. 31, Dec. 31, Sep. 30, (Dollars in thousands, except per share data) 2026 2026 2026 2025 2025 Net income (a) 81,182$ 76,456$ 74,445$ 62,393$ 71,923$ Average total shareholders' equity 2,963,270 2,951,237 2,947,585 2,695,581 2,575,203 Less: Goodw ill (1,099,934) (1,099,742) (1,099,543) (1,069,781) (1,007,656) Other intangibles (138,310) (143,403) (149,631) (104,184) (74,448) Average tangible equity (b) 1,725,026 1,708,092 1,698,411 1,521,616 1,493,099 Total shareholders' equity 2,881,482 2,987,488 2,940,625 2,769,216 2,631,855 Less: Goodw ill (1,099,936) (1,099,936) (1,099,543) (1,099,524) (1,007,656) Other intangibles (135,077) (140,705) (145,927) (118,832) (73,797) Ending tangible common equity (c) 1,646,469 1,746,847 1,695,155 1,550,860 1,550,402 Less: AOCI (387,095) (223,720) (217,430) (189,942) (223,000) Adjusted ending tangible common equity (d) 2,033,564 1,970,567 1,912,585 1,740,802 1,773,402 Total assets 22,314,155 22,439,679 22,779,815 21,129,379 18,554,506 Less: Goodw ill (1,099,936) (1,099,936) (1,099,543) (1,099,524) (1,007,656) Other intangibles (135,077) (140,705) (145,927) (118,832) (73,797) Ending tangible assets (e) 21,079,142 21,199,038 21,534,345 19,911,023 17,473,053 Risk-w eighted assets (f) 16,693,251 16,456,311 16,127,377 15,890,363 14,166,935 Total average assets 22,321,112 22,391,439 22,459,721 20,256,539 18,566,188 Less: Goodw ill (1,099,934) (1,099,742) (1,099,543) (1,069,781) (1,007,656) Other intangibles (138,310) (143,403) (149,631) (104,184) (74,448) Average tangible assets (g) 21,082,868$ 21,148,294$ 21,210,547$ 19,082,574$ 17,484,084$ Ending shares outstanding (h) 105,188,323 104,956,458 104,932,829 98,521,726 95,757,250 Ratios Return on average tangible shareholders' equity (a)/(b) 18.67% 17.95% 17.78% 16.27% 19.11% Ending tangible common equity as a percent of: Ending tangible assets (c)/(e) 7.81% 8.24% 7.87% 7.79% 8.87% Risk-w eighted assets (c)/(f) 9.86% 10.62% 10.51% 9.76% 10.94% Adjusted ending tangible common equity to ending tangible assets (d)/(e) 9.65% 9.30% 8.88% 8.74% 10.15% Average tangible equity as a percent of average tangible assets (b)/(g) 8.18% 8.08% 8.01% 7.97% 8.54% Tangible book value per share (c)/(h) 15.65$ 16.64$ 16.15$ 15.74$ 16.19$ Adjusted tangible book value per share (d)/(h) $ 19.33 $ 18.78 $ 18.23 $ 17.67 $ 18.52 Three months ended,
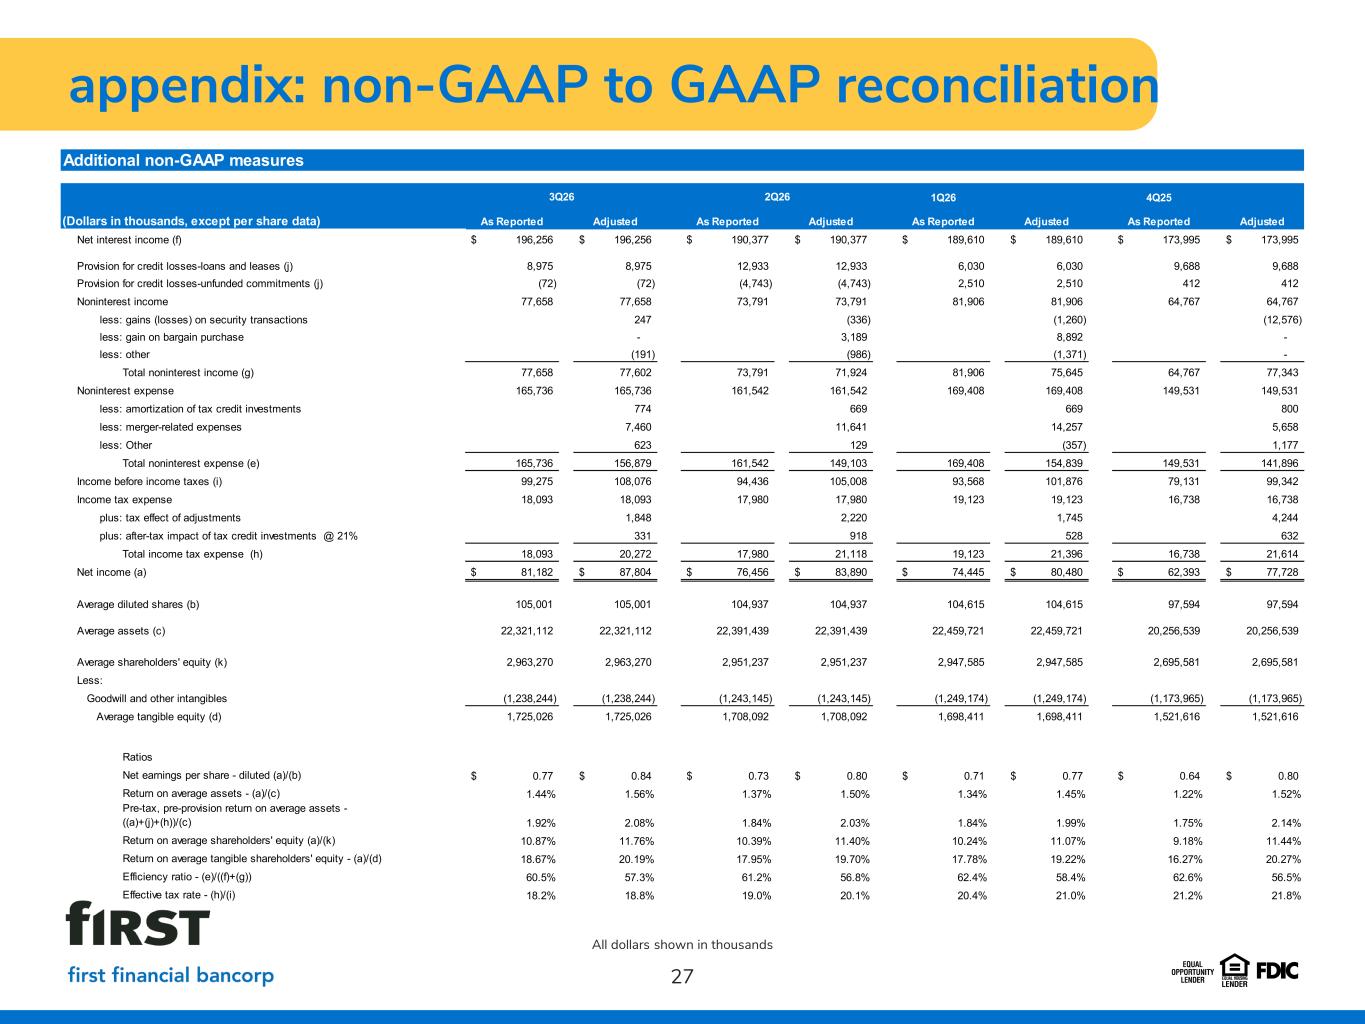
appendix: non-GAAP to GAAP reconciliation 27 All dollars shown in thousands Additional non-GAAP measures 1Q26 4Q25 As Reported Adjusted As Reported Adjusted As Reported Adjusted As Reported Adjusted Net interest income (f) 196,256$ 196,256$ 190,377$ 190,377$ 189,610$ 189,610$ 173,995$ 173,995$ Provision for credit losses-loans and leases (j) 8,975 8,975 12,933 12,933 6,030 6,030 9,688 9,688 Provision for credit losses-unfunded commitments (j) (72) (72) (4,743) (4,743) 2,510 2,510 412 412 Noninterest income 77,658 77,658 73,791 73,791 81,906 81,906 64,767 64,767 less: gains (losses) on security transactions 247 (336) (1,260) (12,576) less: gain on bargain purchase - 3,189 8,892 - less: other (191) (986) (1,371) - Total noninterest income (g) 77,658 77,602 73,791 71,924 81,906 75,645 64,767 77,343 Noninterest expense 165,736 165,736 161,542 161,542 169,408 169,408 149,531 149,531 less: amortization of tax credit investments 774 669 669 800 less: merger-related expenses 7,460 11,641 14,257 5,658 less: Other 623 129 (357) 1,177 Total noninterest expense (e) 165,736 156,879 161,542 149,103 169,408 154,839 149,531 141,896 Income before income taxes (i) 99,275 108,076 94,436 105,008 93,568 101,876 79,131 99,342 Income tax expense 18,093 18,093 17,980 17,980 19,123 19,123 16,738 16,738 plus: tax effect of adjustments 1,848 2,220 1,745 4,244 plus: after-tax impact of tax credit investments @ 21% 331 918 528 632 Total income tax expense (h) 18,093 20,272 17,980 21,118 19,123 21,396 16,738 21,614 Net income (a) 81,182$ 87,804$ 76,456$ 83,890$ 74,445$ 80,480$ 62,393$ 77,728$ Average diluted shares (b) 105,001 105,001 104,937 104,937 104,615 104,615 97,594 97,594 Average assets (c) 22,321,112 22,321,112 22,391,439 22,391,439 22,459,721 22,459,721 20,256,539 20,256,539 Average shareholders' equity (k) 2,963,270 2,963,270 2,951,237 2,951,237 2,947,585 2,947,585 2,695,581 2,695,581 Less: Goodwill and other intangibles (1,238,244) (1,238,244) (1,243,145) (1,243,145) (1,249,174) (1,249,174) (1,173,965) (1,173,965) Average tangible equity (d) 1,725,026 1,725,026 1,708,092 1,708,092 1,698,411 1,698,411 1,521,616 1,521,616 Ratios Net earnings per share - diluted (a)/(b) 0.77$ 0.84$ 0.73$ 0.80$ 0.71$ 0.77$ 0.64$ 0.80$ Return on average assets - (a)/(c) 1.44% 1.56% 1.37% 1.50% 1.34% 1.45% 1.22% 1.52% Pre-tax, pre-provision return on average assets - ((a)+(j)+(h))/(c) 1.92% 2.08% 1.84% 2.03% 1.84% 1.99% 1.75% 2.14% Return on average shareholders' equity (a)/(k) 10.87% 11.76% 10.39% 11.40% 10.24% 11.07% 9.18% 11.44% Return on average tangible shareholders' equity - (a)/(d) 18.67% 20.19% 17.95% 19.70% 17.78% 19.22% 16.27% 20.27% Efficiency ratio - (e)/((f)+(g)) 60.5% 57.3% 61.2% 56.8% 62.4% 58.4% 62.6% 56.5% Effective tax rate - (h)/(i) 18.2% 18.8% 19.0% 20.1% 20.4% 21.0% 21.2% 21.8% (Dollars in thousands, except per share data) 3Q26 2Q26
28 First Financial Bancorp First Financial Center 255 East Fifth Street Cincinnati, OH 45202