
9M 2026 Financial Results 1 P ic tu re : 4 0 7 ET R (C a n a da ) October 27, 2026 9M 2026 OPERATING RESULTS
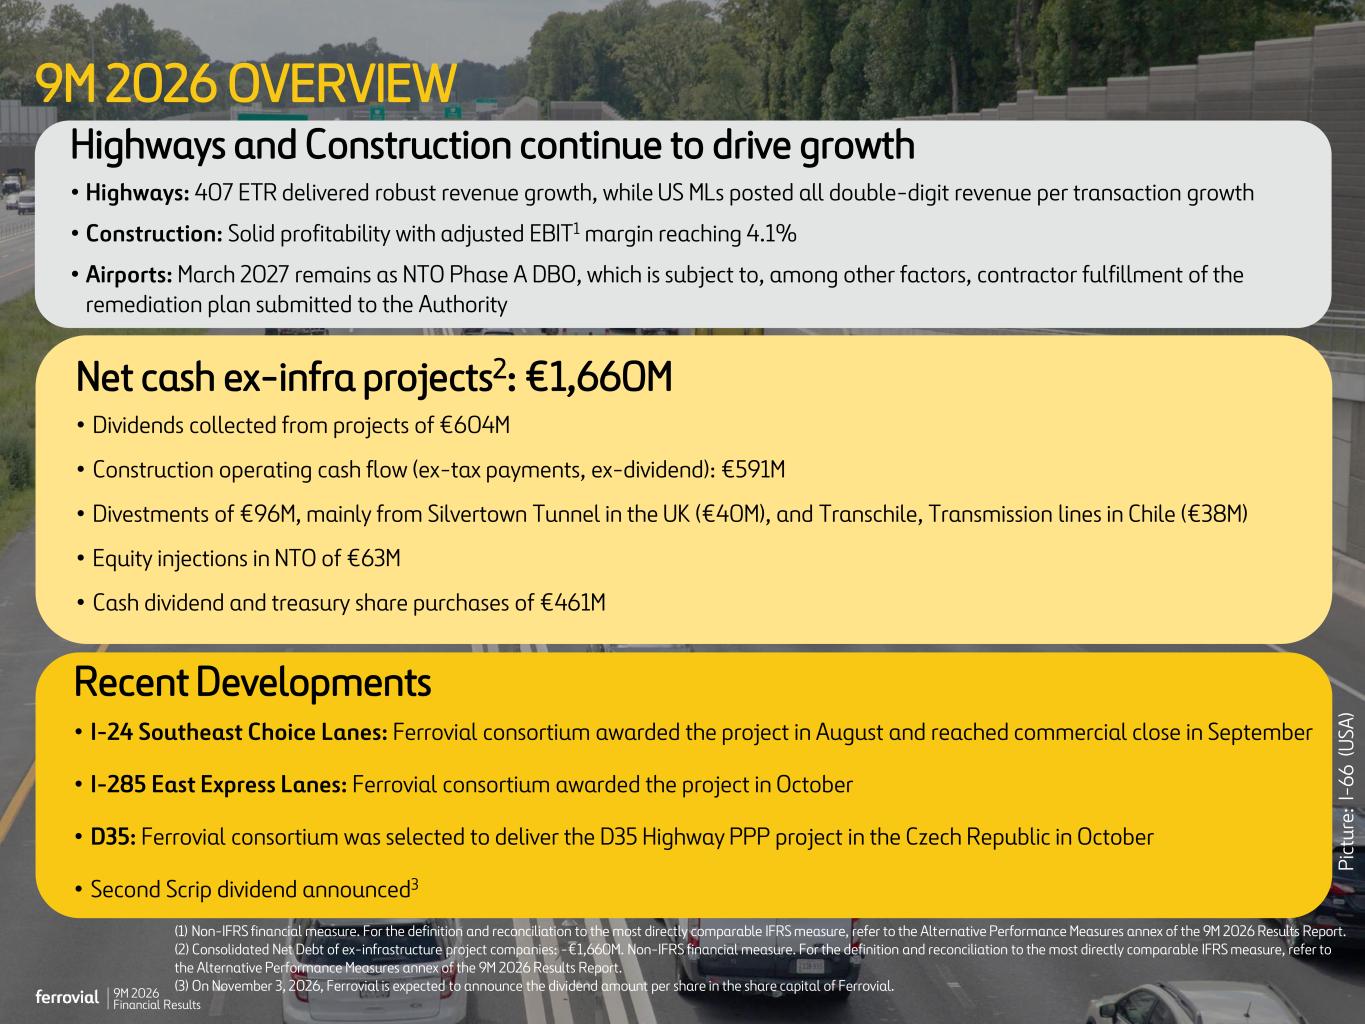
9M 2026 Financial Results 2 9M 2026 OVERVIEW Highways and Construction continue to drive growth • Highways: 407 ETR delivered robust revenue growth, while US MLs posted all double-digit revenue per transaction growth • Construction: Solid profitability with adjusted EBIT1 margin reaching 4.1% • Airports: March 2027 remains as NTO Phase A DBO, which is subject to, among other factors, contractor fulfillment of the remediation plan submitted to the Authority Net cash ex-infra projects2: €1,660M • Dividends collected from projects of €604M • Construction operating cash flow (ex-tax payments, ex-dividend): €591M • Divestments of €96M, mainly from Silvertown Tunnel in the UK (€40M), and Transchile, Transmission lines in Chile (€38M) • Equity injections in NTO of €63M • Cash dividend and treasury share purchases of €461M (1) Non-IFRS financial measure. For the definition and reconciliation to the most directly comparable IFRS measure, refer to the Alternative Performance Measures annex of the 9M 2026 Results Report. (2) Consolidated Net Debt of ex-infrastructure project companies: -€1,660M. Non-IFRS financial measure. For the definition and reconciliation to the most directly comparable IFRS measure, refer to the Alternative Performance Measures annex of the 9M 2026 Results Report. (3) On November 3, 2026, Ferrovial is expected to announce the dividend amount per share in the share capital of Ferrovial. P ic tu re : I- 6 6 ( U SA ) Recent Developments • I-24 Southeast Choice Lanes: Ferrovial consortium awarded the project in August and reached commercial close in September • I-285 East Express Lanes: Ferrovial consortium awarded the project in October • D35: Ferrovial consortium was selected to deliver the D35 Highway PPP project in the Czech Republic in October • Second Scrip dividend announced3
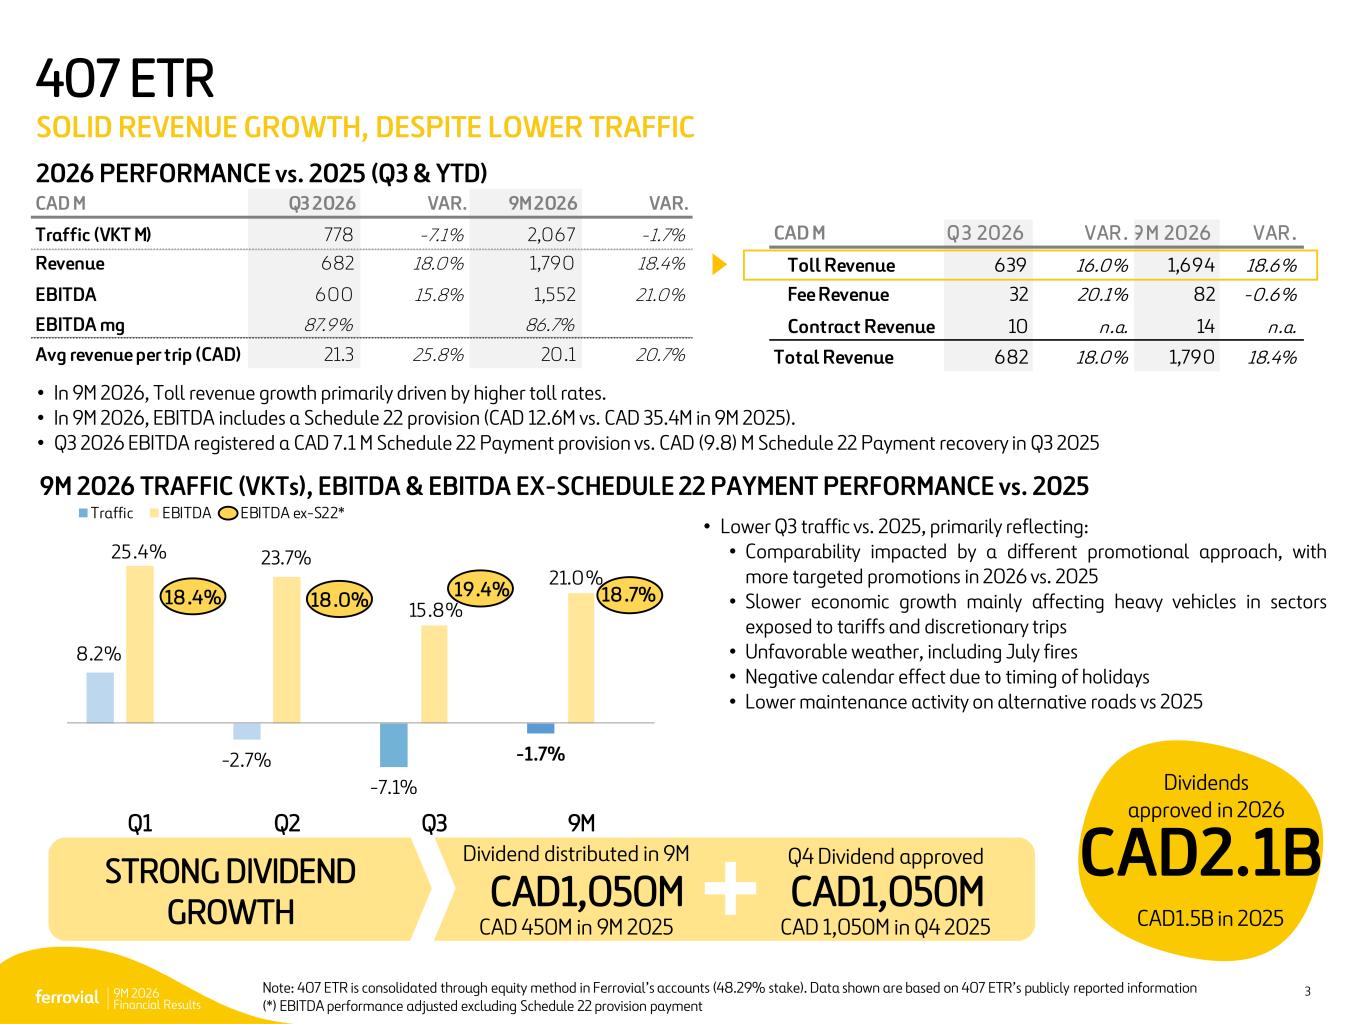
9M 2026 Financial Results 3 2026 PERFORMANCE vs. 2025 (Q3 & YTD) 407 ETR SOLID REVENUE GROWTH, DESPITE LOWER TRAFFIC 9M 2026 TRAFFIC (VKTs), EBITDA & EBITDA EX-SCHEDULE 22 PAYMENT PERFORMANCE vs. 2025 • In 9M 2026, Toll revenue growth primarily driven by higher toll rates. • In 9M 2026, EBITDA includes a Schedule 22 provision (CAD 12.6M vs. CAD 35.4M in 9M 2025). • Q3 2026 EBITDA registered a CAD 7.1 M Schedule 22 Payment provision vs. CAD (9.8) M Schedule 22 Payment recovery in Q3 2025 • Lower Q3 traffic vs. 2025, primarily reflecting: • Comparability impacted by a different promotional approach, with more targeted promotions in 2026 vs. 2025 • Slower economic growth mainly affecting heavy vehicles in sectors exposed to tariffs and discretionary trips • Unfavorable weather, including July fires • Negative calendar effect due to timing of holidays • Lower maintenance activity on alternative roads vs 2025 Note: 407 ETR is consolidated through equity method in Ferrovial’s accounts (48.29% stake). Data shown are based on 407 ETR’s publicly reported information (*) EBITDA performance adjusted excluding Schedule 22 provision payment CAD M Q3 2026 VAR. 9M 2026 VAR. Traffic (VKT M) 778 -7.1% 2,067 -1.7% Revenue 682 18.0% 1,790 18.4% EBITDA 600 15 .8% 1,552 21.0% EBITDA mg 87.9% 86.7% Avg revenue per trip (CAD) 21.3 25 .8% 20.1 20.7% CAD M Q 3 2026 VAR . 9 M 2026 VAR . Toll Revenue 639 16.0% 1,694 18.6% Fee Revenue 32 20.1% 82 -0.6% Contract Revenue 10 n.a. 14 n.a. Total Revenue 682 18.0% 1,790 18.4% CAD2.1B CAD1,050M STRONG DIVIDEND GROWTH Q4 Dividend approved CAD 1,050M in Q4 2025 CAD1,050M Dividend distributed in 9M CAD 450M in 9M 2025 CAD1.5B in 2025 Dividends approved in 2026 8.2% -2.7% -7.1% -1.7% 25.4% 23.7% 15.8% 21.0% 18 .4% 18 .0% 19.4% 18 .7% Q1 Q2 Q3 9M Traffic EBITDA EBITDA ex-S22*
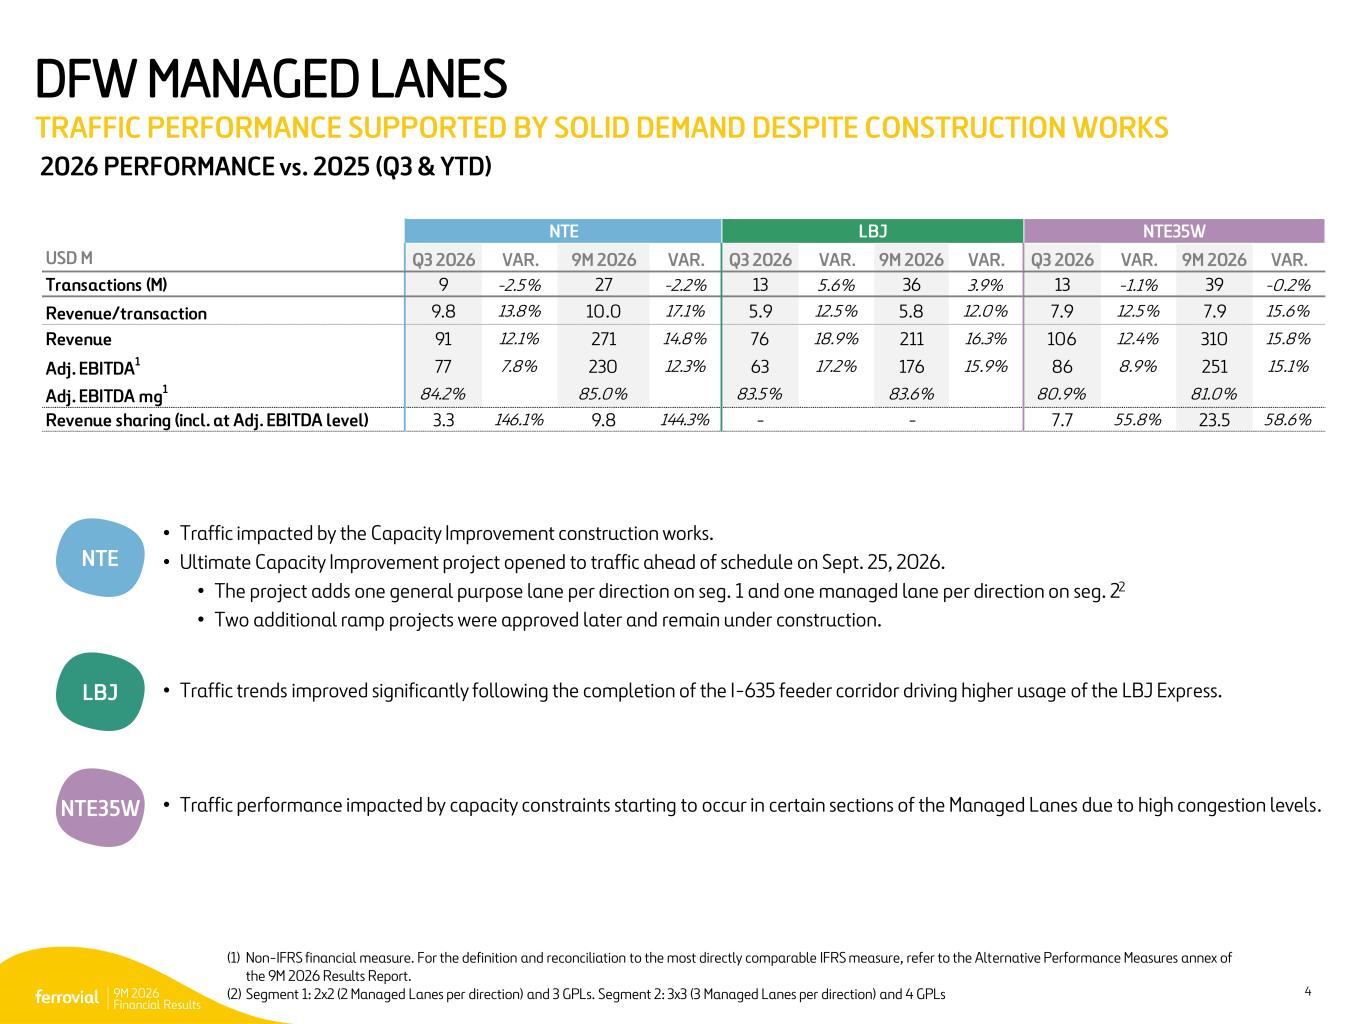
9M 2026 Financial Results 4 2026 PERFORMANCE vs. 2025 (Q3 & YTD) NTE NTE35W LBJ • Traffic trends improved significantly following the completion of the I-635 feeder corridor driving higher usage of the LBJ Express. • Traffic impacted by the Capacity Improvement construction works. • Ultimate Capacity Improvement project opened to traffic ahead of schedule on Sept. 25, 2026. • The project adds one general purpose lane per direction on seg. 1 and one managed lane per direction on seg. 22 • Two additional ramp projects were approved later and remain under construction. • Traffic performance impacted by capacity constraints starting to occur in certain sections of the Managed Lanes due to high congestion levels. (1) Non-IFRS financial measure. For the definition and reconciliation to the most directly comparable IFRS measure, refer to the Alternative Performance Measures annex of the 9M 2026 Results Report. (2) Segment 1: 2x2 (2 Managed Lanes per direction) and 3 GPLs. Segment 2: 3x3 (3 Managed Lanes per direction) and 4 GPLs DFW MANAGED LANES TRAFFIC PERFORMANCE SUPPORTED BY SOLID DEMAND DESPITE CONSTRUCTION WORKS NTE LBJ NTE35W USD M Q3 2026 VAR. 9M 2026 VAR. Q3 2026 VAR. 9M 2026 VAR. Q3 2026 VAR. 9M 2026 VAR. Transactions (M) 9 -2.5% 27 -2.2% 13 5.6% 36 3.9% 13 -1.1% 39 -0.2% Revenue/transaction 9.8 13.8% 10.0 17.1% 5.9 12.5% 5.8 12.0% 7.9 12.5% 7.9 15.6% Revenue 91 12.1% 271 14.8% 76 18.9% 211 16.3% 106 12.4% 310 15.8% Adj. EBITDA 1 77 7.8% 230 12.3% 63 17.2% 176 15.9% 86 8.9% 251 15.1% Adj. EBITDA mg1 84.2% 85.0% 83.5% 83.6% 80.9% 81.0% Revenue sharing (incl. at Adj. EBITDA level) 3.3 146.1% 9.8 144.3% - - 7.7 55.8% 23.5 58.6%
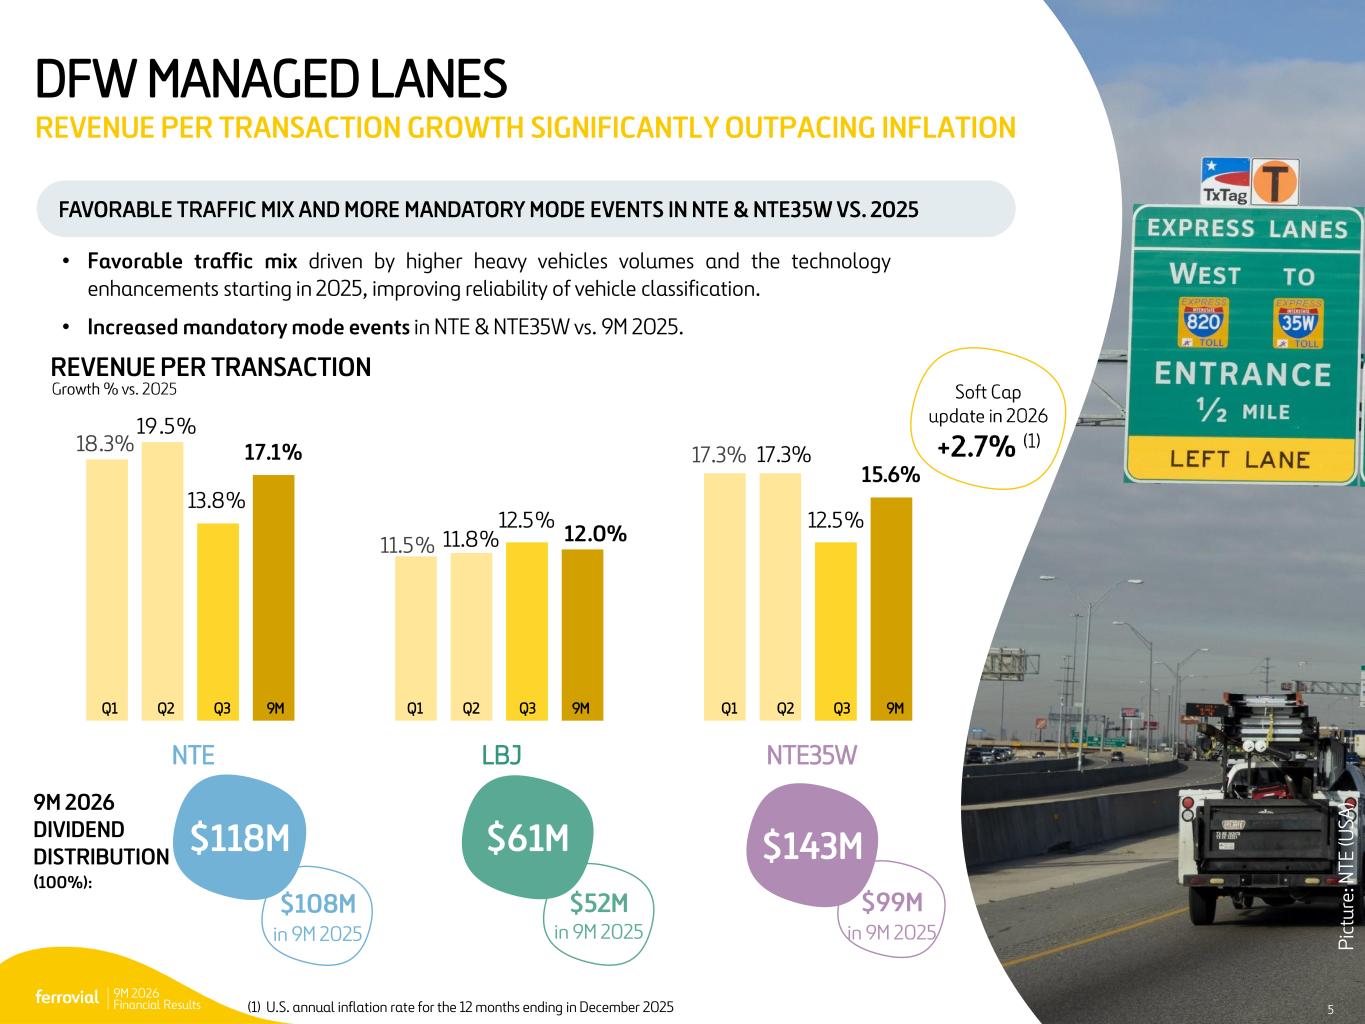
9M 2026 Financial Results 5 P ic : L B J Growth % vs. 2025 REVENUE PER TRANSACTION DFW MANAGED LANES REVENUE PER TRANSACTION GROWTH SIGNIFICANTLY OUTPACING INFLATION FAVORABLE TRAFFIC MIX AND MORE MANDATORY MODE EVENTS IN NTE & NTE35W VS. 2025 P ic tu re : N T E (U SA ) Soft Cap update in 2026 +2.7% (1)18.3% 11.5% 17.3% 19.5% 11.8% 17.3% 13.8% 12.5% 12.5% 17.1% 12.0% 15.6% Q1 Q2 Q3 9M NTE LBJ NTE35W • Favorable traffic mix driven by higher heavy vehicles volumes and the technology enhancements starting in 2025, improving reliability of vehicle classification. • Increased mandatory mode events in NTE & NTE35W vs. 9M 2025. (1) U.S. annual inflation rate for the 12 months ending in December 2025 5 Q1 Q2 Q3 9M Q1 Q2 Q3 9M 9M 2026 DIVIDEND DISTRIBUTION (100%): $118M $61M $143M $108M in 9M 2025 $52M in 9M 2025 $99M in 9M 2025
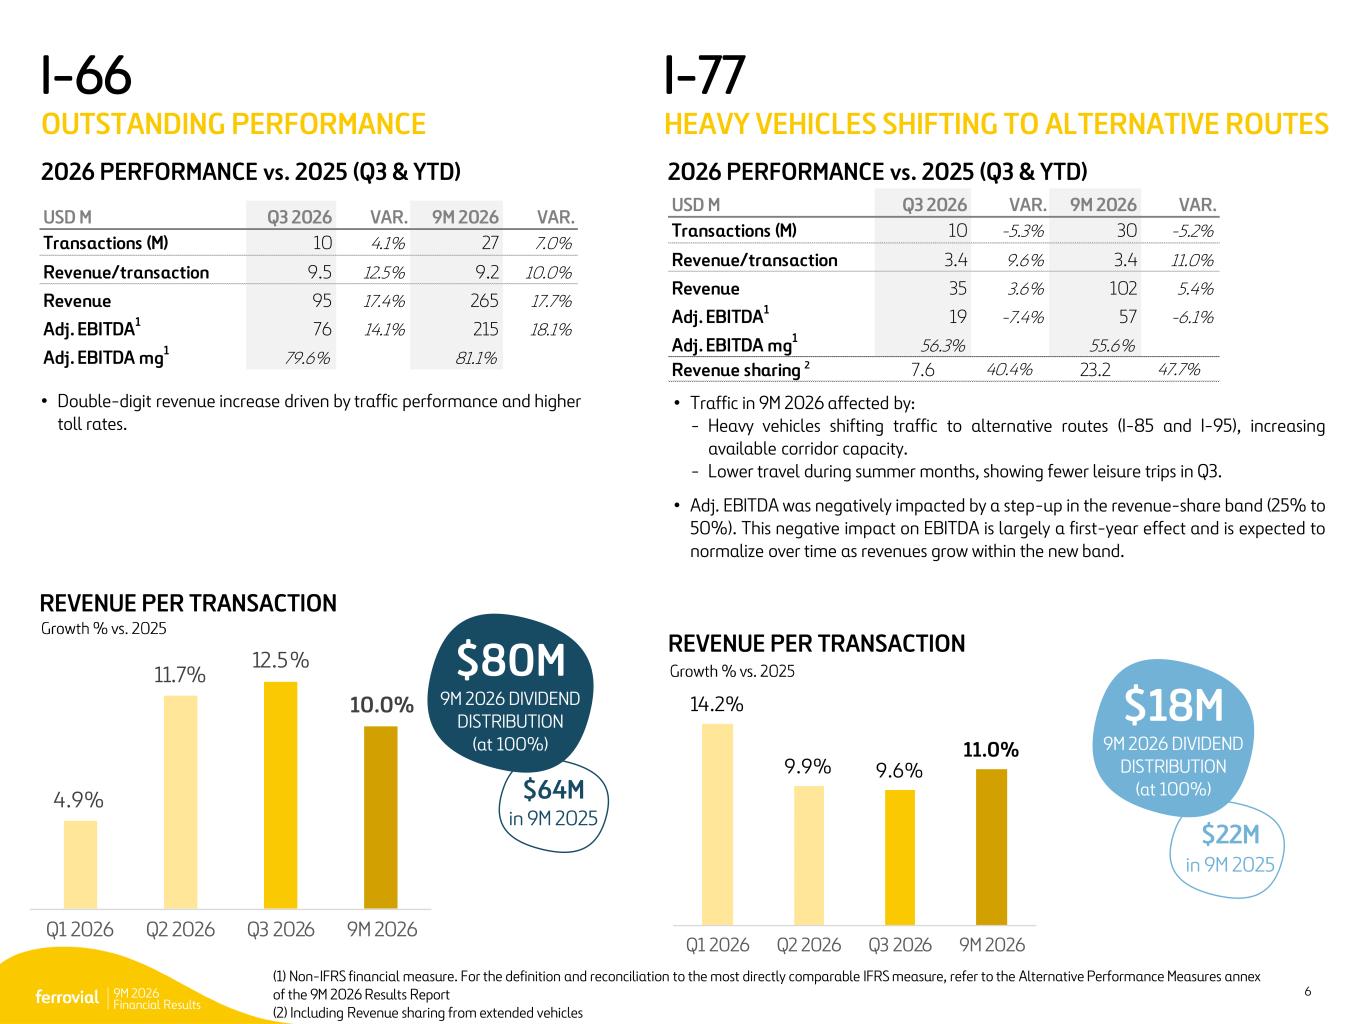
9M 2026 Financial Results 6 I-77 HEAVY VEHICLES SHIFTING TO ALTERNATIVE ROUTES (1) Non-IFRS financial measure. For the definition and reconciliation to the most directly comparable IFRS measure, refer to the Alternative Performance Measures annex of the 9M 2026 Results Report (2) Including Revenue sharing from extended vehicles 2026 PERFORMANCE vs. 2025 (Q3 & YTD) • Traffic in 9M 2026 affected by: - Heavy vehicles shifting traffic to alternative routes (I-85 and I-95), increasing available corridor capacity. - Lower travel during summer months, showing fewer leisure trips in Q3. • Adj. EBITDA was negatively impacted by a step-up in the revenue-share band (25% to 50%). This negative impact on EBITDA is largely a first-year effect and is expected to normalize over time as revenues grow within the new band. REVENUE PER TRANSACTION I-66 OUTSTANDING PERFORMANCE 2026 PERFORMANCE vs. 2025 (Q3 & YTD) REVENUE PER TRANSACTION • Double-digit revenue increase driven by traffic performance and higher toll rates. 14.2% 9.9% 9.6% 11.0% Q1 2026 Q2 2026 Q3 2026 9M 2026 4.9% 11.7% 12.5% 10.0% Q1 2026 Q2 2026 Q3 2026 9M 2026 Growth % vs. 2025 Growth % vs. 2025 USD M Q3 2026 VAR. 9M 2026 VAR. Transactions (M) 10 4.1% 27 7.0% Revenue/transaction 9.5 12.5% 9.2 10.0% Revenue 95 17.4% 265 17.7% Adj. EBITDA1 76 14.1% 215 18.1% Adj. EBITDA mg 1 79.6% 81.1% USD M Q3 2026 VAR. 9M 2026 VAR. Transactions (M) 10 -5.3% 30 -5.2% Revenue/transaction 3.4 9.6% 3.4 11.0% Revenue 35 3.6% 102 5.4% Adj. EBITDA1 19 -7.4% 57 -6.1% Adj. EBITDA mg1 56.3% 55.6% Revenue sharing 2 7.6 40.4% 23.2 47.7% $18M 9M 2026 DIVIDEND DISTRIBUTION (at 100%) $80M 9M 2026 DIVIDEND DISTRIBUTION (at 100%) $22M in 9M 2025 $64M in 9M 2025
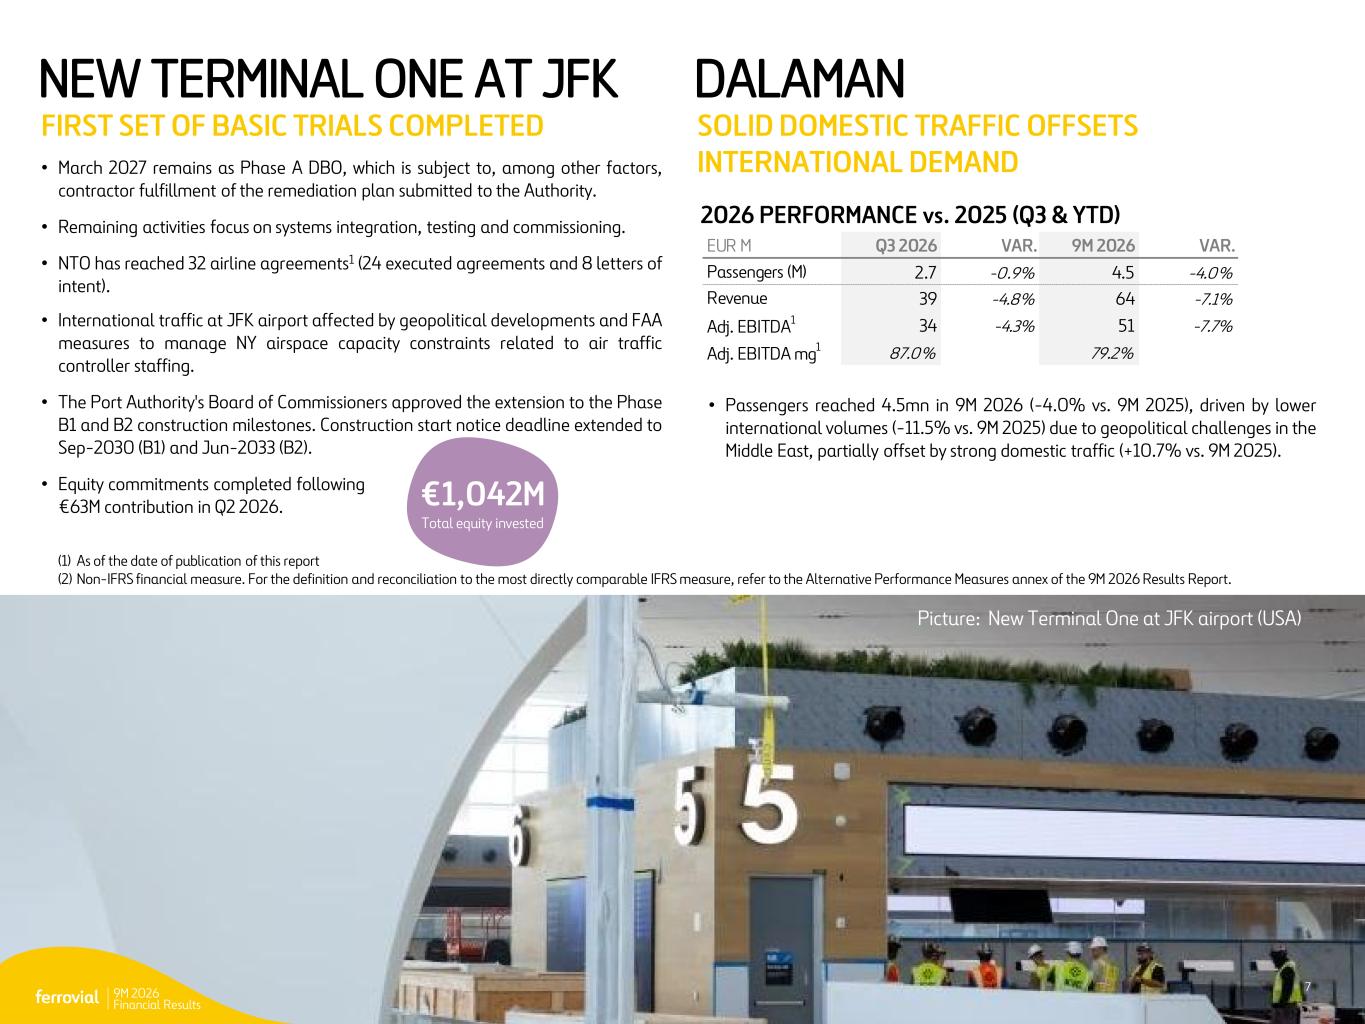
9M 2026 Financial Results 7 NEW TERMINAL ONE AT JFK FIRST SET OF BASIC TRIALS COMPLETED DALAMAN SOLID DOMESTIC TRAFFIC OFFSETS INTERNATIONAL DEMAND • Passengers reached 4.5mn in 9M 2026 (-4.0% vs. 9M 2025), driven by lower international volumes (-11.5% vs. 9M 2025) due to geopolitical challenges in the Middle East, partially offset by strong domestic traffic (+10.7% vs. 9M 2025). • March 2027 remains as Phase A DBO, which is subject to, among other factors, contractor fulfillment of the remediation plan submitted to the Authority. • Remaining activities focus on systems integration, testing and commissioning. • NTO has reached 32 airline agreements1 (24 executed agreements and 8 letters of intent). • International traffic at JFK airport affected by geopolitical developments and FAA measures to manage NY airspace capacity constraints related to air traffic controller staffing. • The Port Authority's Board of Commissioners approved the extension to the Phase B1 and B2 construction milestones. Construction start notice deadline extended to Sep-2030 (B1) and Jun-2033 (B2). • Equity commitments completed following €63M contribution in Q2 2026. (1) As of the date of publication of this report (2) Non-IFRS financial measure. For the definition and reconciliation to the most directly comparable IFRS measure, refer to the Alternative Performance Measures annex of the 9M 2026 Results Report. P ic tu re : N ew T er m in a l O n e, N Y (U SA ) 2026 PERFORMANCE vs. 2025 (Q3 & YTD) EUR M Q3 2026 VAR. 9M 2026 VAR. Passengers (M) 2.7 -0.9% 4.5 -4.0% Revenue 39 -4.8% 64 -7.1% Adj. EBITDA1 34 -4.3% 51 -7.7% Adj. EBITDA mg1 87.0% 79.2% €1,042M Total equity invested 7 Picture: New Terminal One at JFK airport (USA)
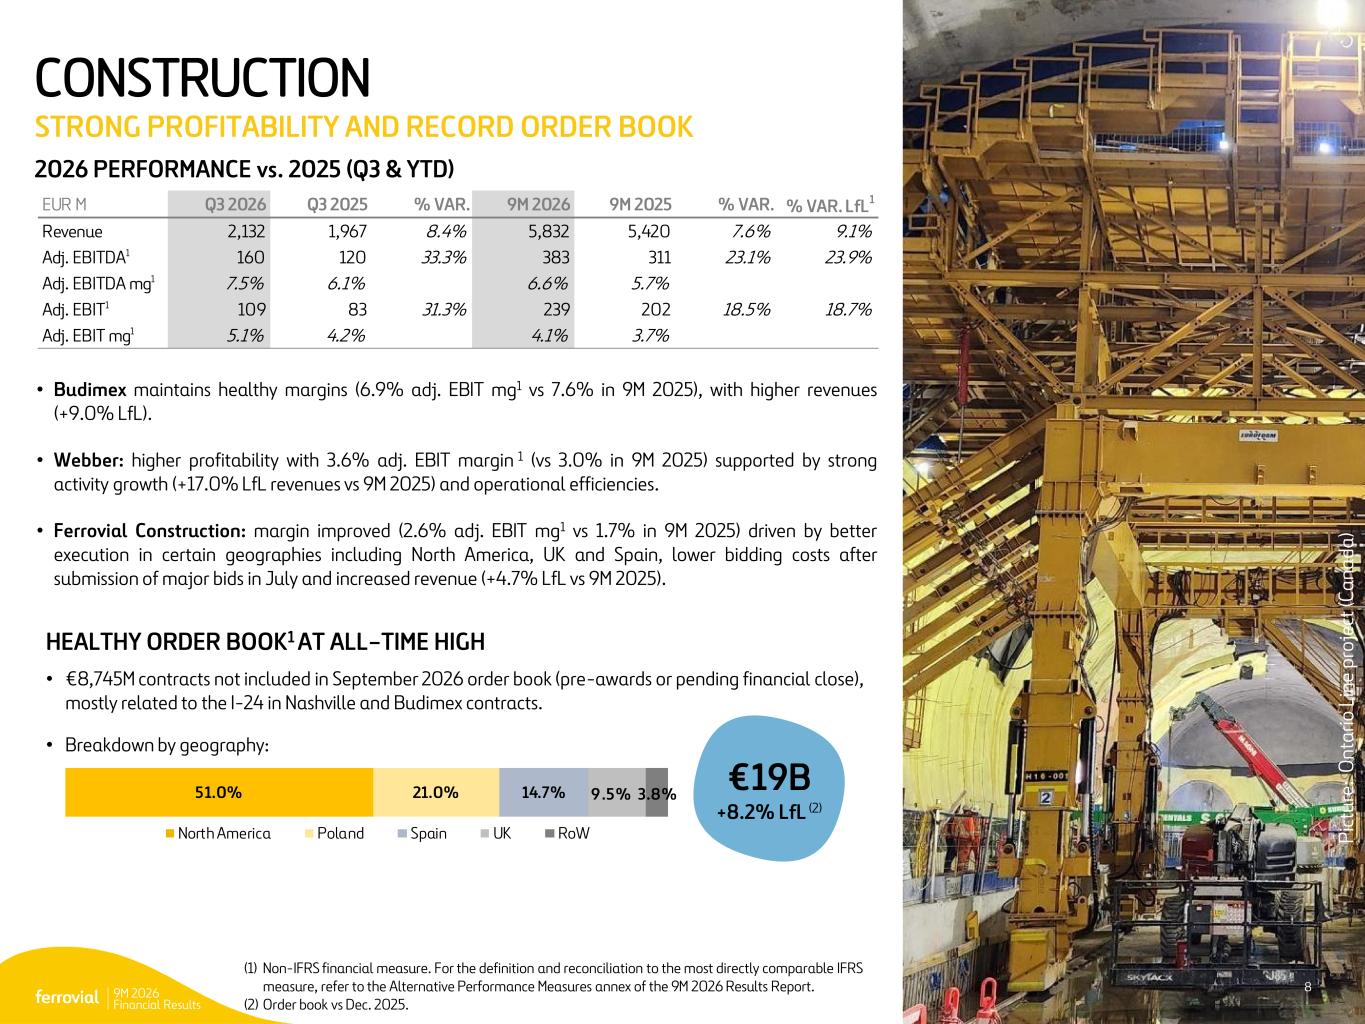
9M 2026 Financial Results 8 CONSTRUCTION STRONG PROFITABILITY AND RECORD ORDER BOOK HEALTHY ORDER BOOK1 AT ALL–TIME HIGH • €8,745M contracts not included in September 2026 order book (pre-awards or pending financial close), mostly related to the I-24 in Nashville and Budimex contracts. • Breakdown by geography: • Budimex maintains healthy margins (6.9% adj. EBIT mg1 vs 7.6% in 9M 2025), with higher revenues (+9.0% LfL). • Webber: higher profitability with 3.6% adj. EBIT margin 1 (vs 3.0% in 9M 2025) supported by strong activity growth (+17.0% LfL revenues vs 9M 2025) and operational efficiencies. • Ferrovial Construction: margin improved (2.6% adj. EBIT mg1 vs 1.7% in 9M 2025) driven by better execution in certain geographies including North America, UK and Spain, lower bidding costs after submission of major bids in July and increased revenue (+4.7% LfL vs 9M 2025). 8 2026 PERFORMANCE vs. 2025 (Q3 & YTD) €19B +8.2% LfL (2) (1) Non-IFRS financial measure. For the definition and reconciliation to the most directly comparable IFRS measure, refer to the Alternative Performance Measures annex of the 9M 2026 Results Report. (2) Order book vs Dec. 2025. P ic tu re : O n ta ri o L in e pr o je ct (C a n a da ) 51.0% 21.0% 14.7% 9.5% 3.8% North America Poland Spain UK RoW EUR M Q3 2026 Q3 2025 % VAR. 9M 2026 9M 2025 % VAR. % VAR. LfL1 Revenue 2,132 1,967 8.4% 5,832 5,420 7.6% 9.1% Adj. EBITDA1 160 120 33.3% 383 311 23.1% 23.9% Adj. EBITDA mg1 7.5% 6.1% 6.6% 5.7% Adj. EBIT1 109 83 31.3% 239 202 18.5% 18.7% Adj. EBIT mg1 5.1% 4.2% 4.1% 3.7%
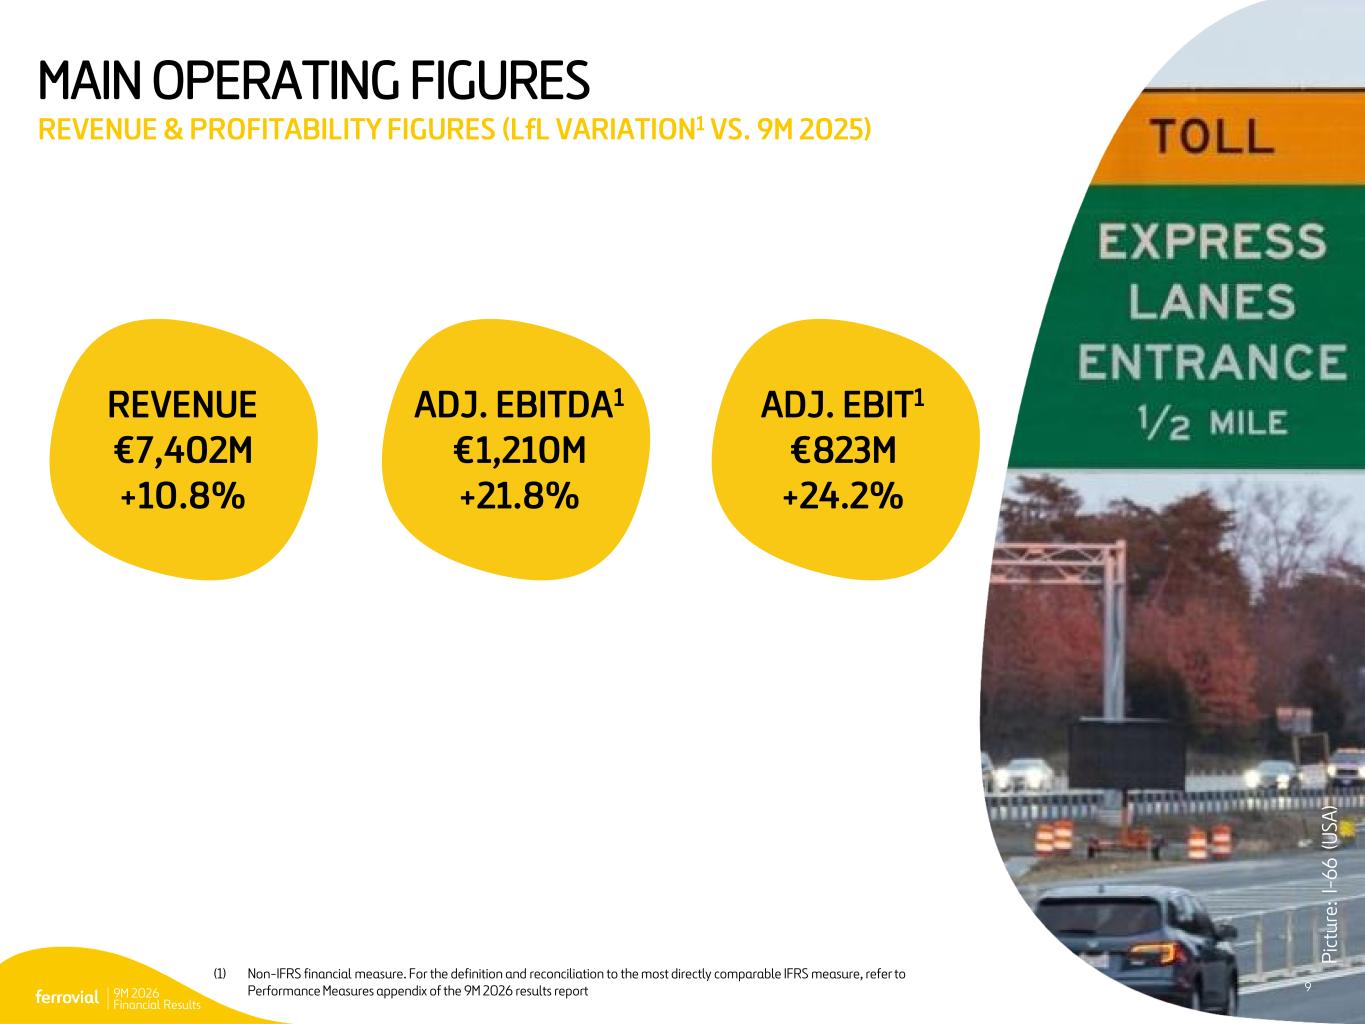
9M 2026 Financial Results 9 (1) Non-IFRS financial measure. For the definition and reconciliation to the most directly comparable IFRS measure, refer to the Alternative Performance Measures appendix of the 9M 2026 results report MAIN OPERATING FIGURES REVENUE & PROFITABILITY FIGURES (LfL VARIATION1 VS. 9M 2025) P ic tu re : I- 6 6 ( U SA ) 9 REVENUE €7,402M +10.8% ADJ. EBITDA1 €1,210M +21.8% ADJ. EBIT1 €823M +24.2%
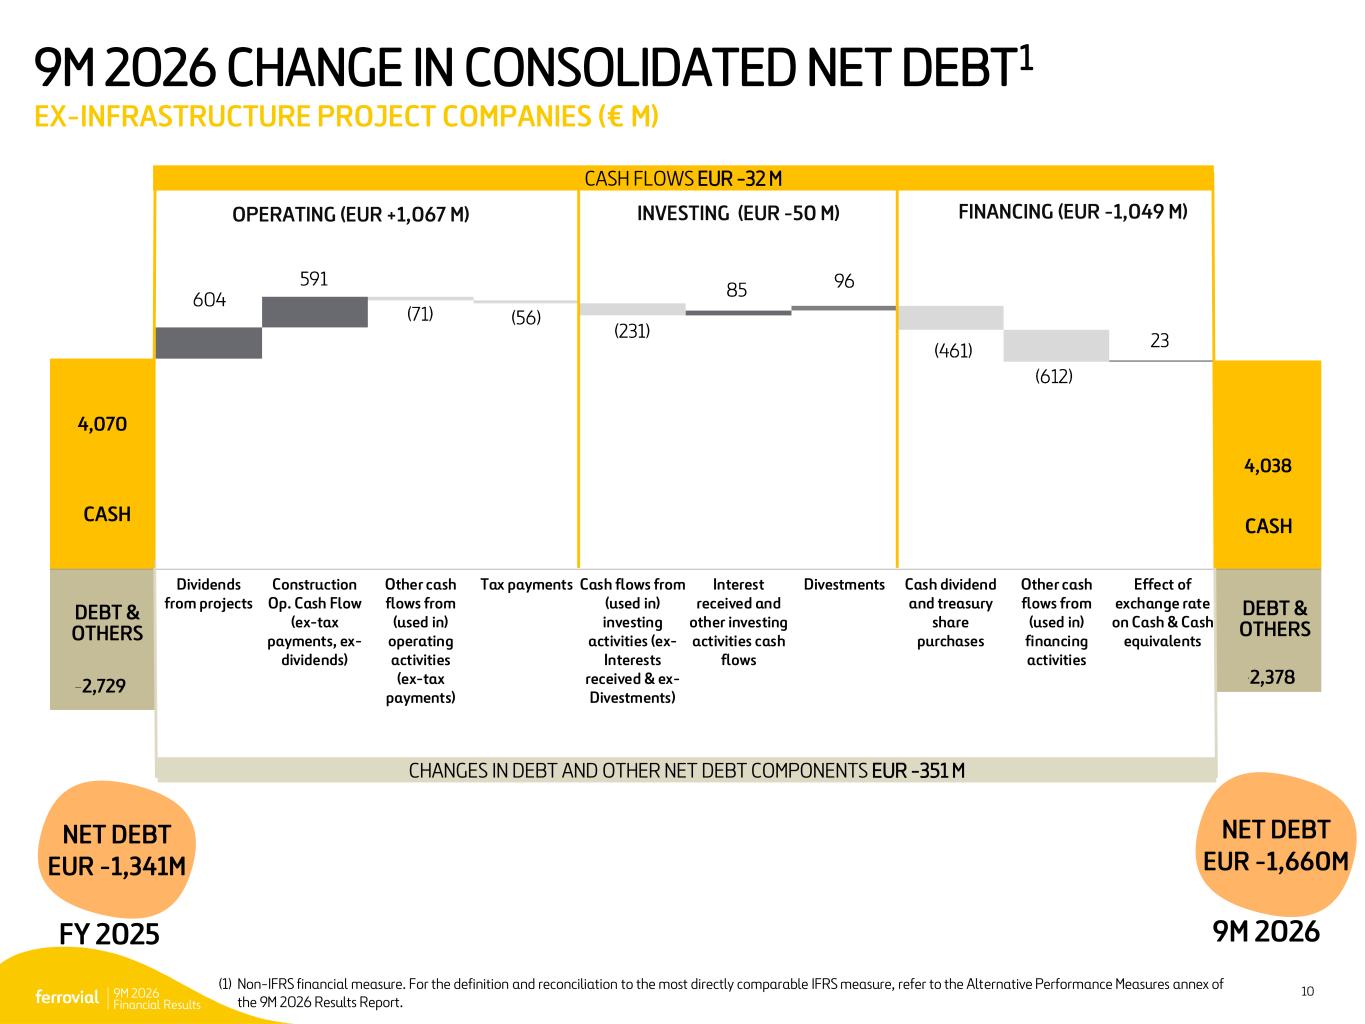
9M 2026 Financial Results 10 9M 2026 CHANGE IN CONSOLIDATED NET DEBT1 EX-INFRASTRUCTURE PROJECT COMPANIES (€ M) (1) Non-IFRS financial measure. For the definition and reconciliation to the most directly comparable IFRS measure, refer to the Alternative Performance Measures annex of the 9M 2026 Results Report. - 2,729 4,038 4,070 604 591 (71) (56) (231) 85 96 (461) (612) 23 - 2,378 Dividends from projects Construction Op. Cash Flow (ex-tax payments, ex- dividends) Other cash flows from (used in) operating activities (ex-tax payments) Tax payments Cash flows from (used in) investing activities (ex- Interests received & ex- Divestments) Interest received and other investing activities cash flows Divestments Cash dividend and treasury share purchases Other cash flows from (used in) financing activities Effect of exchange rate on Cash & Cash equivalents CASH FLOWS EUR -32 M FINANCING (EUR -1,049 M)INVESTING (EUR -50 M)OPERATING (EUR +1,067 M) NET DEBT EUR -1,341M CASH CASH DEBT & OTHERS DEBT & OTHERS CHANGES IN DEBT AND OTHER NET DEBT COMPONENTS EUR -351 M FY 2025 9M 2026 NET DEBT EUR -1,660M

9M 2026 Financial Results 11 P ic tu re : N T E (U SA ) Q&A
9M 2026 Financial Results 12 DISCLAIMER This presentation has been produced by Ferrovial N.V. (the “Company”, “we” or “us” and, together with its subsidiaries, the “Group”) for the sole purpose expressed herein. By accessing this presentation, you acknowledge that you have read and understood the following statements. Neither this presentation nor any of the information contained herein constitute or form part of, and should not be construed as, an offer to purchase, sale or exchange any security, a solicitation of any offer to purchase, sale or exchange any security, or a recommendation or advice regarding any security of the Company. In this presentation, unless otherwise specified, the terms “Ferrovial,” the “Company,” “we,” “us,” and the “Group” refer to Ferrovial N.V., individually or together with its consolidated subsidiaries, as the context may require. Neither this presentation nor the historical performance of the Group’s management team or the Group constitutes a guarantee of the future performance of the Company and there can be no assurance that the Group’s management team will be successful in implementing the investment strategy of the Group. Forward-Looking Statements This presentation contains forward-looking statements. Any express or implied statements contained in this presentation that are not statements of historical fact may be deemed to be forward-looking statements, including, without limitation, statements regarding estimates and projections with respect to the Company’s financial position, business strategy, plans, and objectives of management for future operations, dividends, capital structure, Company and joint venture project performance and completion estimates, order book, and pipeline assets, as well as statements that include the words “expect,” “aim,” “intend,” “plan,” “believe,” “project,” “forecast,” “estimate,” “may,” “will”, “should,” “target,” “anticipate” and similar statements of a future or forward-looking nature, or the negative of these terms or other similar expressions, although not all forward-looking statements contain these words. Such statements may reflect various assumptions by the Company concerning anticipated results or performance and are subject to significant business, economic and competitive uncertainties and contingencies, and known and unknown risks, many of which are beyond the Company’s control and may be impossible to predict. Any forecast made or contained herein, and actual results or performance, will likely vary and those variations may be material. The Company makes no representation or warranty as to the accuracy or completeness of such statements, expectations, estimates and projections contained in this presentation or that any forecast made or contained herein will be achieved. Risks and uncertainties that could cause actual results to differ include, without limitation: risks related to our diverse geographical operations and business divisions; general economic and political conditions and events and the impact they may have on us, including, but not limited to, impacts on demand or public fund allocation in the industries in which we operate, volatility or increases in inflation rates and rates of interest, exchange rate fluctuations, increased costs and availability of materials, and other ongoing impacts including from, for example, changes in tariff regimes, the Russia/Ukraine conflict, and the Middle East conflict; our legal and regulatory risks given that we operate in highly regulated environments, and the impact of any changes in governmental laws and regulations, including but not limited to tax regimes or regulations; the fact that our business is derived from a small number of major projects; risks related to government contracting; the impact of competitive pressures in our industries, including on bid success and pricing; risks related to our acquisitions, divestments and other strategic transactions that we may undertake; cyber threats or other technology disruptions; our ability accurately to develop estimates or the impact of changes in our underlying assumptions, with respect to project plans, including project timing and budgets, macroeconomic and demographic factors, and our ability to meet contractual expectations with respect thereto; the impacts of accidents, disruptions, or other incidents at our project sites and facilities; our ability to obtain adequate financing or access to capital in the future as needed and the impact of reliance on joint venture and partnership arrangements; our reliance on and ability to locate, select, monitor, and manage subcontractors and service providers; the impact of certain swaps and hedging arrangements we enter into from time to time; limitations on our ability to declare and fund future dividends or other distributions, and distribution processes and timelines; our ability to maintain compliance with the continued listing requirements of the Nasdaq Global Select Market and the Spanish Stock Exchanges; lawsuits and other claims by third parties or investigations by various regulatory agencies that we may be subject to; our ability to comply with our ESG commitments or other sustainability demands, including changing or conflicting expectations in connection with sustainability and ESG matters; physical and transitional risks in connection with the impacts of climate change; risks related to the adequacy or existence of our insurance coverage and any non-recoverable losses; and the other important factors discussed under the caption “Risk Factors” in our Annual Report on Form 20-F filed with the U.S. Securities and Exchange Commission (“SEC”) for the fiscal year ended December 31, 2025 which is available on the SEC website at www.sec.gov, as such factors may be updated from time to time in our other filings with the SEC. Any forward-looking statements contained in this presentation speak only as of the date hereof and accordingly undue reliance should not be placed on such statements. We disclaim any obligation or undertaking to update or revise any forward-looking statements contained in this presentation, whether as a result of new information, future events or otherwise, other than to the extent required by applicable law. Forward- looking statements in this presentation are made pursuant to the safe harbor provisions contained in the U.S. Private Securities Litigation Reform Act of 1995. We intend such forward-looking statements to be covered by relevant safe harbor provisions for forward-looking statements (or their equivalent) of any applicable jurisdiction. In addition, certain industry data and information contained in this presentation has been derived from industry or other third-party sources. The Company has not undertaken any independent investigation to confirm the accuracy or completeness of such data and information, some of which may be based on estimates and subjective judgments. Accordingly, the Company makes no representation or warranty as to the accuracy or completeness of such data and information. Other than as specified, the information contained in this presentation has not been audited, reviewed or verified by the external auditor of the Group. The information contained herein should therefore be considered as a whole and in conjunction with all the other publicly available information regarding the Group. Alternative Performance Measures and Non-IFRS Measures In addition to the financial information prepared under the International Financial Reporting Standards (“IFRS”), this presentation may include certain alternative performance measures (“APMs”) as defined in the Guidelines on Alternative Performance Measures issued by the European Securities and Markets Authority on 5 October 2015, and other financial or operational measures that are not presented in accordance with IFRS (collectively, "non-IFRS measures") that differ from financial information presented by the Group in its financial statements and reports containing financial information. The aforementioned non-IFRS measures include “Adjusted EBIT,” “Adjusted EBIT Margin,” “Adjusted EBITDA,” “Adjusted EBITDA Margin,” “Comparable or ‘Like-for-Like’ (‘LfL’) Growth,” “Order Book,” “Consolidated Net Debt,” “Cash flows excluding infrastructure projects (Ex-Infrastructure Cash Flows),” Cash flows from infrastructure projects (Infrastructure Cash Flows),” and “Ex-Infrastructure Liquidity.” These non-IFRS measures are designed to complement and should not be considered superior to measures calculated in accordance with IFRS. Although the aforementioned non-IFRS measures are not measures of operating performance, an alternative to cash flows, or a measure of financial position under IFRS, they are used by the Group’s management to review operating performance and profitability, for decision-making purposes, and to allocate resources. Moreover, some of these non-IFRS measures, such as “Consolidated Net Debt” are used by the Group’s management to explain the evolution of our global indebtedness and to assist our management in making decisions related to our financial structure and they may be, and in some cases are used by analysts and rating agencies to better understand the indebtedness that has recourse to the Group. Non-IFRS measures presented in this presentation are being provided for informative purposes only and should not be construed as investment, financial, or other advice. The Group believes that there are certain non-IFRS measures, which are used by the Group’s management in making financial, operational and planning decisions, which provide useful financial information that should be considered in addition to the financial statements prepared in accordance with the accounting regulations that applies (IFRS EU), in assessing its performance. We believe, these are generally consistent with the main indicators used by the community of analysts and investors in the capital markets, however, they do not have any standardized meaning and are therefore unlikely to be comparable to similarly titled measures presented by other companies. They have not been audited, reviewed or verified by the external auditor of the Group. For further details on the definition, explanation on the use, and reconciliation of non- IFRS measures, please see the section on “Alternative performance measures” in the Company’s Integrated Annual Report (including the Consolidated Financial Statements and Management Report) for the year ended December 31, 2025. Additional Information The Company is subject to the information and reporting requirements of the Securities Exchange Act of 1934, as amended, applicable to foreign private issuers and in accordance therewith is required to file reports and other information with the SEC relating to its business, financial condition, and other matters. The Company's filings can be accessed by visiting EDGAR on the SEC's website at www.sec.gov. This report contains inside information within the meaning of article 7(1) of the Regulation (EU) Nº 596/2014, of the European Parliament and of the Council, of 16 April 2014, on market abuse.
9M 2026 Financial Results 13 INVESTOR RELATIONS +34 91 586 25 65 +31 207 983 700 ir@ferrovial.com www.ferrovial.com P ic tu re : N T E (U SA )