
Investor Presentation I-85 interchange I-285E Express Lanes October 28, 2026
2 D I S C L A I M E R This presentation has been produced by Ferrovial N.V. (the “Company”, “we” or “us” and, together with its subsidiaries, the “Group”) for the sole purpose expressed herein. By accessing this presentation, you acknowledge that you have read and understood the following statements. Neither this presentation nor any of the information contained herein constitute or form part of, and should not be construed as, an offer to purchase, sale or exchange any security, a solicitation of any offer to purchase, sale or exchange any security, or a recommendation or advice regarding any security of the Company. In this presentation, unless otherwise specified, the terms “Ferrovial,” the “Company,” “we,” “us,” and the “Group” refer to Ferrovial N.V., individually or together with its consolidated subsidiaries, as the context may require (or, unless stated otherwise, if referring to the period prior to the completion of the cross-border merger on June 16, 2023, to Ferrovial, S.A., the former parent entity of the Group, individually or together with its consolidated subsidiaries, as the context may require). Neither this presentation nor the historical performance of the Group’s management team or the Group constitutes a guarantee of the future performance of the Company and there can be no assurance that the Group’s management team will be successful in implementing the investment strategy of the Group. Forward-Looking Statements This presentation contains forward-looking statements. Any express or implied statements contained in this presentation that are not statements of historical fact may be deemed to be forward-looking statements, including, without limitation, statements regarding estimates and projections provided by the Company and certain other sources with respect to the Company’s financial position, business strategy, plans, and objectives of management for future operations, dividends, capital structure, as well as statements that include the words “expect,” “aim,” “intend”, “seek”,” “plan,” “believe,” “project,” “forecast,” “estimate,” “may,” “will”, “should,” “target,” “anticipate” and similar statements of a future or forward-looking nature, or the negative of these terms or other similar expressions, although not all forward-looking statements contain these words. Such statements include, without limitation, statements regarding financial close, development period, service commencement, future phases, financial terms, interest rates, population, GDP growth, household income, economic factors, traffic levels, connectivity, pricing, user adoption and return targets. Forward-looking statements in this presentation may reflect various assumptions by the Company concerning anticipated results and are subject to significant business, economic and competitive uncertainties and contingencies, and known and unknown risks, many of which are beyond the Company’s control and may be impossible to predict, including as a result of macroeconomic factors, traffic levels, pricing, user adoption and future phases. Any forecast made or contained herein, and actual results, will likely vary and those variations may be material. The Company makes no representation or warranty as to the accuracy or completeness of such statements, expectations, estimates and projections contained in this presentation or that any forecast made or contained herein will be achieved. Risks and uncertainties that could cause actual results to differ include, without limitation: changes in macroeconomic conditions, changes in financial, economic and tax policies, such as a decrease in fund allocation towards projects, regulatory changes, termination or amendment of projects, construction delays, operational disruptions, natural or man-made disasters and health emergencies, flaws in estimates or changes in underlying assumptions, or amendments to project plans, public or private tenders, and any failure to meet construction project deadlines or budgets, accidents, competition, not delivering expected performance, performance of subcontractors and service providers, and the other important factors discussed under the caption “Risk Factors” in our Annual Report on Form 20-F filed with the U.S. Securities and Exchange Commission (“SEC”) for the fiscal year ended December 31, 2025, which is available on the SEC website at www.sec.gov, as such factors may be updated from time to time in our other filings with the SEC. Any forward-looking statements contained in this presentation speak only as of the date hereof and accordingly undue reliance should not be placed on such statements. We disclaim any obligation or undertaking to update or revise any forward-looking statements contained in this presentation, whether as a result of new information, future events or otherwise, other than to the extent required by applicable law. Forward looking statements in this presentation are made pursuant to the safe harbor provisions contained in the U.S. Private Securities Litigation Reform Act of 1995. We intend such forward-looking statements to be covered by relevant safe harbor provisions for forward-looking statements (or their equivalent) of any applicable jurisdiction. In addition, certain industry data and other information contained in this presentation has been derived from industry or other third- party sources. The Company has not undertaken any independent investigation to confirm the accuracy or completeness of such data and information, some of which may be based on estimates and subjective judgments. Accordingly, the Company makes no representation or warranty as to the accuracy or completeness of such data and information. Other than as specified, the information contained in this presentation has not been audited, reviewed or verified by the external auditor of the Group. The information contained herein should therefore be considered as a whole and in conjunction with all the other publicly available information regarding the Group. Additional Information The Company is subject to the information and reporting requirements of the Securities Exchange Act of 1934, as amended, applicable to foreign private issuers and in accordance therewith is required to file reports and other information with the SEC relating to its business, financial condition, and other matters. The Company's filings can be accessed by visiting EDGAR on the SEC's website at www.sec.gov.
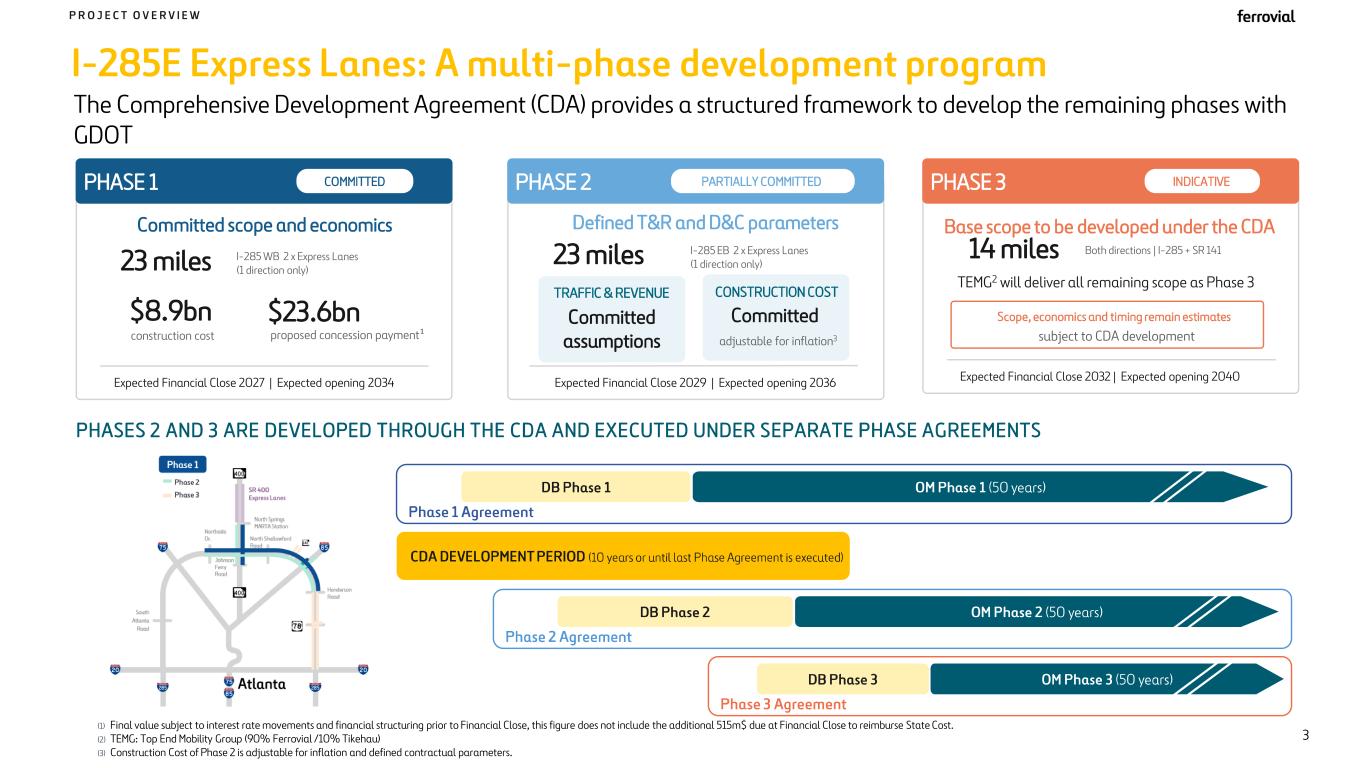
I-285E Express Lanes: A multi-phase development program P R O J E C T O V E R V I E W The Comprehensive Development Agreement (CDA) provides a structured framework to develop the remaining phases with GDOT 3 Phase 1 Agreement DB Phase 1 OM Phase 1 (50 years) CDA DEVELOPMENT PERIOD (10 years or until last Phase Agreement is executed) Phase 2 Agreement DB Phase 2 OM Phase 2 (50 years) PHASES 2 AND 3 ARE DEVELOPED THROUGH THE CDA AND EXECUTED UNDER SEPARATE PHASE AGREEMENTS (1) Final value subject to interest rate movements and financial structuring prior to Financial Close, this figure does not include the additional 515m$ due at Financial Close to reimburse State Cost. (2) TEMG: Top End Mobility Group (90% Ferrovial /10% Tikehau) (3) Construction Cost of Phase 2 is adjustable for inflation and defined contractual parameters. PHASE 1 COMMITTED Committed scope and economics 23 miles I-285 WB 2 x Express Lanes (1 direction only) $8.9bn construction cost $23.6bn proposed concession payment¹ Expected Financial Close 2027 | Expected opening 2034 PHASE 2 PARTIALLY COMMITTED Defined T&R and D&C parameters 23 miles I-285 EB 2 x Express Lanes (1 direction only) PHASE 3 INDICATIVE Base scope to be developed under the CDA 14 miles Both directions | I-285 + SR 141 Expected Financial Close 2029 | Expected opening 2036 Expected Financial Close 2032 | Expected opening 2040 TRAFFIC & REVENUE CONSTRUCTION COST Committed assumptions Committed adjustable for inflation3 Scope, economics and timing remain estimates subject to CDA development TEMG2 will deliver all remaining scope as Phase 3 Phase 3 Agreement DB Phase 3 OM Phase 3 (50 years)
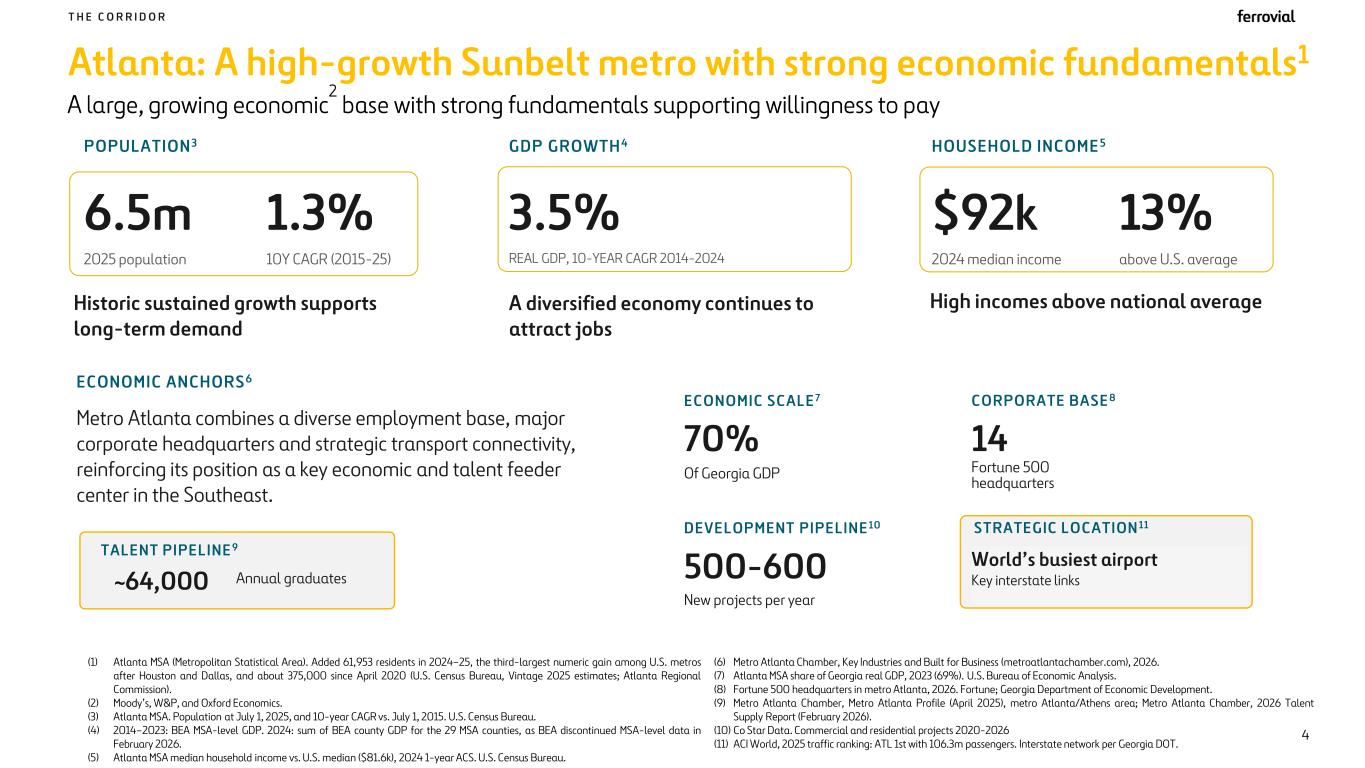
Atlanta: A high-growth Sunbelt metro with strong economic fundamentals1 A large, growing economic 2 base with strong fundamentals supporting willingness to pay T H E C O R R I D O R 4 (1) Atlanta MSA (Metropolitan Statistical Area). Added 61,953 residents in 2024–25, the third-largest numeric gain among U.S. metros after Houston and Dallas, and about 375,000 since April 2020 (U.S. Census Bureau, Vintage 2025 estimates; Atlanta Regional Commission). (2) Moody’s, W&P, and Oxford Economics. (3) Atlanta MSA. Population at July 1, 2025, and 10-year CAGR vs. July 1, 2015. U.S. Census Bureau. (4) 2014–2023: BEA MSA-level GDP. 2024: sum of BEA county GDP for the 29 MSA counties, as BEA discontinued MSA-level data in February 2026. (5) Atlanta MSA median household income vs. U.S. median ($81.6k), 2024 1-year ACS. U.S. Census Bureau. (6) Metro Atlanta Chamber, Key Industries and Built for Business (metroatlantachamber.com), 2026. (7) Atlanta MSA share of Georgia real GDP, 2023 (69%). U.S. Bureau of Economic Analysis. (8) Fortune 500 headquarters in metro Atlanta, 2026. Fortune; Georgia Department of Economic Development. (9) Metro Atlanta Chamber, Metro Atlanta Profile (April 2025), metro Atlanta/Athens area; Metro Atlanta Chamber, 2026 Talent Supply Report (February 2026). (10) Co Star Data. Commercial and residential projects 2020-2026 (11) ACI World, 2025 traffic ranking: ATL 1st with 106.3m passengers. Interstate network per Georgia DOT. 500-600 New projects per year ECONOMIC ANCHORS6 70% World’s busiest airport Key interstate links Metro Atlanta combines a diverse employment base, major corporate headquarters and strategic transport connectivity, reinforcing its position as a key economic and talent feeder center in the Southeast. ECONOMIC SCALE 7 DEVELOPMENT PIPELINE 10 14 Fortune 500 headquarters Of Georgia GDP POPULATION 3 Historic sustained growth supports long-term demand 6.5m 2025 population 1.3% 10Y CAGR (2015-25) HOUSEHOLD INCOME 5 High incomes above national average $92k 2024 median income 13% above U.S. average GDP GROWTH 4 A diversified economy continues to attract jobs 3.5% REAL GDP, 10-YEAR CAGR 2014-2024 CORPORATE BASE 8 STRATEGIC LOCATION 11 TALENT PIPELINE 9 ~64,000 Annual graduates
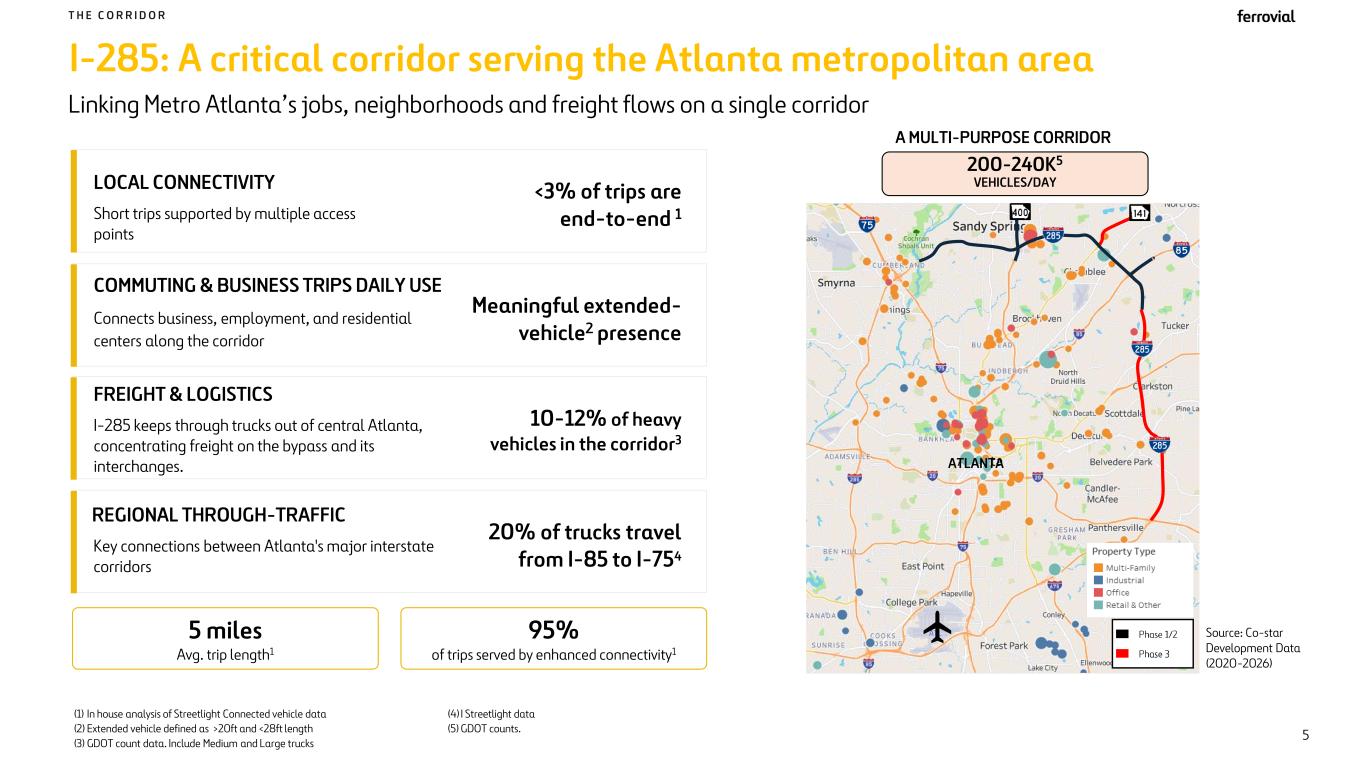
I-285: A critical corridor serving the Atlanta metropolitan area 5 miles Avg. trip length1 95% of trips served by enhanced connectivity1 FREIGHT & LOGISTICS I-285 keeps through trucks out of central Atlanta, concentrating freight on the bypass and its interchanges. LOCAL CONNECTIVITY Short trips supported by multiple access points REGIONAL THROUGH-TRAFFIC Key connections between Atlanta's major interstate corridors Linking Metro Atlanta’s jobs, neighborhoods and freight flows on a single corridor A MULTI-PURPOSE CORRIDOR COMMUTING & BUSINESS TRIPS DAILY USE Connects business, employment, and residential centers along the corridor T H E C O R R I D O R 5 Source: Co-star Development Data (2020-2026) 20% of trucks travel from I-85 to I-754 10-12% of heavy vehicles in the corridor3 Meaningful extended- vehicle2 presence <3% of trips are end-to-end 1 200-240K5 VEHICLES/DAY (1) In house analysis of Streetlight Connected vehicle data (2) Extended vehicle defined as >20ft and <28ft length (3) GDOT count data. Include Medium and Large trucks (4) I Streetlight data (5) GDOT counts. ATLANTA Phase 1/2 Phase 3
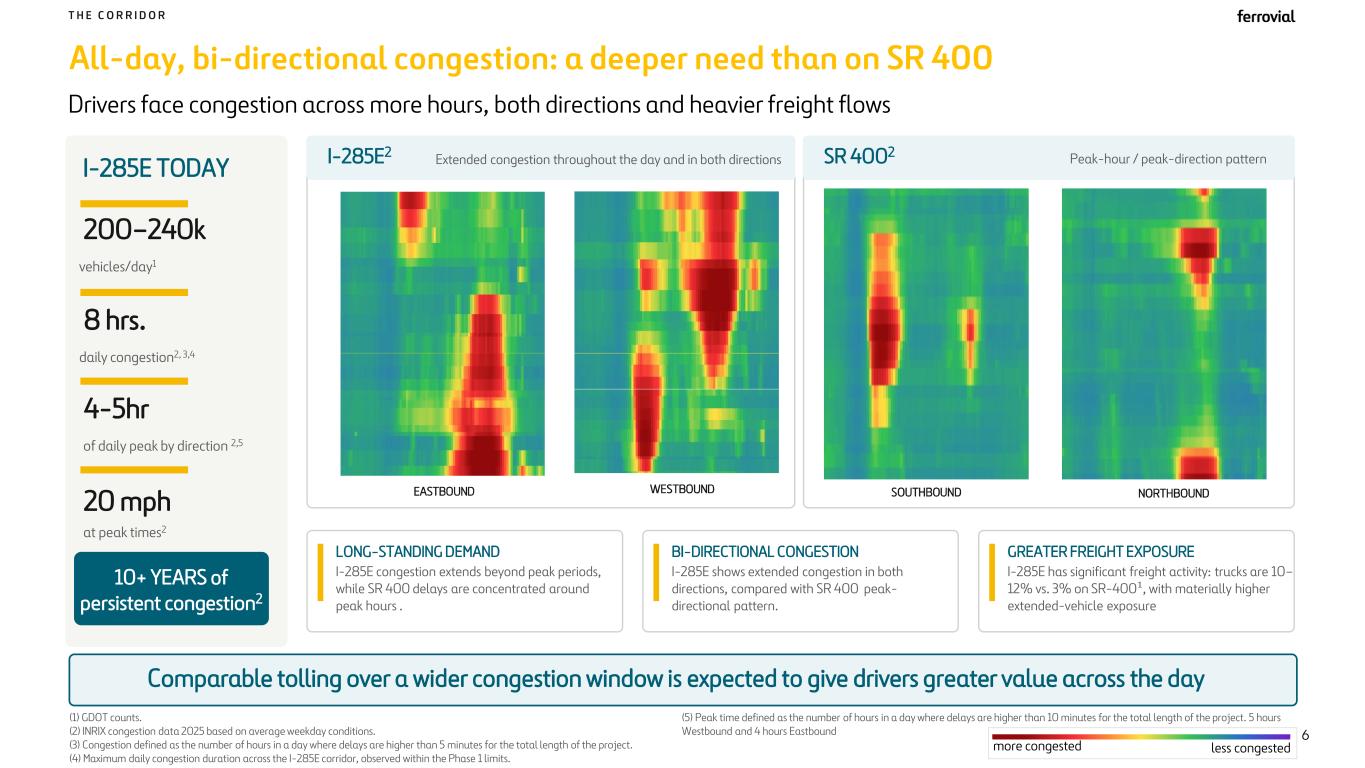
All-day, bi-directional congestion: a deeper need than on SR 400 Drivers face congestion across more hours, both directions and heavier freight flows T H E C O R R I D O R 6 I-285E TODAY 200–240k vehicles/day1 8 hrs. daily congestion2, 3,4 20 mph at peak times2 10+ YEARS of persistent congestion2 I-285E2 Extended congestion throughout the day and in both directions EASTBOUND WESTBOUND SR 4002 Peak-hour / peak-direction pattern SOUTHBOUND NORTHBOUND LONG-STANDING DEMAND I-285E congestion extends beyond peak periods, while SR 400 delays are concentrated around peak hours . BI-DIRECTIONAL CONGESTION I-285E shows extended congestion in both directions, compared with SR 400 peak- directional pattern. GREATER FREIGHT EXPOSURE I-285E has significant freight activity: trucks are 10– 12% vs. 3% on SR-400¹, with materially higher extended-vehicle exposure Comparable tolling over a wider congestion window is expected to give drivers greater value across the day 4-5hr of daily peak by direction 2,5 less congestedmore congested (1) GDOT counts. (2) INRIX congestion data 2025 based on average weekday conditions. (3) Congestion defined as the number of hours in a day where delays are higher than 5 minutes for the total length of the project. (4) Maximum daily congestion duration across the I-285E corridor, observed within the Phase 1 limits. (5) Peak time defined as the number of hours in a day where delays are higher than 10 minutes for the total length of the project. 5 hours Westbound and 4 hours Eastbound
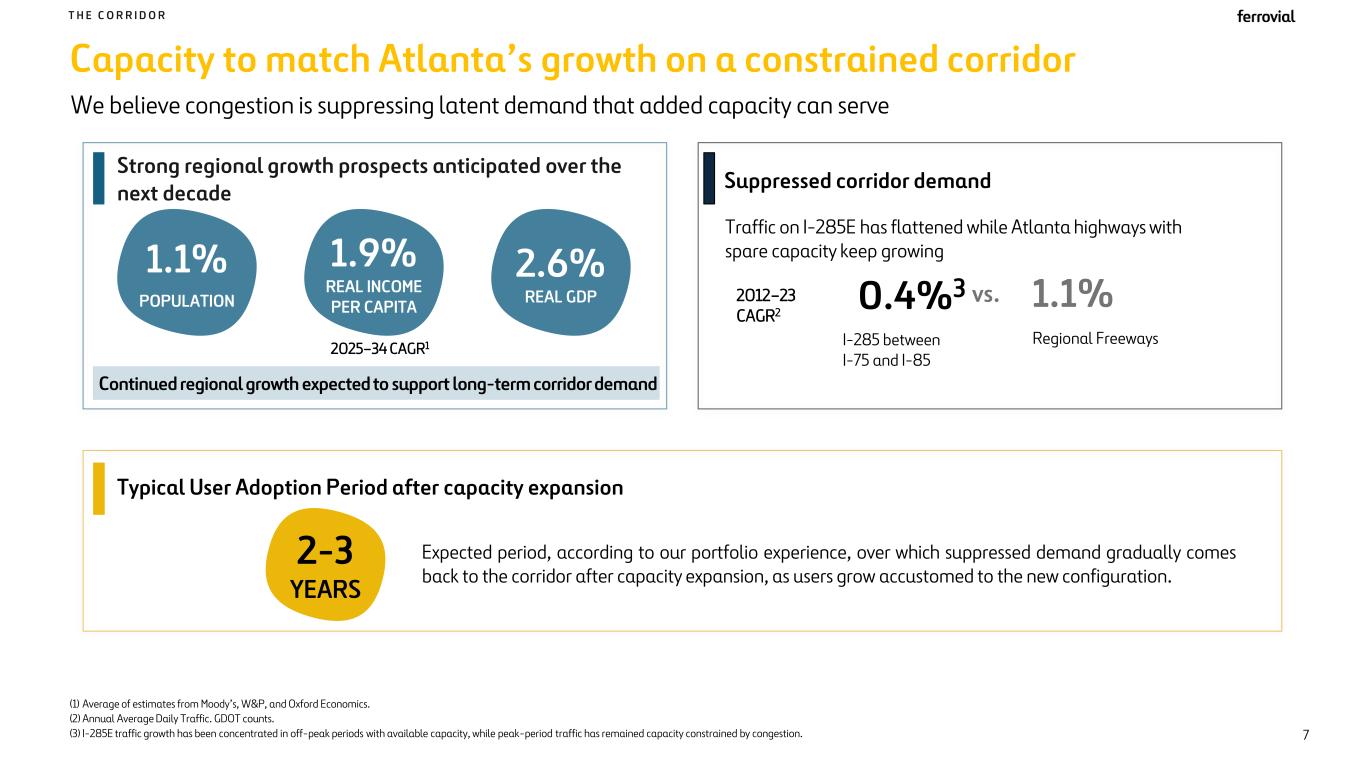
Capacity to match Atlanta’s growth on a constrained corridor We believe congestion is suppressing latent demand that added capacity can serve T H E C O R R I D O R 1.1% POPULATION 1.9% REAL INCOME PER CAPITA 2.6% REAL GDP (1) Average of estimates from Moody’s, W&P, and Oxford Economics. (2) Annual Average Daily Traffic. GDOT counts. (3) I-285E traffic growth has been concentrated in off-peak periods with available capacity, while peak-period traffic has remained capacity constrained by congestion. 7 Continued regional growth expected to support long-term corridor demand 0.4%3 1.1% Traffic on I-285E has flattened while Atlanta highways with spare capacity keep growing I-285 between I-75 and I-85 Regional Freeways Suppressed corridor demand Strong regional growth prospects anticipated over the next decade Expected period, according to our portfolio experience, over which suppressed demand gradually comes back to the corridor after capacity expansion, as users grow accustomed to the new configuration. 2-3 YEARS vs. 2025–34 CAGR1 2012–23 CAGR2 Typical User Adoption Period after capacity expansion Historical Forecasted Growth (CAGR) 2015- 2024 2025- 2034 2034- 2050 2025- 2050 Pop 1.3% 1.0% 0.9% 1.0% 1.2% 1.0% 1.1% 1.2% 1.1% 1.1% 1.0% 0.7% 0.8% 1.0% 0.7% 0.8% GMP 3.3% 2.4% 1.9% 2.1% 2.4% 2.0% 2.1% 2.2% 1.8% 2.0% 2.9% 2.4% 2.6% Income/ Capita 2.1% 1.7% 1.3% 1.4% 2.0% 1.6% 1.8% 1.7% 1.5% 1.6% 1.9% 1.9% 1.9%
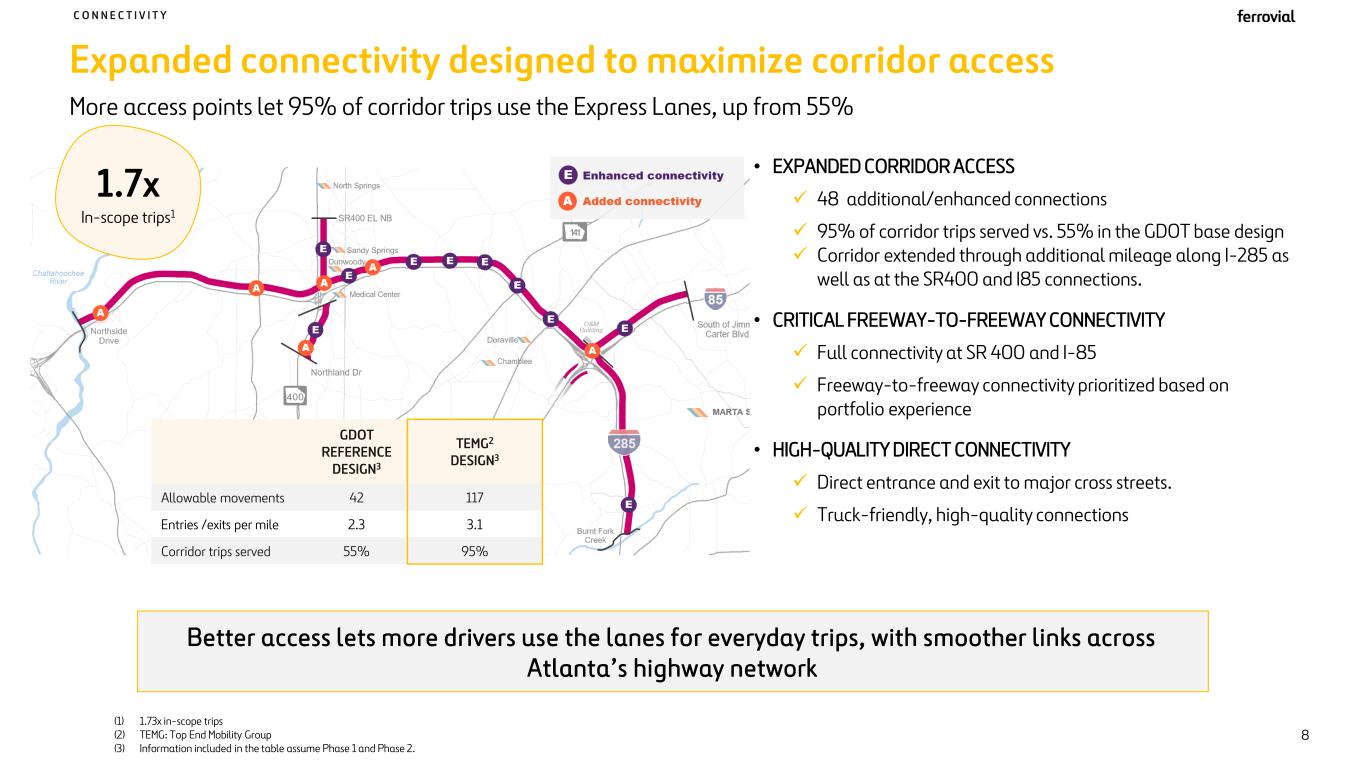
Expanded connectivity designed to maximize corridor access • EXPANDED CORRIDOR ACCESS ✓ 48 additional/enhanced connections ✓ 95% of corridor trips served vs. 55% in the GDOT base design ✓ Corridor extended through additional mileage along I-285 as well as at the SR400 and I85 connections. • CRITICAL FREEWAY-TO-FREEWAY CONNECTIVITY ✓ Full connectivity at SR 400 and I-85 ✓ Freeway-to-freeway connectivity prioritized based on portfolio experience • HIGH-QUALITY DIRECT CONNECTIVITY ✓ Direct entrance and exit to major cross streets. ✓ Truck-friendly, high-quality connections More access points let 95% of corridor trips use the Express Lanes, up from 55% C O N N E C T I V I T Y 8 Better access lets more drivers use the lanes for everyday trips, with smoother links across Atlanta’s highway network 1.7x In-scope trips1 GDOT REFERENCE DESIGN3 TEMG2 DESIGN3 Allowable movements 42 117 Entries /exits per mile 2.3 3.1 Corridor trips served 55% 95% (1) 1.73x in-scope trips (2) TEMG: Top End Mobility Group (3) Information included in the table assume Phase 1 and Phase 2.
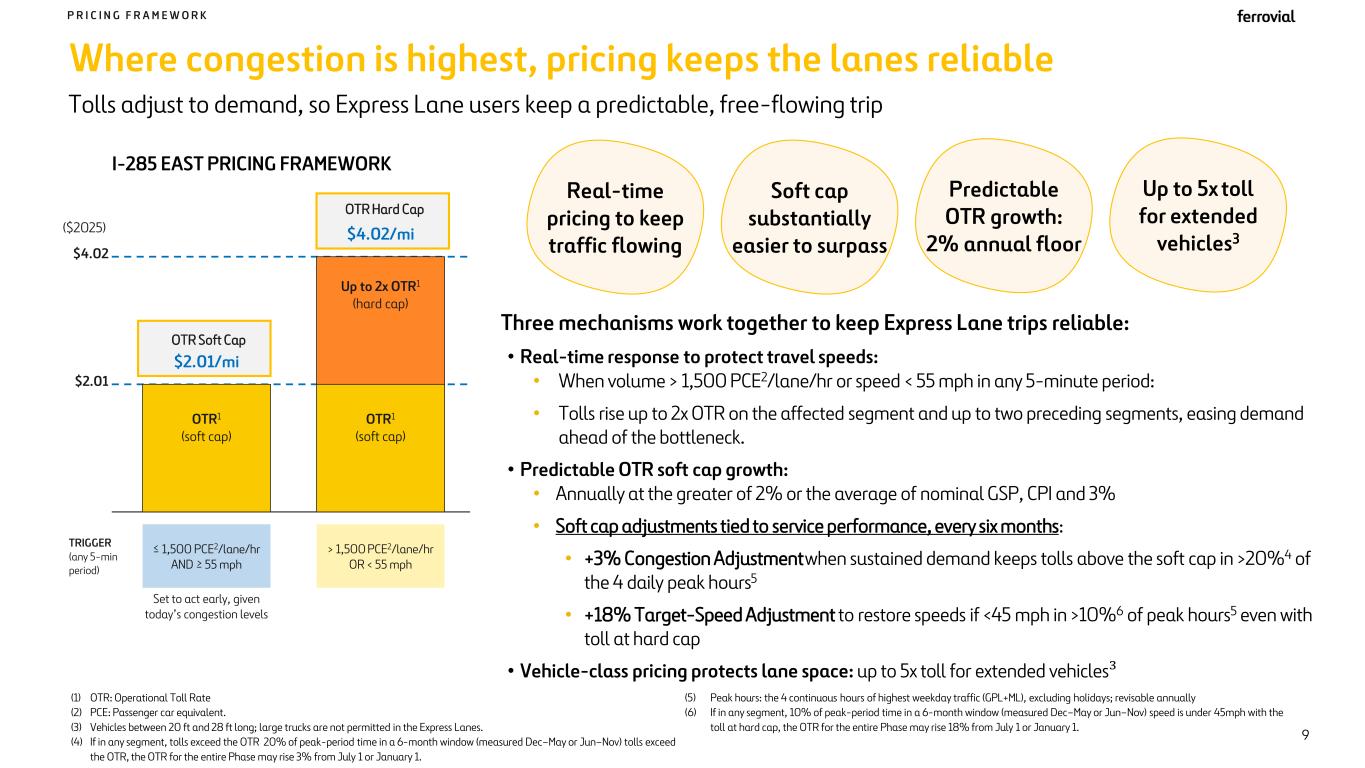
(1) OTR: Operational Toll Rate (2) PCE: Passenger car equivalent. (3) Vehicles between 20 ft and 28 ft long; large trucks are not permitted in the Express Lanes. (4) If in any segment, tolls exceed the OTR 20% of peak-period time in a 6-month window (measured Dec–May or Jun–Nov) tolls exceed the OTR, the OTR for the entire Phase may rise 3% from July 1 or January 1. (5) Peak hours: the 4 continuous hours of highest weekday traffic (GPL+ML), excluding holidays; revisable annually (6) If in any segment, 10% of peak-period time in a 6-month window (measured Dec–May or Jun–Nov) speed is under 45mph with the toll at hard cap, the OTR for the entire Phase may rise 18% from July 1 or January 1. Three mechanisms work together to keep Express Lane trips reliable: • Real-time response to protect travel speeds: • When volume > 1,500 PCE2/lane/hr or speed < 55 mph in any 5-minute period: • Tolls rise up to 2x OTR on the affected segment and up to two preceding segments, easing demand ahead of the bottleneck. • Predictable OTR soft cap growth: • Annually at the greater of 2% or the average of nominal GSP, CPI and 3% • Soft cap adjustments tied to service performance, every six months: • +3% Congestion Adjustmentwhen sustained demand keeps tolls above the soft cap in >20%4 of the 4 daily peak hours5 • +18% Target-Speed Adjustment to restore speeds if <45 mph in >10%6 of peak hours5 even with toll at hard cap • Vehicle-class pricing protects lane space: up to 5x toll for extended vehicles³ Where congestion is highest, pricing keeps the lanes reliable Tolls adjust to demand, so Express Lane users keep a predictable, free-flowing trip P R I C I N G F R A M E W O R K Up to 5x toll for extended vehicles3 Real-time pricing to keep traffic flowing Predictable OTR growth: 2% annual floor 9 I-285 EAST PRICING FRAMEWORK ($2025) $2.01 $4.02 OTR1 (soft cap) OTR1 (soft cap) Up to 2x OTR1 (hard cap) $2.01/mi $4.02/mi ≤ 1,500 PCE2/lane/hr AND ≥ 55 mph > 1,500 PCE2/lane/hr OR < 55 mph TRIGGER (any 5-min period) OTR Soft Cap OTR Hard Cap Set to act early, given today’s congestion levels Soft cap substantially easier to surpass
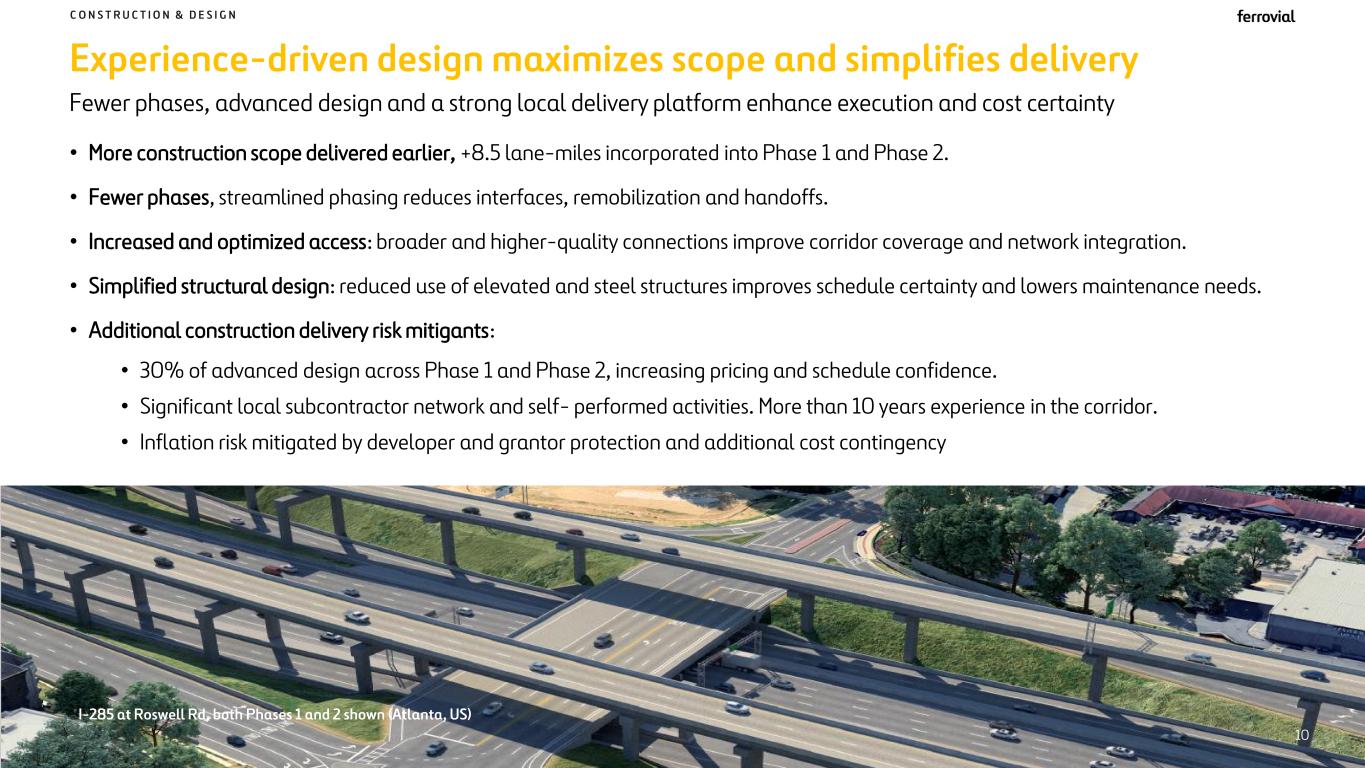
Experience-driven design maximizes scope and simplifies delivery C O N S T R U C T I O N & D E S I G N • More construction scope delivered earlier, +8.5 lane-miles incorporated into Phase 1 and Phase 2. • Fewer phases, streamlined phasing reduces interfaces, remobilization and handoffs. • Increased and optimized access: broader and higher-quality connections improve corridor coverage and network integration. • Simplified structural design: reduced use of elevated and steel structures improves schedule certainty and lowers maintenance needs. • Additional construction delivery risk mitigants: • 30% of advanced design across Phase 1 and Phase 2, increasing pricing and schedule confidence. • Significant local subcontractor network and self- performed activities. More than 10 years experience in the corridor. • Inflation risk mitigated by developer and grantor protection and additional cost contingency Fewer phases, advanced design and a strong local delivery platform enhance execution and cost certainty I-285 at Roswell Rd, both Phases 1 and 2 shown (Atlanta, US) 10
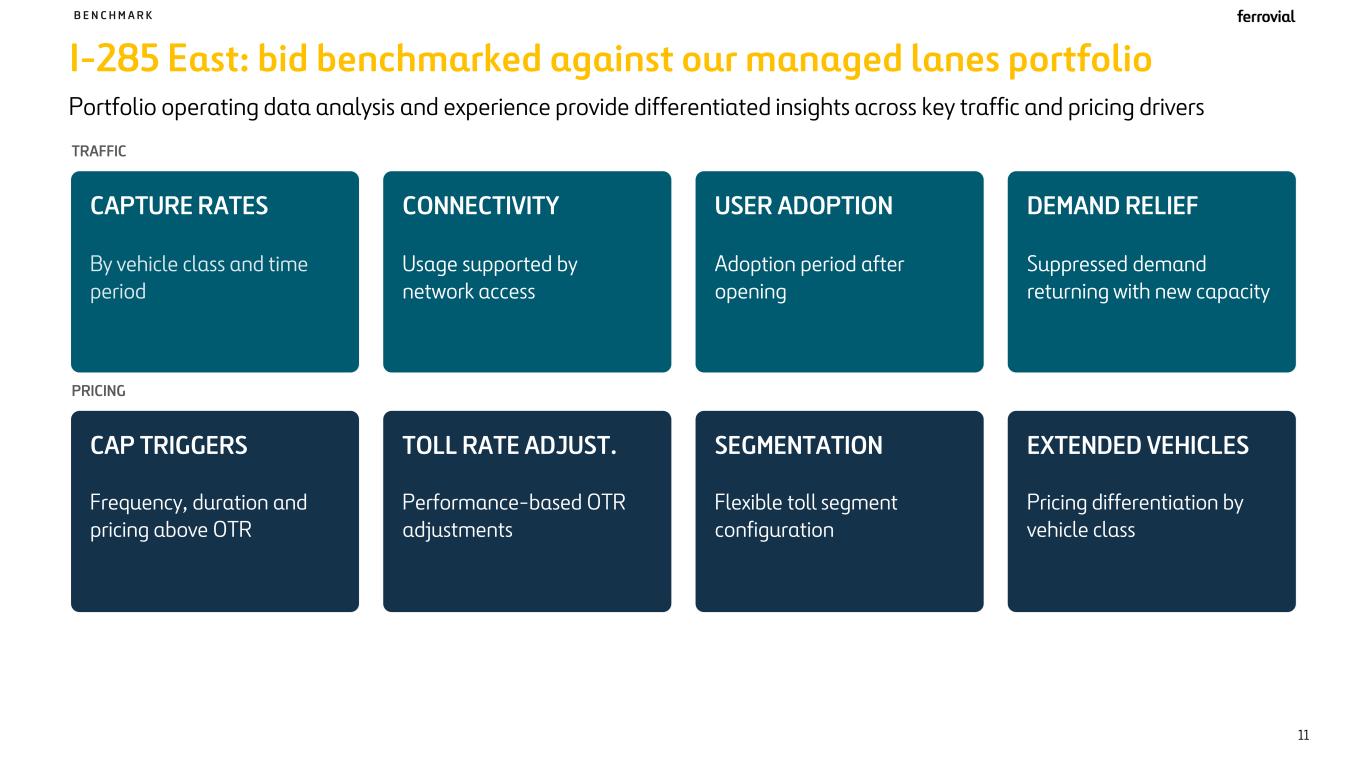
I-285 East: bid benchmarked against our managed lanes portfolio B E N C H M A R K Portfolio operating data analysis and experience provide differentiated insights across key traffic and pricing drivers 11 TRAFFIC CAPTURE RATES By vehicle class and time period CONNECTIVITY Usage supported by network access USER ADOPTION Adoption period after opening DEMAND RELIEF Suppressed demand returning with new capacity PRICING CAP TRIGGERS Frequency, duration and pricing above OTR TOLL RATE ADJUST. Performance-based OTR adjustments SEGMENTATION Flexible toll segment configuration EXTENDED VEHICLES Pricing differentiation by vehicle class
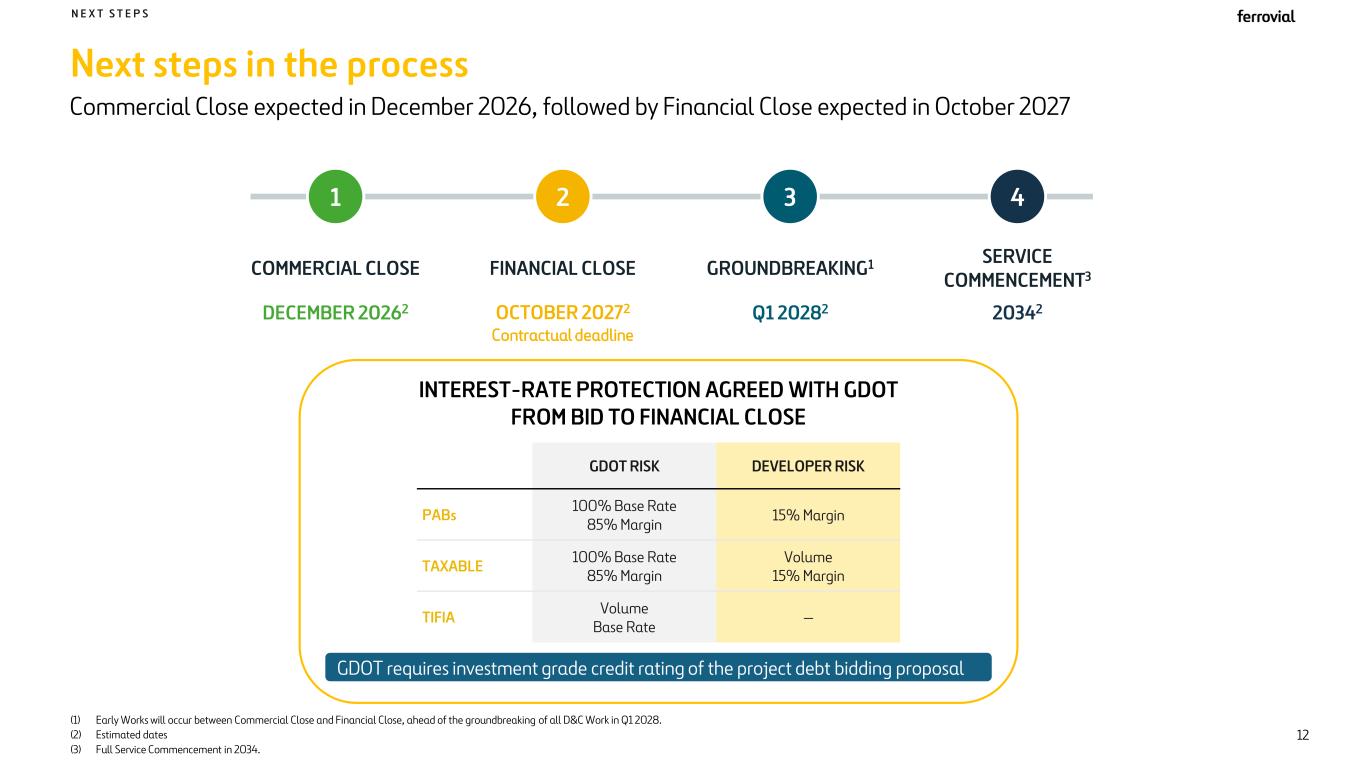
Next steps in the process N E X T S T E P S Commercial Close expected in December 2026, followed by Financial Close expected in October 2027 12 1 COMMERCIAL CLOSE DECEMBER 20262 2 FINANCIAL CLOSE OCTOBER 20272 Contractual deadline 3 GROUNDBREAKING1 Q1 20282 4 SERVICE COMMENCEMENT3 20342 INTEREST-RATE PROTECTION AGREED WITH GDOT FROM BID TO FINANCIAL CLOSE GDOT RISK DEVELOPER RISK PABs 100% Base Rate 85% Margin 15% Margin TAXABLE 100% Base Rate 85% Margin Volume 15% Margin TIFIA Volume Base Rate — GDOT requires investment grade credit rating of the project debt bidding proposal (1) Early Works will occur between Commercial Close and Financial Close, ahead of the groundbreaking of all D&C Work in Q1 2028. (2) Estimated dates (3) Full Service Commencement in 2034.
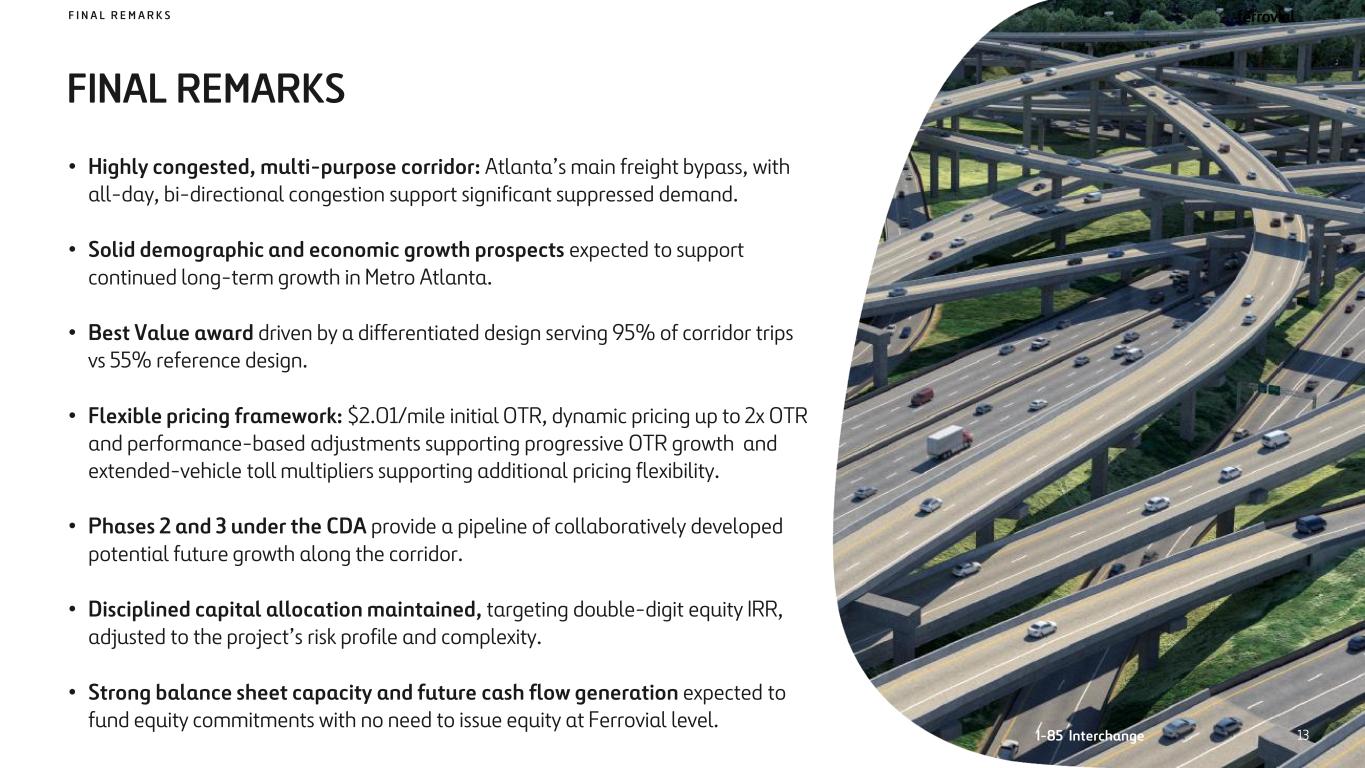
FINAL REMARKS F I N A L R E M A R K S • Highly congested, multi-purpose corridor: Atlanta’s main freight bypass, with all-day, bi-directional congestion support significant suppressed demand. • Solid demographic and economic growth prospects expected to support continued long-term growth in Metro Atlanta. • Best Value award driven by a differentiated design serving 95% of corridor trips vs 55% reference design. • Flexible pricing framework: $2.01/mile initial OTR, dynamic pricing up to 2x OTR and performance-based adjustments supporting progressive OTR growth and extended-vehicle toll multipliers supporting additional pricing flexibility. • Phases 2 and 3 under the CDA provide a pipeline of collaboratively developed potential future growth along the corridor. • Disciplined capital allocation maintained, targeting double-digit equity IRR, adjusted to the project’s risk profile and complexity. • Strong balance sheet capacity and future cash flow generation expected to fund equity commitments with no need to issue equity at Ferrovial level. 13I-85 Interchange

Q&A SR400 Interchange