The Fund acquired all of the assets and liabilities of Fulcrum Diversified Absolute Return Fund (the “Predecessor Fund”), a series of Trust for Advised Portfolios, in a tax-free reorganization on March 10, 2023 (the “Reorganization”). In connection with the Reorganization, shares of the Predecessor Fund’s Super Institutional Class and Institutional Class were exchanged for Super Institutional Class and Institutional Class shares of the Fund, respectively. The Predecessor Fund had an investment objective and strategies that were, in all material respects, the same as those of the Fund, and was managed in a manner that, in all material respects, complied with the investment guidelines and restrictions of the Fund. The Fund is a continuation of the Predecessor Fund and is the accounting survivor of the Reorganization. The performance prior to the Reorganization is that of the Predecessor Fund.
The bar chart and performance table below show the variability of the Fund’s and Predecessor Fund’s returns, which may be an indication of the risks of investing in the Fund. The bar chart shows the Fund’s Super Institutional Class for each of the last 10 calendar years. Returns for Institutional Class shares, which are not presented, vary from the returns of the Super Institutional Class shares. The performance table compares the performance of the Fund’s Super Institutional Class over time to the performance of a broad-based securities market index and supplemental index. The Fund’s past performance, before and after taxes, does not necessarily indicate how it will perform in the future. Updated performance information is posted on the Fund’s website at www.fulcrumassetfunds.com or by calling the Fund toll-free at 855-538-5278.
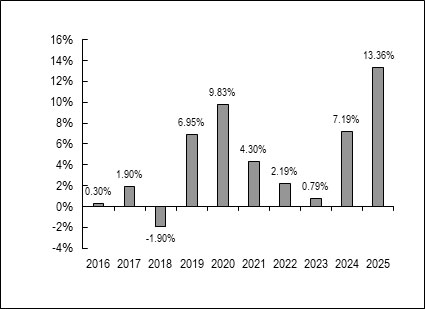
During the period of time shown in the bar chart, the Super Institutional Class’s highest quarterly return was 6.20% for the quarter ended June 2025, and the lowest quarterly return was (4.39)% for the quarter ended December 31, 2018.
The Super Institutional Class’s year-to-date return as of the most recent fiscal quarter, which ended September 30, 2026, was 1.62%.
| One Year | Five Years | Ten Years | |
| Super Institutional Class | |||
| Return before taxes | 13.36% | 5.47% | 4.39% |
| Return after taxes on distributions | 10.67% | 3.75% | 2.75% |
| Return after taxes on distributions and sale of Fund shares | 8.33% | 3.52% | 2.69% |
| Institutional Class | |||
| Return Before Taxes | 13.34% | 5.40% | 4.33% |
| Bloomberg
US Aggregate Bond Index* (reflects no deduction for fees, expenses, or taxes) |
7.30% | (0.36)% | 2.01% |
| Bloomberg
Global Aggregate Total Return Index Value Hedged USD ** (reflects no deduction for fees, expenses, or taxes) |
4.86% | 0.34% | 2.39% |
| ICE
BofA 3-Month US Treasury Bill Index*** (reflects no deduction for fees, expenses, or taxes) |
4.21% | 3.19% | 2.19% |
| * | The Bloomberg US Aggregate Index is a broad-based benchmark that measures the investment grade, US dollar-denominated, fixed-rate taxable bond market. The index includes Treasuries, government-related and corporate securities, MBS (agency fixed-rate pass-throughs), ABS and CMBS (agency and non-agency). Investors cannot invest directly in an index or benchmark. The Fund changed is broad-based benchmark from the ICE BofA 3-Month US Treasury Bill Index to the Bloomberg US Aggregate Index, in order to better align with the Fund’s investment strategies. |
| ** | The Bloomberg Global Aggregate USD Hedged Index tracks bonds issued in emerging and developed markets worldwide. The index includes all maturities. Investors cannot invest directly in an index or benchmark. |
| *** | The ICE BofA 3-Month US Treasury Bill Index is comprised of a single issue purchased at the beginning of the month and held for a full month. At the end of the month that issue is sold and rolled into a newly selected issue. The issue selected at each month-end rebalancing is the outstanding Treasury Bill that matures closest to, but not beyond, three months from the rebalancing date. To qualify for selection, an issue must have settled on or before the month-end rebalancing date. Investors cannot invest directly in an index or benchmark. |
After-tax returns are calculated using the historical highest individual federal marginal income tax rates and do not reflect the impact of state and local taxes. Actual after-tax returns depend on a shareholder’s tax situation and may differ from those shown. The after-tax returns shown are not relevant if you hold your Fund shares in tax-deferred arrangements, such as 401(k) plans or individual retirement accounts (“IRAs”). After-tax returns are shown only for Super Institutional; after-tax returns for the Institutional Class and Advisor Class will vary to the extent they have different expenses.