Pay vs Performance Disclosure - USD ($)
|
12 Months Ended |
Aug. 31, 2026 |
Aug. 31, 2025 |
Aug. 31, 2024 |
Aug. 31, 2023 |
Aug. 31, 2022 |
| Pay vs Performance Disclosure |
|
|
|
|
|
| Pay vs Performance Disclosure, Table |
| | | | | | | | | | | | | | | | | | | | | | | | | | | | | | | | | Pay Versus Performance | | | | | | | | Value of Initial Fixed $100 Investment Based On: | | | | Fiscal Year | Summary Compensation Table Total for PEO(1) | Compensation Actually Paid to PEO(1) | Summary Compensation Table Total for Former PEO(1) | Compensation Actually Paid to Former PEO(1) | Average Summary Compensation Table Total for Non-PEO NEOs | Average Compensation Actually Paid to Non-PEO NEOs(2) | Total Shareholder Return(3) | Peer Group Total Shareholder Return(3) | Net Income (in Thousands) | Revenue (Company Selected Measure)(in thousands)(4) | | 2026 | $ | 62,046,674 | | $ | 72,044,781 | | $ | 337,164 | | $ | (3,888,289) | | $ | 3,080,581 | | $ | 3,211,997 | | $ | 87.03 | | $ | 167.96 | | $ | 533,481 | | $ | 2,476,256 | | | 2025 | $ | — | | $ | — | | $ | 9,460,930 | | $ | 5,700,082 | | $ | 3,180,035 | | $ | 2,424,385 | | $ | 101.80 | | $ | 152.64 | | $ | 597,040 | | $ | 2,321,748 | | | 2024 | $ | — | | $ | — | | $ | 7,584,472 | | $ | 3,005,247 | | $ | 2,317,286 | | $ | 1,458,270 | | $ | 114.19 | | $ | 120.20 | | $ | 537,126 | | $ | 2,203,056 | | | 2023 | $ | — | | $ | — | | $ | 6,862,015 | | $ | 5,673,690 | | $ | 2,375,318 | | $ | 2,142,762 | | $ | 116.76 | | $ | 88.36 | | $ | 468,173 | | $ | 2,085,508 | | | 2022 | $ | — | | $ | — | | $ | 6,604,998 | | $ | 15,375,286 | | $ | 2,510,807 | | $ | 3,961,318 | | $ | 114.92 | | $ | 83.72 | | $ | 396,917 | | $ | 1,843,892 | |
|
|
|
|
|
| Company Selected Measure Name |
revenue
|
|
|
|
|
| Peer Group Issuers, Footnote |
For FactSet and the Peer Group Total Shareholder Return, the TSR for each year reflects what the cumulative value of $100 would be, including reinvestment of dividends, if such amount were invested on August 31, 2021. Peer Group Total Shareholder Return reflects the TSR of the Dow Jones U.S. Financial Services Index, one of the industry index peer groups used in the Company's Stock Performance Graph in our 2026 Annual Report on Form 10-K included pursuant to Item 201(e) of Regulation S-K.
|
|
|
|
|
| Adjustment To PEO Compensation, Footnote |
Mr. Snow served as the Company's PEO for fiscal years 2022-2025 and for fiscal year 2026 from September 1, 2025 through September 7, 2025. SEC rules require certain adjustments to be made to the amounts reported in the Summary Compensation Table ("SCT") in order to calculate CAP as shown in the table above. The following table details the applicable adjustments to the SCT Total for our PEO that were made to calculate PEO CAP. CAP does not reflect the actual amount of compensation that was or may be earned by or paid to our PEO during the applicable fiscal year. | | | | | | | | | | | | | | | | | | | | | | PEO SCT Total to CAP Reconciliation | FY2026 (PEO) | FY2026 (Former PEO) | FY2025 | FY2024 | FY2023 | FY2022 | | Summary Compensation Table Total | $62,046,674 | $337,164 | $9,460,930 | $7,584,472 | $6,862,015 | $6,604,998 | | Deduction for SCT "Stock Awards" column value | $(22,708,861) | $— | $(3,750,162) | $(3,000,011) | $(2,500,166) | $(2,250,063) | | Deduction for SCT "Option Awards" column value | $(22,000,063) | $— | $(3,750,093) | $(3,000,075) | $(2,500,089) | $(2,250,035) | | Deduction for SCT "Change in Pension Value and Nonqualified Deferred Compensation Earnings" column value | $— | $— | $— | $— | $— | $— | | Total Deductions from SCT | $(44,708,924) | $— | $(7,500,255) | $(6,000,086) | $(5,000,255) | $(4,500,098) | | Increase for Service Cost and Prior Service Cost for Pension Plans | $— | $— | $— | $— | $— | $— | | Increase for year end fair value of unvested equity granted during year | $54,707,031 | $— | $4,884,670 | $3,444,963 | $4,531,366 | $5,509,555 | | Increase/(Deduction) for change in fair value of unvested equity granted in prior years | $— | $(2,225,267) | $(1,729,950) | $(1,537,645) | $185,152 | $6,162,251 | | Increase for vesting date fair value of equity granted and vested during year | $— | $— | $— | $— | $— | $— | | Increase/(Deduction) for change in fair value of vested equity granted in prior years | $— | $(2,000,186) | $584,687 | $(486,457) | $(904,588) | $1,598,580 | | Deduction for fair value of equity that failed to meet vesting conditions during the year | $— | $— | $— | $— | $— | $— | | Increase based on value of dividends not otherwise reflected in fair value or total compensation | $— | $— | $— | $— | $— | $— | | Total Adjustments | $54,707,031 | $(4,225,453) | $3,739,407 | $1,420,861 | $3,811,930 | $13,270,386 | | CAP (SCT minus deductions plus total adjustments) | $72,044,781 | $(3,888,289) | $5,700,082 | $3,005,247 | $5,673,690 | $15,375,286 |
|
|
|
|
|
| Non-PEO NEO Average Total Compensation Amount |
$ 3,080,581
|
$ 3,180,035
|
$ 2,317,286
|
$ 2,375,318
|
$ 2,510,807
|
| Non-PEO NEO Average Compensation Actually Paid Amount |
$ 3,211,997
|
2,424,385
|
1,458,270
|
2,142,762
|
3,961,318
|
| Adjustment to Non-PEO NEO Compensation Footnote |
For fiscal 2025, our non-PEO NEOs were Helen Shan, Goran Skoko, Christopher McLoughlin, and Katherine M. Stepp. For fiscal 2024, our non-PEO NEOs were Helen Shan, Goran Skoko, Katherine M. Stepp, Catrina Harding, and Linda S. Huber. For fiscal 2022 and 2023, our non-PEO NEOs were Linda S. Huber, Helen Shan, Goran Skoko, and Robert J. Robie. SEC rules require certain adjustments to be made to the amounts reported in the SCT in order to calculate CAP as shown in the table above. The following table details the applicable adjustments to the SCT Total for our non-PEO NEOs that were made to calculate non-PEO NEO CAP. CAP does not reflect the actual amount of compensation that was or may be earned by or paid to our non-PEO NEOs during the applicable fiscal year. | | | | | | | | | | | | | | | | | | | Non-PEO NEO SCT Total to CAP Reconciliation | FY2026 | FY2025 | FY2024 | FY2023 | FY2022 | | Summary Compensation Table Total | $ | 3,080,581 | | $ | 3,180,035 | | $ | 2,317,286 | | $ | 2,375,318 | | $ | 2,510,807 | | | Deduction for SCT "Stock Awards" column value | $ | (1,056,114) | | $ | (1,343,310) | | $ | (615,204) | | $ | (647,053) | | $ | (742,524) | | | Deduction for SCT "Option Awards" column value | $ | (695,322) | | $ | (592,225) | | $ | (615,078) | | $ | (646,943) | | $ | (556,314) | | | Deduction for SCT "Change in Pension Value and Nonqualified Deferred Compensation Earnings" column value | $ | — | | $ | — | | $ | — | | $ | — | | $ | — | | | Total Deductions from SCT | $ | (1,751,436) | | $ | (1,935,535) | | $ | (1,230,282) | | $ | (1,293,996) | | $ | (1,298,838) | | | Increase for Service Cost and Prior Service Cost for Pension Plans | $ | — | | $ | — | | $ | — | | $ | — | | $ | — | | | Increase for year end fair value of unvested equity granted during year | $ | 2,465,112 | | $ | 1,375,113 | | $ | 706,333 | | $ | 1,172,650 | | $ | 1,550,995 | | | Increase/(Deduction) for change in fair value of unvested equity granted in prior years | $ | (308,266) | | $ | (281,529) | | $ | (297,616) | | $ | 20,670 | | $ | 1,011,199 | | | Increase for vesting date fair value of equity granted and vested during year | $ | — | | $ | — | | $ | — | | $ | — | | $ | — | | | Increase/(Deduction) for change in fair value of vested equity granted in prior years | $ | (273,994) | | $ | 86,301 | | $ | (37,451) | | $ | (131,880) | | $ | 187,155 | | | Deduction for fair value of equity that failed to meet vesting conditions during the year | $ | — | | $ | — | | $ | — | | $ | — | | $ | — | | | Increase based on value of dividends not otherwise reflected in fair value or total compensation | $ | — | | $ | — | | $ | — | | $ | — | | $ | — | | | Total Adjustments | $ | 1,882,852 | | $ | 1,179,885 | | $ | 371,266 | | $ | 1,061,440 | | $ | 2,749,349 | | | CAP (SCT minus deductions plus total adjustments) | $ | 3,211,997 | | $ | 2,424,385 | | $ | 1,458,270 | | $ | 2,142,762 | | $ | 3,961,318 | |
|
|
|
|
|
| Compensation Actually Paid vs. Total Shareholder Return |
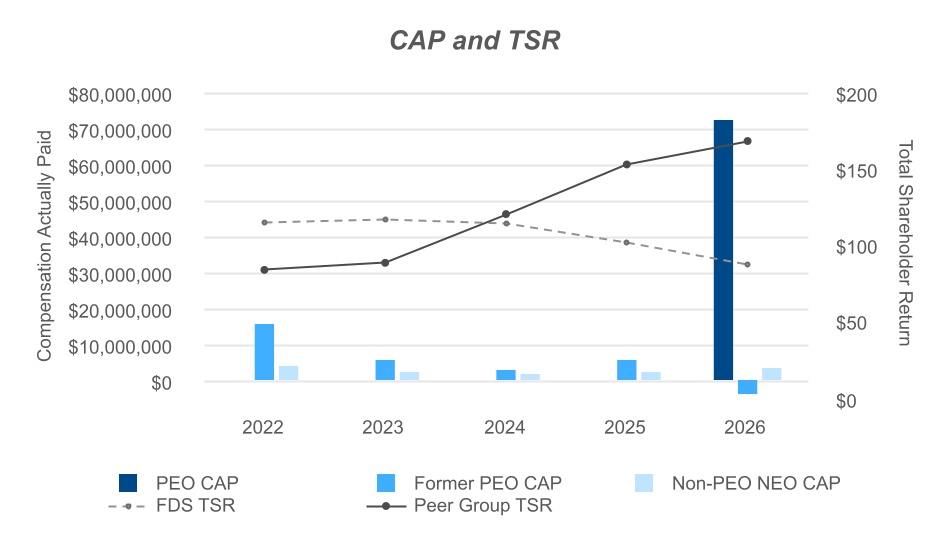
The following graph shows PEO and average non-PEO NEO CAP, as defined above, and FactSet's TSR during the five most recently completed fiscal years, as well as the TSR of the Dow Jones U.S. Financial Services Index, one of the industry index peer groups used in our Stock Performance Graph in our 2026 Annual Report on Form 10-K.
|
|
|
|
|
| Compensation Actually Paid vs. Net Income |
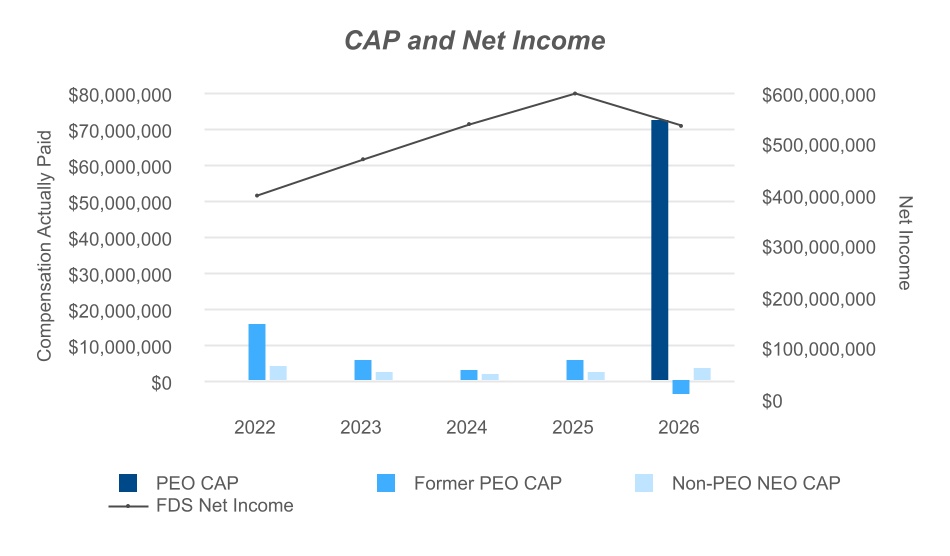
The following graph shows PEO and average non-PEO NEO CAP, as defined above, and our net income during the five most recently completed fiscal years.
|
|
|
|
|
| Compensation Actually Paid vs. Company Selected Measure |
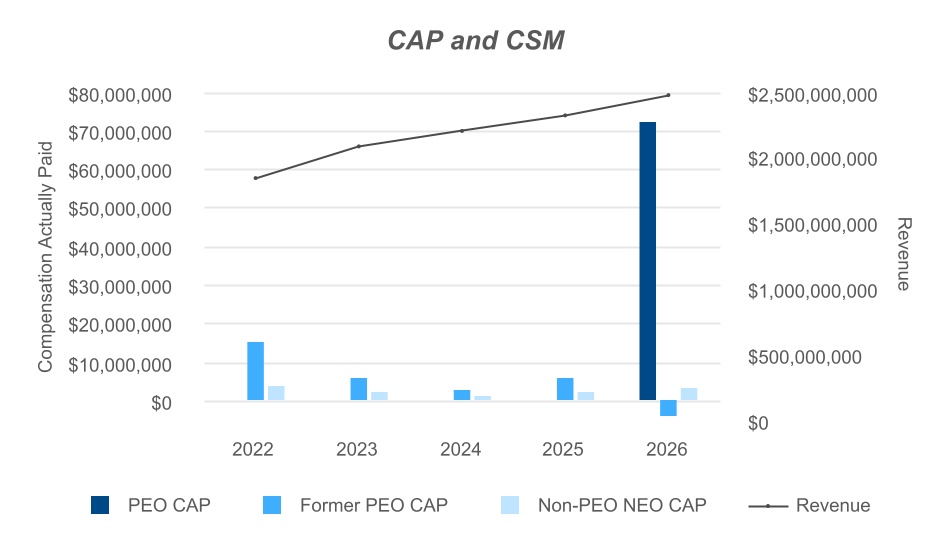
The following graph shows PEO and average non-PEO NEO CAP, as defined above, and FactSet's CSM, during the five most recently completed fiscal years.
|
|
|
|
|
| Total Shareholder Return Vs Peer Group |
The following graph shows PEO and average non-PEO NEO CAP, as defined above, and FactSet's TSR during the five most recently completed fiscal years, as well as the TSR of the Dow Jones U.S. Financial Services Index, one of the industry index peer groups used in our Stock Performance Graph in our 2026 Annual Report on Form 10-K.
|
|
|
|
|
| Tabular List, Table |
| | | | Performance Measure | Revenue | | Adjusted Operating Margin | | Adjusted Cumulative Operating Earnings | | Adjusted Cumulative Revenues |
|
|
|
|
|
| Total Shareholder Return Amount |
$ 87.03
|
101.80
|
114.19
|
116.76
|
114.92
|
| Peer Group Total Shareholder Return Amount |
167.96
|
152.64
|
120.20
|
88.36
|
83.72
|
| Net Income (Loss) |
$ 533,481,000
|
$ 597,040,000
|
$ 537,126,000
|
$ 468,173,000
|
$ 396,917,000
|
| Company Selected Measure Amount |
2,476,256,000,000
|
2,321,748,000
|
2,203,056,000,000
|
2,085,508,000,000
|
1,843,892,000,000
|
| PEO Name |
Mr. Viswanathan
|
Mr. Snow
|
Mr. Snow
|
Mr. Snow
|
Mr. Snow
|
| Measure:: 1 |
|
|
|
|
|
| Pay vs Performance Disclosure |
|
|
|
|
|
| Name |
Revenue
|
|
|
|
|
| Non-GAAP Measure Description |
In accordance with SEC rules, we are required to include in the PVP table the "most important" financial performance measure used to link compensation of our NEOs to Company performance during fiscal 2026. We have selected revenue as this required Company Selected Measure ("CSM"). We selected revenue because ASV growth is a metric for our fiscal year 2026 annual incentive plan and long-term incentive plan, and ASV at any given point in time represents the forward-looking revenues for the next twelve months from all recurring services currently supplied to clients.
|
|
|
|
|
| Measure:: 2 |
|
|
|
|
|
| Pay vs Performance Disclosure |
|
|
|
|
|
| Name |
Adjusted Operating Margin
|
|
|
|
|
| Measure:: 3 |
|
|
|
|
|
| Pay vs Performance Disclosure |
|
|
|
|
|
| Name |
Adjusted Cumulative Operating Earnings
|
|
|
|
|
| Measure:: 4 |
|
|
|
|
|
| Pay vs Performance Disclosure |
|
|
|
|
|
| Name |
Adjusted Cumulative Revenues
|
|
|
|
|
| Mr. Viswanathan [Member] |
|
|
|
|
|
| Pay vs Performance Disclosure |
|
|
|
|
|
| PEO Total Compensation Amount |
$ 62,046,674
|
|
|
|
|
| PEO Actually Paid Compensation Amount |
72,044,781
|
|
|
|
|
| Mr. Snow [Member] |
|
|
|
|
|
| Pay vs Performance Disclosure |
|
|
|
|
|
| PEO Total Compensation Amount |
337,164
|
$ 9,460,930
|
$ 7,584,472
|
$ 6,862,015
|
$ 6,604,998
|
| PEO Actually Paid Compensation Amount |
(3,888,289)
|
5,700,082
|
3,005,247
|
5,673,690
|
15,375,286
|
| PEO |
|
|
|
|
|
| Pay vs Performance Disclosure |
|
|
|
|
|
| Adjustment To Compensation Amount, Deductions |
|
(7,500,255)
|
(6,000,086)
|
(5,000,255)
|
(4,500,098)
|
| Adjustment To Compensation Amount, Total Adjustments |
|
3,739,407
|
1,420,861
|
3,811,930
|
13,270,386
|
| PEO | Aggregate Change in Present Value of Accumulated Benefit for All Pension Plans Reported in Summary Compensation Table |
|
|
|
|
|
| Pay vs Performance Disclosure |
|
|
|
|
|
| Adjustment to Compensation, Amount |
|
0
|
0
|
0
|
0
|
| PEO | Aggregate Pension Adjustments Service Cost |
|
|
|
|
|
| Pay vs Performance Disclosure |
|
|
|
|
|
| Adjustment to Compensation, Amount |
|
0
|
0
|
0
|
0
|
| PEO | Year-end Fair Value of Equity Awards Granted in Covered Year that are Outstanding and Unvested |
|
|
|
|
|
| Pay vs Performance Disclosure |
|
|
|
|
|
| Adjustment to Compensation, Amount |
|
4,884,670
|
3,444,963
|
4,531,366
|
5,509,555
|
| PEO | Year-over-Year Change in Fair Value of Equity Awards Granted in Prior Years That are Outstanding and Unvested |
|
|
|
|
|
| Pay vs Performance Disclosure |
|
|
|
|
|
| Adjustment to Compensation, Amount |
|
(1,729,950)
|
(1,537,645)
|
185,152
|
6,162,251
|
| PEO | Vesting Date Fair Value of Equity Awards Granted and Vested in Covered Year |
|
|
|
|
|
| Pay vs Performance Disclosure |
|
|
|
|
|
| Adjustment to Compensation, Amount |
|
0
|
0
|
0
|
0
|
| PEO | Change in Fair Value as of Vesting Date of Prior Year Equity Awards Vested in Covered Year |
|
|
|
|
|
| Pay vs Performance Disclosure |
|
|
|
|
|
| Adjustment to Compensation, Amount |
|
584,687
|
(486,457)
|
(904,588)
|
1,598,580
|
| PEO | Prior Year End Fair Value of Equity Awards Granted in Any Prior Year that Fail to Meet Applicable Vesting Conditions During Covered Year |
|
|
|
|
|
| Pay vs Performance Disclosure |
|
|
|
|
|
| Adjustment to Compensation, Amount |
|
0
|
0
|
0
|
0
|
| PEO | Dividends or Other Earnings Paid on Equity Awards not Otherwise Reflected in Total Compensation for Covered Year |
|
|
|
|
|
| Pay vs Performance Disclosure |
|
|
|
|
|
| Adjustment to Compensation, Amount |
|
0
|
0
|
0
|
0
|
| PEO | Aggregate Grant Date Fair Value of Stock Award Amounts Reported in Summary Compensation Table [Member] |
|
|
|
|
|
| Pay vs Performance Disclosure |
|
|
|
|
|
| Adjustment to Compensation, Amount |
|
(3,750,162)
|
(3,000,011)
|
(2,500,166)
|
(2,250,063)
|
| PEO | Aggregate Grant Date Fair Value of Option Award Amounts Reported in Summary Compensation Table [Member] |
|
|
|
|
|
| Pay vs Performance Disclosure |
|
|
|
|
|
| Adjustment to Compensation, Amount |
|
(3,750,093)
|
(3,000,075)
|
(2,500,089)
|
(2,250,035)
|
| PEO | Mr. Viswanathan [Member] |
|
|
|
|
|
| Pay vs Performance Disclosure |
|
|
|
|
|
| Adjustment To Compensation Amount, Deductions |
(44,708,924)
|
|
|
|
|
| Adjustment To Compensation Amount, Total Adjustments |
54,707,031
|
|
|
|
|
| PEO | Mr. Viswanathan [Member] | Aggregate Change in Present Value of Accumulated Benefit for All Pension Plans Reported in Summary Compensation Table |
|
|
|
|
|
| Pay vs Performance Disclosure |
|
|
|
|
|
| Adjustment to Compensation, Amount |
0
|
|
|
|
|
| PEO | Mr. Viswanathan [Member] | Aggregate Pension Adjustments Service Cost |
|
|
|
|
|
| Pay vs Performance Disclosure |
|
|
|
|
|
| Adjustment to Compensation, Amount |
0
|
|
|
|
|
| PEO | Mr. Viswanathan [Member] | Year-end Fair Value of Equity Awards Granted in Covered Year that are Outstanding and Unvested |
|
|
|
|
|
| Pay vs Performance Disclosure |
|
|
|
|
|
| Adjustment to Compensation, Amount |
54,707,031
|
|
|
|
|
| PEO | Mr. Viswanathan [Member] | Year-over-Year Change in Fair Value of Equity Awards Granted in Prior Years That are Outstanding and Unvested |
|
|
|
|
|
| Pay vs Performance Disclosure |
|
|
|
|
|
| Adjustment to Compensation, Amount |
0
|
|
|
|
|
| PEO | Mr. Viswanathan [Member] | Vesting Date Fair Value of Equity Awards Granted and Vested in Covered Year |
|
|
|
|
|
| Pay vs Performance Disclosure |
|
|
|
|
|
| Adjustment to Compensation, Amount |
0
|
|
|
|
|
| PEO | Mr. Viswanathan [Member] | Change in Fair Value as of Vesting Date of Prior Year Equity Awards Vested in Covered Year |
|
|
|
|
|
| Pay vs Performance Disclosure |
|
|
|
|
|
| Adjustment to Compensation, Amount |
0
|
|
|
|
|
| PEO | Mr. Viswanathan [Member] | Prior Year End Fair Value of Equity Awards Granted in Any Prior Year that Fail to Meet Applicable Vesting Conditions During Covered Year |
|
|
|
|
|
| Pay vs Performance Disclosure |
|
|
|
|
|
| Adjustment to Compensation, Amount |
0
|
|
|
|
|
| PEO | Mr. Viswanathan [Member] | Dividends or Other Earnings Paid on Equity Awards not Otherwise Reflected in Total Compensation for Covered Year |
|
|
|
|
|
| Pay vs Performance Disclosure |
|
|
|
|
|
| Adjustment to Compensation, Amount |
0
|
|
|
|
|
| PEO | Mr. Viswanathan [Member] | Aggregate Grant Date Fair Value of Stock Award Amounts Reported in Summary Compensation Table [Member] |
|
|
|
|
|
| Pay vs Performance Disclosure |
|
|
|
|
|
| Adjustment to Compensation, Amount |
(22,708,861)
|
|
|
|
|
| PEO | Mr. Viswanathan [Member] | Aggregate Grant Date Fair Value of Option Award Amounts Reported in Summary Compensation Table [Member] |
|
|
|
|
|
| Pay vs Performance Disclosure |
|
|
|
|
|
| Adjustment to Compensation, Amount |
(22,000,063)
|
|
|
|
|
| PEO | Mr. Snow [Member] |
|
|
|
|
|
| Pay vs Performance Disclosure |
|
|
|
|
|
| Adjustment To Compensation Amount, Deductions |
0
|
|
|
|
|
| Adjustment To Compensation Amount, Total Adjustments |
(4,225,453)
|
|
|
|
|
| PEO | Mr. Snow [Member] | Aggregate Change in Present Value of Accumulated Benefit for All Pension Plans Reported in Summary Compensation Table |
|
|
|
|
|
| Pay vs Performance Disclosure |
|
|
|
|
|
| Adjustment to Compensation, Amount |
0
|
|
|
|
|
| PEO | Mr. Snow [Member] | Aggregate Pension Adjustments Service Cost |
|
|
|
|
|
| Pay vs Performance Disclosure |
|
|
|
|
|
| Adjustment to Compensation, Amount |
0
|
|
|
|
|
| PEO | Mr. Snow [Member] | Year-end Fair Value of Equity Awards Granted in Covered Year that are Outstanding and Unvested |
|
|
|
|
|
| Pay vs Performance Disclosure |
|
|
|
|
|
| Adjustment to Compensation, Amount |
0
|
|
|
|
|
| PEO | Mr. Snow [Member] | Year-over-Year Change in Fair Value of Equity Awards Granted in Prior Years That are Outstanding and Unvested |
|
|
|
|
|
| Pay vs Performance Disclosure |
|
|
|
|
|
| Adjustment to Compensation, Amount |
(2,225,267)
|
|
|
|
|
| PEO | Mr. Snow [Member] | Vesting Date Fair Value of Equity Awards Granted and Vested in Covered Year |
|
|
|
|
|
| Pay vs Performance Disclosure |
|
|
|
|
|
| Adjustment to Compensation, Amount |
0
|
|
|
|
|
| PEO | Mr. Snow [Member] | Change in Fair Value as of Vesting Date of Prior Year Equity Awards Vested in Covered Year |
|
|
|
|
|
| Pay vs Performance Disclosure |
|
|
|
|
|
| Adjustment to Compensation, Amount |
(2,000,186)
|
|
|
|
|
| PEO | Mr. Snow [Member] | Prior Year End Fair Value of Equity Awards Granted in Any Prior Year that Fail to Meet Applicable Vesting Conditions During Covered Year |
|
|
|
|
|
| Pay vs Performance Disclosure |
|
|
|
|
|
| Adjustment to Compensation, Amount |
0
|
|
|
|
|
| PEO | Mr. Snow [Member] | Dividends or Other Earnings Paid on Equity Awards not Otherwise Reflected in Total Compensation for Covered Year |
|
|
|
|
|
| Pay vs Performance Disclosure |
|
|
|
|
|
| Adjustment to Compensation, Amount |
0
|
|
|
|
|
| PEO | Mr. Snow [Member] | Aggregate Grant Date Fair Value of Stock Award Amounts Reported in Summary Compensation Table [Member] |
|
|
|
|
|
| Pay vs Performance Disclosure |
|
|
|
|
|
| Adjustment to Compensation, Amount |
0
|
|
|
|
|
| PEO | Mr. Snow [Member] | Aggregate Grant Date Fair Value of Option Award Amounts Reported in Summary Compensation Table [Member] |
|
|
|
|
|
| Pay vs Performance Disclosure |
|
|
|
|
|
| Adjustment to Compensation, Amount |
0
|
|
|
|
|
| Non-PEO NEO |
|
|
|
|
|
| Pay vs Performance Disclosure |
|
|
|
|
|
| Adjustment To Compensation Amount, Deductions |
(1,751,436)
|
(1,935,535)
|
(1,230,282)
|
(1,293,996)
|
(1,298,838)
|
| Adjustment To Compensation Amount, Total Adjustments |
1,882,852
|
1,179,885
|
371,266
|
1,061,440
|
2,749,349
|
| Non-PEO NEO | Aggregate Change in Present Value of Accumulated Benefit for All Pension Plans Reported in Summary Compensation Table |
|
|
|
|
|
| Pay vs Performance Disclosure |
|
|
|
|
|
| Adjustment to Compensation, Amount |
0
|
0
|
0
|
0
|
0
|
| Non-PEO NEO | Aggregate Pension Adjustments Service Cost |
|
|
|
|
|
| Pay vs Performance Disclosure |
|
|
|
|
|
| Adjustment to Compensation, Amount |
0
|
0
|
0
|
0
|
0
|
| Non-PEO NEO | Year-end Fair Value of Equity Awards Granted in Covered Year that are Outstanding and Unvested |
|
|
|
|
|
| Pay vs Performance Disclosure |
|
|
|
|
|
| Adjustment to Compensation, Amount |
2,465,112
|
1,375,113
|
706,333
|
1,172,650
|
1,550,995
|
| Non-PEO NEO | Year-over-Year Change in Fair Value of Equity Awards Granted in Prior Years That are Outstanding and Unvested |
|
|
|
|
|
| Pay vs Performance Disclosure |
|
|
|
|
|
| Adjustment to Compensation, Amount |
(308,266)
|
(281,529)
|
(297,616)
|
20,670
|
1,011,199
|
| Non-PEO NEO | Vesting Date Fair Value of Equity Awards Granted and Vested in Covered Year |
|
|
|
|
|
| Pay vs Performance Disclosure |
|
|
|
|
|
| Adjustment to Compensation, Amount |
0
|
0
|
0
|
0
|
0
|
| Non-PEO NEO | Change in Fair Value as of Vesting Date of Prior Year Equity Awards Vested in Covered Year |
|
|
|
|
|
| Pay vs Performance Disclosure |
|
|
|
|
|
| Adjustment to Compensation, Amount |
(273,994)
|
86,301
|
(37,451)
|
(131,880)
|
187,155
|
| Non-PEO NEO | Prior Year End Fair Value of Equity Awards Granted in Any Prior Year that Fail to Meet Applicable Vesting Conditions During Covered Year |
|
|
|
|
|
| Pay vs Performance Disclosure |
|
|
|
|
|
| Adjustment to Compensation, Amount |
0
|
0
|
0
|
0
|
0
|
| Non-PEO NEO | Dividends or Other Earnings Paid on Equity Awards not Otherwise Reflected in Total Compensation for Covered Year |
|
|
|
|
|
| Pay vs Performance Disclosure |
|
|
|
|
|
| Adjustment to Compensation, Amount |
0
|
0
|
0
|
0
|
0
|
| Non-PEO NEO | Aggregate Grant Date Fair Value of Stock Award Amounts Reported in Summary Compensation Table [Member] |
|
|
|
|
|
| Pay vs Performance Disclosure |
|
|
|
|
|
| Adjustment to Compensation, Amount |
(1,056,114)
|
(1,343,310)
|
(615,204)
|
(647,053)
|
(742,524)
|
| Non-PEO NEO | Aggregate Grant Date Fair Value of Option Award Amounts Reported in Summary Compensation Table [Member] |
|
|
|
|
|
| Pay vs Performance Disclosure |
|
|
|
|
|
| Adjustment to Compensation, Amount |
$ (695,322)
|
$ (592,225)
|
$ (615,078)
|
$ (646,943)
|
$ (556,314)
|