Bank of Hawai‘i Corporation third quarter 2026 financial report October 26, 2026 Exhibit 99.2
this presentation, and other statements made by the Company in connection with it, may contain forward-looking statements concerning, among other things, forecasts of our financial results and condition, expectations for our operations and business prospects, and our assumptions used in those forecasts and expectations. we have not committed to update forward-looking statements to reflect later events or circumstances disclosure 2 forward-looking statements
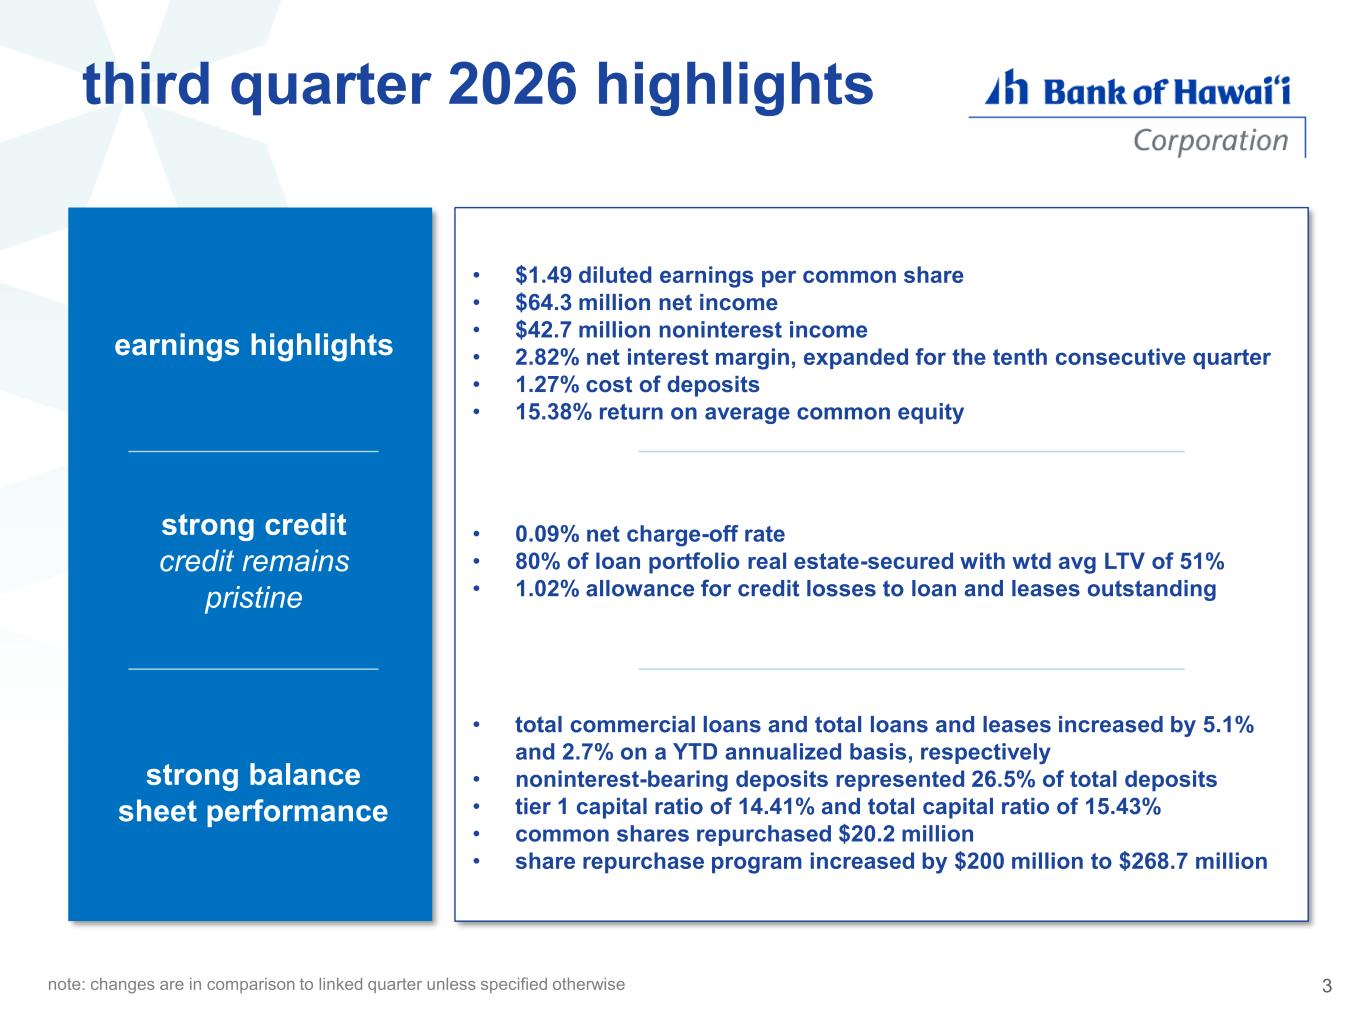
diversified, lower risk loan assets third quarter 2026 highlights broad & deep market penetration strong balance she t performance • total commercial loans and total loans and leases increased by 5.1% and 2.7% on a YTD annualized basis, respectively • noninterest-bearing deposits represented 26.5% of total deposits • tier 1 capital ratio of 14.41% and total capital ratio of 15.43% • common shares repurchased $20.2 million • share repurchase program increased by $200 million to $268.7 million earnings highlights • $1.49 diluted earnings per common share • $64.3 million net income • $42.7 million noninterest income • 2.82% net interest margin, expanded for the tenth consecutive quarter • 1.27% cost of deposits • 15.38% return on average common equity strong credit credit remains pristine • 0.09% net charge-off rate • 80% of loan portfolio real estate-secured with wtd avg LTV of 51% • 1.02% allowance for credit losses to loan and leases outstanding note: changes are in comparison to linked quarter unless specified otherwise 3
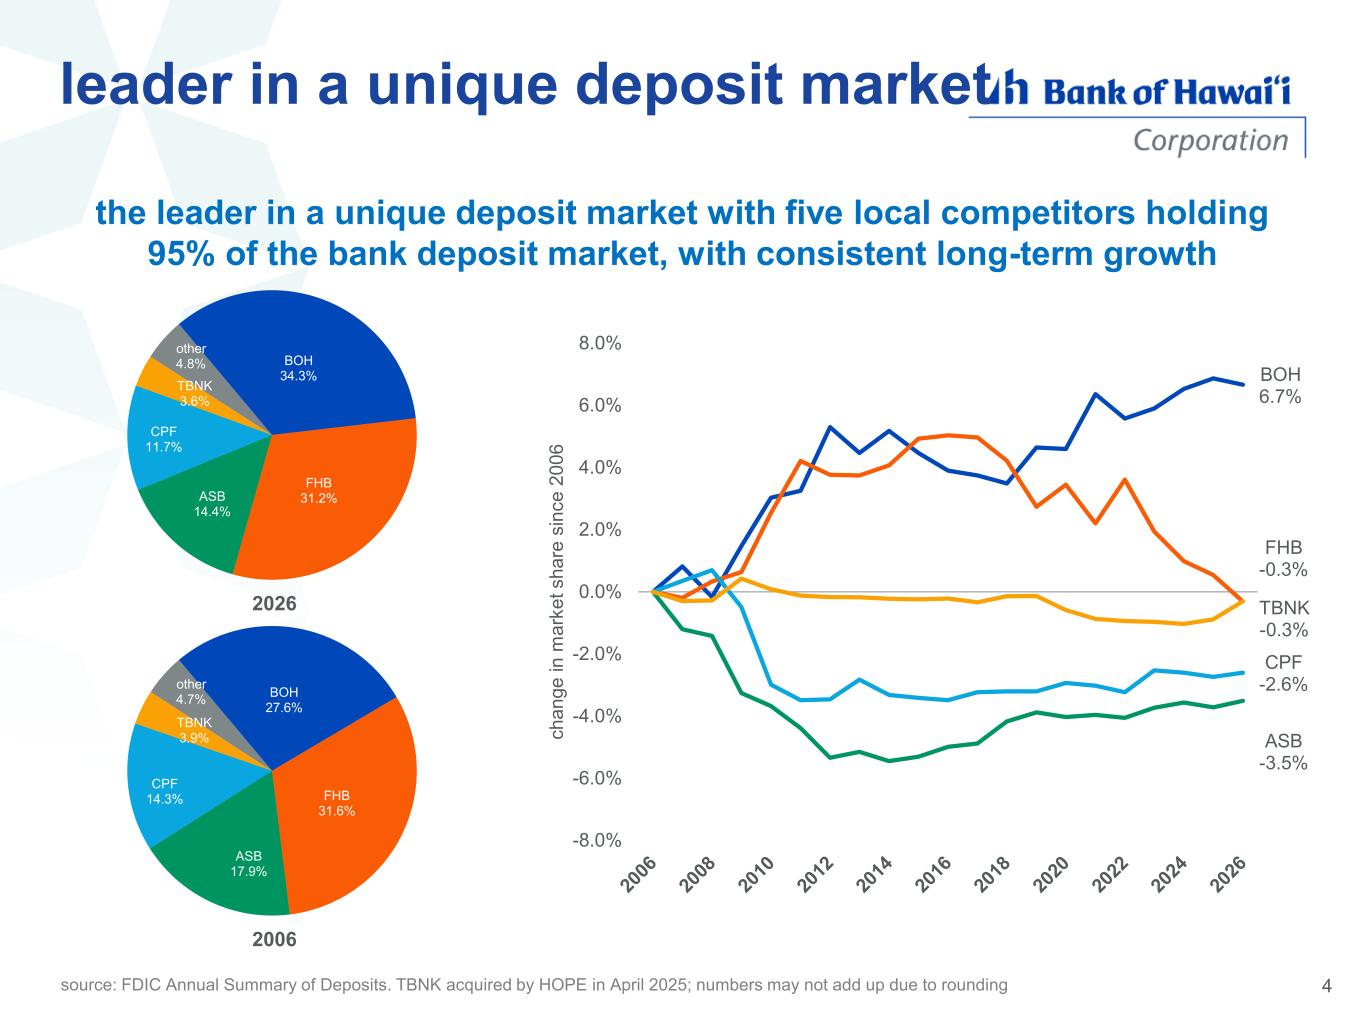
leader in a unique deposit market the leader in a unique deposit market with five local competitors holding 95% of the bank deposit market, with consistent long-term growth 4source: FDIC Annual Summary of Deposits. TBNK acquired by HOPE in April 2025; numbers may not add up due to rounding BOH 6.7% FHB -0.3% CPF -2.6% ASB -3.5% TBNK -0.3% -8.0% -6.0% -4.0% -2.0% 0.0% 2.0% 4.0% 6.0% 8.0% c h a n g e i n m a rk e t s h a re s in c e 2 0 0 6 BOH 27.6% FHB 31.6% ASB 17.9% CPF 14.3% TBNK 3.9% other 4.7% 2006 BOH 34.3% FHB 31.2%ASB 14.4% CPF 11.7% TBNK 3.6% other 4.8% 2026
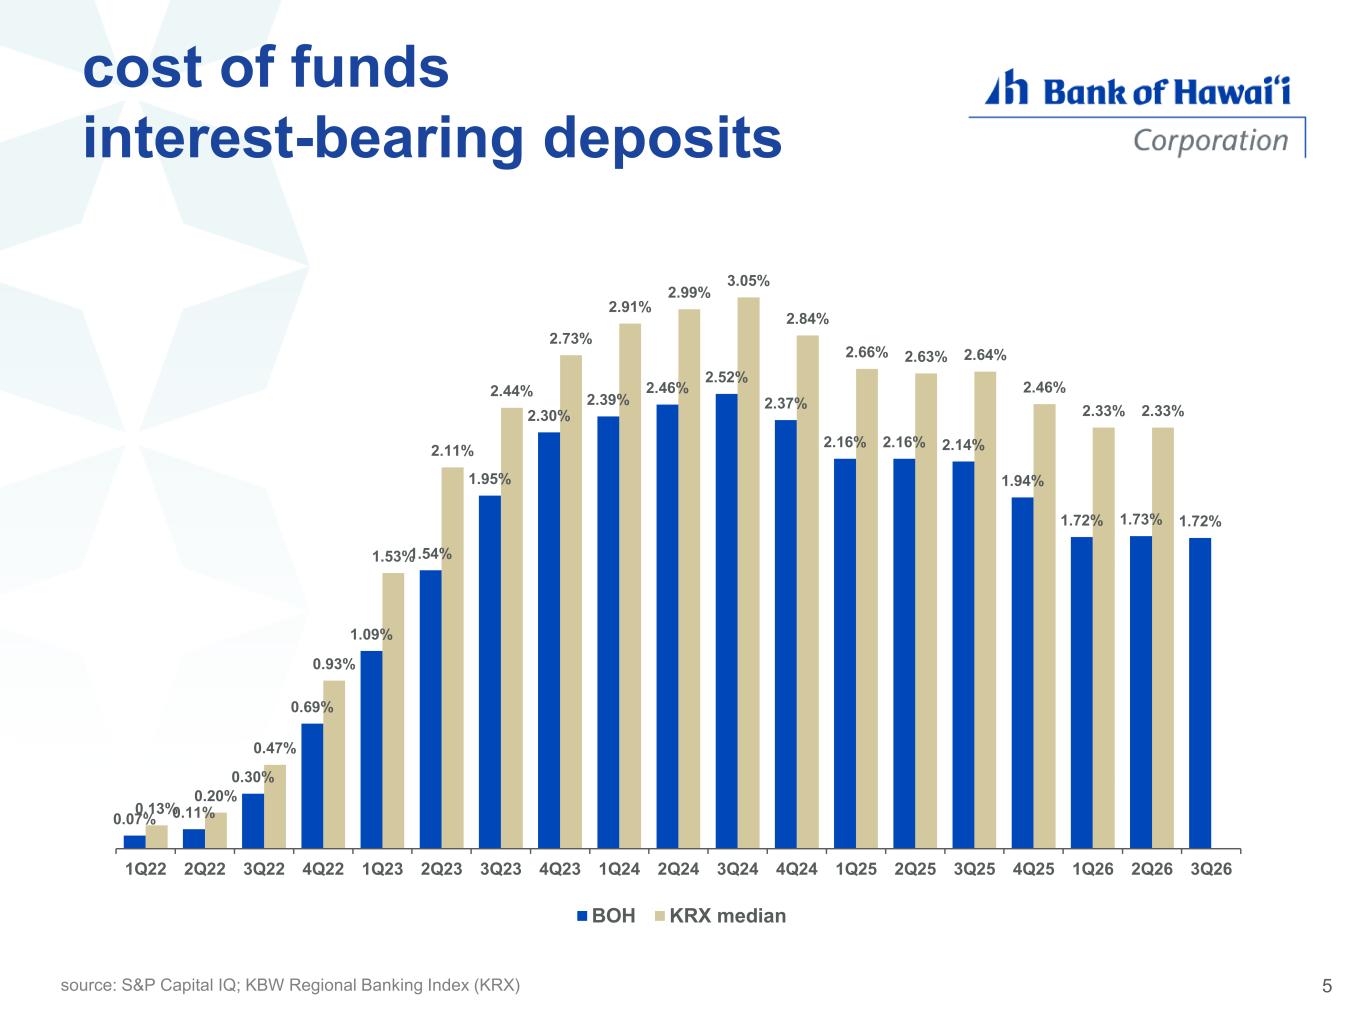
cost of funds interest-bearing deposits source: S&P Capital IQ; KBW Regional Banking Index (KRX) 5 0.07% 0.11% 0.30% 0.69% 1.09% 1.54% 1.95% 2.30% 2.39% 2.46% 2.52% 2.37% 2.16% 2.16% 2.14% 1.94% 1.72% 1.73% 1.72% 0.13% 0.20% 0.47% 0.93% 1.53% 2.11% 2.44% 2.73% 2.91% 2.99% 3.05% 2.84% 2.66% 2.63% 2.64% 2.46% 2.33% 2.33% 1Q22 2Q22 3Q22 4Q22 1Q23 2Q23 3Q23 4Q23 1Q24 2Q24 3Q24 4Q24 1Q25 2Q25 3Q25 4Q25 1Q26 2Q26 3Q26 BOH KRX median
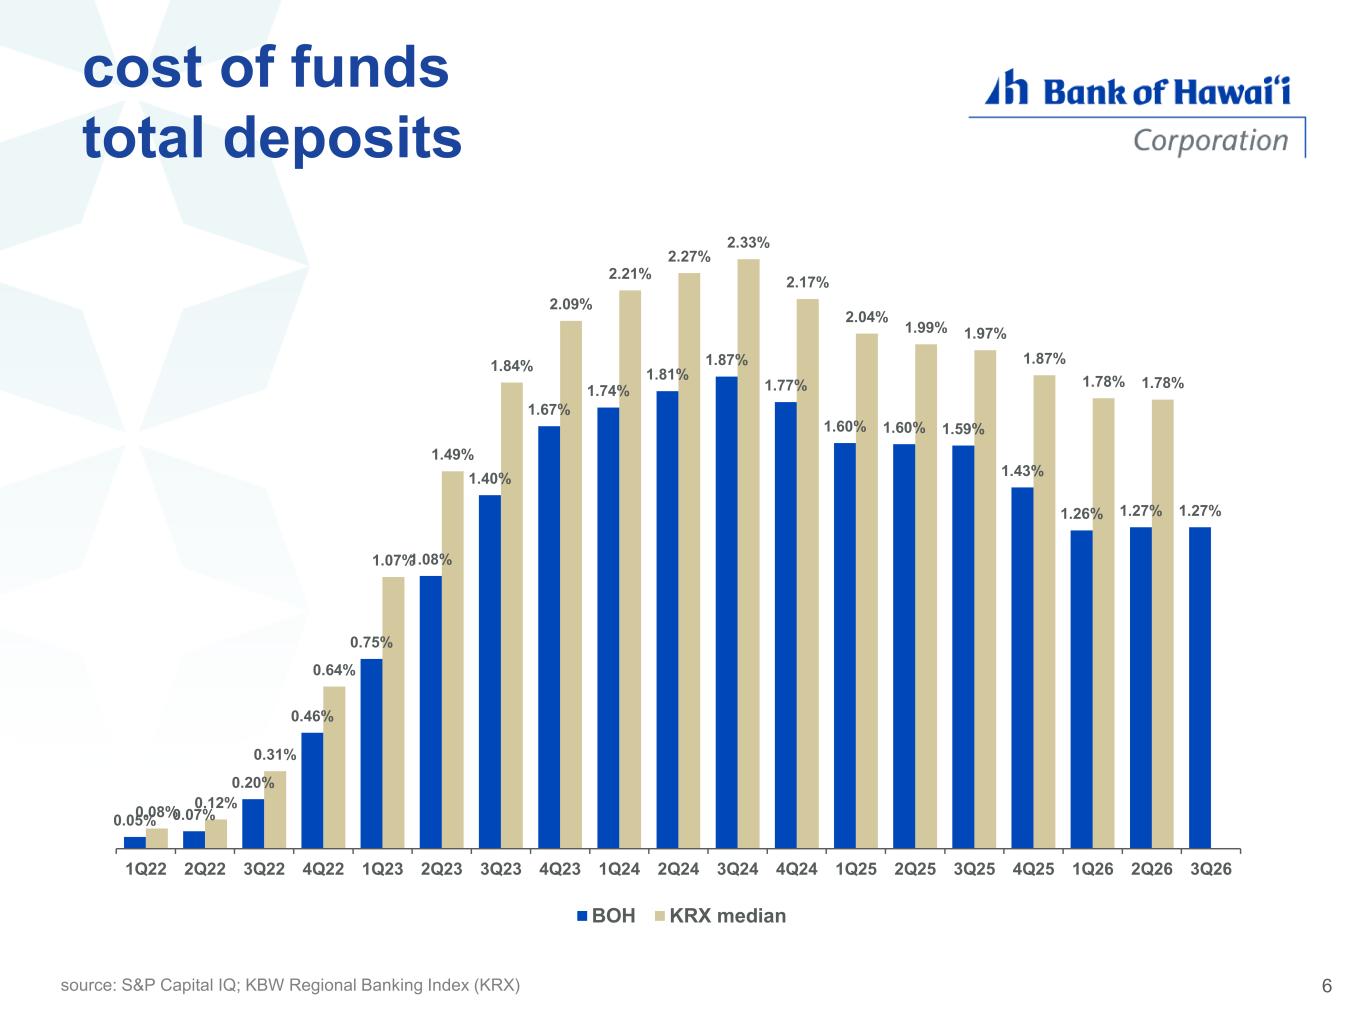
cost of funds total deposits source: S&P Capital IQ; KBW Regional Banking Index (KRX) 6 0.05% 0.07% 0.20% 0.46% 0.75% 1.08% 1.40% 1.67% 1.74% 1.81% 1.87% 1.77% 1.60% 1.60% 1.59% 1.43% 1.26% 1.27% 1.27% 0.08% 0.12% 0.31% 0.64% 1.07% 1.49% 1.84% 2.09% 2.21% 2.27% 2.33% 2.17% 2.04% 1.99% 1.97% 1.87% 1.78% 1.78% 1Q22 2Q22 3Q22 4Q22 1Q23 2Q23 3Q23 4Q23 1Q24 2Q24 3Q24 4Q24 1Q25 2Q25 3Q25 4Q25 1Q26 2Q26 3Q26 BOH KRX median
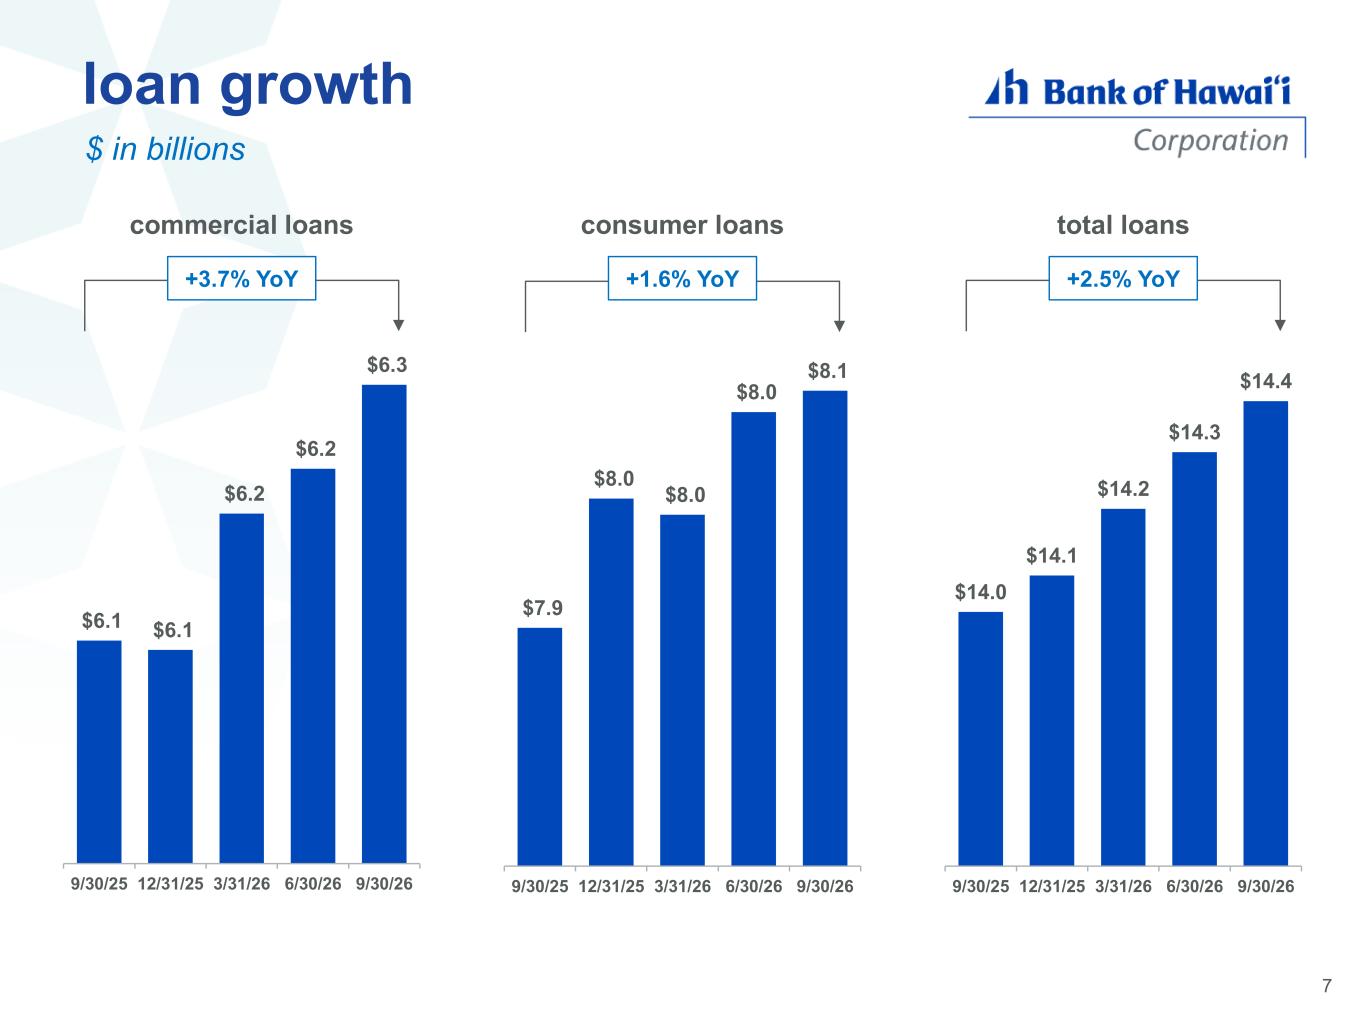
$7.9 $8.0 $8.0 $8.0 $8.1 9/30/25 12/31/25 3/31/26 6/30/26 9/30/26 consumer loans loan growth $ in billions 7 $6.1 $6.1 $6.2 $6.2 $6.3 9/30/25 12/31/25 3/31/26 6/30/26 9/30/26 commercial loans +3.7% YoY +1.6% YoY $14.0 $14.1 $14.2 $14.3 $14.4 9/30/25 12/31/25 3/31/26 6/30/26 9/30/26 total loans +2.5% YoY
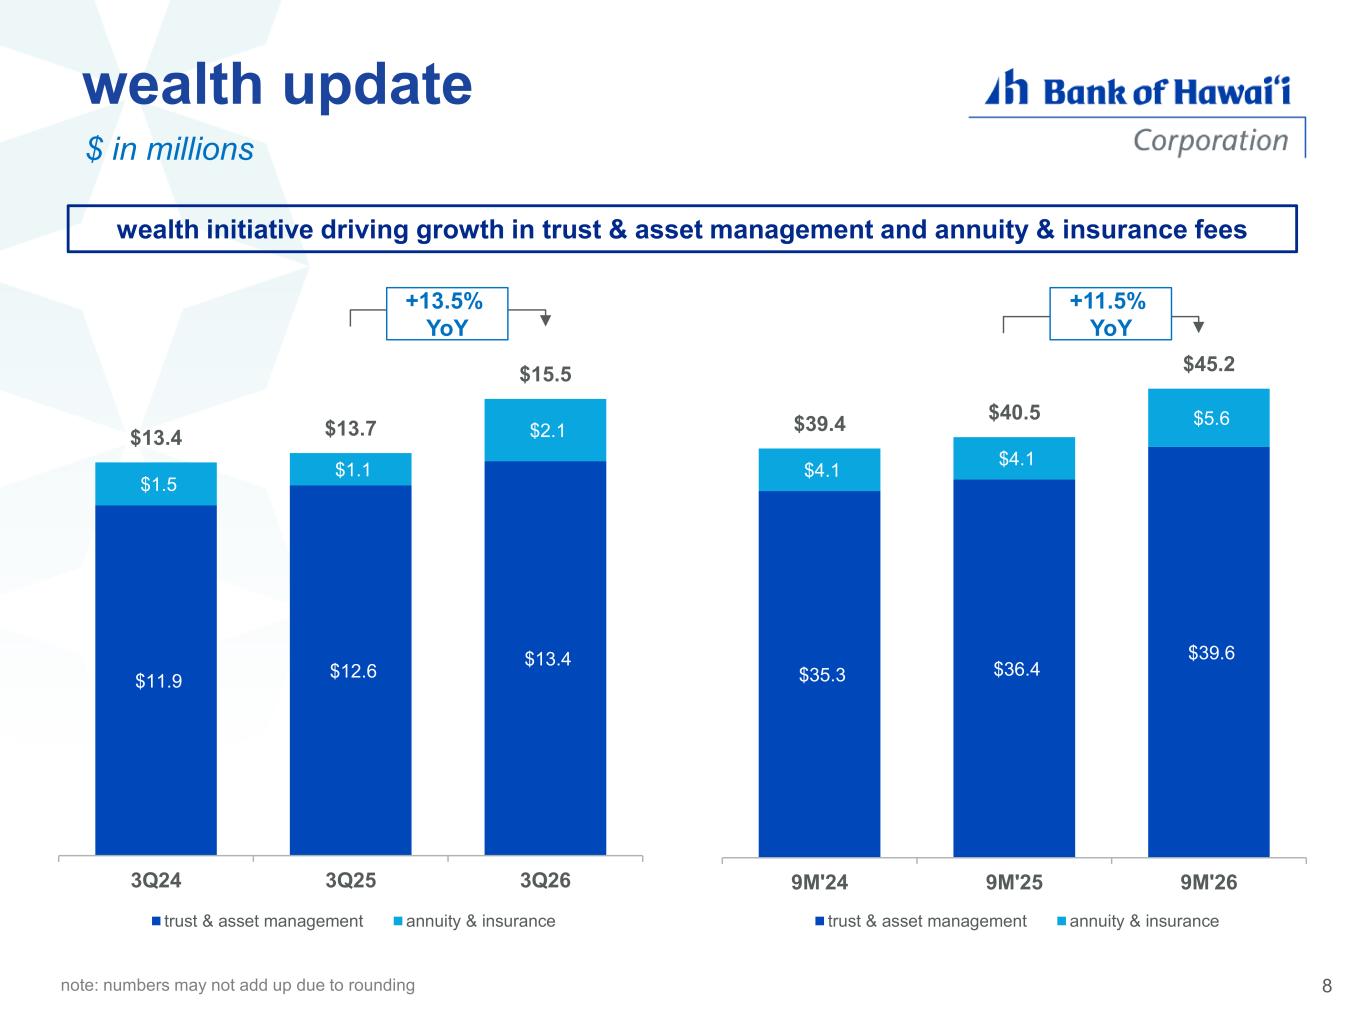
$11.9 $12.6 $13.4 $1.5 $1.1 $2.1 $13.4 $13.7 $15.5 3Q24 3Q25 3Q26 trust & asset management annuity & insurance wealth update $ in millions 8 $35.3 $36.4 $39.6 $4.1 $4.1 $5.6 $39.4 $40.5 $45.2 9M'24 9M'25 9M'26 trust & asset management annuity & insurance wealth initiative driving growth in trust & asset management and annuity & insurance fees +13.5% YoY +11.5% YoY note: numbers may not add up due to rounding
credit performance
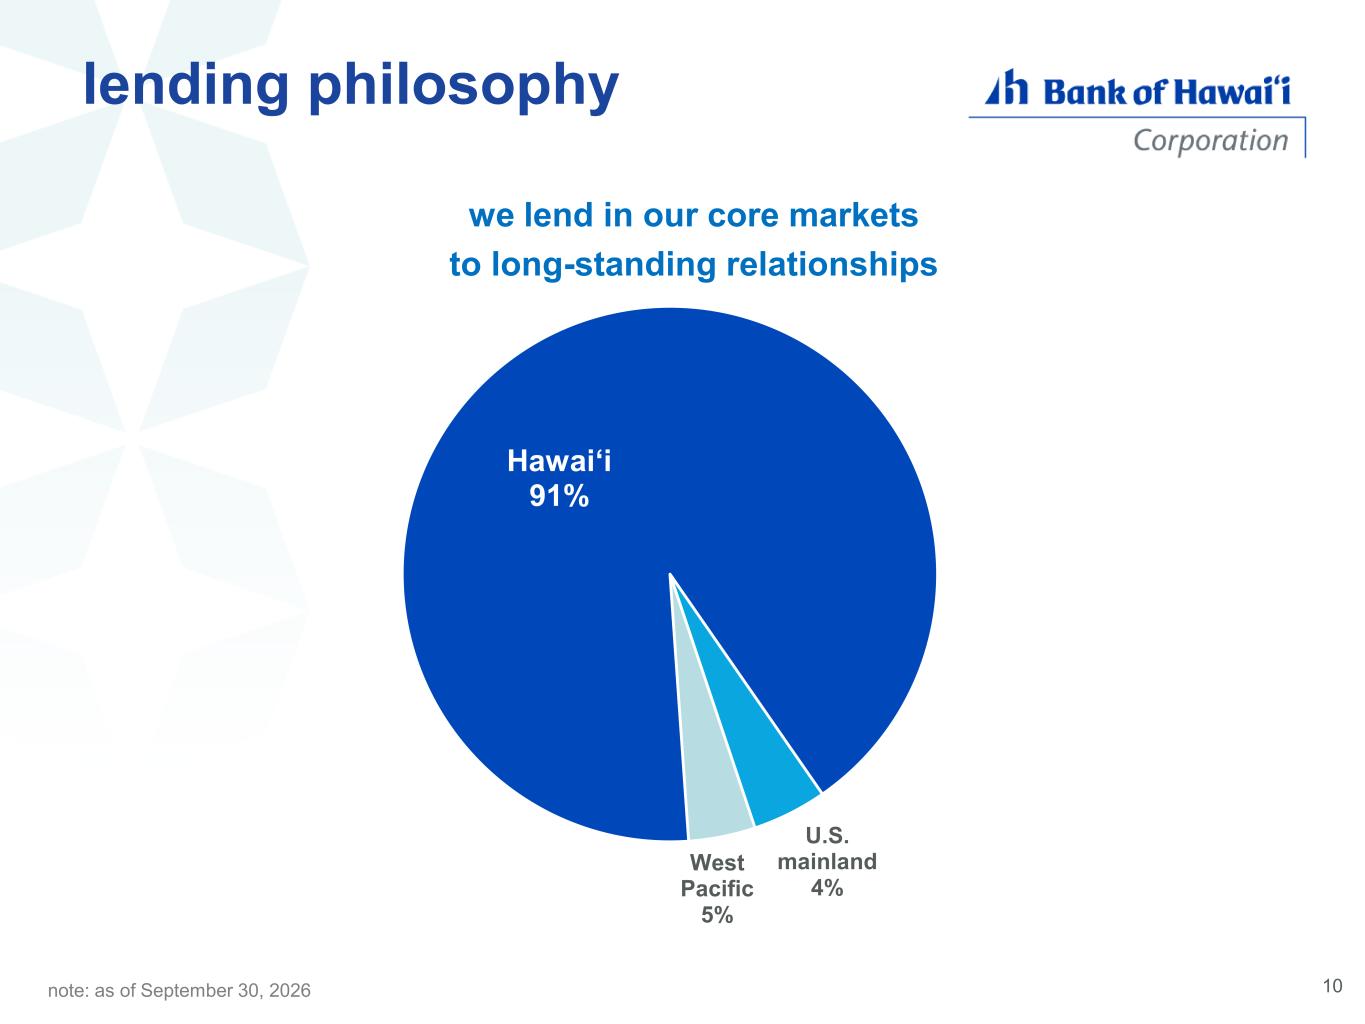
lending philosophy Hawaiʻi 91% U.S. mainland 4% West Pacific 5% we lend in our core markets to long-standing relationships note: as of September 30, 2026 10
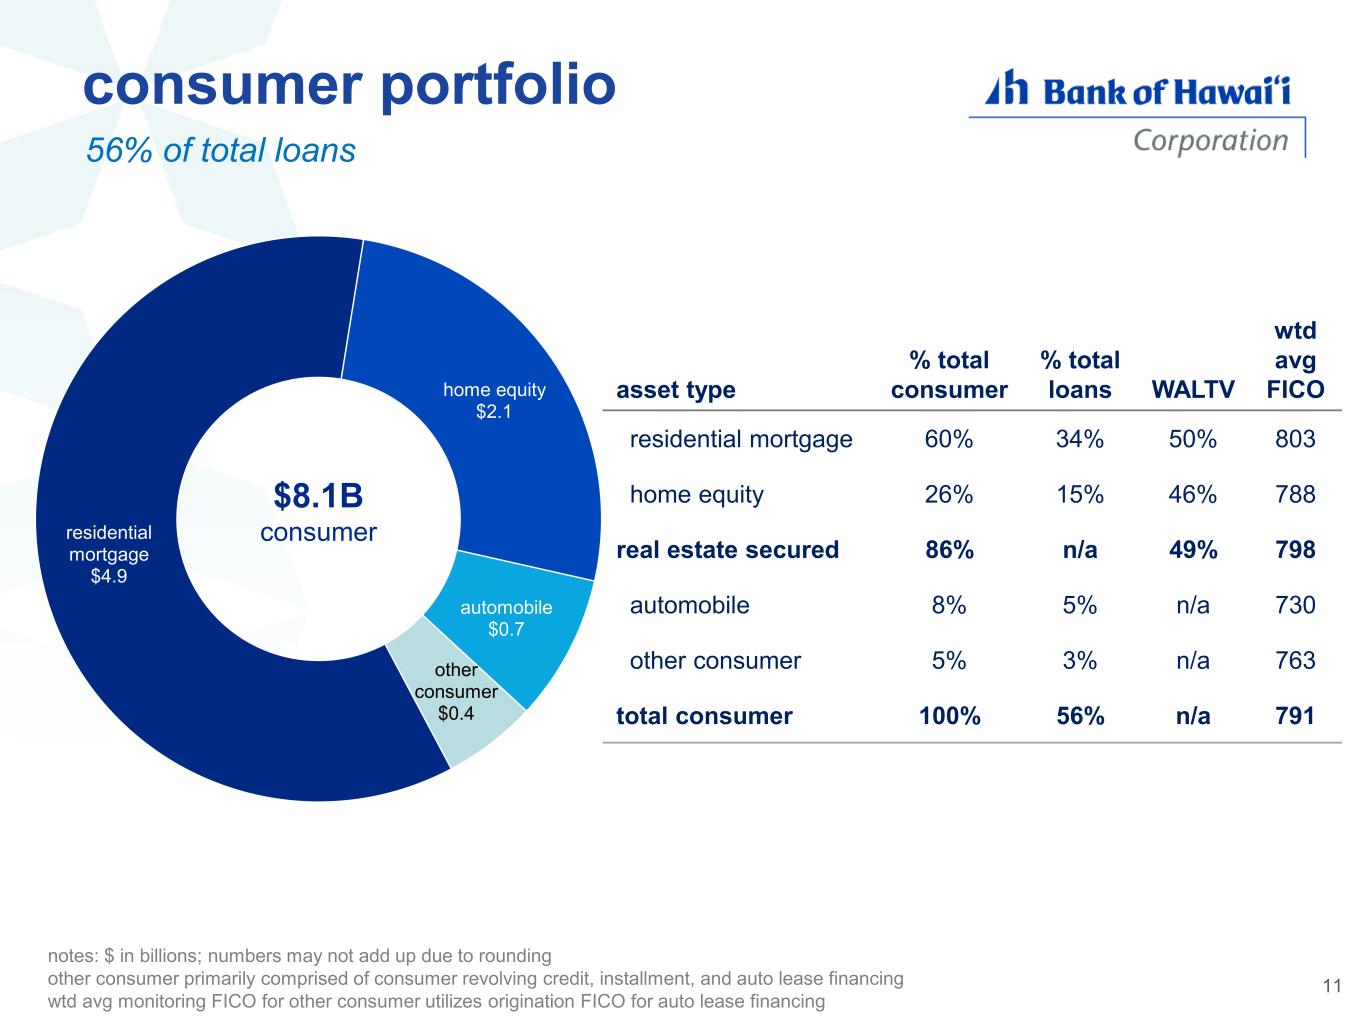
residential mortgage $4.9 home equity $2.1 automobile $0.7 other consumer $0.4 consumer portfolio asset type % total consumer % total loans WALTV wtd avg FICO residential mortgage 60% 34% 50% 803 home equity 26% 15% 46% 788 real estate secured 86% n/a 49% 798 automobile 8% 5% n/a 730 other consumer 5% 3% n/a 763 total consumer 100% 56% n/a 791 $8.1B consumer notes: $ in billions; numbers may not add up due to rounding other consumer primarily comprised of consumer revolving credit, installment, and auto lease financing wtd avg monitoring FICO for other consumer utilizes origination FICO for auto lease financing 56% of total loans 11
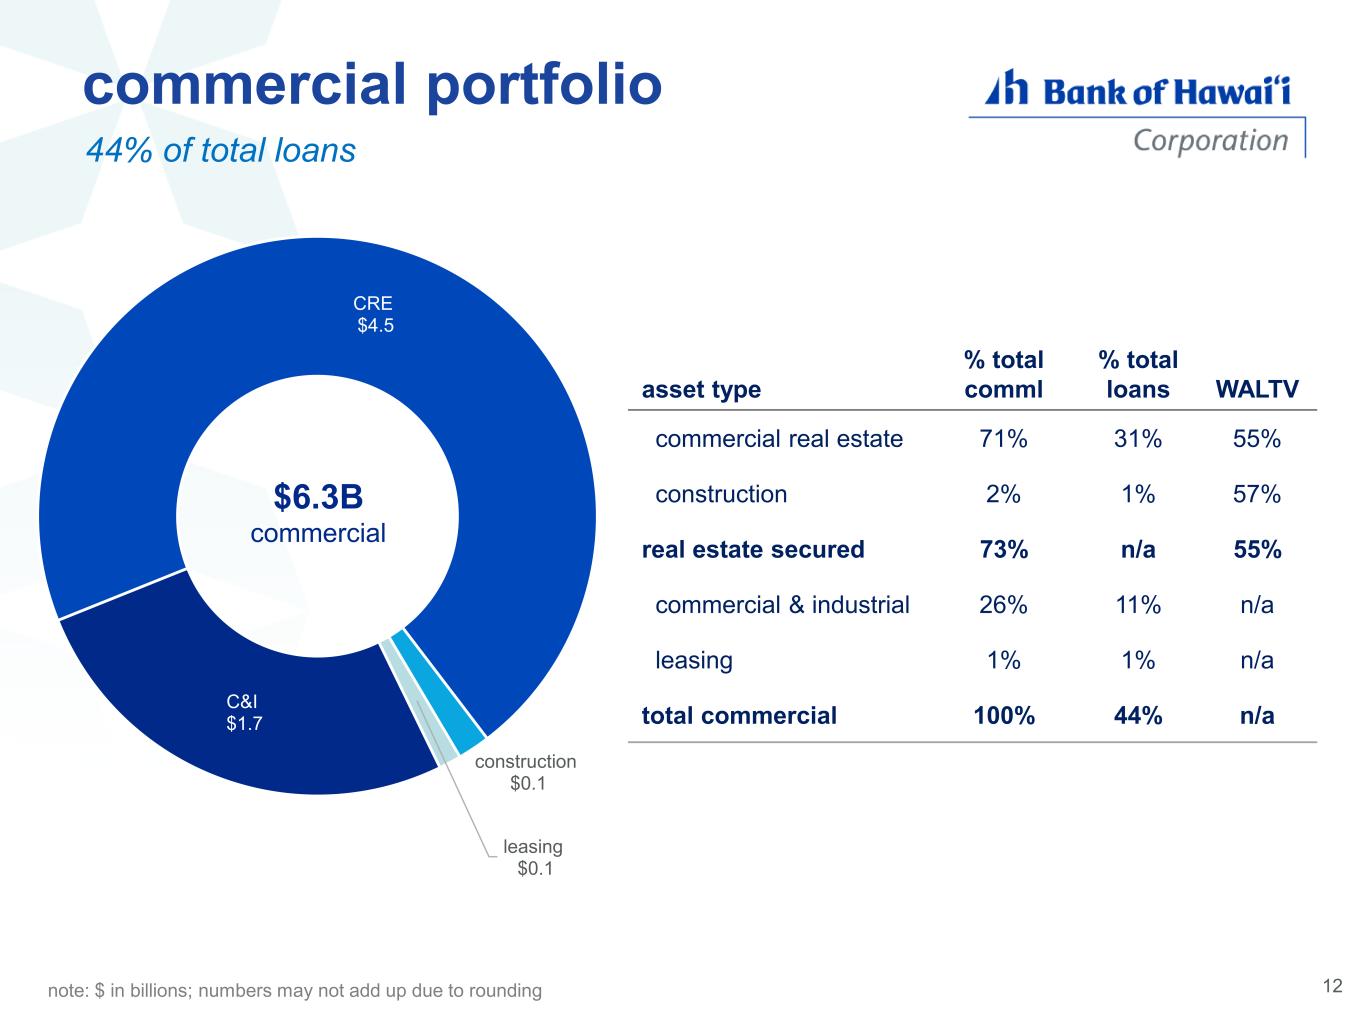
C&I $1.7 CRE $4.5 construction $0.1 leasing $0.1 commercial portfolio residential mortgage home equity $6.3B commercial asset type % total comml % total loans WALTV commercial real estate 71% 31% 55% construction 2% 1% 57% real estate secured 73% n/a 55% commercial & industrial 26% 11% n/a leasing 1% 1% n/a total commercial 100% 44% n/a note: $ in billions; numbers may not add up due to rounding 44% of total loans 12
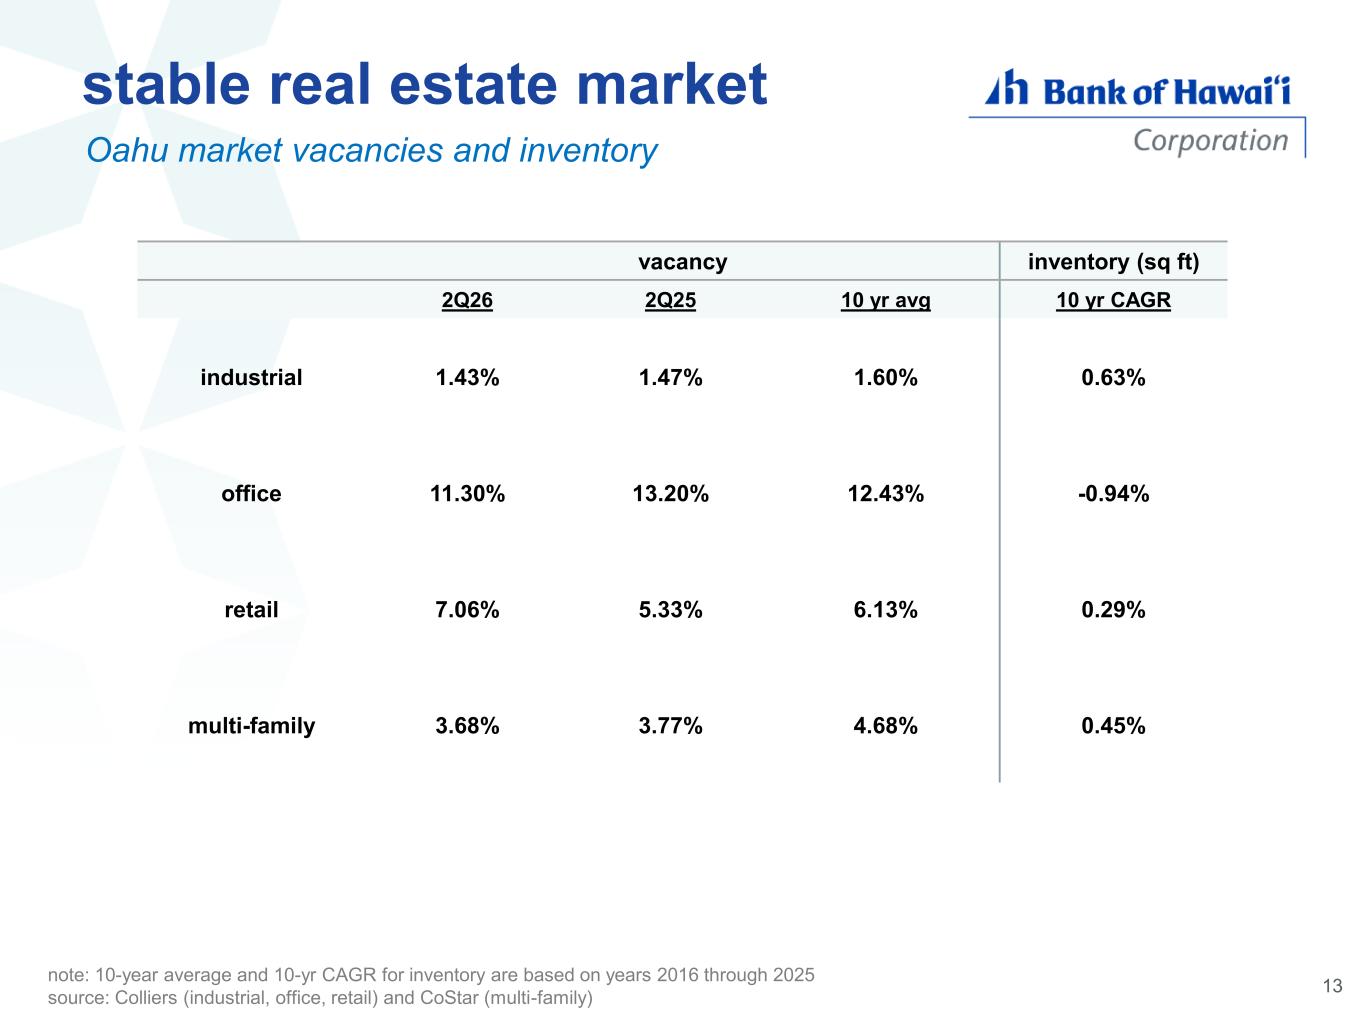
vacancy inventory (sq ft) 2Q26 2Q25 10 yr avg 10 yr CAGR industrial 1.43% 1.47% 1.60% 0.63% office 11.30% 13.20% 12.43% -0.94% retail 7.06% 5.33% 6.13% 0.29% multi-family 3.68% 3.77% 4.68% 0.45% Oahu market vacancies and inventory stable real estate market note: 10-year average and 10-yr CAGR for inventory are based on years 2016 through 2025 source: Colliers (industrial, office, retail) and CoStar (multi-family) 13
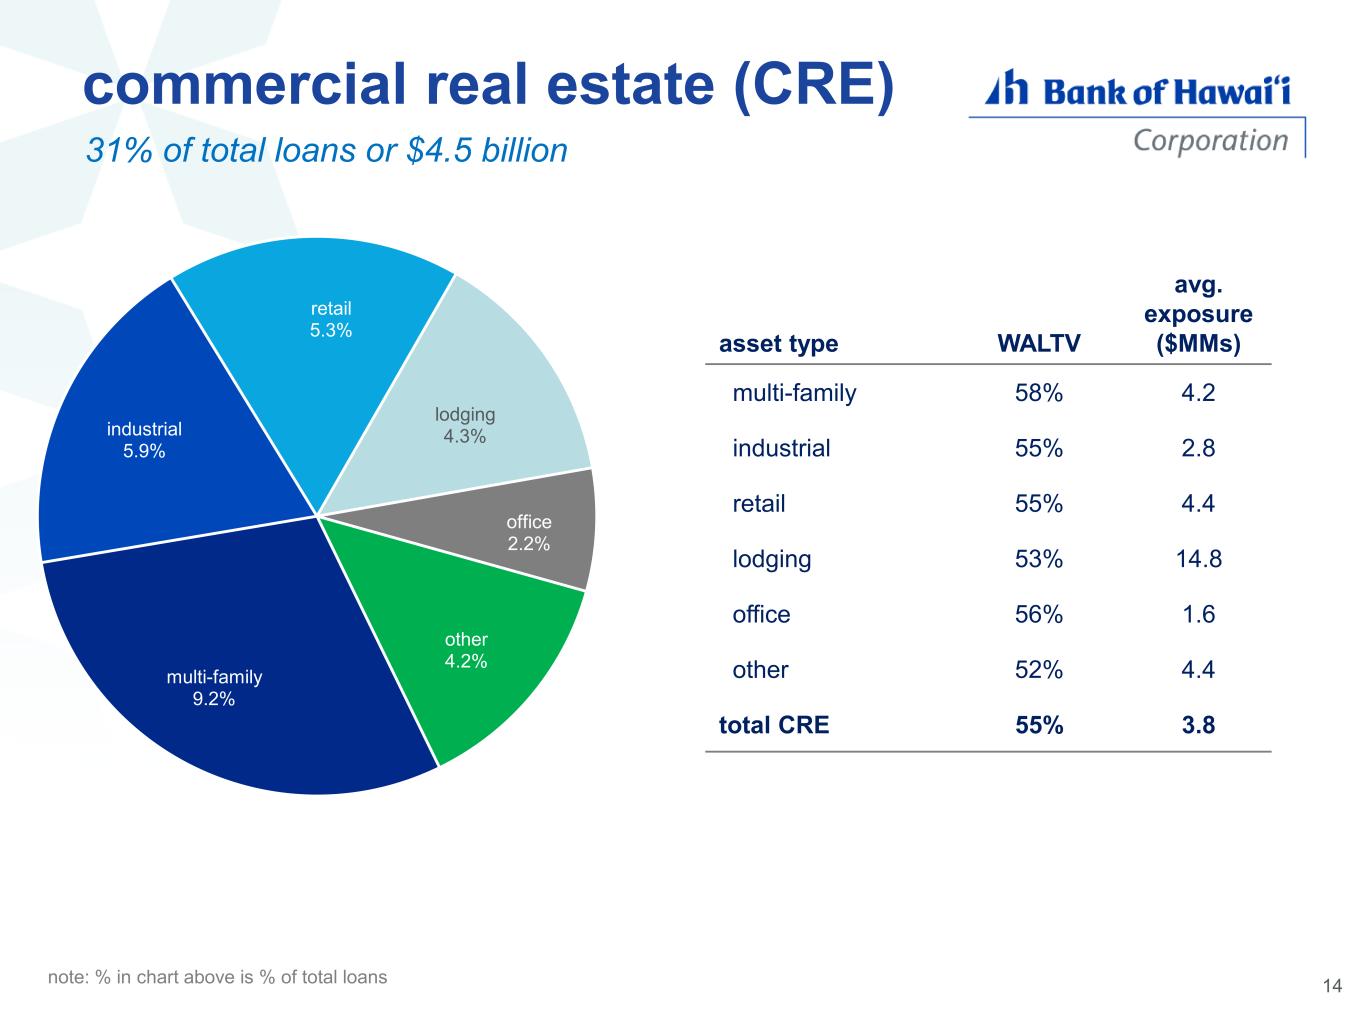
multi-family 9.2% industrial 5.9% retail 5.3% lodging 4.3% office 2.2% other 4.2% commercial real estate (CRE) residential mortgage home equity 31% of total loans or $4.5 billion asset type WALTV avg. exposure ($MMs) multi-family 58% 4.2 industrial 55% 2.8 retail 55% 4.4 lodging 53% 14.8 office 56% 1.6 other 52% 4.4 total CRE 55% 3.8 note: % in chart above is % of total loans 14
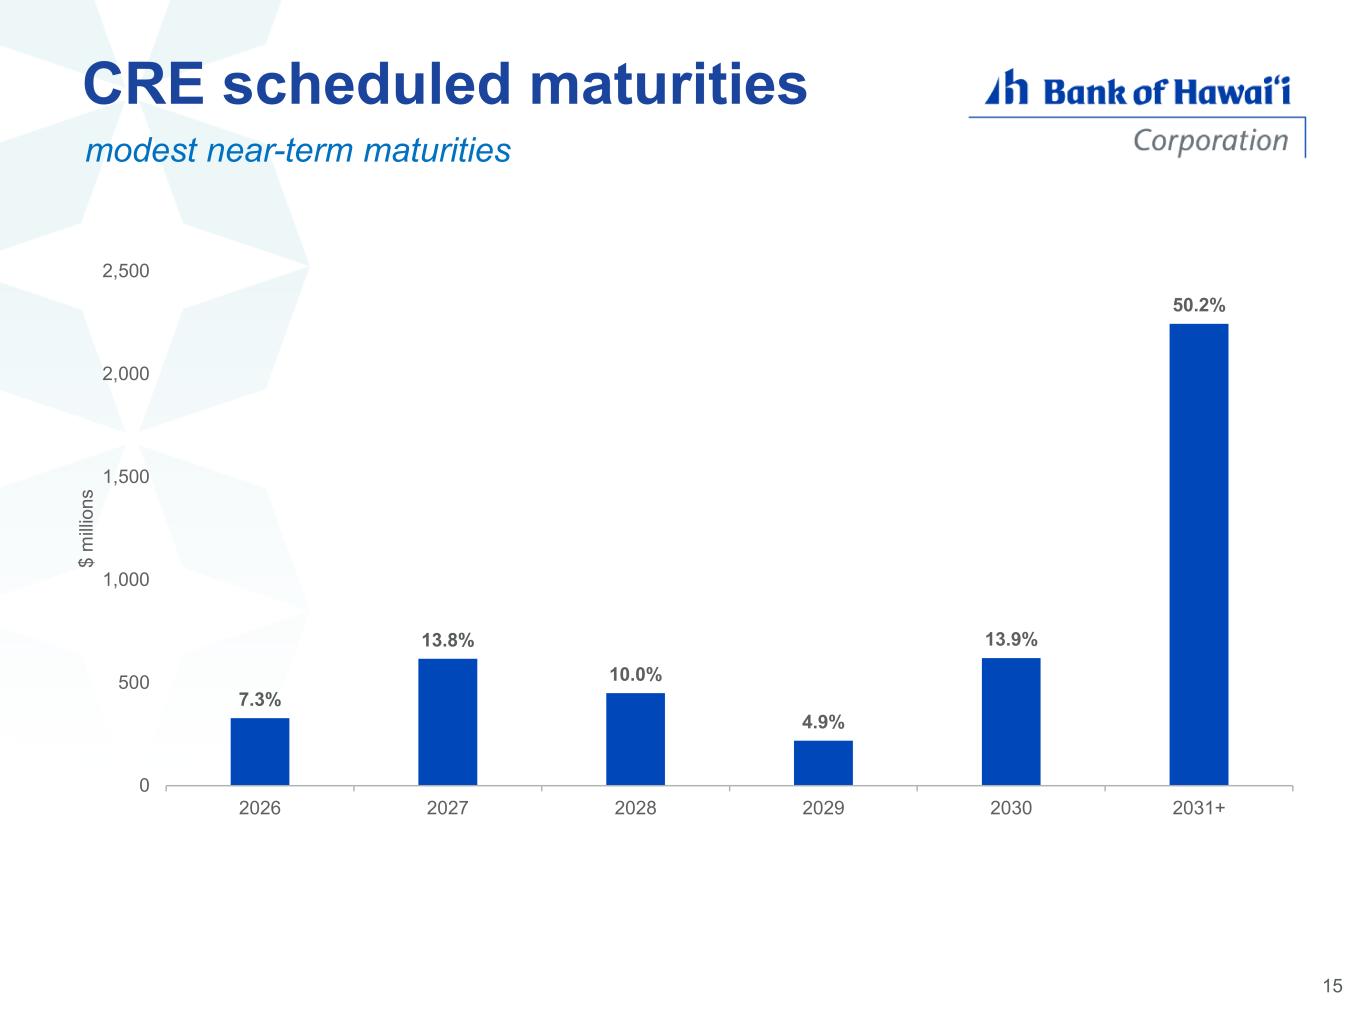
CRE scheduled maturities 7.3% 13.8% 10.0% 4.9% 13.9% 50.2% 0 500 1,000 1,500 2,000 2,500 2026 2027 2028 2029 2030 2031+ $ m ill io n s modest near-term maturities 15
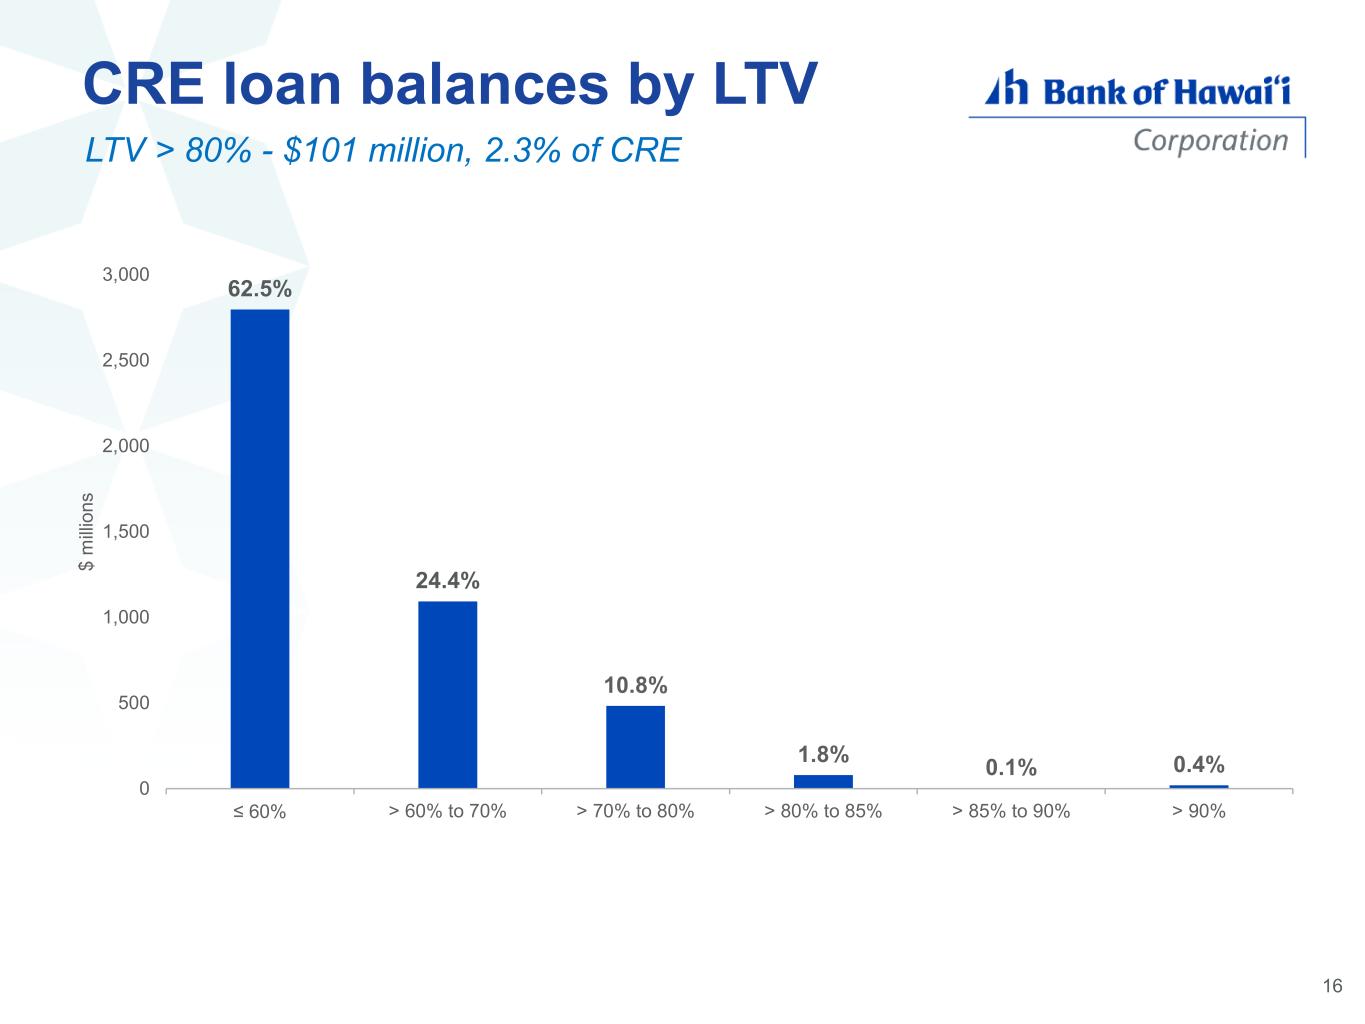
62.5% 24.4% 10.8% 1.8% 0.1% 0.4% 0 500 1,000 1,500 2,000 2,500 3,000 ≤ 60% > 60% to 70% > 70% to 80% > 80% to 85% > 85% to 90% > 90% $ m ill io n s CRE loan balances by LTV LTV > 80% - $101 million, 2.3% of CRE 16
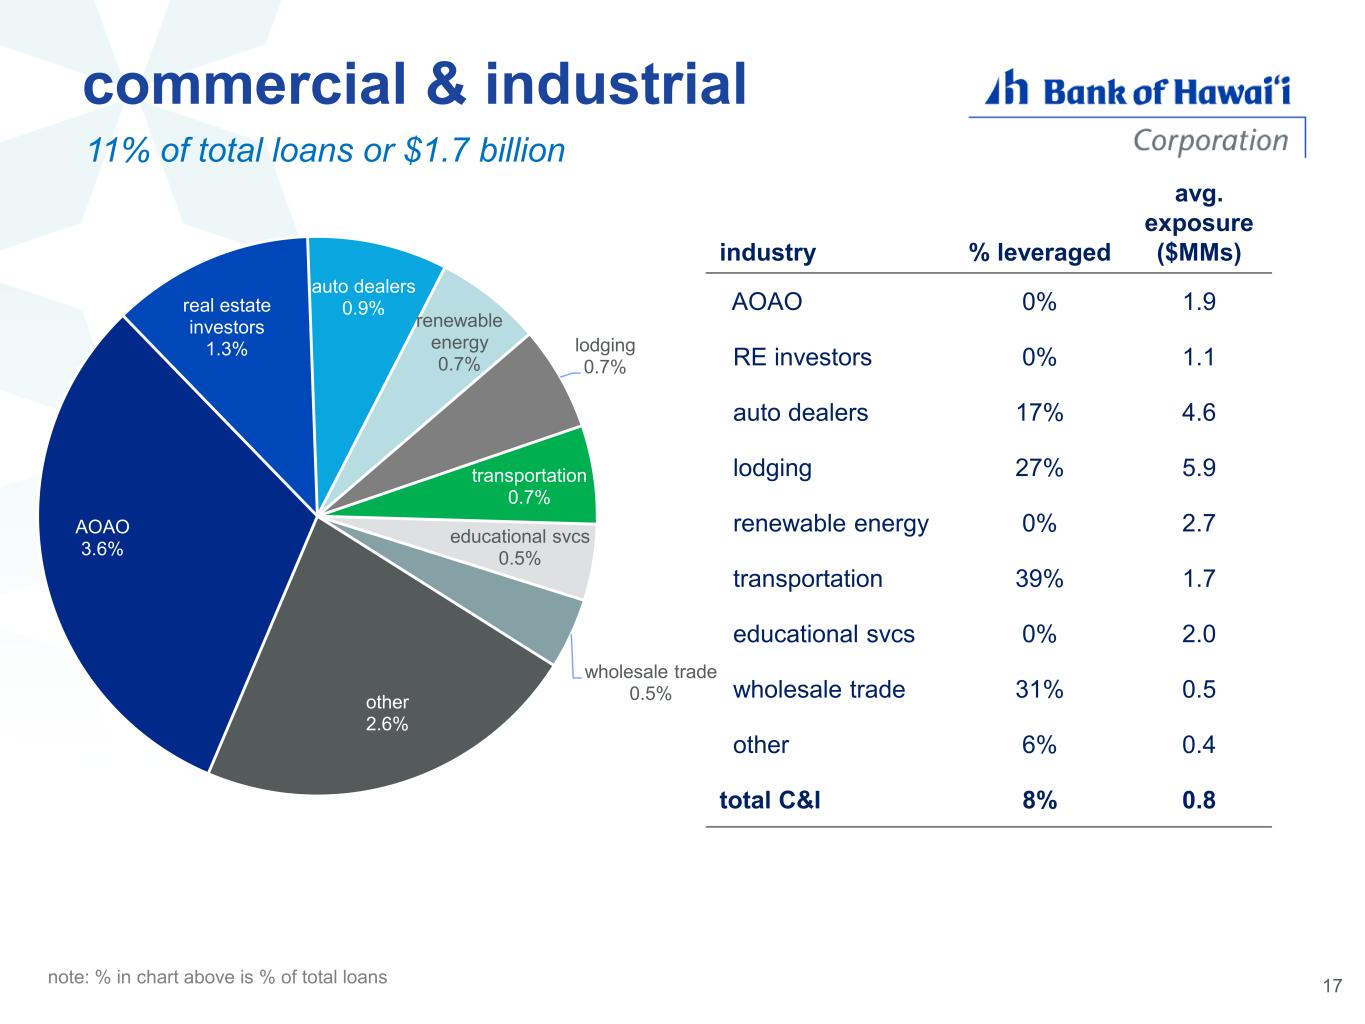
AOAO 3.6% real estate investors 1.3% auto dealers 0.9% renewable energy 0.7% lodging 0.7% transportation 0.7% educational svcs 0.5% wholesale trade 0.5%other 2.6% commercial & industrial residential mortgage home equity 11% of total loans or $1.7 billion industry % leveraged avg. exposure ($MMs) AOAO 0% 1.9 RE investors 0% 1.1 auto dealers 17% 4.6 lodging 27% 5.9 renewable energy 0% 2.7 transportation 39% 1.7 educational svcs 0% 2.0 wholesale trade 31% 0.5 other 6% 0.4 total C&I 8% 0.8 17 note: % in chart above is % of total loans
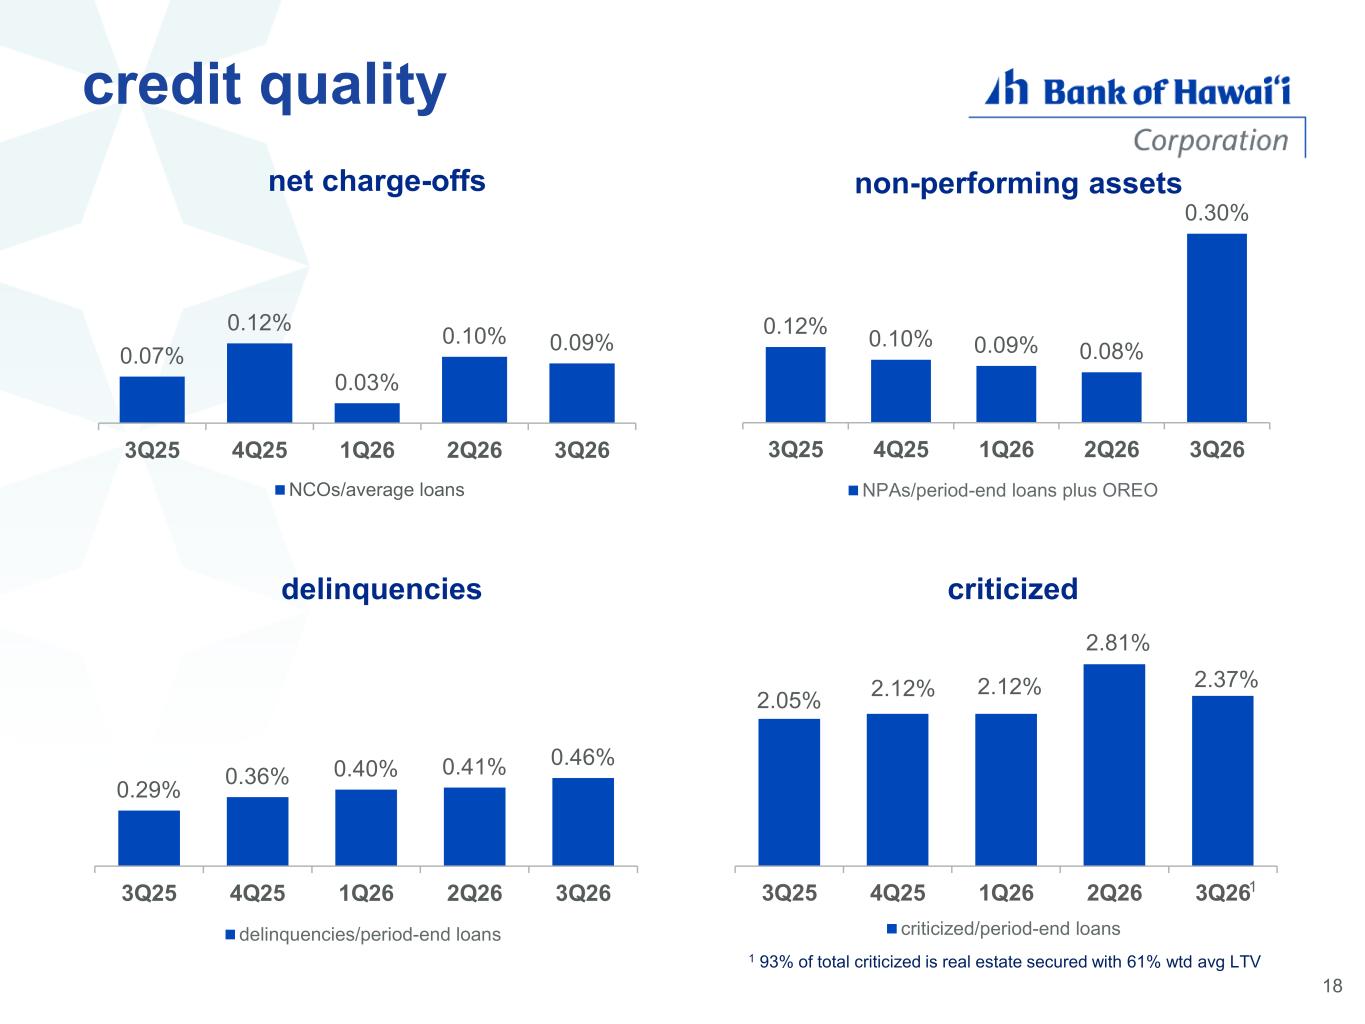
credit quality 0.07% 0.12% 0.03% 0.10% 0.09% $0 $0 $0 $0 $0 $0 $0 $0 $0 3Q25 4Q25 1Q26 2Q26 3Q26 net charge-offs NCOs/average loans 1 93% of total criticized is real estate secured with 61% wtd avg LTV 0.29% 0.36% 0.40% 0.41% 0.46% 0.00% 0.20% 0.40% 0.60% 0.80% 1.00% 1.20% 1.40% 3Q25 4Q25 1Q26 2Q26 3Q26 delinquencies delinquencies/period-end loans 2.05% 2.12% 2.12% 2.81% 2.37% 3Q25 4Q25 1Q26 2Q26 3Q26 criticized criticized/period-end loans 1 18 0.12% 0.10% 0.09% 0.08% 0.30% 0.00% 0.05% 0.10% 0.15% 0.20% 0.25% 0.30% 0.35% 0.40% 3Q25 4Q25 1Q26 2Q26 3Q26 non-performing assets NPAs/period-end loans plus OREO
financial update
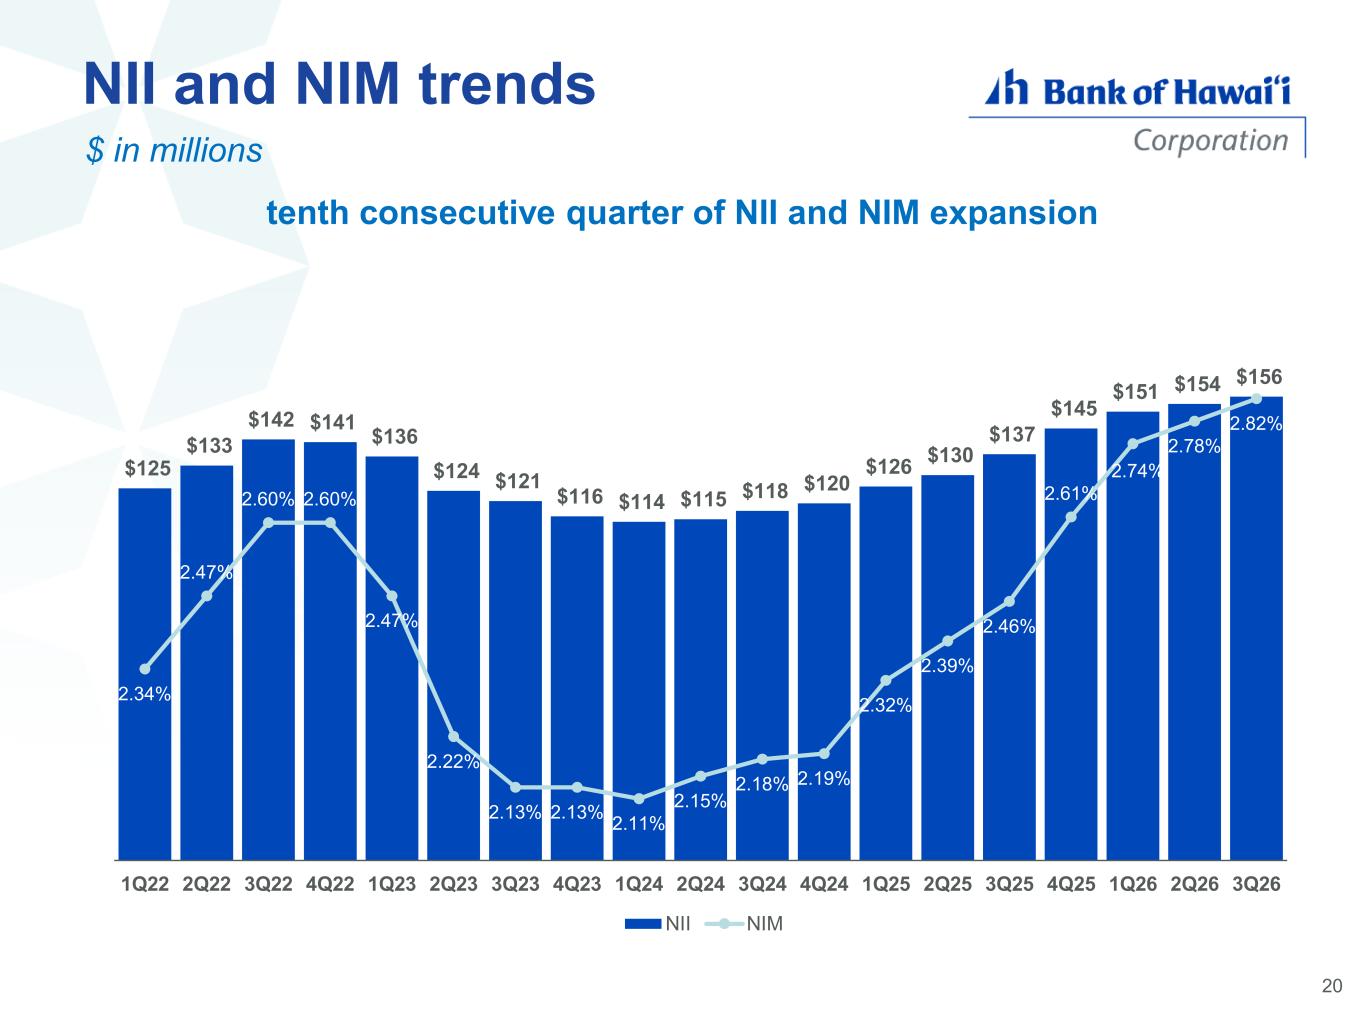
NII and NIM trends tenth consecutive quarter of NII and NIM expansion $ in millions $125 $133 $142 $141 $136 $124 $121 $116 $114 $115 $118 $120 $126 $130 $137 $145 $151 $154 $156 2.34% 2.47% 2.60% 2.60% 2.47% 2.22% 2.13% 2.13% 2.11% 2.15% 2.18% 2.19% 2.32% 2.39% 2.46% 2.61% 2.74% 2.78% 2.82% 1Q22 2Q22 3Q22 4Q22 1Q23 2Q23 3Q23 4Q23 1Q24 2Q24 3Q24 4Q24 1Q25 2Q25 3Q25 4Q25 1Q26 2Q26 3Q26 NII NIM 20
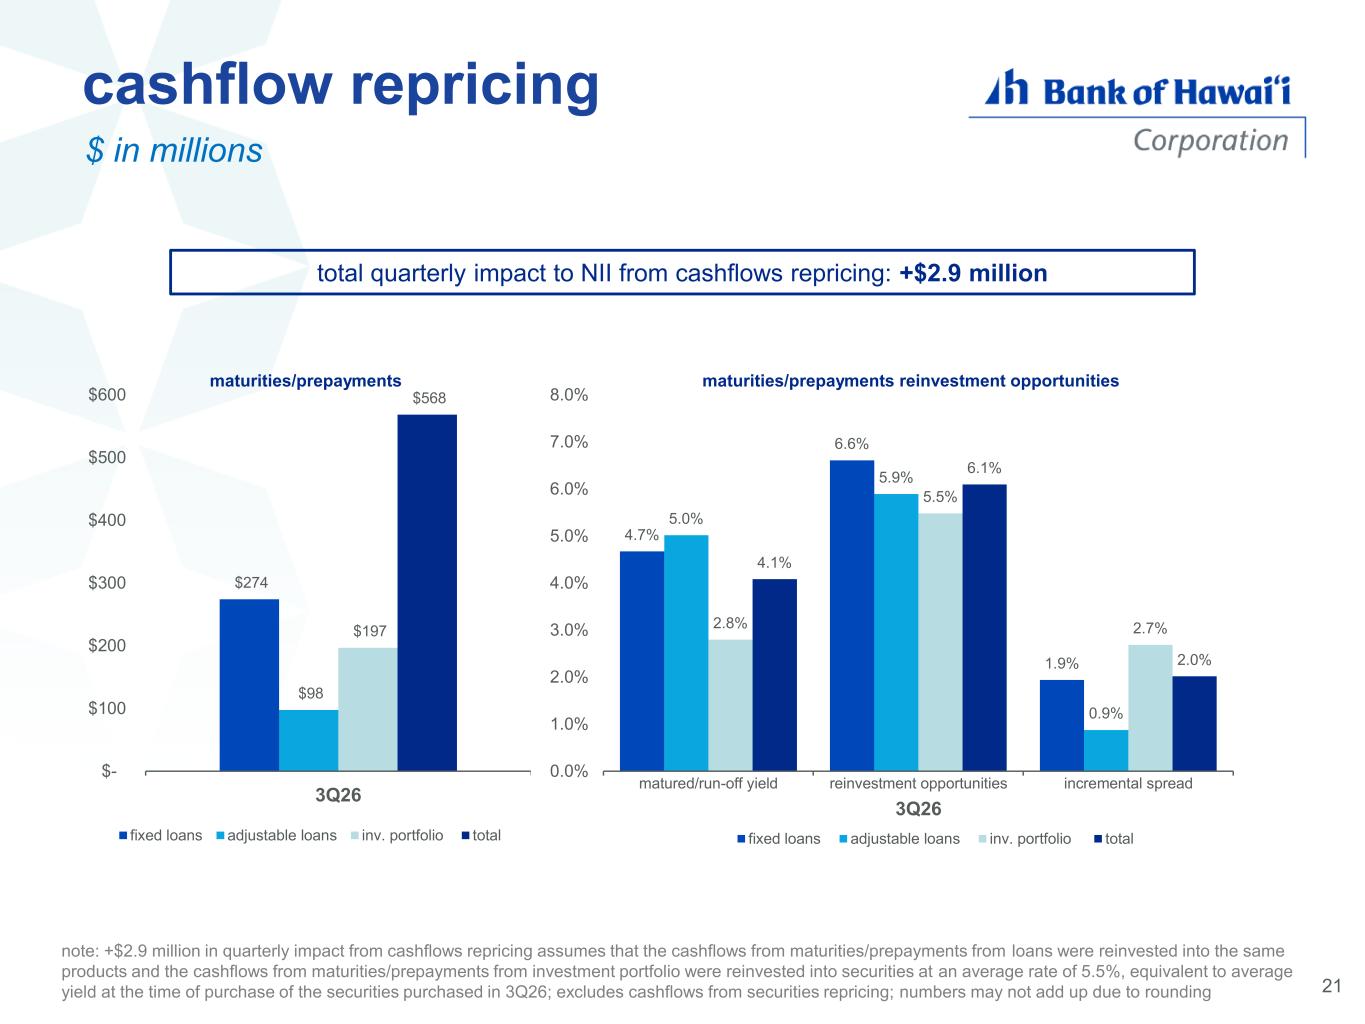
cashflow repricing total quarterly impact to NII from cashflows repricing: +$2.9 million note: +$2.9 million in quarterly impact from cashflows repricing assumes that the cashflows from maturities/prepayments from loans were reinvested into the same products and the cashflows from maturities/prepayments from investment portfolio were reinvested into securities at an average rate of 5.5%, equivalent to average yield at the time of purchase of the securities purchased in 3Q26; excludes cashflows from securities repricing; numbers may not add up due to rounding 4.7% 6.6% 1.9% 5.0% 5.9% 0.9% 2.8% 5.5% 2.7% 4.1% 6.1% 2.0% 0.0% 1.0% 2.0% 3.0% 4.0% 5.0% 6.0% 7.0% 8.0% matured/run-off yield reinvestment opportunities incremental spread 3Q26 maturities/prepayments reinvestment opportunities fixed loans adjustable loans inv. portfolio total $274 $98 $197 $568 $- $100 $200 $300 $400 $500 $600 3Q26 maturities/prepayments fixed loans adjustable loans inv. portfolio total 21 $ in millions
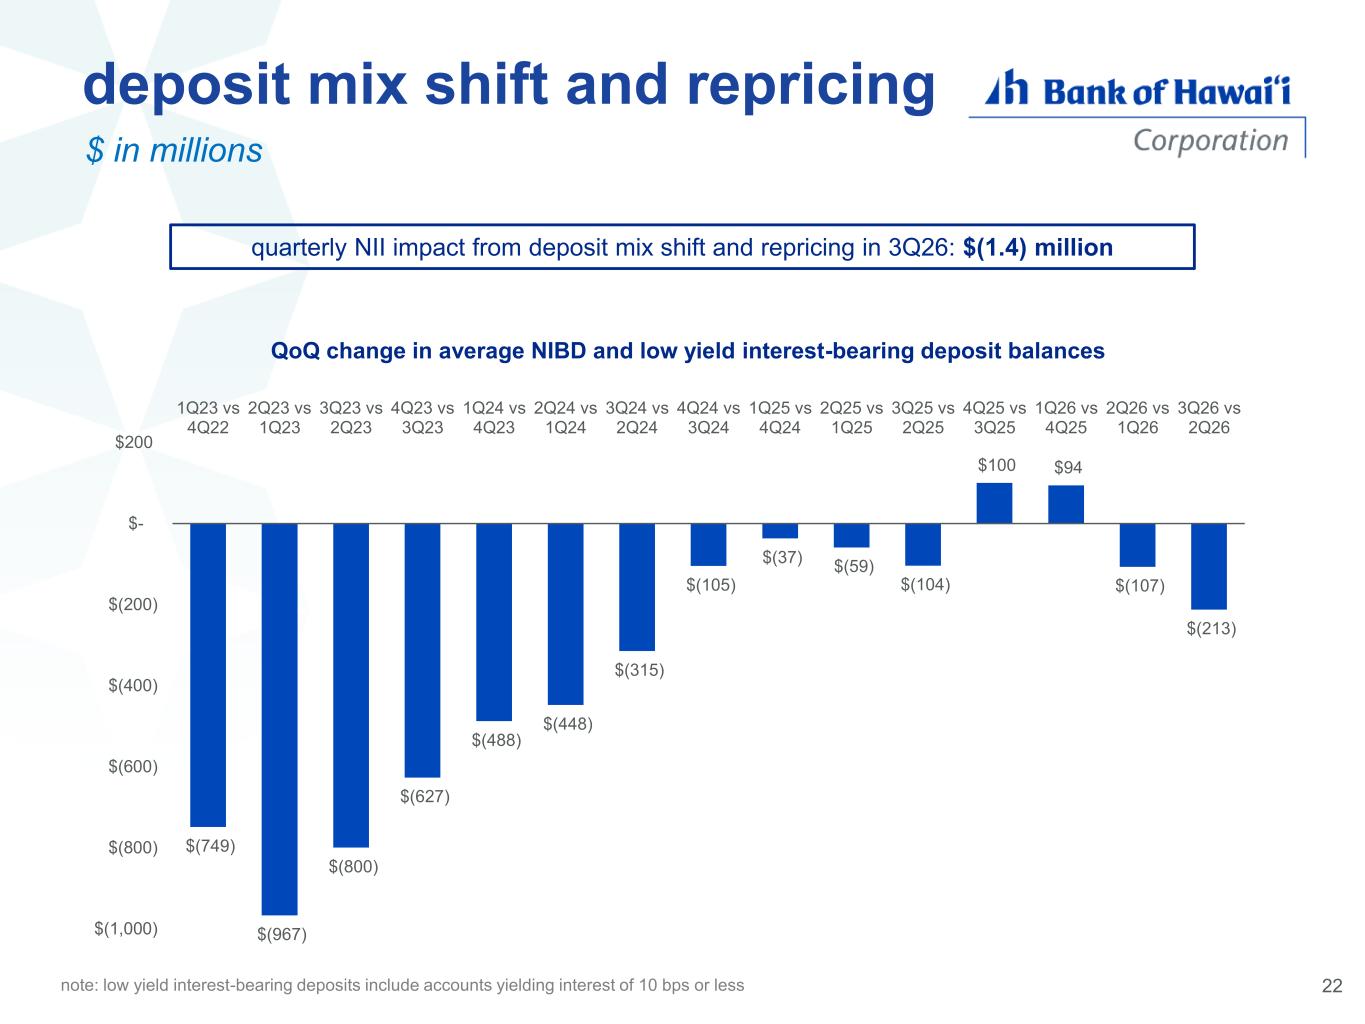
deposit mix shift and repricing quarterly NII impact from deposit mix shift and repricing in 3Q26: $(1.4) million $(749) $(967) $(800) $(627) $(488) $(448) $(315) $(105) $(37) $(59) $(104) $100 $94 $(107) $(213) $(1,000) $(800) $(600) $(400) $(200) $- $200 1Q23 vs 4Q22 2Q23 vs 1Q23 3Q23 vs 2Q23 4Q23 vs 3Q23 1Q24 vs 4Q23 2Q24 vs 1Q24 3Q24 vs 2Q24 4Q24 vs 3Q24 1Q25 vs 4Q24 2Q25 vs 1Q25 3Q25 vs 2Q25 4Q25 vs 3Q25 1Q26 vs 4Q25 2Q26 vs 1Q26 3Q26 vs 2Q26 QoQ change in average NIBD and low yield interest-bearing deposit balances 22 $ in millions note: low yield interest-bearing deposits include accounts yielding interest of 10 bps or less
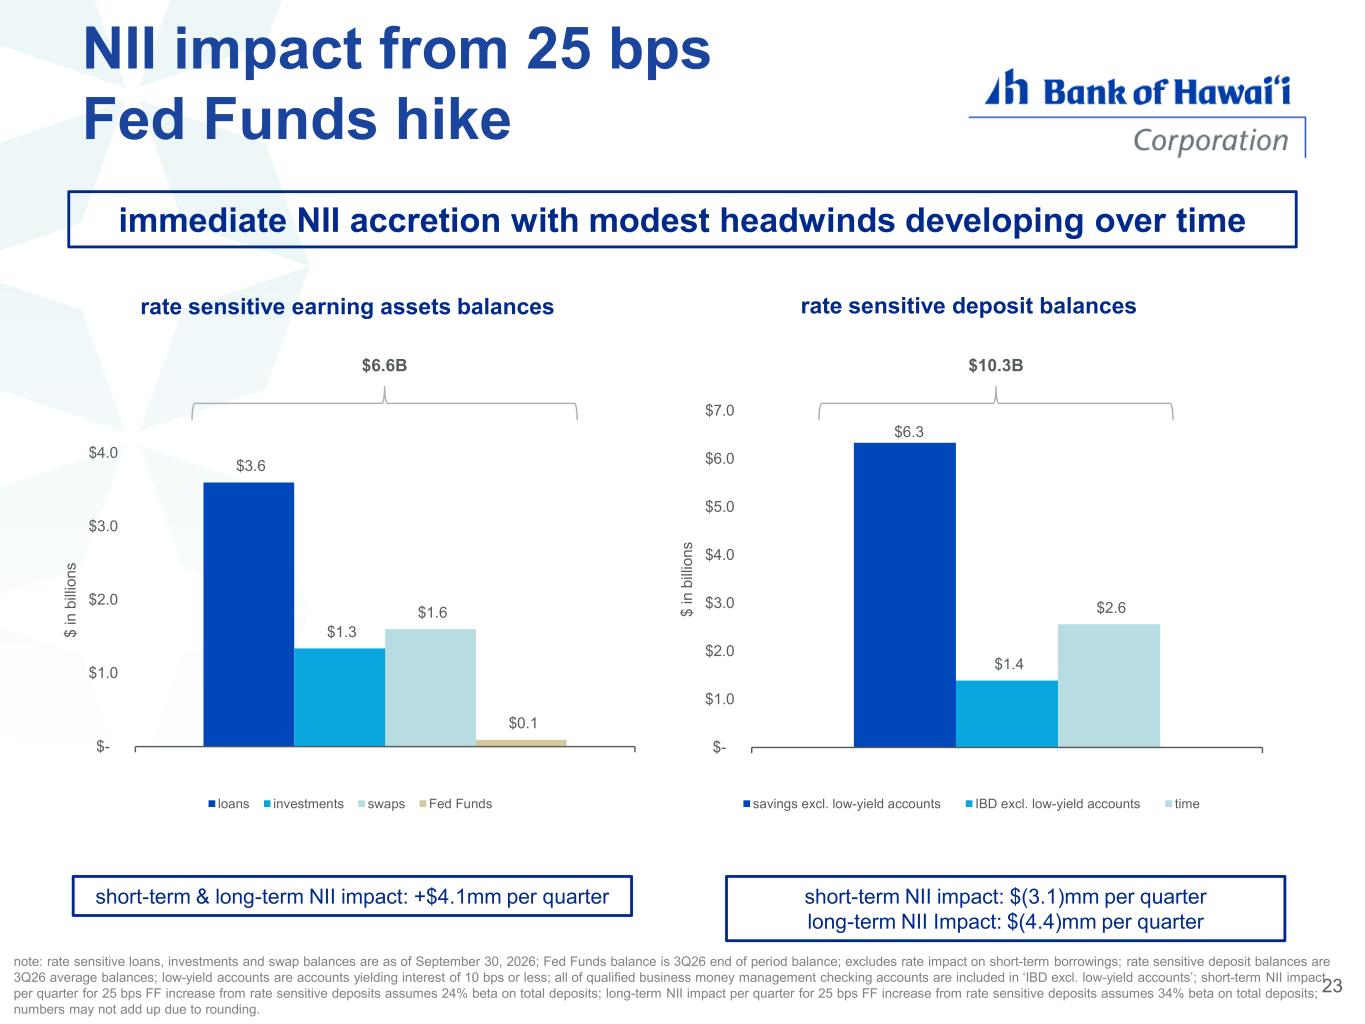
23 NII impact from 25 bps Fed Funds hike rate sensitive earning assets balances rate sensitive deposit balances $3.6 $1.3 $1.6 $0.1 $- $1.0 $2.0 $3.0 $4.0 $ i n b ill io n s loans investments swaps Fed Funds $6.6B short-term & long-term NII impact: +$4.1mm per quarter short-term NII impact: $(3.1)mm per quarter long-term NII Impact: $(4.4)mm per quarter note: rate sensitive loans, investments and swap balances are as of September 30, 2026; Fed Funds balance is 3Q26 end of period balance; excludes rate impact on short-term borrowings; rate sensitive deposit balances are 3Q26 average balances; low-yield accounts are accounts yielding interest of 10 bps or less; all of qualified business money management checking accounts are included in ‘IBD excl. low-yield accounts’; short-term NII impact per quarter for 25 bps FF increase from rate sensitive deposits assumes 24% beta on total deposits; long-term NII impact per quarter for 25 bps FF increase from rate sensitive deposits assumes 34% beta on total deposits; numbers may not add up due to rounding. immediate NII accretion with modest headwinds developing over time $6.3 $1.4 $2.6 $- $1.0 $2.0 $3.0 $4.0 $5.0 $6.0 $7.0 $ i n b ill io n s savings excl. low-yield accounts IBD excl. low-yield accounts time $10.3B
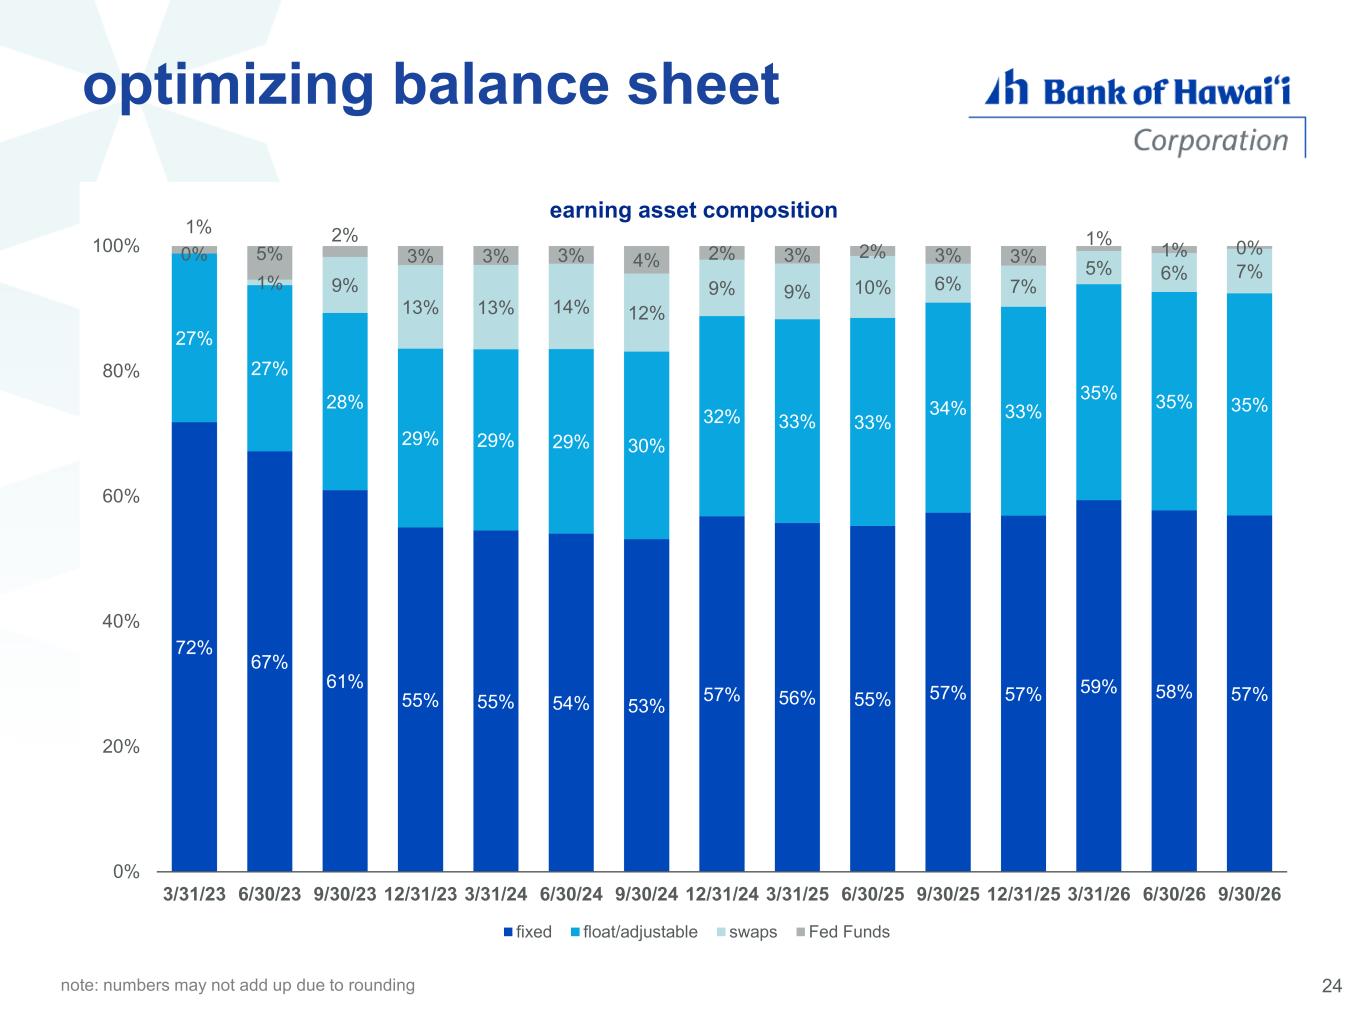
24 optimizing balance sheet 72% 67% 61% 55% 55% 54% 53% 57% 56% 55% 57% 57% 59% 58% 57% 27% 27% 28% 29% 29% 29% 30% 32% 33% 33% 34% 33% 35% 35% 35% 0% 1% 9% 13% 13% 14% 12% 9% 9% 10% 6% 7% 5% 6% 7% 1% 5% 2% 3% 3% 3% 4% 2% 3% 2% 3% 3% 1% 1% 0% 0% 20% 40% 60% 80% 100% 3/31/23 6/30/23 9/30/23 12/31/23 3/31/24 6/30/24 9/30/24 12/31/24 3/31/25 6/30/25 9/30/25 12/31/25 3/31/26 6/30/26 9/30/26 earning asset composition fixed float/adjustable swaps Fed Funds note: numbers may not add up due to rounding
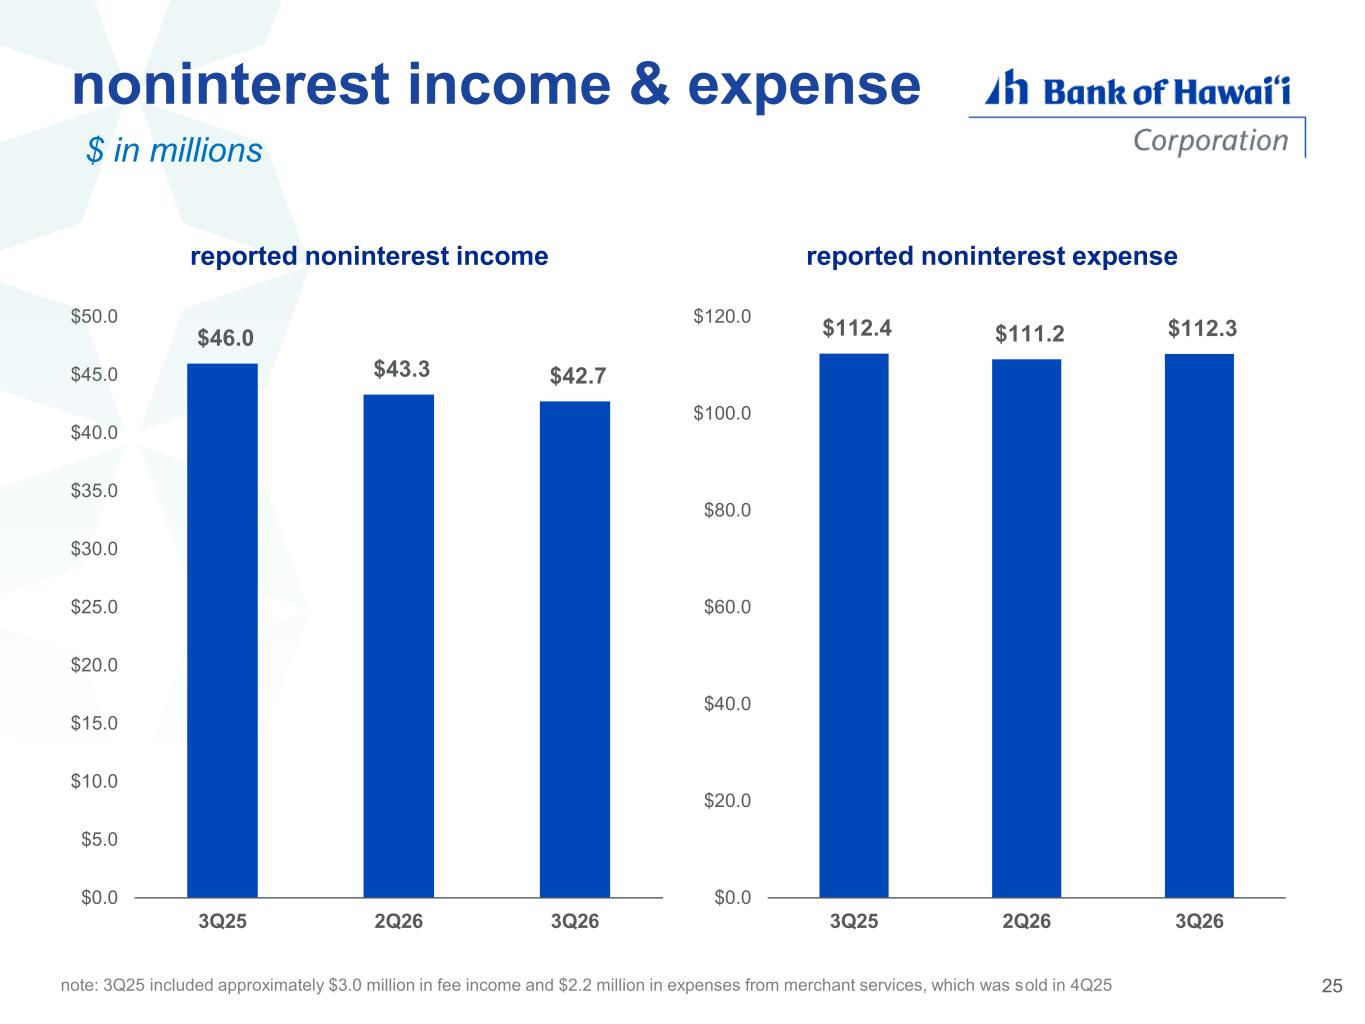
noninterest income & expense $ in millions 25 $46.0 $43.3 $42.7 $0.0 $5.0 $10.0 $15.0 $20.0 $25.0 $30.0 $35.0 $40.0 $45.0 $50.0 3Q25 2Q26 3Q26 $112.4 $111.2 $112.3 $0.0 $20.0 $40.0 $60.0 $80.0 $100.0 $120.0 3Q25 2Q26 3Q26 reported noninterest income reported noninterest expense note: 3Q25 included approximately $3.0 million in fee income and $2.2 million in expenses from merchant services, which was sold in 4Q25
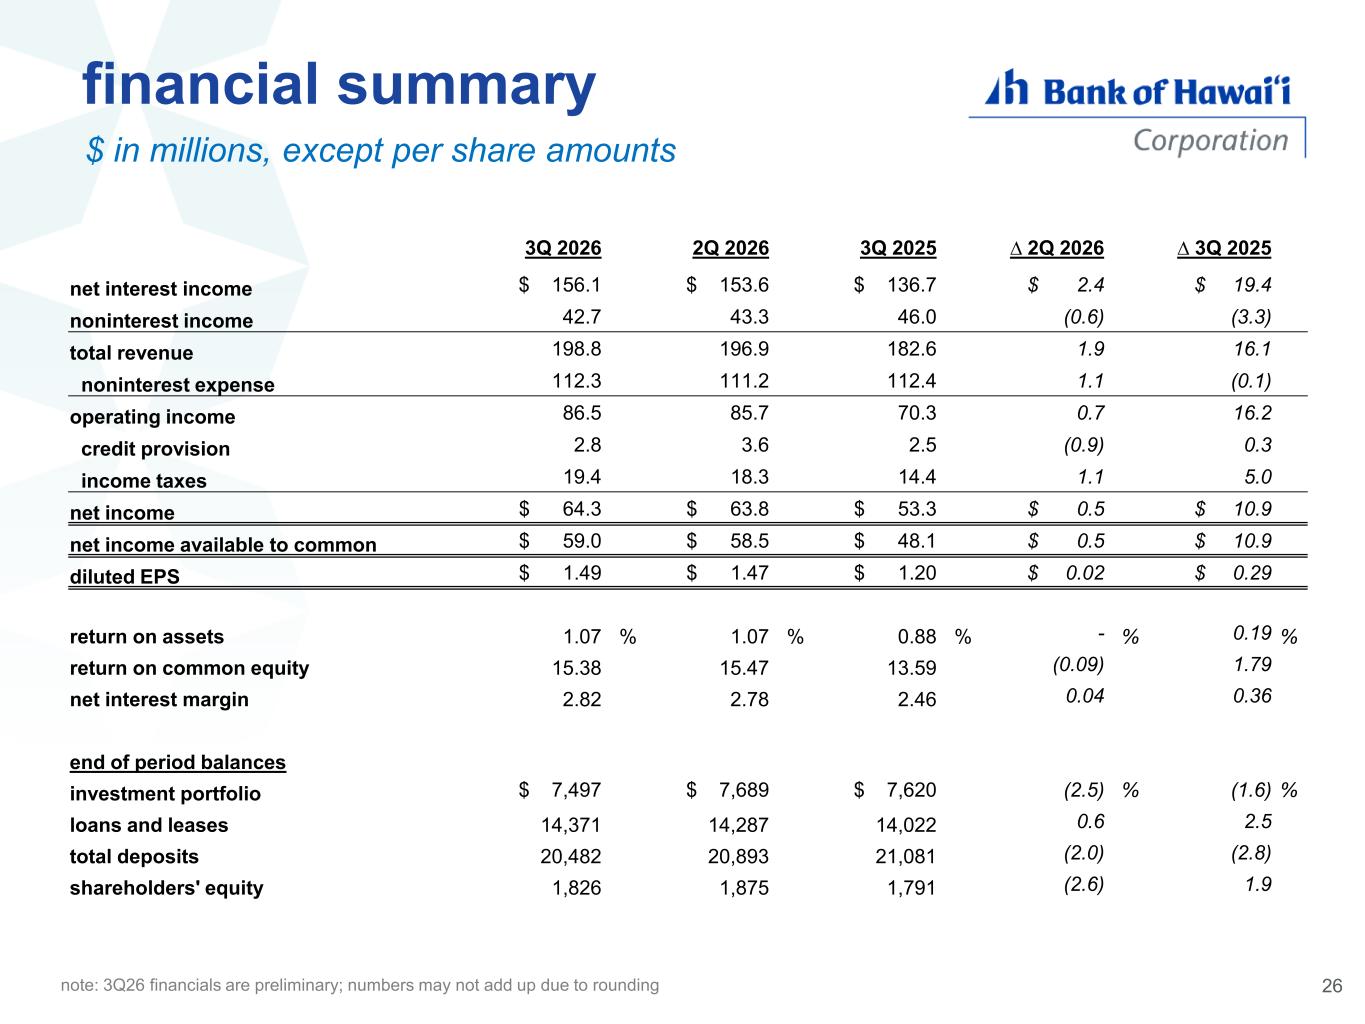
financial summary $ in millions, except per share amounts 3Q 2026 2Q 2026 3Q 2025 ∆ 2Q 2026 ∆ 3Q 2025 net interest income $ 156.1 $ 153.6 $ 136.7 $ 2.4 $ 19.4 noninterest income 42.7 43.3 46.0 (0.6) (3.3) total revenue 198.8 196.9 182.6 1.9 16.1 noninterest expense 112.3 111.2 112.4 1.1 (0.1) operating income 86.5 85.7 70.3 0.7 16.2 credit provision 2.8 3.6 2.5 (0.9) 0.3 income taxes 19.4 18.3 14.4 1.1 5.0 net income $ 64.3 $ 63.8 $ 53.3 $ 0.5 $ 10.9 net income available to common $ 59.0 $ 58.5 $ 48.1 $ 0.5 $ 10.9 diluted EPS $ 1.49 $ 1.47 $ 1.20 $ 0.02 $ 0.29 return on assets 1.07 % 1.07 % 0.88 % - % 0.19 % return on common equity 15.38 15.47 13.59 (0.09) 1.79 net interest margin 2.82 2.78 2.46 0.04 0.36 end of period balances investment portfolio $ 7,497 $ 7,689 $ 7,620 (2.5) % (1.6) % loans and leases 14,371 14,287 14,022 0.6 2.5 total deposits 20,482 20,893 21,081 (2.0) (2.8) shareholders' equity 1,826 1,875 1,791 (2.6) 1.9 26note: 3Q26 financials are preliminary; numbers may not add up due to rounding
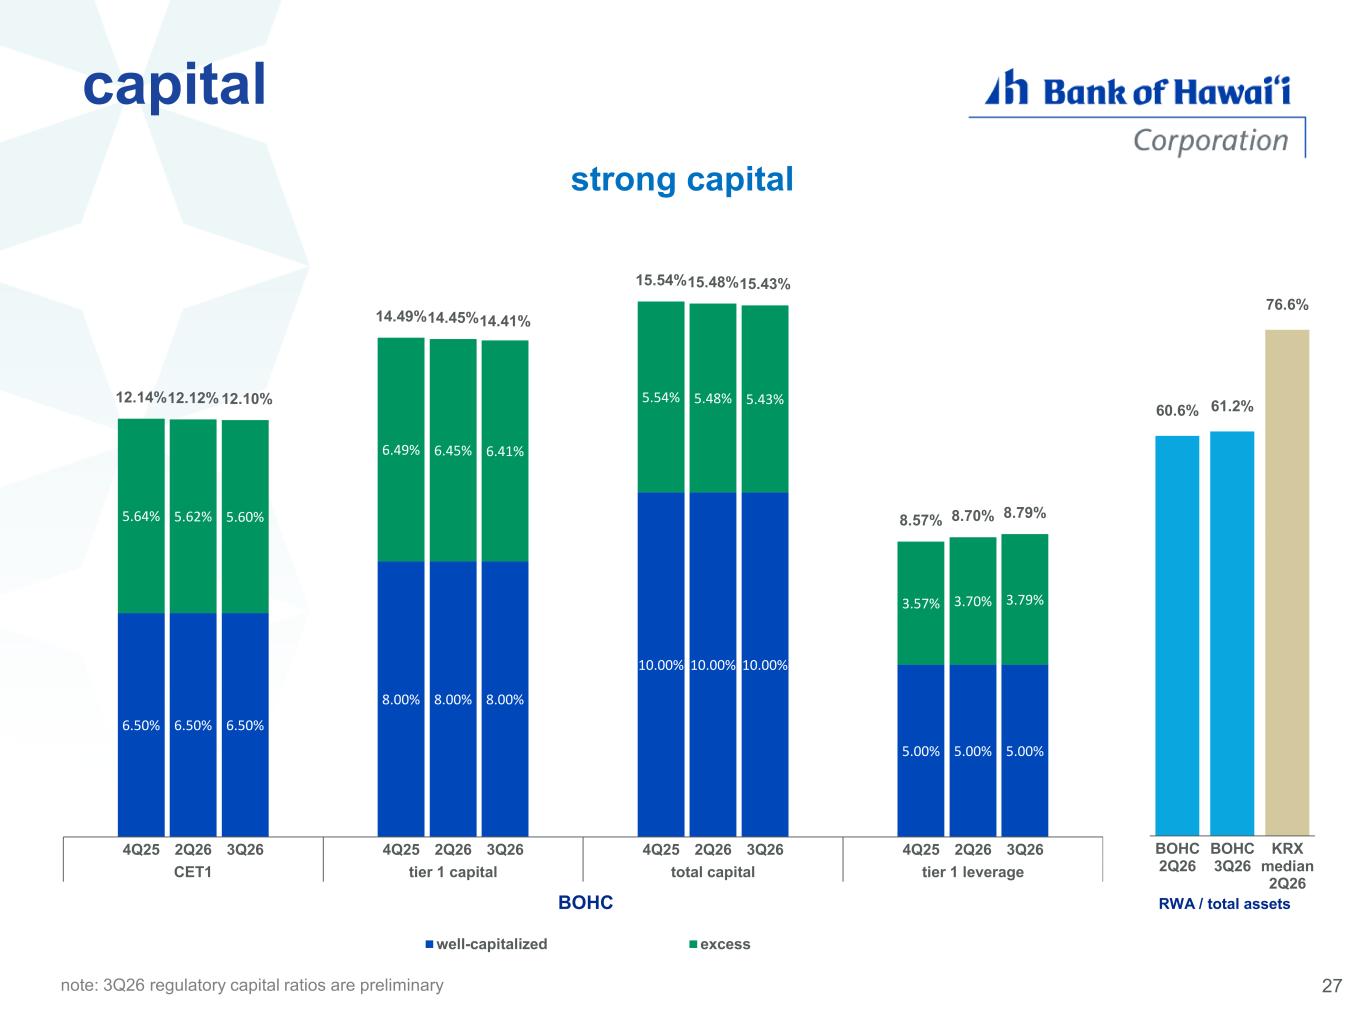
capital 6.50% 6.50% 6.50% 8.00% 8.00% 8.00% 10.00% 10.00% 10.00% 5.00% 5.00% 5.00% 5.64% 5.62% 5.60% 6.49% 6.45% 6.41% 5.54% 5.48% 5.43% 3.57% 3.70% 3.79% 12.14%12.12% 12.10% 14.49%14.45%14.41% 15.54%15.48%15.43% 8.57% 8.70% 8.79% 4Q25 2Q26 3Q26 4Q25 2Q26 3Q26 4Q25 2Q26 3Q26 4Q25 2Q26 3Q26 CET1 tier 1 capital total capital tier 1 leverage well-capitalized excess 13.6% BOHC strong capital 27 60.6% 61.2% 76.6% BOHC 2Q26 BOHC 3Q26 KRX median 2Q26 1 RWA / total assets note: 3Q26 regulatory capital ratios are preliminary
✔ NII and NIM increased for the tenth consecutive quarter ✔ dominant market position in a unique market ✔ exceptional credit quality ✔ strong liquidity and risk-based capital takeaways 28
Q & A
appendix
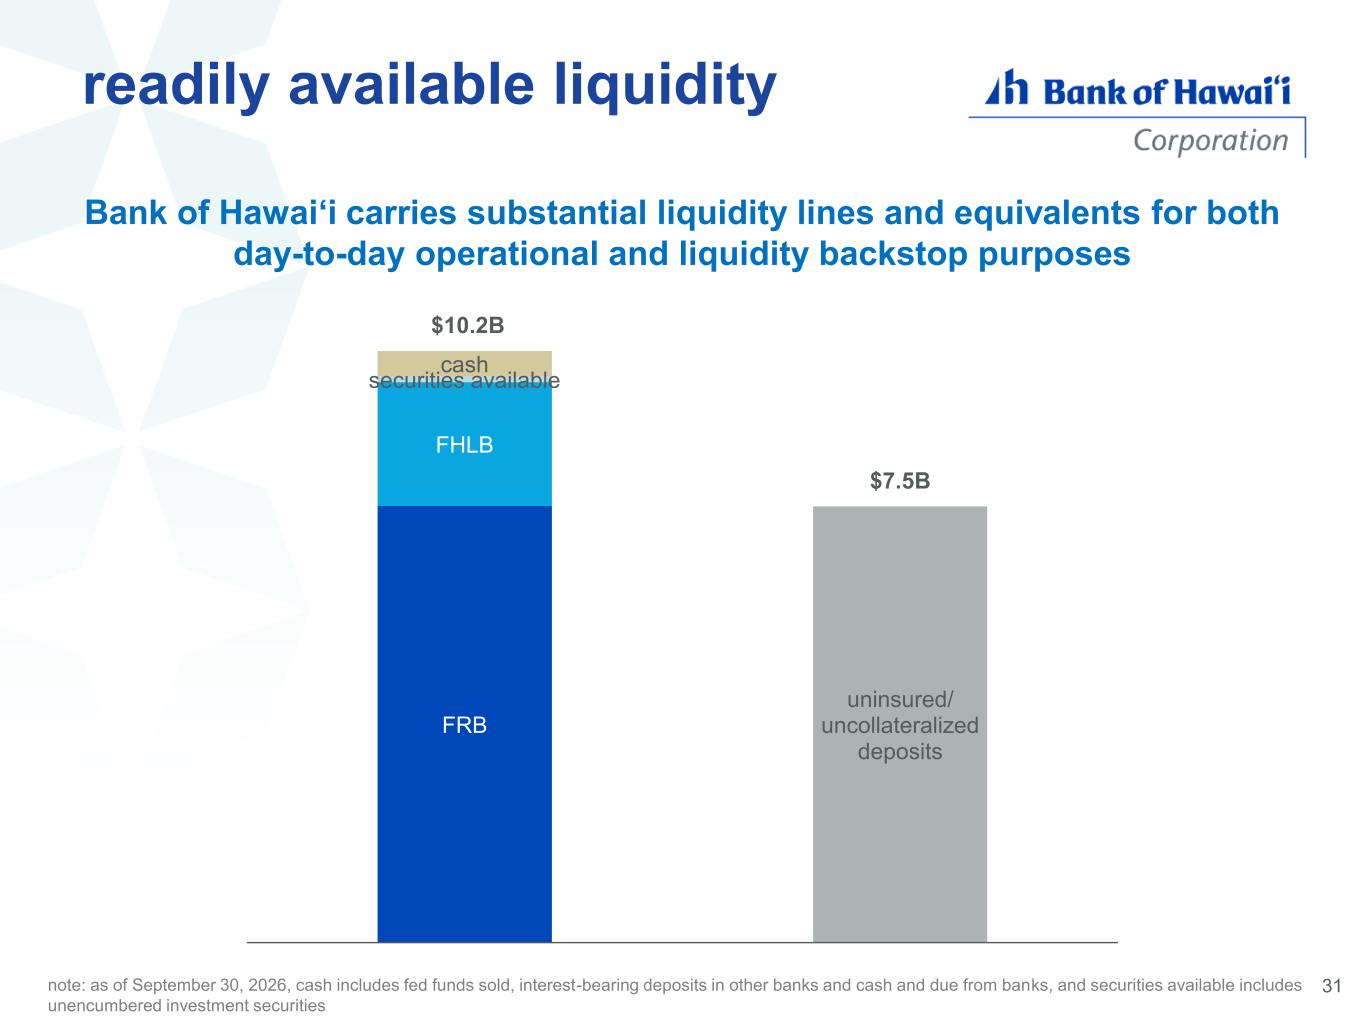
note: as of September 30, 2026, cash includes fed funds sold, interest-bearing deposits in other banks and cash and due from banks, and securities available includes unencumbered investment securities Bank of Hawai‘i carries substantial liquidity lines and equivalents for both day-to-day operational and liquidity backstop purposes FRB FHLB securities available cash uninsured/ uncollateralized deposits $10.2B $7.5B readily available liquidity 31
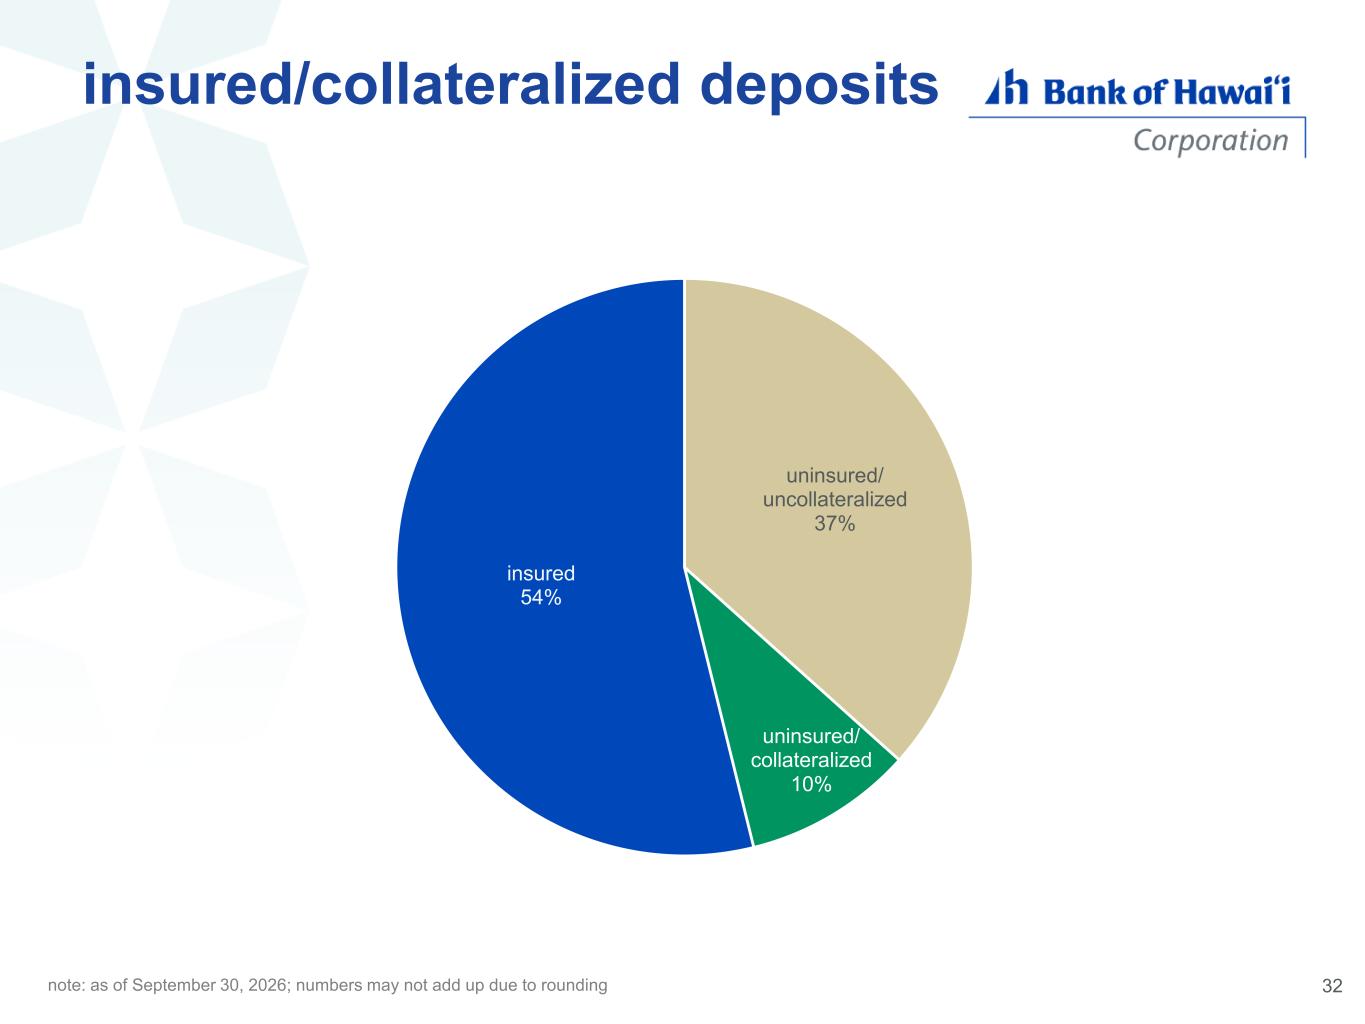
insured/collateralized deposits uninsured/ uncollateralized 37% uninsured/ collateralized 10% insured 54% note: as of September 30, 2026; numbers may not add up due to rounding 32
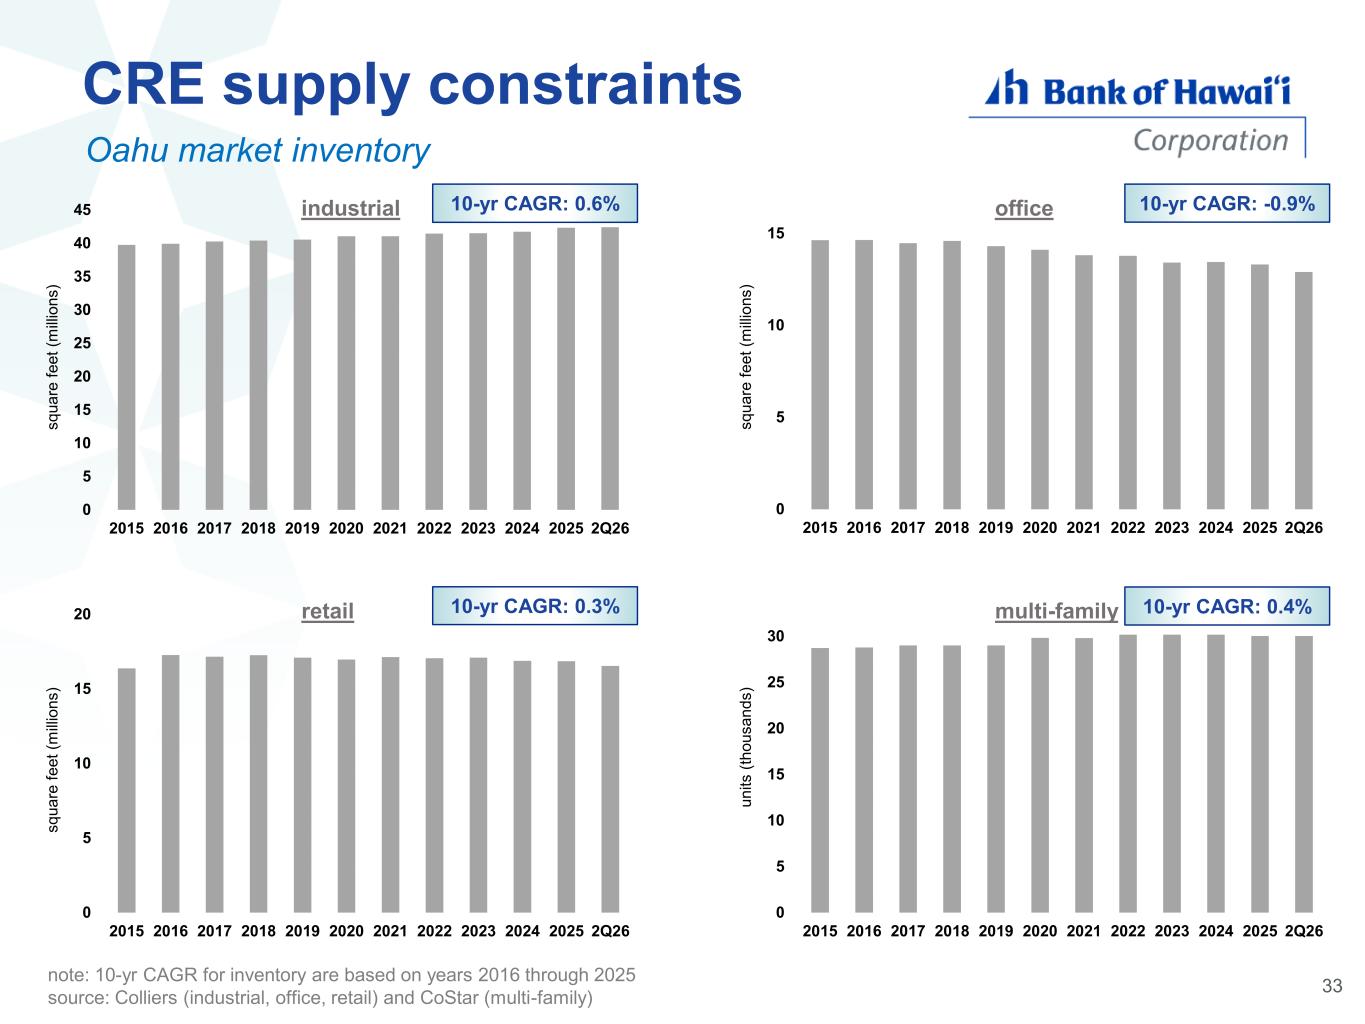
0 5 10 15 20 2015 2016 2017 2018 2019 2020 2021 2022 2023 2024 2025 2Q26 s q u a re f e e t (m ill io n s ) retail 0 5 10 15 20 25 30 35 40 45 2015 2016 2017 2018 2019 2020 2021 2022 2023 2024 2025 2Q26 s q u a re f e e t (m ill io n s ) industrial Oahu market inventory 33 CRE supply constraints 10-yr CAGR: 0.6% 10-yr CAGR: -0.9% 10-yr CAGR: 0.3% 10-yr CAGR: 0.4% note: 10-yr CAGR for inventory are based on years 2016 through 2025 source: Colliers (industrial, office, retail) and CoStar (multi-family) 0 5 10 15 20 25 30 2015 2016 2017 2018 2019 2020 2021 2022 2023 2024 2025 2Q26 u n it s ( th o u s a n d s ) multi-family 0 5 10 15 2015 2016 2017 2018 2019 2020 2021 2022 2023 2024 2025 2Q26 s q u a re f e e t (m ill io n s ) office
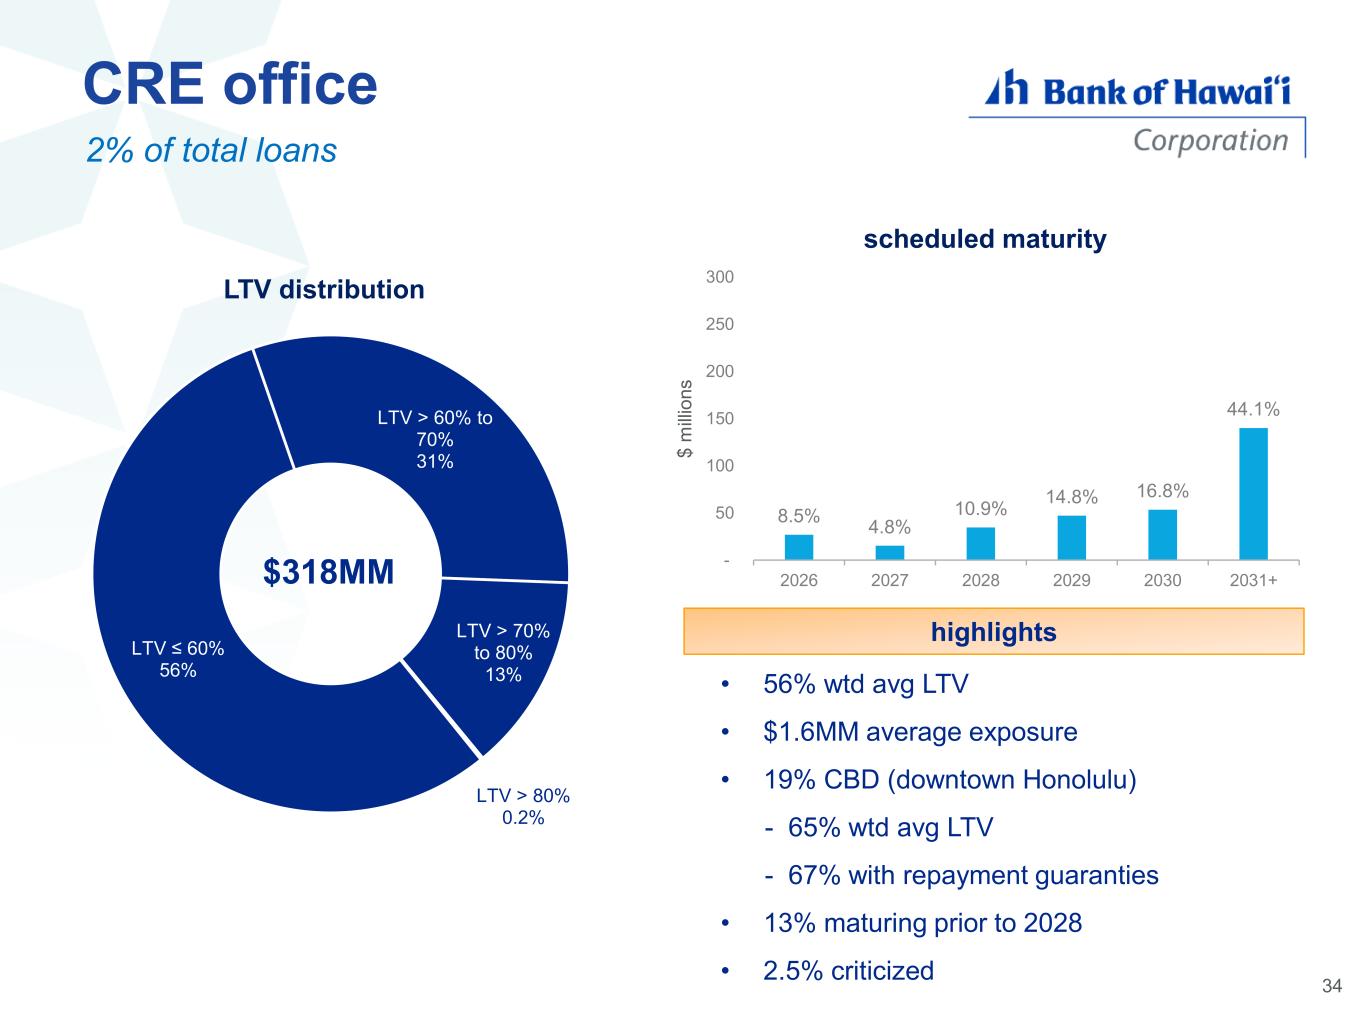
CRE office 2% of total loans • 56% wtd avg LTV • $1.6MM average exposure • 19% CBD (downtown Honolulu) - 65% wtd avg LTV - 67% with repayment guaranties • 13% maturing prior to 2028 • 2.5% criticized highlights LTV ≤ 60% 56% LTV > 60% to 70% 31% LTV > 70% to 80% 13% LTV > 80% 0.2% LTV distribution $318MM 34 8.5% 4.8% 10.9% 14.8% 16.8% 44.1% - 50 100 150 200 250 300 2026 2027 2028 2029 2030 2031+ $ m ill io n s scheduled maturity
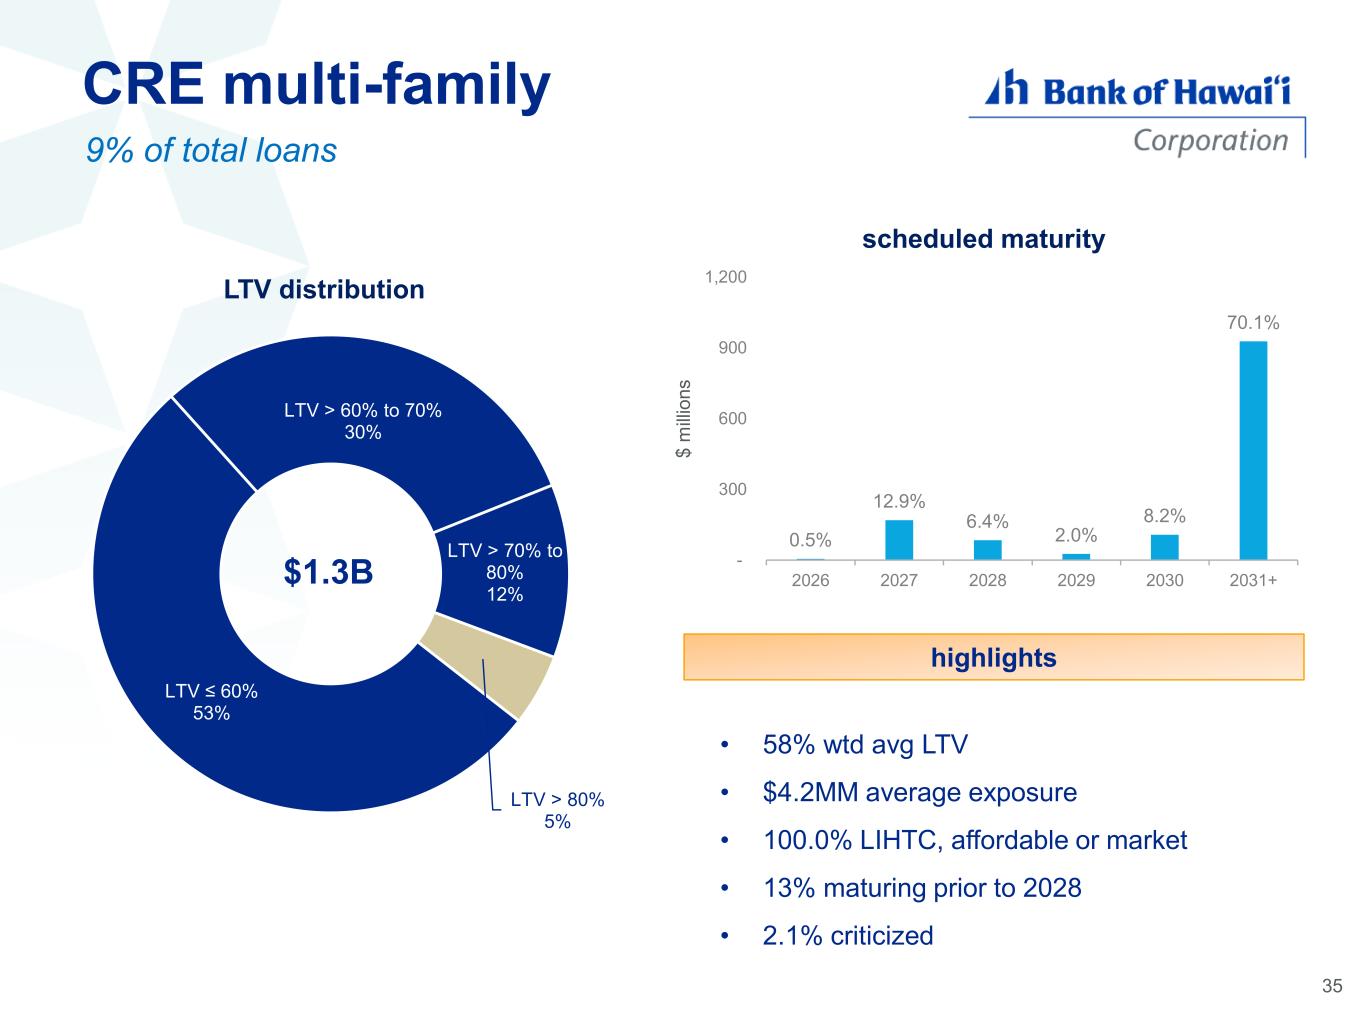
CRE multi-family 9% of total loans • 58% wtd avg LTV • $4.2MM average exposure • 100.0% LIHTC, affordable or market • 13% maturing prior to 2028 • 2.1% criticized highlights LTV ≤ 60% 53% LTV > 60% to 70% 30% LTV > 70% to 80% 12% LTV > 80% 5% LTV distribution 0.5% 12.9% 6.4% 2.0% 8.2% 70.1% - 300 600 900 1,200 2026 2027 2028 2029 2030 2031+ $ m ill io n s scheduled maturity $1.3B 35
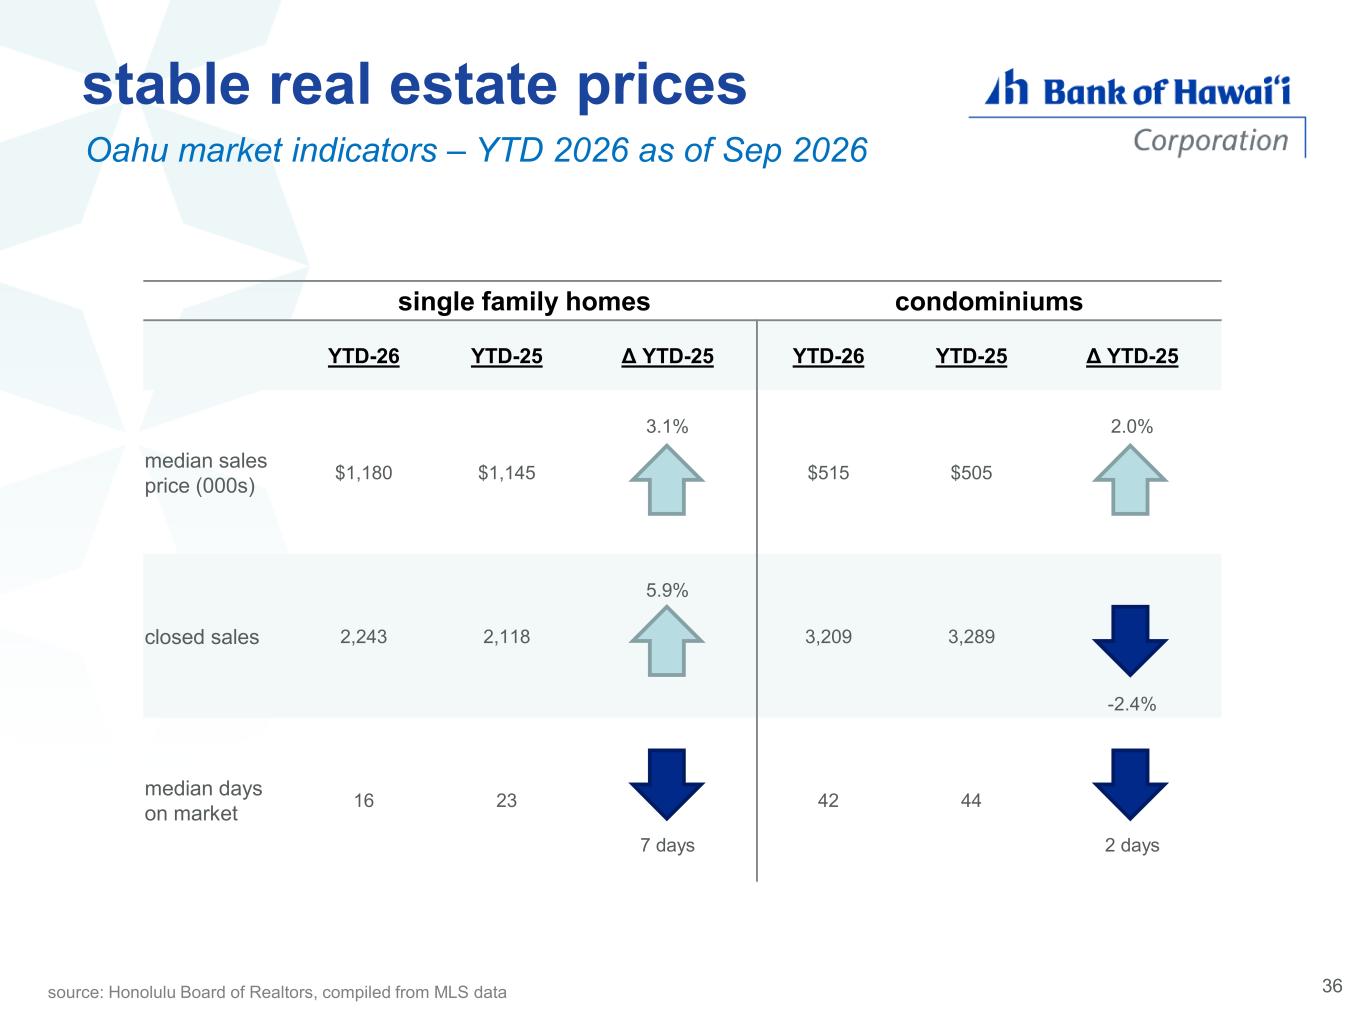
stable real estate prices Oahu market indicators – YTD 2026 as of Sep 2026 source: Honolulu Board of Realtors, compiled from MLS data 36 single family homes condominiums YTD-26 YTD-25 Δ YTD-25 YTD-26 YTD-25 Δ YTD-25 median sales price (000s) $1,180 $1,145 3.1% $515 $505 2.0% closed sales 2,243 2,118 5.9% 3,209 3,289 -2.4% median days on market 16 23 7 days 42 44 2 days
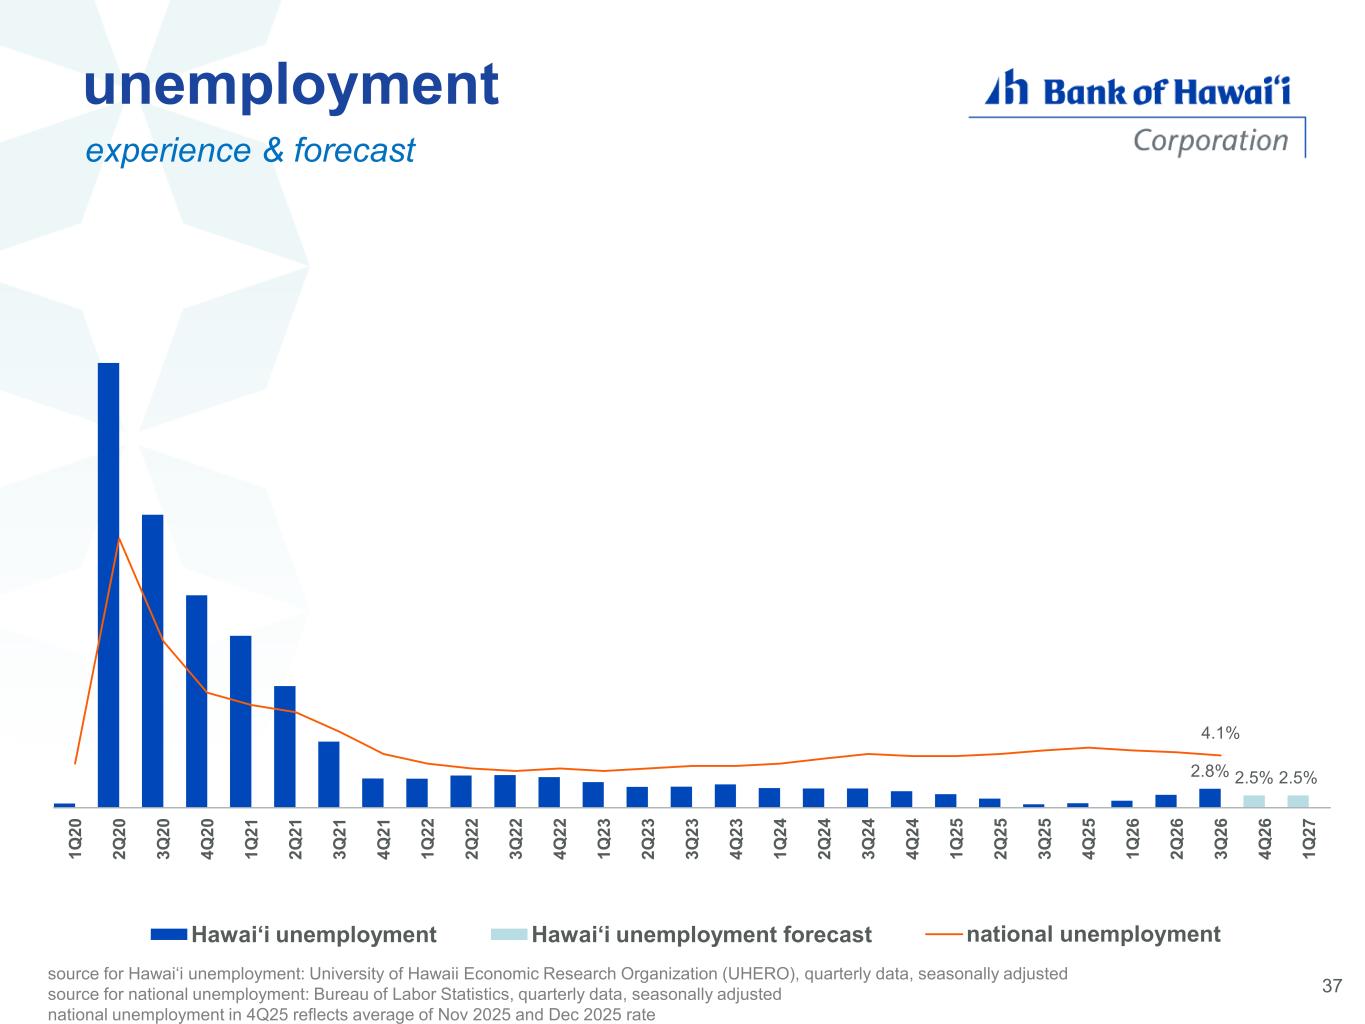
2.8% 2.5% 2.5% 4.1% 1 Q 2 0 2 Q 2 0 3 Q 2 0 4 Q 2 0 1 Q 2 1 2 Q 2 1 3 Q 2 1 4 Q 2 1 1 Q 2 2 2 Q 2 2 3 Q 2 2 4 Q 2 2 1 Q 2 3 2 Q 2 3 3 Q 2 3 4 Q 2 3 1 Q 2 4 2 Q 2 4 3 Q 2 4 4 Q 2 4 1 Q 2 5 2 Q 2 5 3 Q 2 5 4 Q 2 5 1 Q 2 6 2 Q 2 6 3 Q 2 6 4 Q 2 6 1 Q 2 7 Hawai‘i unemployment Hawai‘i unemployment forecast national unemployment unemployment experience & forecast source for Hawai‘i unemployment: University of Hawaii Economic Research Organization (UHERO), quarterly data, seasonally adjusted source for national unemployment: Bureau of Labor Statistics, quarterly data, seasonally adjusted national unemployment in 4Q25 reflects average of Nov 2025 and Dec 2025 rate 37
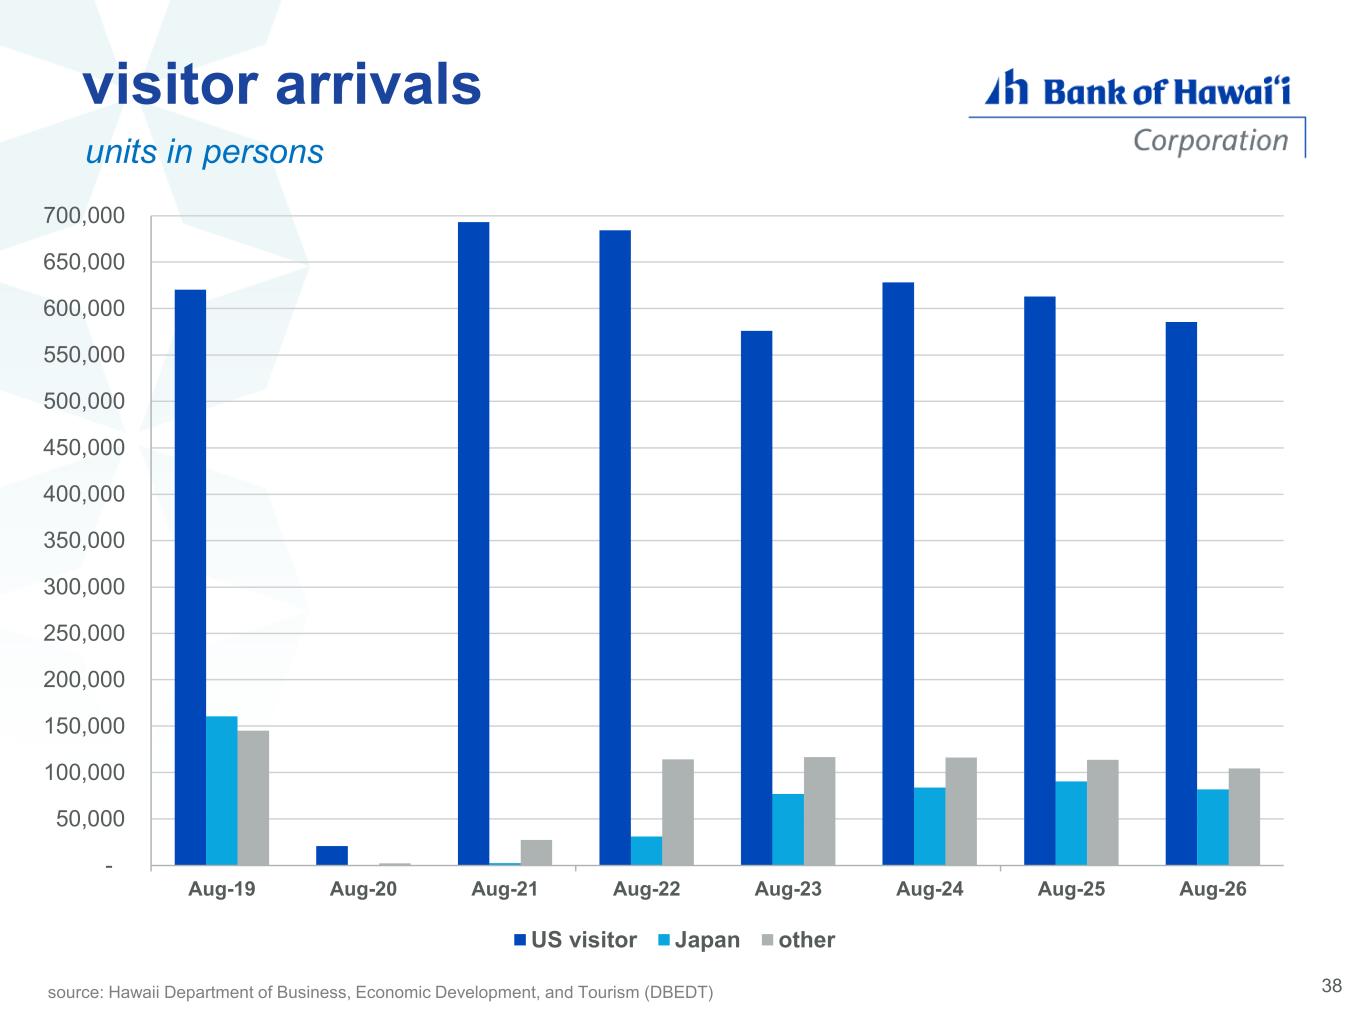
38 visitor arrivals units in persons source: Hawaii Department of Business, Economic Development, and Tourism (DBEDT) - 50,000 100,000 150,000 200,000 250,000 300,000 350,000 400,000 450,000 500,000 550,000 600,000 650,000 700,000 Aug-19 Aug-20 Aug-21 Aug-22 Aug-23 Aug-24 Aug-25 Aug-26 US visitor Japan other
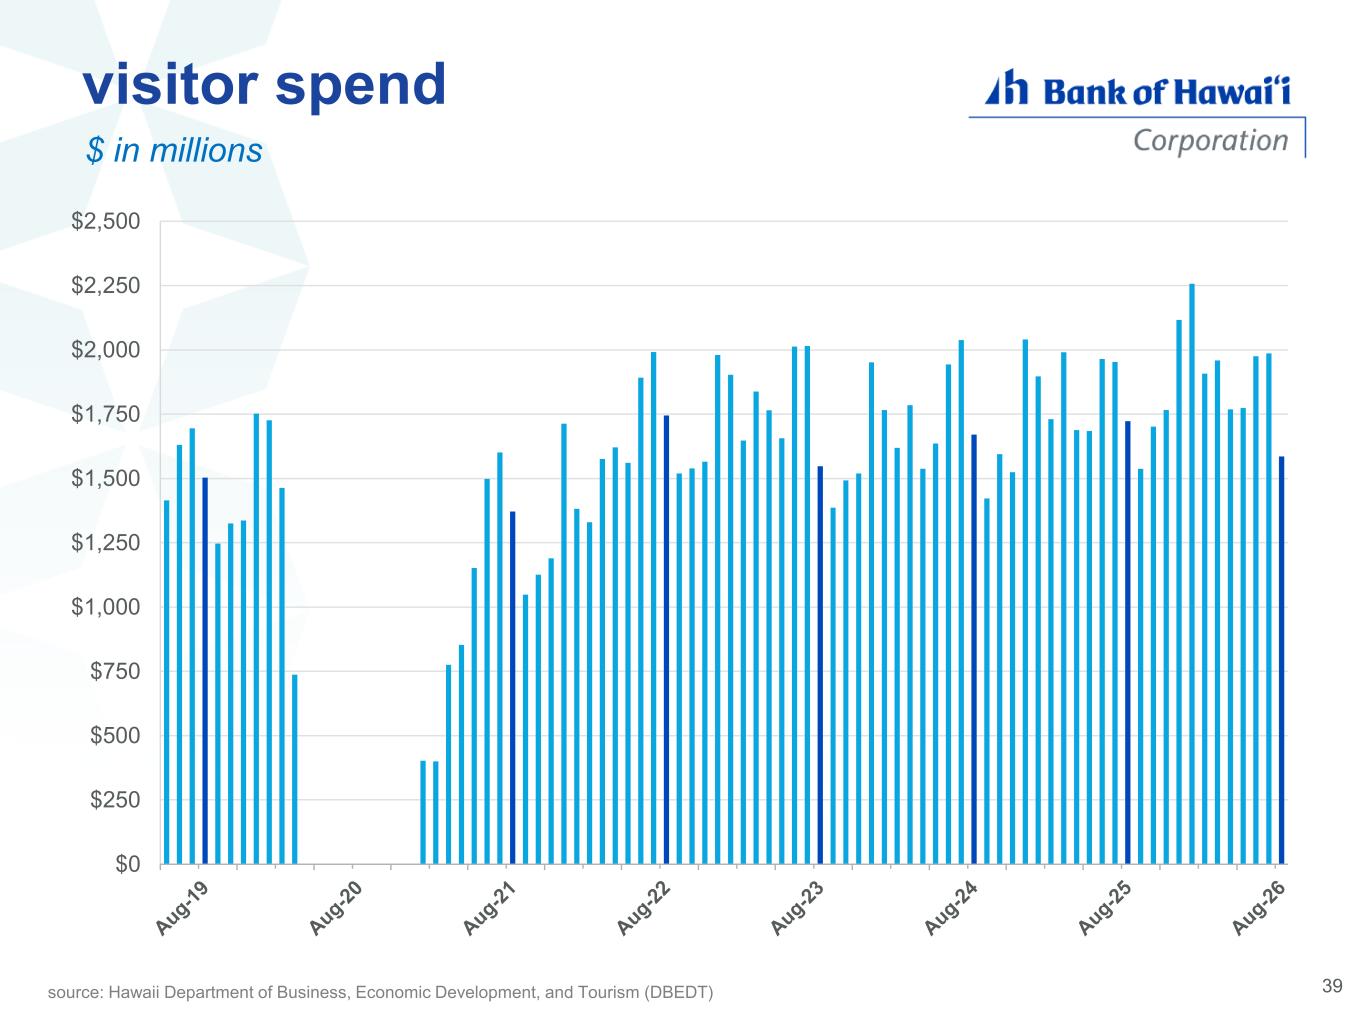
visitor spend $ in millions 39source: Hawaii Department of Business, Economic Development, and Tourism (DBEDT) $0 $250 $500 $750 $1,000 $1,250 $1,500 $1,750 $2,000 $2,250 $2,500
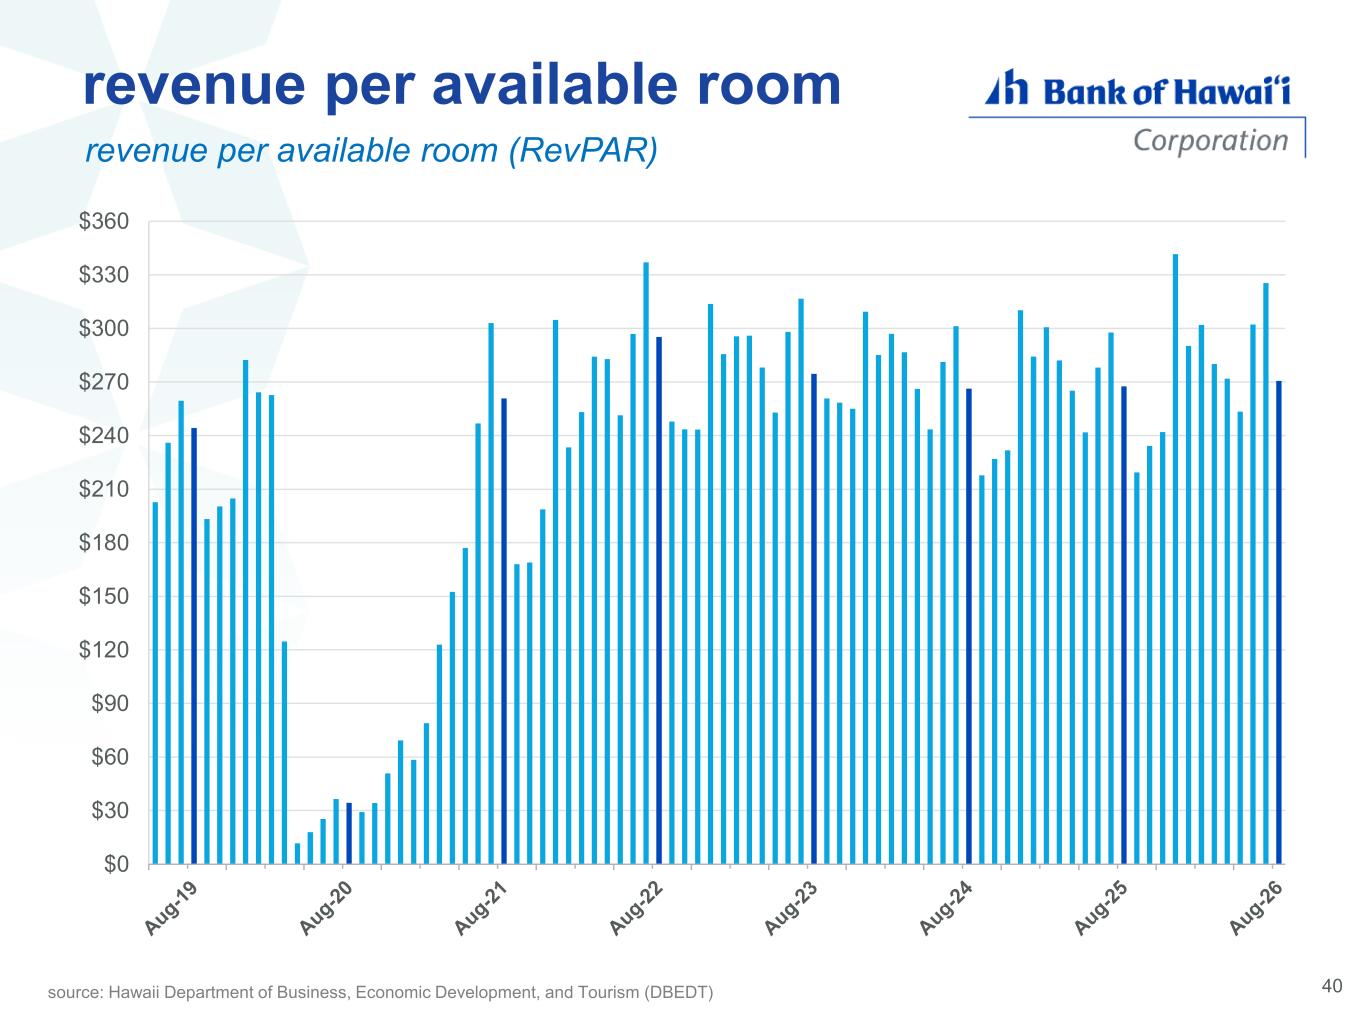
revenue per available room revenue per available room (RevPAR) 40source: Hawaii Department of Business, Economic Development, and Tourism (DBEDT) $0 $30 $60 $90 $120 $150 $180 $210 $240 $270 $300 $330 $360