v3.26.3
Pay vs Performance Disclosure - USD ($)
1 Months Ended 11 Months Ended 12 Months Ended
Jun. 30, 2026
May 31, 2026
Jun. 30, 2026
Jun. 30, 2025
Pay vs Performance Disclosure [Table]        
Pay vs Performance [Table Text Block]    
Year  Summary Compensation Table Total for First PEO(1)   Summary Compensation Table Total for Second 
PEO(2)
   Compensation “Actually Paid” to First PEO(3)   Compensation “Actually Paid” to Second PEO(3)   Average Summary Compensation Table Total for non-PEO NEOs(4)   Average Compensation “Actually Paid” to non- PEO NEOs(5)   Value of Initial Fixed $100 Investment Based On Total Shareholder Return(6)   Net Income(7) 
                                 
2026  $225,000   $264,525   $222,287   $162,763   $220,238   $95,414   $75.49   $(16,634,986)
                                         
2025  $—   $379,133   $—   $464,149   $283,417   $383,557   $133.33   $(2,552,651)
 
PEO Actually Paid Compensation Amount       $ 464,149
Adjustment To PEO Compensation, Footnote [Text Block]    


   First PEO   Second PEO   Second PEO 
   2026   2026   2025 
             
Summary Compensation Table Total for PEO   225,000    264,525    379,133 
                
Adjustments for defined benefit pension plan               
                
(Deduct): Aggregate change in actuarial present value included in Summary Compensation Table Total for the covered fiscal year   —    —    — 
                
Add: Service cost for the covered fiscal year   —    —    — 
                
Add: Prior service cost for the covered fiscal year   —    —    — 
                
Adjustments for stock awards and option awards               
                
(Deduct): Aggregate value for stock awards and option awards included in Summary Compensation Table Total for the covered fiscal year   —    —    — 
                
Add: Fair value at year end of awards granted during the covered fiscal year that were outstanding and unvested at the covered fiscal year end   —    —    — 
                
Add: Year-over-year change in fair value at covered fiscal year end of awards granted in any prior fiscal year that were outstanding and unvested at the covered fiscal year end   1,254    —    51,551 
                
Add: Vesting date fair value of awards granted and vested during the covered fiscal year   —    —    — 
                
Add: Change as of the vesting date (from the end of the prior fiscal year) in fair value of awards granted in any prior fiscal year for which vesting conditions were satisfied during the covered fiscal year   1,459    43,213    33,465 
                
(Deduct): Fair value at end of prior fiscal year of awards granted in any prior fiscal year that failed to meet the applicable vesting conditions during the covered fiscal year   —    58,549    — 
                
Add: Change in incremental fair value of awards modified during the covered fiscal year   —    —    — 
                
Add: Dividends or other earnings paid on awards in the covered fiscal year prior to vesting if not otherwise included in the Summary Compensation Table Total for the covered fiscal year   —    —    — 
                
Compensation “Actually Paid” to PEO   222,287    162,763    464,149 
 
Non-PEO NEO Average Total Compensation Amount [1]     $ 220,238 283,417
Non-PEO NEO Average Compensation Actually Paid Amount [2]     $ 95,414 383,557
Adjustment to Non-PEO NEO Compensation Footnote [Text Block]    


   Other Non-PEO NEOs (Average)   Other Non-PEO NEOs (Average) 
   2026   2025 
         
Summary Compensation Table Total for Non-PEO NEOs   220,238    283,417 
           
Adjustments for stock awards and option awards          
           
Deduct: Aggregate value for stock awards and option awards included in Summary Compensation Table Total for the covered fiscal year   —    — 
           
Add: Fair value at year end of awards granted during the covered fiscal year that were outstanding and unvested at the covered fiscal year end   —    — 
           
Add: Year-over-year change in fair value at covered fiscal year end of awards granted in any prior fiscal year that were outstanding and unvested at the covered fiscal year end   —    64,491 
           
Add: Vesting date fair value of awards granted and vested during the covered fiscal year   —    — 
           
Add: Change as of the vesting date (from the end of the prior fiscal year) in fair value of awards granted in any prior fiscal year for which vesting conditions were satisfied during the covered fiscal year   92,716    35,649 
           
Deduct: Fair value at end of prior fiscal year of awards granted in any prior fiscal year that failed to meet the applicable vesting conditions during the covered fiscal year   32,108    — 
           
Add: Change in incremental fair value of awards modified during the covered fiscal year   —    — 
           
Add: Dividends or other earnings paid on awards in the covered fiscal year prior to vesting if not otherwise included in the Summary Compensation Table Total for the covered fiscal year   —    — 
           
Compensation “Actually Paid” to Non-PEO NEOs   95,414    383,557 
 
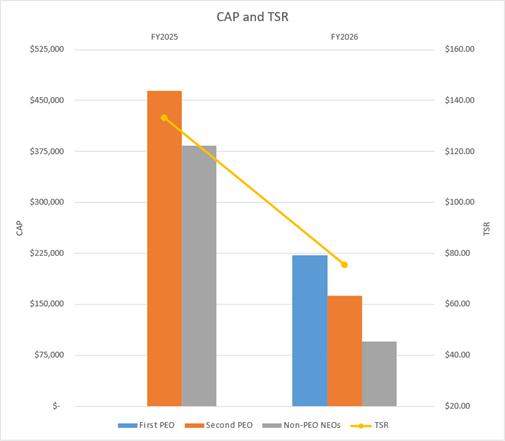
Compensation Actually Paid vs. Total Shareholder Return [Text Block]    

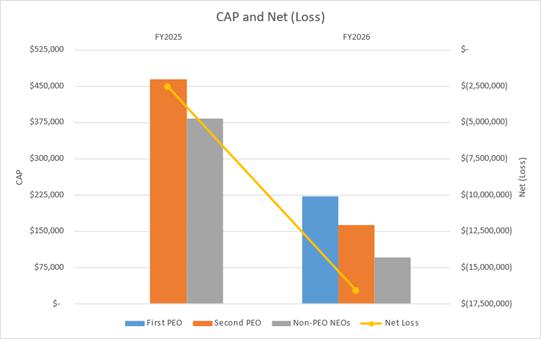
In accordance with Item 402(v) of Regulation S-K, the Company is providing the following graphs with respect to the relationships between information presented in the Pay Versus Performance table. For purposes of these graphs, we refer to compensation “actually paid” as “CAP.”


Compensation Actually Paid vs. Net Income [Text Block]    


Total Shareholder Return Amount [3]     $ 75.49 133.33
Net Income (Loss) Attributable to Parent [4]     (16,634,986) $ (2,552,651)
PEO Name Tyler Gates Lyron Bentovim   Lyron Bentovim
Tyler Gates [Member]        
Pay vs Performance Disclosure [Table]        
PEO Total Compensation Amount [5]     225,000
PEO Actually Paid Compensation Amount [6]     222,287
Tyler Gates [Member] | (Deduct): Aggregate Change in Actuarial Present Value Included in Summary Compensation Table Total for the Covered Fiscal Year [Member]        
Pay vs Performance Disclosure [Table]        
Adjustment for compensation      
Tyler Gates [Member] | Add: Service Cost for the Covered Fiscal Year [Member]        
Pay vs Performance Disclosure [Table]        
Adjustment for compensation      
Tyler Gates [Member] | Add: Prior Service Cost for the Covered Fiscal Year [Member]        
Pay vs Performance Disclosure [Table]        
Adjustment for compensation      
Tyler Gates [Member] | (Deduct): Aggregate Value for Stock Awards and Option Awards Included in Summary Compensation Table Total for the Covered Fiscal Year [Member]        
Pay vs Performance Disclosure [Table]        
Adjustment for compensation      
Tyler Gates [Member] | Add: Fair Value at Year End of Awards Granted During the Covered Fiscal Year That Were Outstanding and Unvested at the Covered Fiscal Year End [Member]        
Pay vs Performance Disclosure [Table]        
Adjustment for compensation      
Tyler Gates [Member] | Add: Year-Over-Year Change in Fair Value at Covered Fiscal Year End of Awards Granted in Any Prior Fiscal Year That Were Outstanding and Unvested at the Covered Fiscal Year End [Member]        
Pay vs Performance Disclosure [Table]        
Adjustment for compensation     1,254  
Tyler Gates [Member] | Add: Vesting Date Fair Value of Awards Granted and Vested During the Covered Fiscal Year [Member]        
Pay vs Performance Disclosure [Table]        
Adjustment for compensation      
Tyler Gates [Member] | Add: Change as of the Vesting Date (from the end of the Prior Fiscal Year) in Fair Value of Awards Granted in any Prior Fiscal Year for Which Vesting Conditions Were Satisfied During the Covered Fiscal Year [Member]        
Pay vs Performance Disclosure [Table]        
Adjustment for compensation     1,459  
Tyler Gates [Member] | (Deduct): Fair Value at End of Prior Fiscal Year of Awards Granted in any Prior Fiscal Year that Failed to Meet the Applicable Vesting Conditions During the Covered Fiscal Year [Member]        
Pay vs Performance Disclosure [Table]        
Adjustment for compensation      
Tyler Gates [Member] | Add: Change in Incremental Fair Value of Awards Modified During the Covered Fiscal Year [Member]        
Pay vs Performance Disclosure [Table]        
Adjustment for compensation      
Tyler Gates [Member] | Add: Dividends or Other Earnings Paid on Awards in the Covered Fiscal Year Prior to Vesting if not Otherwise Included in the Summary Compensation Table Total for the Covered Fiscal Year [Member]        
Pay vs Performance Disclosure [Table]        
Adjustment for compensation      
Lyron Bentovim [Member]        
Pay vs Performance Disclosure [Table]        
PEO Total Compensation Amount [7]     264,525 379,133
PEO Actually Paid Compensation Amount [6]     162,763 464,149
Lyron Bentovim [Member] | (Deduct): Aggregate Change in Actuarial Present Value Included in Summary Compensation Table Total for the Covered Fiscal Year [Member]        
Pay vs Performance Disclosure [Table]        
Adjustment for compensation    
Lyron Bentovim [Member] | Add: Service Cost for the Covered Fiscal Year [Member]        
Pay vs Performance Disclosure [Table]        
Adjustment for compensation    
Lyron Bentovim [Member] | Add: Prior Service Cost for the Covered Fiscal Year [Member]        
Pay vs Performance Disclosure [Table]        
Adjustment for compensation    
Lyron Bentovim [Member] | (Deduct): Aggregate Value for Stock Awards and Option Awards Included in Summary Compensation Table Total for the Covered Fiscal Year [Member]        
Pay vs Performance Disclosure [Table]        
Adjustment for compensation    
Lyron Bentovim [Member] | Add: Fair Value at Year End of Awards Granted During the Covered Fiscal Year That Were Outstanding and Unvested at the Covered Fiscal Year End [Member]        
Pay vs Performance Disclosure [Table]        
Adjustment for compensation    
Lyron Bentovim [Member] | Add: Year-Over-Year Change in Fair Value at Covered Fiscal Year End of Awards Granted in Any Prior Fiscal Year That Were Outstanding and Unvested at the Covered Fiscal Year End [Member]        
Pay vs Performance Disclosure [Table]        
Adjustment for compensation     51,551
Lyron Bentovim [Member] | Add: Vesting Date Fair Value of Awards Granted and Vested During the Covered Fiscal Year [Member]        
Pay vs Performance Disclosure [Table]        
Adjustment for compensation    
Lyron Bentovim [Member] | Add: Change as of the Vesting Date (from the end of the Prior Fiscal Year) in Fair Value of Awards Granted in any Prior Fiscal Year for Which Vesting Conditions Were Satisfied During the Covered Fiscal Year [Member]        
Pay vs Performance Disclosure [Table]        
Adjustment for compensation     43,213 33,465
Lyron Bentovim [Member] | (Deduct): Fair Value at End of Prior Fiscal Year of Awards Granted in any Prior Fiscal Year that Failed to Meet the Applicable Vesting Conditions During the Covered Fiscal Year [Member]        
Pay vs Performance Disclosure [Table]        
Adjustment for compensation     58,549
Lyron Bentovim [Member] | Add: Change in Incremental Fair Value of Awards Modified During the Covered Fiscal Year [Member]        
Pay vs Performance Disclosure [Table]        
Adjustment for compensation    
Lyron Bentovim [Member] | Add: Dividends or Other Earnings Paid on Awards in the Covered Fiscal Year Prior to Vesting if not Otherwise Included in the Summary Compensation Table Total for the Covered Fiscal Year [Member]        
Pay vs Performance Disclosure [Table]        
Adjustment for compensation    
Non-PEO NEO [Member]        
Pay vs Performance Disclosure [Table]        
Non-PEO NEO Average Total Compensation Amount     220,238 283,417
Non-PEO NEO Average Compensation Actually Paid Amount     95,414 383,557
Non-PEO NEO [Member] | (Deduct): Aggregate Value for Stock Awards and Option Awards Included in Summary Compensation Table Total for the Covered Fiscal Year [Member]        
Pay vs Performance Disclosure [Table]        
Adjustment for compensation    
Non-PEO NEO [Member] | Add: Fair Value at Year End of Awards Granted During the Covered Fiscal Year That Were Outstanding and Unvested at the Covered Fiscal Year End [Member]        
Pay vs Performance Disclosure [Table]        
Adjustment for compensation    
Non-PEO NEO [Member] | Add: Year-Over-Year Change in Fair Value at Covered Fiscal Year End of Awards Granted in Any Prior Fiscal Year That Were Outstanding and Unvested at the Covered Fiscal Year End [Member]        
Pay vs Performance Disclosure [Table]        
Adjustment for compensation     64,491
Non-PEO NEO [Member] | Add: Vesting Date Fair Value of Awards Granted and Vested During the Covered Fiscal Year [Member]        
Pay vs Performance Disclosure [Table]        
Adjustment for compensation    
Non-PEO NEO [Member] | Add: Change as of the Vesting Date (from the end of the Prior Fiscal Year) in Fair Value of Awards Granted in any Prior Fiscal Year for Which Vesting Conditions Were Satisfied During the Covered Fiscal Year [Member]        
Pay vs Performance Disclosure [Table]        
Adjustment for compensation     92,716 35,649
Non-PEO NEO [Member] | (Deduct): Fair Value at End of Prior Fiscal Year of Awards Granted in any Prior Fiscal Year that Failed to Meet the Applicable Vesting Conditions During the Covered Fiscal Year [Member]        
Pay vs Performance Disclosure [Table]        
Adjustment for compensation     32,108
Non-PEO NEO [Member] | Add: Change in Incremental Fair Value of Awards Modified During the Covered Fiscal Year [Member]        
Pay vs Performance Disclosure [Table]        
Adjustment for compensation    
Non-PEO NEO [Member] | Add: Dividends or Other Earnings Paid on Awards in the Covered Fiscal Year Prior to Vesting if not Otherwise Included in the Summary Compensation Table Total for the Covered Fiscal Year [Member]        
Pay vs Performance Disclosure [Table]        
Adjustment for compensation    
[1] Reflects the average compensation information for the non-PEO NEOs as a group based on total compensation reported in the Summary Compensation Table for the corresponding year. The non-PEO NEOs for fiscal year 2026 and 2025 were Maydan Rothblum and David Smith.
[2] The dollar amounts reported represent the average amount of compensation “actually paid” to the non-PEO NEOs in the applicable year, as computed in accordance with the SEC’s pay versus performance disclosure rules. The dollar amounts do not necessarily reflect the actual average amount of compensation earned by or paid to the non-PEO NEOs during the applicable fiscal year. The following table provides additional information as to the amounts deducted from and added to the Average Summary Compensation Table Total for fiscal year 2026 for non-PEO NEOs pursuant to the SEC’s rules to determine Average Compensation “Actually Paid” to non-PEO NEOs:
[3] Total Stockholder Return (“TSR”) is cumulative for the measurement periods calculated in accordance with Item 201(e) of Regulation S-K. Cumulative Company TSR is calculated by dividing the difference between the Company’s stock price at the end and the beginning of the measurement period by the Company’s stock price at the beginning of the measurement period.
[4] The dollar amounts reported represent the amount of net income (loss) reflected in the Company’s audited financial statements for the applicable fiscal year.
[5] Reflects total compensation reported for Tyler Gates (our First PEO) as reported in the Summary Compensation Table for the corresponding fiscal year. Mr. Gates has served as our Chief Executive Officer since June 2026.
[6] The dollar amounts reported represent the amount of compensation “actually paid” to our First PEO and Second PEO in the applicable fiscal year, as computed in accordance with the SEC’s pay versus performance disclosure rules. The dollar amounts do not necessarily reflect the actual amount of compensation earned by or paid to our First PEO or our Second PEO during the applicable fiscal year. The following table provides additional information as to the amounts deducted from and added to the Summary Compensation Table Total for fiscal year 2026 for our First PEO and our Second PEO pursuant to the SEC’s rules to determine Compensation “Actually Paid” to PEO:
[7] Reflects total compensation reported for Lyron Bentovim (our second PEO), our former Chief Executive Officer, as reported in the Summary Compensation Table for the corresponding fiscal year. Mr. Bentovim resigned from the Company effective as of June 1, 2026.