Shareholder Report
|
12 Months Ended |
|
Aug. 31, 2026
USD ($)
Holding
|
Aug. 31, 2025 |
| Shareholder Report [Line Items] |
|
|
| Document Type |
N-CSR
|
|
| Amendment Flag |
false
|
|
| Registrant Name |
EATON VANCE GROWTH TRUST
|
|
| Entity Central Index Key |
0000102816
|
|
| Entity Investment Company Type |
N-1A
|
|
| Document Period End Date |
Aug. 31, 2026
|
|
| Shareholder Report Annual or Semi-Annual |
Annual Shareholder Report
|
|
| C000104752 |
|
|
| Shareholder Report [Line Items] |
|
|
| Fund Name |
Eaton Vance All Asset Strategy Fund
|
|
| Class Name |
Class A
|
|
| Trading Symbol |
EARAX
|
|
| Annual or Semi-Annual Statement [Text Block] |
This annual shareholder report contains important information about the Eaton Vance All Asset Strategy Fund for the period of September 1, 2025 to August 31, 2026.
|
|
| Additional Information [Text Block] |
You can find additional information about the Fund at www.eatonvance.com/open-end-mutual-fund-documents.php. You can also request this information by contacting us at 1-800-262-1122.
|
|
| Material Fund Change Notice [Text Block] |
This report describes changes to the Fund that occurred during the reporting period.
|
|
| Additional Information Phone Number |
1-800-262-1122
|
|
| Additional Information Website |
<span style="box-sizing: border-box; color: rgb(0, 0, 0); display: inline; flex-wrap: nowrap; font-size: 10.6667px; font-weight: 400; grid-area: auto; line-height: 16px; margin: 0px; overflow: visible; text-align: left; text-align-last: auto; white-space-collapse: preserve-breaks;">www.eatonvance.com/open-end-mutual-fund-documents.php</span>
|
|
| Expenses [Text Block] |
What were the Fund costs for the last year?(based on a hypothetical $10,000 investment)
Table Summary
Class Name |
Costs of a $10,000 investment |
Costs paid as a percentage of a $10,000 investment |
Class A |
$108 |
1.01% | |
|
| Expenses Paid, Amount |
$ 108
|
|
| Expense Ratio, Percent |
1.01%
|
|
| Factors Affecting Performance [Text Block] |
How did the Fund perform last year and what affected its performance?Key contributors to (↑) and detractors from (↓) performance, relative to 60% MSCI ACWI Index/40% Bloomberg U.S. Aggregate Bond Index (the Blended Index): ↑ An overweight exposure to equities and an underweight exposure to fixed income assets helped relative returns ↑ An overweight exposure to emerging markets (EM), particularly South Korea and Taiwan, contributed to performance ↑ An overweight exposure to EM government bonds also added to returns ↓ Exposure to the global equities basket detracted from performance ↓ Exposure to Treasury Inflation-Protected Securities mildly detracted from performance |
|
| Performance Past Does Not Indicate Future [Text] |
THE FUND'S PAST PERFORMANCE IS NO GUARANTEE OF FUTURE RESULTS.
|
|
| Line Graph [Table Text Block] |
Comparison of the change in value of a $10,000 investment for the period indicated.
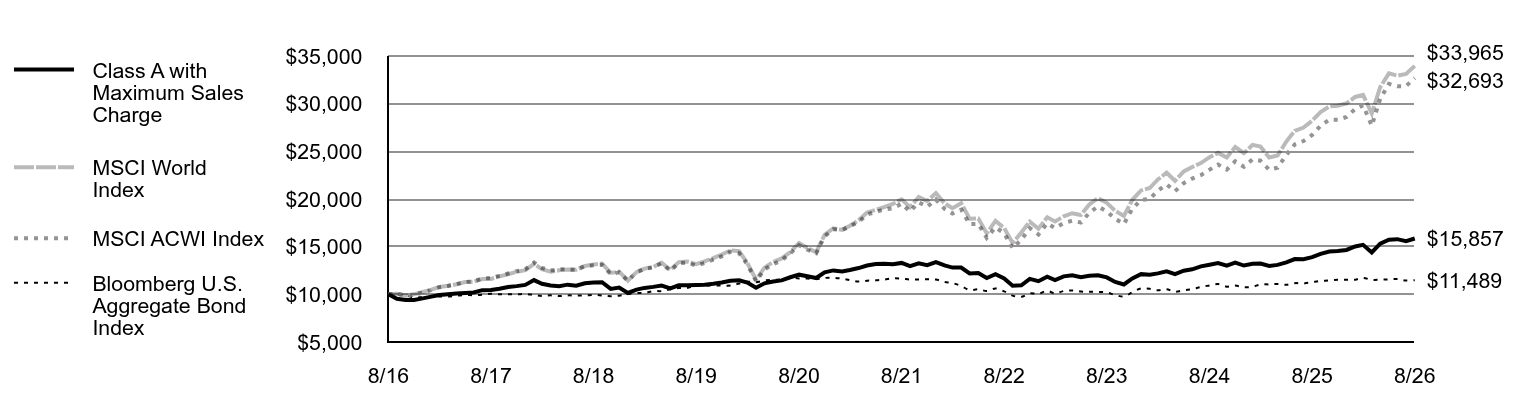
Table Summary
|
Class A with Maximum Sales Charge |
MSCI World Index |
MSCI ACWI Index |
Bloomberg U.S. Aggregate Bond Index |
8/16 |
$10,000 |
$10,000 |
$10,000 |
$10,000 |
9/16 |
$9,526 |
$10,053 |
$10,061 |
$9,994 |
10/16 |
$9,395 |
$9,859 |
$9,891 |
$9,918 |
11/16 |
$9,417 |
$10,000 |
$9,966 |
$9,683 |
12/16 |
$9,578 |
$10,240 |
$10,181 |
$9,697 |
1/17 |
$9,760 |
$10,487 |
$10,459 |
$9,716 |
2/17 |
$9,935 |
$10,778 |
$10,753 |
$9,781 |
3/17 |
$10,008 |
$10,892 |
$10,884 |
$9,776 |
4/17 |
$10,081 |
$11,054 |
$11,054 |
$9,851 |
5/17 |
$10,147 |
$11,288 |
$11,298 |
$9,927 |
6/17 |
$10,198 |
$11,331 |
$11,349 |
$9,917 |
7/17 |
$10,438 |
$11,602 |
$11,667 |
$9,960 |
8/17 |
$10,445 |
$11,619 |
$11,711 |
$10,049 |
9/17 |
$10,584 |
$11,879 |
$11,938 |
$10,001 |
10/17 |
$10,773 |
$12,104 |
$12,185 |
$10,007 |
11/17 |
$10,861 |
$12,366 |
$12,421 |
$9,994 |
12/17 |
$10,986 |
$12,533 |
$12,622 |
$10,040 |
1/18 |
$11,492 |
$13,195 |
$13,334 |
$9,925 |
2/18 |
$11,113 |
$12,648 |
$12,774 |
$9,831 |
3/18 |
$10,927 |
$12,373 |
$12,500 |
$9,894 |
4/18 |
$10,860 |
$12,515 |
$12,620 |
$9,820 |
5/18 |
$11,016 |
$12,593 |
$12,635 |
$9,890 |
6/18 |
$10,904 |
$12,587 |
$12,567 |
$9,878 |
7/18 |
$11,157 |
$12,980 |
$12,946 |
$9,880 |
8/18 |
$11,247 |
$13,141 |
$13,048 |
$9,944 |
9/18 |
$11,276 |
$13,214 |
$13,104 |
$9,880 |
10/18 |
$10,569 |
$12,244 |
$12,122 |
$9,802 |
11/18 |
$10,703 |
$12,383 |
$12,300 |
$9,860 |
12/18 |
$10,148 |
$11,441 |
$11,433 |
$10,041 |
1/19 |
$10,500 |
$12,332 |
$12,336 |
$10,148 |
2/19 |
$10,675 |
$12,703 |
$12,666 |
$10,142 |
3/19 |
$10,782 |
$12,869 |
$12,825 |
$10,337 |
4/19 |
$10,912 |
$13,326 |
$13,258 |
$10,340 |
5/19 |
$10,629 |
$12,557 |
$12,472 |
$10,523 |
6/19 |
$10,950 |
$13,384 |
$13,289 |
$10,655 |
7/19 |
$10,958 |
$13,451 |
$13,327 |
$10,679 |
8/19 |
$10,973 |
$13,175 |
$13,011 |
$10,955 |
9/19 |
$11,004 |
$13,456 |
$13,285 |
$10,897 |
10/19 |
$11,110 |
$13,798 |
$13,649 |
$10,930 |
11/19 |
$11,240 |
$14,182 |
$13,982 |
$10,924 |
12/19 |
$11,417 |
$14,607 |
$14,474 |
$10,917 |
1/20 |
$11,473 |
$14,518 |
$14,314 |
$11,127 |
2/20 |
$11,226 |
$13,291 |
$13,158 |
$11,327 |
3/20 |
$10,692 |
$11,532 |
$11,382 |
$11,260 |
4/20 |
$11,154 |
$12,792 |
$12,601 |
$11,460 |
5/20 |
$11,346 |
$13,410 |
$13,149 |
$11,514 |
6/20 |
$11,465 |
$13,765 |
$13,569 |
$11,586 |
7/20 |
$11,792 |
$14,423 |
$14,287 |
$11,759 |
8/20 |
$12,063 |
$15,387 |
$15,161 |
$11,665 |
9/20 |
$11,895 |
$14,856 |
$14,672 |
$11,658 |
10/20 |
$11,712 |
$14,400 |
$14,316 |
$11,606 |
11/20 |
$12,302 |
$16,242 |
$16,080 |
$11,720 |
12/20 |
$12,509 |
$16,930 |
$16,827 |
$11,736 |
1/21 |
$12,402 |
$16,762 |
$16,751 |
$11,652 |
2/21 |
$12,558 |
$17,192 |
$17,139 |
$11,484 |
3/21 |
$12,755 |
$17,764 |
$17,596 |
$11,340 |
4/21 |
$13,018 |
$18,590 |
$18,366 |
$11,430 |
5/21 |
$13,182 |
$18,858 |
$18,651 |
$11,467 |
6/21 |
$13,198 |
$19,139 |
$18,897 |
$11,548 |
7/21 |
$13,157 |
$19,482 |
$19,027 |
$11,677 |
8/21 |
$13,296 |
$19,967 |
$19,504 |
$11,655 |
9/21 |
$12,952 |
$19,138 |
$18,698 |
$11,554 |
10/21 |
$13,255 |
$20,222 |
$19,652 |
$11,551 |
11/21 |
$13,059 |
$19,779 |
$19,179 |
$11,585 |
12/21 |
$13,376 |
$20,624 |
$19,946 |
$11,555 |
1/22 |
$13,030 |
$19,533 |
$18,967 |
$11,306 |
2/22 |
$12,805 |
$19,039 |
$18,477 |
$11,180 |
3/22 |
$12,805 |
$19,561 |
$18,877 |
$10,869 |
4/22 |
$12,191 |
$17,936 |
$17,366 |
$10,457 |
5/22 |
$12,242 |
$17,950 |
$17,386 |
$10,524 |
6/22 |
$11,715 |
$16,395 |
$15,921 |
$10,359 |
7/22 |
$12,104 |
$17,697 |
$17,033 |
$10,612 |
8/22 |
$11,663 |
$16,957 |
$16,406 |
$10,313 |
9/22 |
$10,901 |
$15,380 |
$14,835 |
$9,867 |
10/22 |
$10,945 |
$16,485 |
$15,730 |
$9,739 |
11/22 |
$11,620 |
$17,631 |
$16,950 |
$10,097 |
12/22 |
$11,381 |
$16,882 |
$16,283 |
$10,052 |
1/23 |
$11,852 |
$18,077 |
$17,451 |
$10,361 |
2/23 |
$11,486 |
$17,642 |
$16,950 |
$10,093 |
3/23 |
$11,887 |
$18,188 |
$17,473 |
$10,350 |
4/23 |
$12,009 |
$18,506 |
$17,724 |
$10,412 |
5/23 |
$11,791 |
$18,322 |
$17,534 |
$10,299 |
6/23 |
$11,939 |
$19,430 |
$18,552 |
$10,262 |
7/23 |
$12,000 |
$20,082 |
$19,232 |
$10,255 |
8/23 |
$11,774 |
$19,603 |
$18,694 |
$10,189 |
9/23 |
$11,294 |
$18,757 |
$17,921 |
$9,931 |
10/23 |
$11,032 |
$18,213 |
$17,382 |
$9,774 |
11/23 |
$11,669 |
$19,920 |
$18,987 |
$10,216 |
12/23 |
$12,118 |
$20,898 |
$19,899 |
$10,608 |
1/24 |
$12,056 |
$21,149 |
$20,015 |
$10,578 |
2/24 |
$12,198 |
$22,046 |
$20,874 |
$10,429 |
3/24 |
$12,421 |
$22,754 |
$21,530 |
$10,525 |
4/24 |
$12,118 |
$21,909 |
$20,819 |
$10,259 |
5/24 |
$12,475 |
$22,887 |
$21,665 |
$10,433 |
6/24 |
$12,627 |
$23,353 |
$22,147 |
$10,532 |
7/24 |
$12,930 |
$23,765 |
$22,504 |
$10,778 |
8/24 |
$13,109 |
$24,393 |
$23,076 |
$10,933 |
9/24 |
$13,287 |
$24,839 |
$23,612 |
$11,079 |
10/24 |
$13,010 |
$24,347 |
$23,082 |
$10,805 |
11/24 |
$13,323 |
$25,464 |
$23,945 |
$10,919 |
12/24 |
$13,019 |
$24,800 |
$23,379 |
$10,740 |
1/25 |
$13,201 |
$25,675 |
$24,163 |
$10,797 |
2/25 |
$13,237 |
$25,491 |
$24,018 |
$11,035 |
3/25 |
$12,982 |
$24,356 |
$23,069 |
$11,039 |
4/25 |
$13,091 |
$24,572 |
$23,284 |
$11,082 |
5/25 |
$13,356 |
$26,027 |
$24,622 |
$11,003 |
6/25 |
$13,702 |
$27,150 |
$25,728 |
$11,172 |
7/25 |
$13,693 |
$27,499 |
$26,077 |
$11,143 |
8/25 |
$13,902 |
$28,217 |
$26,721 |
$11,276 |
9/25 |
$14,248 |
$29,124 |
$27,689 |
$11,399 |
10/25 |
$14,494 |
$29,707 |
$28,309 |
$11,470 |
11/25 |
$14,540 |
$29,791 |
$28,305 |
$11,541 |
12/25 |
$14,657 |
$30,032 |
$28,601 |
$11,524 |
1/26 |
$15,021 |
$30,704 |
$29,449 |
$11,537 |
2/26 |
$15,189 |
$30,929 |
$29,827 |
$11,726 |
3/26 |
$14,395 |
$28,959 |
$27,685 |
$11,519 |
4/26 |
$15,311 |
$31,736 |
$30,502 |
$11,532 |
5/26 |
$15,731 |
$33,181 |
$32,075 |
$11,568 |
6/26 |
$15,787 |
$32,943 |
$31,818 |
$11,596 |
7/26 |
$15,581 |
$33,112 |
$31,842 |
$11,445 |
8/26 |
$15,857 |
$33,965 |
$32,693 |
$11,489 | |
|
| Average Annual Return [Table Text Block] |
Average Annual Total Returns (%)Footnote Reference1
Table Summary
Fund |
1 Year |
5 Years |
10 Years |
Class A |
14.03% |
3.58% |
5.28% |
Class A with 5.25% Maximum Sales Charge |
8.01% |
2.46% |
4.72% |
MSCI World Index (net of foreign withholding taxes) |
20.37% |
11.20% |
13.00% |
MSCI ACWI Index (net of foreign withholding taxes) |
22.35% |
10.88% |
12.57% |
Bloomberg U.S. Aggregate Bond Index |
1.89% |
(0.29)% |
1.40% |
Blended Index (60% MSCI ACWI Index/40% Bloomberg U.S. Aggregate Bond Index) |
13.95% |
6.45% |
8.20% |
| Footnote |
Description |
Footnote1 |
Performance prior to August 18, 2025 reflects the Fund’s performance under its former principal investment strategies and is that of the Fund’s former investment sub-adviser. | Performance does not reflect the deduction of taxes that a shareholder would pay on Fund distributions or redemption of Fund shares. Performance assumes that all dividends and distributions, if any, were reinvested. For more recent performance information, visit www.eatonvance.com/performance.php. THE FUND'S PAST PERFORMANCE IS NO GUARANTEE OF FUTURE RESULTS. |
|
| No Deduction of Taxes [Text Block] |
Performance does not reflect the deduction of taxes that a shareholder would pay on Fund distributions or redemption of Fund shares.
|
|
| Material Change Date |
|
Aug. 31, 2025
|
| Updated Performance Information Location [Text Block] |
For more recent performance information, visit www.eatonvance.com/performance.php.
|
|
| AssetsNet |
$ 206,898,592
|
|
| Holdings Count | Holding |
232
|
|
| Advisory Fees Paid, Amount |
$ 1,310,691
|
|
| InvestmentCompanyPortfolioTurnover |
107.00%
|
|
| Additional Fund Statistics [Text Block] |
Table Summary
Total Net Assets |
$206,898,592 |
# of Portfolio Holdings |
232 |
Portfolio Turnover Rate |
107% |
Total Advisory Fees Paid |
$1,310,691 | |
|
| Holdings [Text Block] |
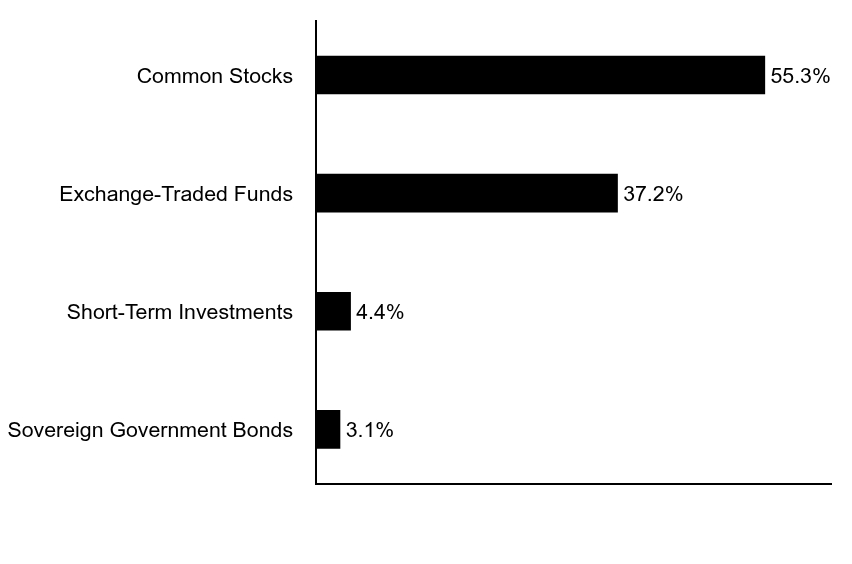
Asset Allocation (% of total investments)
Table Summary
Value |
Value |
Sovereign Government Bonds |
3.1% |
Short-Term Investments |
4.4% |
Exchange-Traded Funds |
37.2% |
Common Stocks |
55.3% | |
|
| Largest Holdings [Text Block] |
Top Ten Holdings (% of total investments)Footnote Referencea
Table Summary
Eaton Vance Total Return Bond ETF |
11.0% |
Eaton Vance Mortgage Opportunities ETF |
8.6% |
Vanguard Emerging Markets Government Bond ETF |
5.0% |
iShares Core MSCI Emerging Markets ETF |
5.0% |
iShares TIPS Bond ETF |
3.5% |
NVIDIA Corp. |
3.2% |
Brazil Letras do Tesouro Nacional, 0.00%, 1/1/29 |
3.1% |
Microsoft Corp. |
2.5% |
Apple, Inc. |
2.4% |
Amazon.com, Inc. |
1.7% |
Total |
46.0% |
| Footnote |
Description |
Footnotea |
Excluding cash equivalents | |
|
| Material Fund Change [Text Block] |
This is a summary of certain changes to the Fund since August 31, 2025. For more complete information, you may review the Fund’s next prospectus, which we expect to be available by January 1, 2027 at www.eatonvance.com/open-end-mutual-fund-documents.php or upon request by contacting us at 1-800-262-1122. The net expense ratio decreased from the prior fiscal year primarily because the reduction in the investment adviser and administration fee and the agreement to reimburse the Fund’s expenses, both effective August 18, 2025, were in effect throughout the current fiscal year. The decrease also reflected a reduction in the investment adviser and administration fee due to the Fund’s investments in affiliated funds. |
|
| Material Fund Change Expenses [Text Block] |
The net expense ratio decreased from the prior fiscal year primarily because the reduction in the investment adviser and administration fee and the agreement to reimburse the Fund’s expenses, both effective August 18, 2025, were in effect throughout the current fiscal year. The decrease also reflected a reduction in the investment adviser and administration fee due to the Fund’s investments in affiliated funds.
|
|
| Summary of Change Legend [Text Block] |
This is a summary of certain changes to the Fund since August 31, 2025. For more complete information, you may review the Fund’s next prospectus, which we expect to be available by January 1, 2027 at www.eatonvance.com/open-end-mutual-fund-documents.php or upon request by contacting us at 1-800-262-1122.
|
|
| Updated Prospectus Phone Number |
1-800-262-1122
|
|
| C000104753 |
|
|
| Shareholder Report [Line Items] |
|
|
| Fund Name |
Eaton Vance All Asset Strategy Fund
|
|
| Class Name |
Class C
|
|
| Trading Symbol |
ECRAX
|
|
| Annual or Semi-Annual Statement [Text Block] |
This annual shareholder report contains important information about the Eaton Vance All Asset Strategy Fund for the period of September 1, 2025 to August 31, 2026.
|
|
| Additional Information [Text Block] |
You can find additional information about the Fund at www.eatonvance.com/open-end-mutual-fund-documents.php. You can also request this information by contacting us at 1-800-262-1122.
|
|
| Material Fund Change Notice [Text Block] |
This report describes changes to the Fund that occurred during the reporting period.
|
|
| Additional Information Phone Number |
1-800-262-1122
|
|
| Additional Information Website |
<span style="box-sizing: border-box; color: rgb(0, 0, 0); display: inline; flex-wrap: nowrap; font-size: 10.6667px; font-weight: 400; grid-area: auto; line-height: 16px; margin: 0px; overflow: visible; text-align: left; text-align-last: auto; white-space-collapse: preserve-breaks;">www.eatonvance.com/open-end-mutual-fund-documents.php</span>
|
|
| Expenses [Text Block] |
What were the Fund costs for the last year?(based on a hypothetical $10,000 investment)
Table Summary
Class Name |
Costs of a $10,000 investment |
Costs paid as a percentage of a $10,000 investment |
Class C |
$188 |
1.76% | |
|
| Expenses Paid, Amount |
$ 188
|
|
| Expense Ratio, Percent |
1.76%
|
|
| Factors Affecting Performance [Text Block] |
How did the Fund perform last year and what affected its performance?Key contributors to (↑) and detractors from (↓) performance, relative to 60% MSCI ACWI Index/40% Bloomberg U.S. Aggregate Bond Index (the Blended Index): ↓ Exposure to the global equities basket detracted from performance ↓ Exposure to Treasury Inflation-Protected Securities mildly detracted from performance ↑ An overweight exposure to equities and an underweight exposure to fixed income assets helped relative returns ↑ An overweight exposure to emerging markets (EM), particularly South Korea and Taiwan, contributed to performance ↑ An overweight exposure to EM government bonds also added to returns |
|
| Performance Past Does Not Indicate Future [Text] |
THE FUND'S PAST PERFORMANCE IS NO GUARANTEE OF FUTURE RESULTS.
|
|
| Line Graph [Table Text Block] |
Comparison of the change in value of a $10,000 investment for the period indicated.
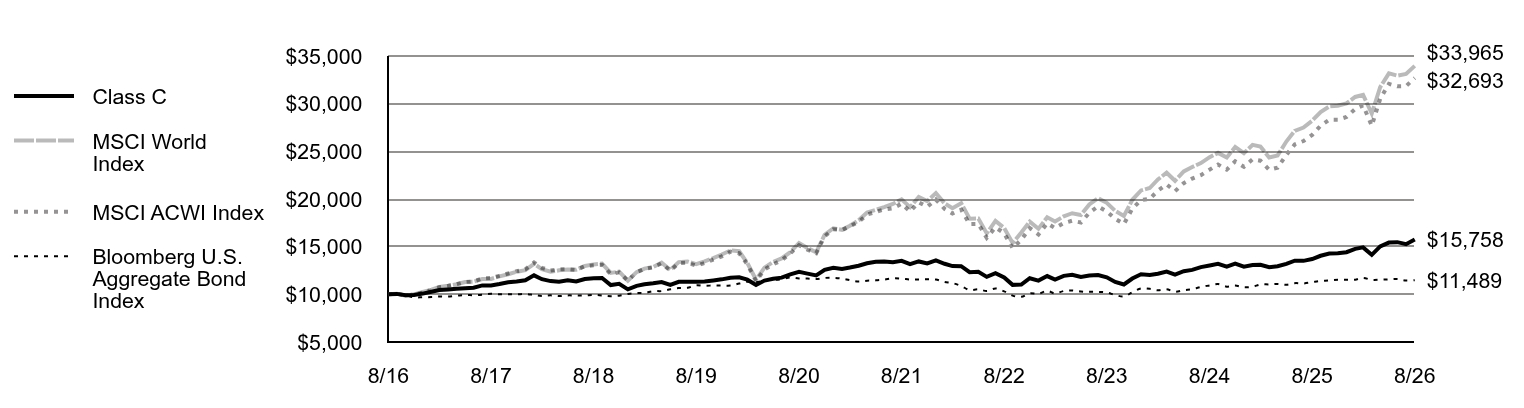
Table Summary
|
Class C |
MSCI World Index |
MSCI ACWI Index |
Bloomberg U.S. Aggregate Bond Index |
8/16 |
$10,000 |
$10,000 |
$10,000 |
$10,000 |
9/16 |
$10,047 |
$10,053 |
$10,061 |
$9,994 |
10/16 |
$9,899 |
$9,859 |
$9,891 |
$9,918 |
11/16 |
$9,922 |
$10,000 |
$9,966 |
$9,683 |
12/16 |
$10,078 |
$10,240 |
$10,181 |
$9,697 |
1/17 |
$10,265 |
$10,487 |
$10,459 |
$9,716 |
2/17 |
$10,444 |
$10,778 |
$10,753 |
$9,781 |
3/17 |
$10,507 |
$10,892 |
$10,884 |
$9,776 |
4/17 |
$10,577 |
$11,054 |
$11,054 |
$9,851 |
5/17 |
$10,647 |
$11,288 |
$11,298 |
$9,927 |
6/17 |
$10,694 |
$11,331 |
$11,349 |
$9,917 |
7/17 |
$10,935 |
$11,602 |
$11,667 |
$9,960 |
8/17 |
$10,935 |
$11,619 |
$11,711 |
$10,049 |
9/17 |
$11,083 |
$11,879 |
$11,938 |
$10,001 |
10/17 |
$11,263 |
$12,104 |
$12,185 |
$10,007 |
11/17 |
$11,348 |
$12,366 |
$12,421 |
$9,994 |
12/17 |
$11,477 |
$12,533 |
$12,622 |
$10,040 |
1/18 |
$11,991 |
$13,195 |
$13,334 |
$9,925 |
2/18 |
$11,588 |
$12,648 |
$12,774 |
$9,831 |
3/18 |
$11,390 |
$12,373 |
$12,500 |
$9,894 |
4/18 |
$11,319 |
$12,515 |
$12,620 |
$9,820 |
5/18 |
$11,469 |
$12,593 |
$12,635 |
$9,890 |
6/18 |
$11,343 |
$12,587 |
$12,567 |
$9,878 |
7/18 |
$11,604 |
$12,980 |
$12,946 |
$9,880 |
8/18 |
$11,690 |
$13,141 |
$13,048 |
$9,944 |
9/18 |
$11,714 |
$13,214 |
$13,104 |
$9,880 |
10/18 |
$10,971 |
$12,244 |
$12,122 |
$9,802 |
11/18 |
$11,106 |
$12,383 |
$12,300 |
$9,860 |
12/18 |
$10,522 |
$11,441 |
$11,433 |
$10,041 |
1/19 |
$10,885 |
$12,332 |
$12,336 |
$10,148 |
2/19 |
$11,054 |
$12,703 |
$12,666 |
$10,142 |
3/19 |
$11,159 |
$12,869 |
$12,825 |
$10,337 |
4/19 |
$11,288 |
$13,326 |
$13,258 |
$10,340 |
5/19 |
$10,982 |
$12,557 |
$12,472 |
$10,523 |
6/19 |
$11,313 |
$13,384 |
$13,289 |
$10,655 |
7/19 |
$11,313 |
$13,451 |
$13,327 |
$10,679 |
8/19 |
$11,321 |
$13,175 |
$13,011 |
$10,955 |
9/19 |
$11,345 |
$13,456 |
$13,285 |
$10,897 |
10/19 |
$11,450 |
$13,798 |
$13,649 |
$10,930 |
11/19 |
$11,571 |
$14,182 |
$13,982 |
$10,924 |
12/19 |
$11,745 |
$14,607 |
$14,474 |
$10,917 |
1/20 |
$11,795 |
$14,518 |
$14,314 |
$11,127 |
2/20 |
$11,536 |
$13,291 |
$13,158 |
$11,327 |
3/20 |
$10,985 |
$11,532 |
$11,382 |
$11,260 |
4/20 |
$11,444 |
$12,792 |
$12,601 |
$11,460 |
5/20 |
$11,637 |
$13,410 |
$13,149 |
$11,514 |
6/20 |
$11,754 |
$13,765 |
$13,569 |
$11,586 |
7/20 |
$12,088 |
$14,423 |
$14,287 |
$11,759 |
8/20 |
$12,356 |
$15,387 |
$15,161 |
$11,665 |
9/20 |
$12,172 |
$14,856 |
$14,672 |
$11,658 |
10/20 |
$11,979 |
$14,400 |
$14,316 |
$11,606 |
11/20 |
$12,573 |
$16,242 |
$16,080 |
$11,720 |
12/20 |
$12,774 |
$16,930 |
$16,827 |
$11,736 |
1/21 |
$12,663 |
$16,762 |
$16,751 |
$11,652 |
2/21 |
$12,809 |
$17,192 |
$17,139 |
$11,484 |
3/21 |
$13,005 |
$17,764 |
$17,596 |
$11,340 |
4/21 |
$13,262 |
$18,590 |
$18,366 |
$11,430 |
5/21 |
$13,424 |
$18,858 |
$18,651 |
$11,467 |
6/21 |
$13,432 |
$19,139 |
$18,897 |
$11,548 |
7/21 |
$13,373 |
$19,482 |
$19,027 |
$11,677 |
8/21 |
$13,509 |
$19,967 |
$19,504 |
$11,655 |
9/21 |
$13,159 |
$19,138 |
$18,698 |
$11,554 |
10/21 |
$13,450 |
$20,222 |
$19,652 |
$11,551 |
11/21 |
$13,244 |
$19,779 |
$19,179 |
$11,585 |
12/21 |
$13,554 |
$20,624 |
$19,946 |
$11,555 |
1/22 |
$13,205 |
$19,533 |
$18,967 |
$11,306 |
2/22 |
$12,963 |
$19,039 |
$18,477 |
$11,180 |
3/22 |
$12,954 |
$19,561 |
$18,877 |
$10,869 |
4/22 |
$12,327 |
$17,936 |
$17,366 |
$10,457 |
5/22 |
$12,372 |
$17,950 |
$17,386 |
$10,524 |
6/22 |
$11,835 |
$16,395 |
$15,921 |
$10,359 |
7/22 |
$12,220 |
$17,697 |
$17,033 |
$10,612 |
8/22 |
$11,763 |
$16,957 |
$16,406 |
$10,313 |
9/22 |
$10,993 |
$15,380 |
$14,835 |
$9,867 |
10/22 |
$11,020 |
$16,485 |
$15,730 |
$9,739 |
11/22 |
$11,692 |
$17,631 |
$16,950 |
$10,097 |
12/22 |
$11,443 |
$16,882 |
$16,283 |
$10,052 |
1/23 |
$11,918 |
$18,077 |
$17,451 |
$10,361 |
2/23 |
$11,550 |
$17,642 |
$16,950 |
$10,093 |
3/23 |
$11,935 |
$18,188 |
$17,473 |
$10,350 |
4/23 |
$12,052 |
$18,506 |
$17,724 |
$10,412 |
5/23 |
$11,828 |
$18,322 |
$17,534 |
$10,299 |
6/23 |
$11,971 |
$19,430 |
$18,552 |
$10,262 |
7/23 |
$12,025 |
$20,082 |
$19,232 |
$10,255 |
8/23 |
$11,792 |
$19,603 |
$18,694 |
$10,189 |
9/23 |
$11,300 |
$18,757 |
$17,921 |
$9,931 |
10/23 |
$11,031 |
$18,213 |
$17,382 |
$9,774 |
11/23 |
$11,658 |
$19,920 |
$18,987 |
$10,216 |
12/23 |
$12,103 |
$20,898 |
$19,899 |
$10,608 |
1/24 |
$12,031 |
$21,149 |
$20,015 |
$10,578 |
2/24 |
$12,167 |
$22,046 |
$20,874 |
$10,429 |
3/24 |
$12,385 |
$22,754 |
$21,530 |
$10,525 |
4/24 |
$12,067 |
$21,909 |
$20,819 |
$10,259 |
5/24 |
$12,421 |
$22,887 |
$21,665 |
$10,433 |
6/24 |
$12,567 |
$23,353 |
$22,147 |
$10,532 |
7/24 |
$12,857 |
$23,765 |
$22,504 |
$10,778 |
8/24 |
$13,030 |
$24,393 |
$23,076 |
$10,933 |
9/24 |
$13,194 |
$24,839 |
$23,612 |
$11,079 |
10/24 |
$12,912 |
$24,347 |
$23,082 |
$10,805 |
11/24 |
$13,212 |
$25,464 |
$23,945 |
$10,919 |
12/24 |
$12,905 |
$24,800 |
$23,379 |
$10,740 |
1/25 |
$13,070 |
$25,675 |
$24,163 |
$10,797 |
2/25 |
$13,107 |
$25,491 |
$24,018 |
$11,035 |
3/25 |
$12,850 |
$24,356 |
$23,069 |
$11,039 |
4/25 |
$12,951 |
$24,572 |
$23,284 |
$11,082 |
5/25 |
$13,199 |
$26,027 |
$24,622 |
$11,003 |
6/25 |
$13,530 |
$27,150 |
$25,728 |
$11,172 |
7/25 |
$13,512 |
$27,499 |
$26,077 |
$11,143 |
8/25 |
$13,705 |
$28,217 |
$26,721 |
$11,276 |
9/25 |
$14,045 |
$29,124 |
$27,689 |
$11,399 |
10/25 |
$14,275 |
$29,707 |
$28,309 |
$11,470 |
11/25 |
$14,312 |
$29,791 |
$28,305 |
$11,541 |
12/25 |
$14,419 |
$30,032 |
$28,601 |
$11,524 |
1/26 |
$14,774 |
$30,704 |
$29,449 |
$11,537 |
2/26 |
$14,924 |
$30,929 |
$29,827 |
$11,726 |
3/26 |
$14,139 |
$28,959 |
$27,685 |
$11,519 |
4/26 |
$15,027 |
$31,736 |
$30,502 |
$11,532 |
5/26 |
$15,428 |
$33,181 |
$32,075 |
$11,568 |
6/26 |
$15,475 |
$32,943 |
$31,818 |
$11,596 |
7/26 |
$15,260 |
$33,112 |
$31,842 |
$11,445 |
8/26 |
$15,758 |
$33,965 |
$32,693 |
$11,489 | |
|
| Average Annual Return [Table Text Block] |
Average Annual Total Returns (%)Footnote Reference1
Table Summary
Fund |
1 Year |
5 Years |
10 Years |
Class C, with conversion to Class A after 8 years |
13.26% |
2.81% |
4.65% |
Class C, with 1% Maximum Contingent Deferred Sales Charge and conversion to Class A after 8 years |
12.26% |
2.81% |
4.65% |
MSCI World Index (net of foreign withholding taxes) |
20.37% |
11.20% |
13.00% |
MSCI ACWI Index (net of foreign withholding taxes) |
22.35% |
10.88% |
12.57% |
Bloomberg U.S. Aggregate Bond Index |
1.89% |
(0.29)% |
1.40% |
Blended Index (60% MSCI ACWI Index/40% Bloomberg U.S. Aggregate Bond Index) |
13.95% |
6.45% |
8.20% |
| Footnote |
Description |
Footnote1 |
Performance prior to August 18, 2025 reflects the Fund’s performance under its former principal investment strategies and is that of the Fund’s former investment sub-adviser. | Performance does not reflect the deduction of taxes that a shareholder would pay on Fund distributions or redemption of Fund shares. Performance assumes that all dividends and distributions, if any, were reinvested. For more recent performance information, visit www.eatonvance.com/performance.php. THE FUND'S PAST PERFORMANCE IS NO GUARANTEE OF FUTURE RESULTS. |
|
| No Deduction of Taxes [Text Block] |
Performance does not reflect the deduction of taxes that a shareholder would pay on Fund distributions or redemption of Fund shares.
|
|
| Material Change Date |
|
Aug. 31, 2025
|
| Updated Performance Information Location [Text Block] |
For more recent performance information, visit www.eatonvance.com/performance.php.
|
|
| AssetsNet |
$ 206,898,592
|
|
| Holdings Count | Holding |
232
|
|
| Advisory Fees Paid, Amount |
$ 1,310,691
|
|
| InvestmentCompanyPortfolioTurnover |
107.00%
|
|
| Additional Fund Statistics [Text Block] |
Table Summary
Total Net Assets |
$206,898,592 |
# of Portfolio Holdings |
232 |
Portfolio Turnover Rate |
107% |
Total Advisory Fees Paid |
$1,310,691 | |
|
| Holdings [Text Block] |
Asset Allocation (% of total investments)
Table Summary
Value |
Value |
Sovereign Government Bonds |
3.1% |
Short-Term Investments |
4.4% |
Exchange-Traded Funds |
37.2% |
Common Stocks |
55.3% | |
|
| Largest Holdings [Text Block] |
Top Ten Holdings (% of total investments)Footnote Referencea
Table Summary
Eaton Vance Total Return Bond ETF |
11.0% |
Eaton Vance Mortgage Opportunities ETF |
8.6% |
Vanguard Emerging Markets Government Bond ETF |
5.0% |
iShares Core MSCI Emerging Markets ETF |
5.0% |
iShares TIPS Bond ETF |
3.5% |
NVIDIA Corp. |
3.2% |
Brazil Letras do Tesouro Nacional, 0.00%, 1/1/29 |
3.1% |
Microsoft Corp. |
2.5% |
Apple, Inc. |
2.4% |
Amazon.com, Inc. |
1.7% |
Total |
46.0% |
| Footnote |
Description |
Footnotea |
Excluding cash equivalents | |
|
| Material Fund Change [Text Block] |
This is a summary of certain changes to the Fund since August 31, 2025. For more complete information, you may review the Fund’s next prospectus, which we expect to be available by January 1, 2027 at www.eatonvance.com/open-end-mutual-fund-documents.php or upon request by contacting us at 1-800-262-1122. The net expense ratio decreased from the prior fiscal year primarily because the reduction in the investment adviser and administration fee and the agreement to reimburse the Fund’s expenses, both effective August 18, 2025, were in effect throughout the current fiscal year. The decrease also reflected a reduction in the investment adviser and administration fee due to the Fund’s investments in affiliated funds. |
|
| Material Fund Change Expenses [Text Block] |
The net expense ratio decreased from the prior fiscal year primarily because the reduction in the investment adviser and administration fee and the agreement to reimburse the Fund’s expenses, both effective August 18, 2025, were in effect throughout the current fiscal year. The decrease also reflected a reduction in the investment adviser and administration fee due to the Fund’s investments in affiliated funds.
|
|
| Summary of Change Legend [Text Block] |
This is a summary of certain changes to the Fund since August 31, 2025. For more complete information, you may review the Fund’s next prospectus, which we expect to be available by January 1, 2027 at www.eatonvance.com/open-end-mutual-fund-documents.php or upon request by contacting us at 1-800-262-1122.
|
|
| Updated Prospectus Phone Number |
1-800-262-1122
|
|
| C000104754 |
|
|
| Shareholder Report [Line Items] |
|
|
| Fund Name |
Eaton Vance All Asset Strategy Fund
|
|
| Class Name |
Class I
|
|
| Trading Symbol |
EIRAX
|
|
| Annual or Semi-Annual Statement [Text Block] |
This annual shareholder report contains important information about the Eaton Vance All Asset Strategy Fund for the period of September 1, 2025 to August 31, 2026.
|
|
| Additional Information [Text Block] |
You can find additional information about the Fund at www.eatonvance.com/open-end-mutual-fund-documents.php. You can also request this information by contacting us at 1-800-262-1122.
|
|
| Material Fund Change Notice [Text Block] |
This report describes changes to the Fund that occurred during the reporting period.
|
|
| Additional Information Phone Number |
1-800-262-1122
|
|
| Additional Information Website |
<span style="box-sizing: border-box; color: rgb(0, 0, 0); display: inline; flex-wrap: nowrap; font-size: 10.6667px; font-weight: 400; grid-area: auto; line-height: 16px; margin: 0px; overflow: visible; text-align: left; text-align-last: auto; white-space-collapse: preserve-breaks;">www.eatonvance.com/open-end-mutual-fund-documents.php</span>
|
|
| Expenses [Text Block] |
What were the Fund costs for the last year?(based on a hypothetical $10,000 investment)
Table Summary
Class Name |
Costs of a $10,000 investment |
Costs paid as a percentage of a $10,000 investment |
Class I |
$81 |
0.76% | |
|
| Expenses Paid, Amount |
$ 81
|
|
| Expense Ratio, Percent |
0.76%
|
|
| Factors Affecting Performance [Text Block] |
How did the Fund perform last year and what affected its performance?Key contributors to (↑) and detractors from (↓) performance, relative to 60% MSCI ACWI Index/40% Bloomberg U.S. Aggregate Bond Index (the Blended Index): ↑ An overweight exposure to equities and an underweight exposure to fixed income assets helped relative returns ↑ An overweight exposure to emerging markets (EM), particularly South Korea and Taiwan, contributed to performance ↑ An overweight exposure to EM government bonds also added to returns ↓ Exposure to the global equities basket detracted from performance ↓ Exposure to Treasury Inflation-Protected Securities mildly detracted from performance |
|
| Performance Past Does Not Indicate Future [Text] |
THE FUND'S PAST PERFORMANCE IS NO GUARANTEE OF FUTURE RESULTS.
|
|
| Line Graph [Table Text Block] |
Comparison of the change in value of a $1,000,000 investment for the period indicated.
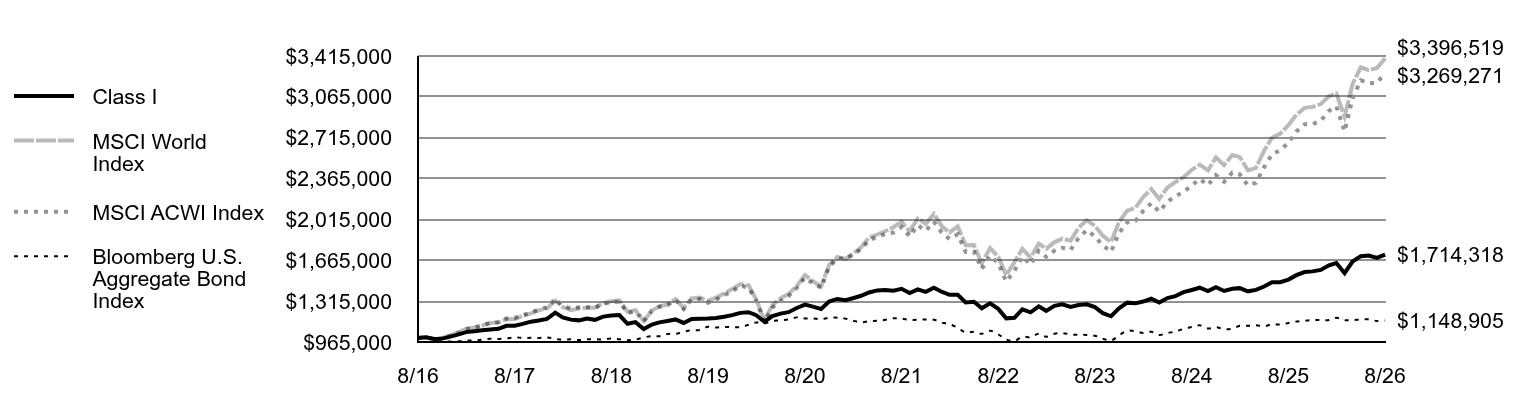
Table Summary
|
Class I |
MSCI World Index |
MSCI ACWI Index |
Bloomberg U.S. Aggregate Bond Index |
8/16 |
$1,000,000 |
$1,000,000 |
$1,000,000 |
$1,000,000 |
9/16 |
$1,005,331 |
$1,005,312 |
$1,006,129 |
$999,414 |
10/16 |
$991,622 |
$985,856 |
$989,052 |
$991,770 |
11/16 |
$993,907 |
$1,000,032 |
$996,568 |
$968,311 |
12/16 |
$1,011,146 |
$1,023,961 |
$1,018,096 |
$969,676 |
1/17 |
$1,030,325 |
$1,048,674 |
$1,045,934 |
$971,579 |
2/17 |
$1,049,505 |
$1,077,768 |
$1,075,274 |
$978,109 |
3/17 |
$1,057,177 |
$1,089,249 |
$1,088,428 |
$977,596 |
4/17 |
$1,064,849 |
$1,105,377 |
$1,105,391 |
$985,140 |
5/17 |
$1,072,521 |
$1,128,761 |
$1,129,801 |
$992,723 |
6/17 |
$1,077,891 |
$1,133,104 |
$1,134,939 |
$991,724 |
7/17 |
$1,103,208 |
$1,160,221 |
$1,166,656 |
$995,991 |
8/17 |
$1,103,975 |
$1,161,855 |
$1,171,126 |
$1,004,925 |
9/17 |
$1,120,086 |
$1,187,932 |
$1,193,752 |
$1,000,139 |
10/17 |
$1,139,265 |
$1,210,382 |
$1,218,541 |
$1,000,718 |
11/17 |
$1,149,239 |
$1,236,608 |
$1,242,130 |
$999,434 |
12/17 |
$1,162,905 |
$1,253,332 |
$1,262,155 |
$1,004,021 |
1/18 |
$1,216,300 |
$1,319,508 |
$1,333,361 |
$992,458 |
2/18 |
$1,176,254 |
$1,264,844 |
$1,277,362 |
$983,050 |
3/18 |
$1,156,623 |
$1,237,275 |
$1,250,018 |
$989,354 |
4/18 |
$1,150,341 |
$1,251,493 |
$1,261,955 |
$981,996 |
5/18 |
$1,166,831 |
$1,259,335 |
$1,263,531 |
$989,004 |
6/18 |
$1,155,053 |
$1,258,734 |
$1,256,688 |
$987,788 |
7/18 |
$1,182,535 |
$1,298,049 |
$1,294,586 |
$988,022 |
8/18 |
$1,192,743 |
$1,314,109 |
$1,304,757 |
$994,380 |
9/18 |
$1,195,884 |
$1,321,427 |
$1,310,435 |
$987,977 |
10/18 |
$1,121,288 |
$1,224,397 |
$1,212,233 |
$980,169 |
11/18 |
$1,135,422 |
$1,238,306 |
$1,229,962 |
$986,020 |
12/18 |
$1,076,602 |
$1,144,148 |
$1,143,330 |
$1,004,135 |
1/19 |
$1,114,561 |
$1,233,169 |
$1,233,607 |
$1,014,798 |
2/19 |
$1,133,137 |
$1,270,250 |
$1,266,603 |
$1,014,210 |
3/19 |
$1,145,252 |
$1,286,934 |
$1,282,532 |
$1,033,685 |
4/19 |
$1,158,175 |
$1,332,568 |
$1,325,837 |
$1,033,950 |
5/19 |
$1,128,291 |
$1,255,678 |
$1,247,190 |
$1,052,304 |
6/19 |
$1,163,021 |
$1,338,421 |
$1,328,855 |
$1,065,519 |
7/19 |
$1,164,636 |
$1,345,050 |
$1,332,749 |
$1,067,862 |
8/19 |
$1,166,251 |
$1,317,538 |
$1,301,133 |
$1,095,533 |
9/19 |
$1,170,289 |
$1,345,576 |
$1,328,511 |
$1,089,698 |
10/19 |
$1,181,597 |
$1,379,818 |
$1,364,871 |
$1,092,980 |
11/19 |
$1,195,327 |
$1,418,246 |
$1,398,189 |
$1,092,424 |
12/19 |
$1,214,669 |
$1,460,734 |
$1,447,427 |
$1,091,662 |
1/20 |
$1,220,581 |
$1,451,843 |
$1,431,439 |
$1,112,671 |
2/20 |
$1,194,396 |
$1,329,126 |
$1,315,822 |
$1,132,697 |
3/20 |
$1,138,646 |
$1,153,226 |
$1,138,181 |
$1,126,032 |
4/20 |
$1,186,794 |
$1,279,209 |
$1,260,109 |
$1,146,048 |
5/20 |
$1,207,911 |
$1,341,005 |
$1,314,912 |
$1,151,384 |
6/20 |
$1,220,581 |
$1,376,476 |
$1,356,927 |
$1,158,637 |
7/20 |
$1,256,059 |
$1,442,329 |
$1,428,691 |
$1,175,943 |
8/20 |
$1,285,623 |
$1,538,697 |
$1,516,134 |
$1,166,451 |
9/20 |
$1,267,884 |
$1,485,613 |
$1,467,249 |
$1,165,812 |
10/20 |
$1,248,456 |
$1,440,042 |
$1,431,582 |
$1,160,606 |
11/20 |
$1,310,964 |
$1,624,168 |
$1,608,043 |
$1,171,994 |
12/20 |
$1,333,971 |
$1,693,027 |
$1,682,704 |
$1,173,609 |
1/21 |
$1,322,644 |
$1,676,201 |
$1,675,051 |
$1,165,195 |
2/21 |
$1,340,071 |
$1,719,152 |
$1,713,851 |
$1,148,369 |
3/21 |
$1,360,982 |
$1,776,352 |
$1,759,627 |
$1,134,029 |
4/21 |
$1,388,864 |
$1,859,024 |
$1,836,562 |
$1,142,988 |
5/21 |
$1,407,161 |
$1,885,804 |
$1,865,143 |
$1,146,722 |
6/21 |
$1,409,775 |
$1,913,915 |
$1,889,724 |
$1,154,779 |
7/21 |
$1,404,547 |
$1,948,195 |
$1,902,743 |
$1,167,691 |
8/21 |
$1,420,231 |
$1,996,683 |
$1,950,367 |
$1,165,468 |
9/21 |
$1,383,636 |
$1,913,779 |
$1,869,798 |
$1,155,377 |
10/21 |
$1,415,874 |
$2,022,177 |
$1,965,239 |
$1,155,059 |
11/21 |
$1,394,963 |
$1,977,865 |
$1,917,915 |
$1,158,476 |
12/21 |
$1,429,455 |
$2,062,399 |
$1,994,633 |
$1,155,512 |
1/22 |
$1,393,534 |
$1,953,276 |
$1,896,671 |
$1,130,617 |
2/22 |
$1,369,587 |
$1,903,875 |
$1,847,686 |
$1,118,004 |
3/22 |
$1,369,587 |
$1,956,124 |
$1,887,705 |
$1,086,944 |
4/22 |
$1,304,194 |
$1,793,622 |
$1,736,609 |
$1,045,696 |
5/22 |
$1,309,720 |
$1,794,980 |
$1,738,642 |
$1,052,438 |
6/22 |
$1,254,457 |
$1,639,496 |
$1,592,081 |
$1,035,928 |
7/22 |
$1,295,904 |
$1,769,666 |
$1,703,260 |
$1,061,240 |
8/22 |
$1,248,931 |
$1,695,680 |
$1,640,554 |
$1,031,253 |
9/22 |
$1,167,880 |
$1,538,049 |
$1,483,505 |
$986,696 |
10/22 |
$1,172,485 |
$1,648,501 |
$1,573,030 |
$973,916 |
11/22 |
$1,244,326 |
$1,763,122 |
$1,695,040 |
$1,009,733 |
12/22 |
$1,218,947 |
$1,688,247 |
$1,628,338 |
$1,005,178 |
1/23 |
$1,270,164 |
$1,807,701 |
$1,745,053 |
$1,036,102 |
2/23 |
$1,231,984 |
$1,764,247 |
$1,695,039 |
$1,009,313 |
3/23 |
$1,274,820 |
$1,818,761 |
$1,747,302 |
$1,034,952 |
4/23 |
$1,287,857 |
$1,850,643 |
$1,772,415 |
$1,041,224 |
5/23 |
$1,265,508 |
$1,832,168 |
$1,753,431 |
$1,029,887 |
6/23 |
$1,281,338 |
$1,942,973 |
$1,855,237 |
$1,026,214 |
7/23 |
$1,287,857 |
$2,008,243 |
$1,923,154 |
$1,025,498 |
8/23 |
$1,263,645 |
$1,960,275 |
$1,869,413 |
$1,018,948 |
9/23 |
$1,212,429 |
$1,875,711 |
$1,792,112 |
$993,055 |
10/23 |
$1,185,424 |
$1,821,286 |
$1,738,228 |
$977,383 |
11/23 |
$1,253,402 |
$1,992,035 |
$1,898,660 |
$1,021,645 |
12/23 |
$1,301,898 |
$2,089,833 |
$1,989,860 |
$1,060,753 |
1/24 |
$1,296,167 |
$2,114,912 |
$2,001,525 |
$1,057,840 |
2/24 |
$1,311,449 |
$2,204,579 |
$2,087,417 |
$1,042,894 |
3/24 |
$1,335,329 |
$2,275,423 |
$2,152,955 |
$1,052,524 |
4/24 |
$1,302,853 |
$2,190,903 |
$2,081,923 |
$1,025,939 |
5/24 |
$1,341,060 |
$2,288,731 |
$2,166,477 |
$1,043,332 |
6/24 |
$1,358,253 |
$2,335,302 |
$2,214,729 |
$1,053,210 |
7/24 |
$1,391,684 |
$2,376,456 |
$2,250,447 |
$1,077,810 |
8/24 |
$1,410,787 |
$2,439,267 |
$2,307,601 |
$1,093,298 |
9/24 |
$1,429,891 |
$2,483,939 |
$2,361,209 |
$1,107,936 |
10/24 |
$1,401,236 |
$2,434,666 |
$2,308,207 |
$1,080,461 |
11/24 |
$1,433,711 |
$2,546,384 |
$2,394,543 |
$1,091,884 |
12/24 |
$1,401,904 |
$2,480,024 |
$2,337,860 |
$1,074,015 |
1/25 |
$1,421,456 |
$2,567,540 |
$2,416,333 |
$1,079,713 |
2/25 |
$1,426,344 |
$2,549,061 |
$2,401,776 |
$1,103,468 |
3/25 |
$1,398,971 |
$2,435,576 |
$2,306,894 |
$1,103,883 |
4/25 |
$1,411,680 |
$2,457,221 |
$2,328,410 |
$1,108,222 |
5/25 |
$1,440,031 |
$2,602,668 |
$2,462,244 |
$1,100,287 |
6/25 |
$1,477,180 |
$2,714,981 |
$2,572,802 |
$1,117,205 |
7/25 |
$1,477,180 |
$2,749,930 |
$2,607,694 |
$1,114,258 |
8/25 |
$1,499,665 |
$2,821,663 |
$2,672,080 |
$1,127,585 |
9/25 |
$1,537,793 |
$2,912,368 |
$2,768,921 |
$1,139,886 |
10/25 |
$1,564,188 |
$2,970,689 |
$2,830,851 |
$1,147,008 |
11/25 |
$1,570,054 |
$2,979,081 |
$2,830,536 |
$1,154,135 |
12/25 |
$1,582,680 |
$3,003,162 |
$2,860,077 |
$1,152,428 |
1/26 |
$1,621,870 |
$3,070,370 |
$2,944,863 |
$1,153,658 |
2/26 |
$1,640,962 |
$3,092,861 |
$2,982,721 |
$1,172,551 |
3/26 |
$1,554,543 |
$2,895,861 |
$2,768,510 |
$1,151,886 |
4/26 |
$1,654,026 |
$3,173,627 |
$3,050,166 |
$1,153,181 |
5/26 |
$1,700,250 |
$3,318,094 |
$3,207,544 |
$1,156,768 |
6/26 |
$1,706,279 |
$3,294,285 |
$3,181,815 |
$1,159,558 |
7/26 |
$1,685,177 |
$3,311,191 |
$3,184,249 |
$1,144,450 |
8/26 |
$1,714,318 |
$3,396,519 |
$3,269,271 |
$1,148,905 | |
|
| Average Annual Return [Table Text Block] |
Average Annual Total Returns (%)Footnote Reference1
Table Summary
Fund |
1 Year |
5 Years |
10 Years |
Class I |
14.31% |
3.83% |
5.53% |
MSCI World Index (net of foreign withholding taxes) |
20.37% |
11.20% |
13.00% |
MSCI ACWI Index (net of foreign withholding taxes) |
22.35% |
10.88% |
12.57% |
Bloomberg U.S. Aggregate Bond Index |
1.89% |
(0.29)% |
1.40% |
Blended Index (60% MSCI ACWI Index/40% Bloomberg U.S. Aggregate Bond Index) |
13.95% |
6.45% |
8.20% |
| Footnote |
Description |
Footnote1 |
Performance prior to August 18, 2025 reflects the Fund’s performance under its former principal investment strategies and is that of the Fund’s former investment sub-adviser. | Performance does not reflect the deduction of taxes that a shareholder would pay on Fund distributions or redemption of Fund shares. Performance assumes that all dividends and distributions, if any, were reinvested. For more recent performance information, visit www.eatonvance.com/performance.php. THE FUND'S PAST PERFORMANCE IS NO GUARANTEE OF FUTURE RESULTS. |
|
| No Deduction of Taxes [Text Block] |
Performance does not reflect the deduction of taxes that a shareholder would pay on Fund distributions or redemption of Fund shares.
|
|
| Material Change Date |
|
Aug. 31, 2025
|
| Updated Performance Information Location [Text Block] |
For more recent performance information, visit www.eatonvance.com/performance.php.
|
|
| AssetsNet |
$ 206,898,592
|
|
| Holdings Count | Holding |
232
|
|
| Advisory Fees Paid, Amount |
$ 1,310,691
|
|
| InvestmentCompanyPortfolioTurnover |
107.00%
|
|
| Additional Fund Statistics [Text Block] |
Table Summary
Total Net Assets |
$206,898,592 |
# of Portfolio Holdings |
232 |
Portfolio Turnover Rate |
107% |
Total Advisory Fees Paid |
$1,310,691 | |
|
| Holdings [Text Block] |
Asset Allocation (% of total investments)
Table Summary
Value |
Value |
Sovereign Government Bonds |
3.1% |
Short-Term Investments |
4.4% |
Exchange-Traded Funds |
37.2% |
Common Stocks |
55.3% | |
|
| Largest Holdings [Text Block] |
Top Ten Holdings (% of total investments)Footnote Referencea
Table Summary
Eaton Vance Total Return Bond ETF |
11.0% |
Eaton Vance Mortgage Opportunities ETF |
8.6% |
Vanguard Emerging Markets Government Bond ETF |
5.0% |
iShares Core MSCI Emerging Markets ETF |
5.0% |
iShares TIPS Bond ETF |
3.5% |
NVIDIA Corp. |
3.2% |
Brazil Letras do Tesouro Nacional, 0.00%, 1/1/29 |
3.1% |
Microsoft Corp. |
2.5% |
Apple, Inc. |
2.4% |
Amazon.com, Inc. |
1.7% |
Total |
46.0% |
| Footnote |
Description |
Footnotea |
Excluding cash equivalents | |
|
| Material Fund Change [Text Block] |
This is a summary of certain changes to the Fund since August 31, 2025. For more complete information, you may review the Fund’s next prospectus, which we expect to be available by January 1, 2027 at www.eatonvance.com/open-end-mutual-fund-documents.php or upon request by contacting us at 1-800-262-1122. The net expense ratio decreased from the prior fiscal year primarily because the reduction in the investment adviser and administration fee and the agreement to reimburse the Fund’s expenses, both effective August 18, 2025, were in effect throughout the current fiscal year. The decrease also reflected a reduction in the investment adviser and administration fee due to the Fund’s investments in affiliated funds. |
|
| Material Fund Change Expenses [Text Block] |
The net expense ratio decreased from the prior fiscal year primarily because the reduction in the investment adviser and administration fee and the agreement to reimburse the Fund’s expenses, both effective August 18, 2025, were in effect throughout the current fiscal year. The decrease also reflected a reduction in the investment adviser and administration fee due to the Fund’s investments in affiliated funds.
|
|
| Summary of Change Legend [Text Block] |
This is a summary of certain changes to the Fund since August 31, 2025. For more complete information, you may review the Fund’s next prospectus, which we expect to be available by January 1, 2027 at www.eatonvance.com/open-end-mutual-fund-documents.php or upon request by contacting us at 1-800-262-1122.
|
|
| Updated Prospectus Phone Number |
1-800-262-1122
|
|
| C000092730 |
|
|
| Shareholder Report [Line Items] |
|
|
| Fund Name |
Eaton Vance Equity Strategy Fund
|
|
| Class Name |
Class A
|
|
| Trading Symbol |
ERBAX
|
|
| Annual or Semi-Annual Statement [Text Block] |
This annual shareholder report contains important information about the Eaton Vance Equity Strategy Fund for the period of September 1, 2025 to August 31, 2026.
|
|
| Additional Information [Text Block] |
You can find additional information about the Fund at www.eatonvance.com/open-end-mutual-fund-documents.php. You can also request this information by contacting us at 1-800-262-1122.
|
|
| Material Fund Change Notice [Text Block] |
This report describes changes to the Fund that occurred during the reporting period.
|
|
| Additional Information Phone Number |
1-800-262-1122
|
|
| Additional Information Website |
<span style="box-sizing: border-box; color: rgb(0, 0, 0); display: inline; flex-wrap: nowrap; font-size: 10.6667px; font-weight: 400; grid-area: auto; line-height: 16px; margin: 0px; overflow: visible; text-align: left; text-align-last: auto; white-space-collapse: preserve-breaks;">www.eatonvance.com/open-end-mutual-fund-documents.php</span>
|
|
| Expenses [Text Block] |
What were the Fund costs for the last year?(based on a hypothetical $10,000 investment)
Table Summary
Class Name |
Costs of a $10,000 investment |
Costs paid as a percentage of a $10,000 investment |
Class A |
$121 |
1.10% | |
|
| Expenses Paid, Amount |
$ 121
|
|
| Expense Ratio, Percent |
1.10%
|
|
| Factors Affecting Performance [Text Block] |
How did the Fund perform last year and what affected its performance?Key contributors to (↑) and detractors from (↓) performance, relative to the MSCI ACWI Index (the Index): ↓ Security selection in the global equities basket detracted from returns during the period ↓ Exposure to Brazil and India equity markets also detracted from performance ↓ Exposure to China equity markets modestly detracted from performance ↑ Exposure to core emerging markets contributed to returns ↑ Exposure to Taiwan and South Korea equities also contributed to returns ↑ Exposure to S&P 500 stocks basket also added to returns during the period |
|
| Performance Past Does Not Indicate Future [Text] |
THE FUND'S PAST PERFORMANCE IS NO GUARANTEE OF FUTURE RESULTS.
|
|
| Line Graph [Table Text Block] |
Comparison of the change in value of a $10,000 investment for the period indicated.
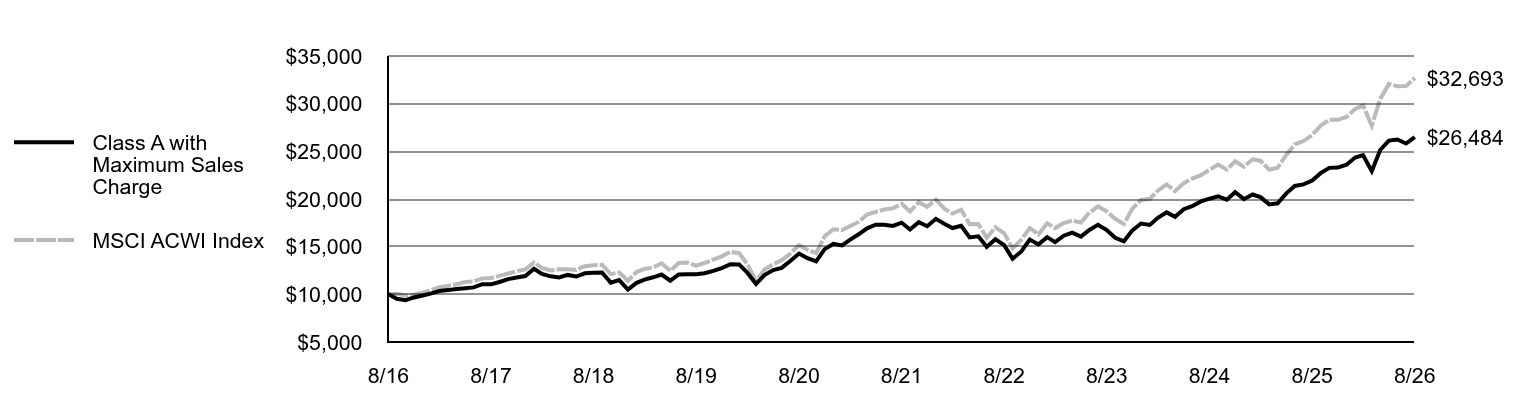
Table Summary
|
Class A with Maximum Sales Charge |
MSCI ACWI Index |
8/16 |
$10,000 |
$10,000 |
9/16 |
$9,533 |
$10,061 |
10/16 |
$9,385 |
$9,891 |
11/16 |
$9,673 |
$9,966 |
12/16 |
$9,875 |
$10,181 |
1/17 |
$10,099 |
$10,459 |
2/17 |
$10,350 |
$10,753 |
3/17 |
$10,443 |
$10,884 |
4/17 |
$10,555 |
$11,054 |
5/17 |
$10,648 |
$11,298 |
6/17 |
$10,727 |
$11,349 |
7/17 |
$11,064 |
$11,667 |
8/17 |
$11,051 |
$11,711 |
9/17 |
$11,296 |
$11,938 |
10/17 |
$11,593 |
$12,185 |
11/17 |
$11,765 |
$12,421 |
12/17 |
$11,919 |
$12,622 |
1/18 |
$12,679 |
$13,334 |
2/18 |
$12,149 |
$12,774 |
3/18 |
$11,891 |
$12,500 |
4/18 |
$11,772 |
$12,620 |
5/18 |
$12,037 |
$12,635 |
6/18 |
$11,870 |
$12,567 |
7/18 |
$12,211 |
$12,946 |
8/18 |
$12,267 |
$13,048 |
9/18 |
$12,288 |
$13,104 |
10/18 |
$11,228 |
$12,122 |
11/18 |
$11,493 |
$12,300 |
12/18 |
$10,495 |
$11,433 |
1/19 |
$11,207 |
$12,336 |
2/19 |
$11,544 |
$12,666 |
3/19 |
$11,786 |
$12,825 |
4/19 |
$12,080 |
$13,258 |
5/19 |
$11,427 |
$12,472 |
6/19 |
$12,080 |
$13,289 |
7/19 |
$12,102 |
$13,327 |
8/19 |
$12,109 |
$13,011 |
9/19 |
$12,212 |
$13,285 |
10/19 |
$12,462 |
$13,649 |
11/19 |
$12,755 |
$13,982 |
12/19 |
$13,155 |
$14,474 |
1/20 |
$13,139 |
$14,314 |
2/20 |
$12,274 |
$13,158 |
3/20 |
$11,089 |
$11,382 |
4/20 |
$12,018 |
$12,601 |
5/20 |
$12,547 |
$13,149 |
6/20 |
$12,771 |
$13,569 |
7/20 |
$13,500 |
$14,287 |
8/20 |
$14,276 |
$15,161 |
9/20 |
$13,788 |
$14,672 |
10/20 |
$13,451 |
$14,316 |
11/20 |
$14,741 |
$16,080 |
12/20 |
$15,287 |
$16,827 |
1/21 |
$15,131 |
$16,751 |
2/21 |
$15,721 |
$17,139 |
3/21 |
$16,296 |
$17,596 |
4/21 |
$16,928 |
$18,366 |
5/21 |
$17,297 |
$18,651 |
6/21 |
$17,297 |
$18,897 |
7/21 |
$17,174 |
$19,027 |
8/21 |
$17,518 |
$19,504 |
9/21 |
$16,805 |
$18,698 |
10/21 |
$17,576 |
$19,652 |
11/21 |
$17,149 |
$19,179 |
12/21 |
$17,919 |
$19,946 |
1/22 |
$17,382 |
$18,967 |
2/22 |
$16,955 |
$18,477 |
3/22 |
$17,187 |
$18,877 |
4/22 |
$15,973 |
$17,366 |
5/22 |
$16,084 |
$17,386 |
6/22 |
$14,981 |
$15,921 |
7/22 |
$15,769 |
$17,033 |
8/22 |
$15,157 |
$16,406 |
9/22 |
$13,729 |
$14,835 |
10/22 |
$14,499 |
$15,730 |
11/22 |
$15,750 |
$16,950 |
12/22 |
$15,240 |
$16,283 |
1/23 |
$15,995 |
$17,451 |
2/23 |
$15,475 |
$16,950 |
3/23 |
$16,151 |
$17,473 |
4/23 |
$16,475 |
$17,724 |
5/23 |
$16,053 |
$17,534 |
6/23 |
$16,749 |
$18,552 |
7/23 |
$17,287 |
$19,232 |
8/23 |
$16,739 |
$18,694 |
9/23 |
$15,936 |
$17,921 |
10/23 |
$15,564 |
$17,382 |
11/23 |
$16,710 |
$18,987 |
12/23 |
$17,426 |
$19,899 |
1/24 |
$17,278 |
$20,015 |
2/24 |
$18,022 |
$20,874 |
3/24 |
$18,596 |
$21,530 |
4/24 |
$18,139 |
$20,819 |
5/24 |
$18,936 |
$21,665 |
6/24 |
$19,245 |
$22,147 |
7/24 |
$19,744 |
$22,504 |
8/24 |
$20,031 |
$23,076 |
9/24 |
$20,287 |
$23,612 |
10/24 |
$19,925 |
$23,082 |
11/24 |
$20,712 |
$23,945 |
12/24 |
$19,985 |
$23,379 |
1/25 |
$20,471 |
$24,163 |
2/25 |
$20,195 |
$24,018 |
3/25 |
$19,433 |
$23,069 |
4/25 |
$19,544 |
$23,284 |
5/25 |
$20,593 |
$24,622 |
6/25 |
$21,365 |
$25,728 |
7/25 |
$21,531 |
$26,077 |
8/25 |
$21,940 |
$26,721 |
9/25 |
$22,713 |
$27,689 |
10/25 |
$23,265 |
$28,309 |
11/25 |
$23,298 |
$28,305 |
12/25 |
$23,597 |
$28,601 |
1/26 |
$24,351 |
$29,449 |
2/26 |
$24,598 |
$29,827 |
3/26 |
$22,921 |
$27,685 |
4/26 |
$25,144 |
$30,502 |
5/26 |
$26,132 |
$32,075 |
6/26 |
$26,236 |
$31,818 |
7/26 |
$25,820 |
$31,842 |
8/26 |
$26,484 |
$32,693 | |
|
| Average Annual Return [Table Text Block] |
Average Annual Total Returns (%)Footnote Reference1
Table Summary
Fund |
1 Year |
5 Years |
10 Years |
Class A |
20.71% |
8.61% |
10.82% |
Class A with 5.25% Maximum Sales Charge |
14.38% |
7.45% |
10.22% |
MSCI ACWI Index (net of foreign withholding taxes) |
22.35% |
10.88% |
12.57% |
| Footnote |
Description |
Footnote1 |
Performance prior to August 18, 2025 reflects the Fund’s performance under its former principal investment strategies and is that of the Fund’s former investment sub-adviser. | Performance does not reflect the deduction of taxes that a shareholder would pay on Fund distributions or redemption of Fund shares. Performance assumes that all dividends and distributions, if any, were reinvested. For more recent performance information, visit www.eatonvance.com/performance.php. THE FUND'S PAST PERFORMANCE IS NO GUARANTEE OF FUTURE RESULTS. |
|
| No Deduction of Taxes [Text Block] |
Performance does not reflect the deduction of taxes that a shareholder would pay on Fund distributions or redemption of Fund shares.
|
|
| Material Change Date |
|
Aug. 31, 2025
|
| Updated Performance Information Location [Text Block] |
For more recent performance information, visit www.eatonvance.com/performance.php.
|
|
| AssetsNet |
$ 605,561,232
|
|
| Holdings Count | Holding |
250
|
|
| Advisory Fees Paid, Amount |
$ 3,824,222
|
|
| InvestmentCompanyPortfolioTurnover |
190.00%
|
|
| Additional Fund Statistics [Text Block] |
Table Summary
Total Net Assets |
$605,561,232 |
# of Portfolio Holdings |
250 |
Portfolio Turnover Rate |
190% |
Total Advisory Fees Paid |
$3,824,222 | |
|
| Holdings [Text Block] |
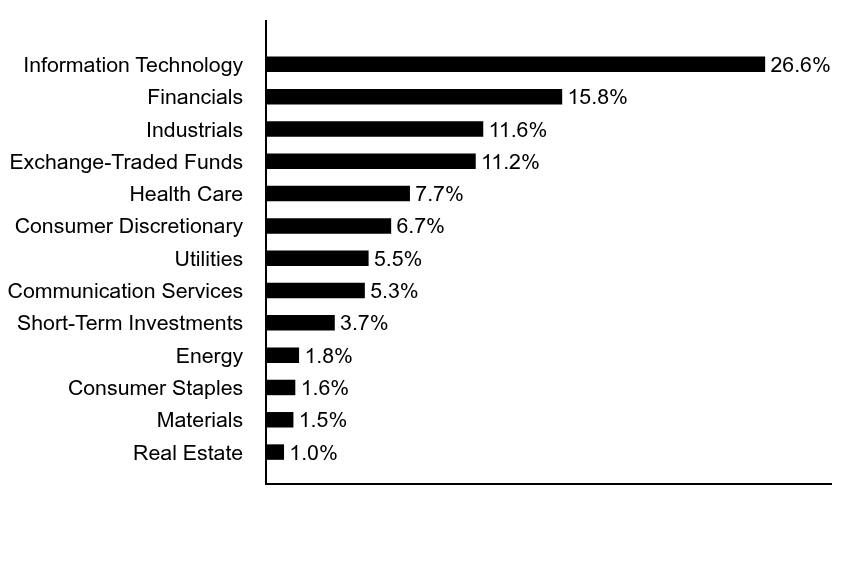
Sector Allocation (% of total investments)
Table Summary
Value |
Value |
Real Estate |
1.0% |
Materials |
1.5% |
Consumer Staples |
1.6% |
Energy |
1.8% |
Short-Term Investments |
3.7% |
Communication Services |
5.3% |
Utilities |
5.5% |
Consumer Discretionary |
6.7% |
Health Care |
7.7% |
Exchange-Traded Funds |
11.2% |
Industrials |
11.6% |
Financials |
15.8% |
Information Technology |
26.6% | |
|
| Largest Holdings [Text Block] |
Top Ten Holdings (% of total investments)Footnote Referencea
Table Summary
iShares Core MSCI Emerging Markets ETF |
4.8% |
NVIDIA Corp. |
4.8% |
Microsoft Corp. |
3.7% |
Apple, Inc. |
3.5% |
Amazon.com, Inc. |
2.5% |
Alphabet, Inc., Class A |
2.3% |
Broadcom, Inc. |
1.8% |
iShares MSCI Brazil ETF |
1.8% |
iShares MSCI Taiwan ETF |
1.6% |
Micron Technology, Inc. |
1.3% |
Total |
28.1% |
| Footnote |
Description |
Footnotea |
Excluding cash equivalents | |
|
| Material Fund Change [Text Block] |
This is a summary of certain changes to the Fund since August 31, 2025. For more complete information, you may review the Fund’s next prospectus, which we expect to be available by January 1, 2027 at www.eatonvance.com/open-end-mutual-fund-documents.php or upon request by contacting us at 1-800-262-1122. The net expense ratio decreased from the prior fiscal year primarily because the reduction in the investment adviser and administration fee and the agreement to reimburse the Fund’s expenses, both effective August 18, 2025, were in effect throughout the current fiscal year. |
|
| Material Fund Change Expenses [Text Block] |
The net expense ratio decreased from the prior fiscal year primarily because the reduction in the investment adviser and administration fee and the agreement to reimburse the Fund’s expenses, both effective August 18, 2025, were in effect throughout the current fiscal year.
|
|
| Summary of Change Legend [Text Block] |
This is a summary of certain changes to the Fund since August 31, 2025. For more complete information, you may review the Fund’s next prospectus, which we expect to be available by January 1, 2027 at www.eatonvance.com/open-end-mutual-fund-documents.php or upon request by contacting us at 1-800-262-1122.
|
|
| Updated Prospectus Phone Number |
1-800-262-1122
|
|
| C000092731 |
|
|
| Shareholder Report [Line Items] |
|
|
| Fund Name |
Eaton Vance Equity Strategy Fund
|
|
| Class Name |
Class C
|
|
| Trading Symbol |
ERBCX
|
|
| Annual or Semi-Annual Statement [Text Block] |
This annual shareholder report contains important information about the Eaton Vance Equity Strategy Fund for the period of September 1, 2025 to August 31, 2026.
|
|
| Additional Information [Text Block] |
You can find additional information about the Fund at www.eatonvance.com/open-end-mutual-fund-documents.php. You can also request this information by contacting us at 1-800-262-1122.
|
|
| Material Fund Change Notice [Text Block] |
This report describes changes to the Fund that occurred during the reporting period.
|
|
| Additional Information Phone Number |
1-800-262-1122
|
|
| Additional Information Website |
<span style="box-sizing: border-box; color: rgb(0, 0, 0); display: inline; flex-wrap: nowrap; font-size: 10.6667px; font-weight: 400; grid-area: auto; line-height: 16px; margin: 0px; overflow: visible; text-align: left; text-align-last: auto; white-space-collapse: preserve-breaks;">www.eatonvance.com/open-end-mutual-fund-documents.php</span>
|
|
| Expenses [Text Block] |
What were the Fund costs for the last year?(based on a hypothetical $10,000 investment)
Table Summary
Class Name |
Costs of a $10,000 investment |
Costs paid as a percentage of a $10,000 investment |
Class C |
$203 |
1.85% | |
|
| Expenses Paid, Amount |
$ 203
|
|
| Expense Ratio, Percent |
1.85%
|
|
| Factors Affecting Performance [Text Block] |
How did the Fund perform last year and what affected its performance?Key contributors to (↑) and detractors from (↓) performance, relative to the MSCI ACWI Index (the Index): ↓ Security selection in the global equities basket detracted from returns during the period ↓ Exposure to Brazil and India equity markets also detracted from performance ↓ Exposure to China equity markets modestly detracted from performance ↑ Exposure to core emerging markets contributed to returns ↑ Exposure to Taiwan and South Korea equities also contributed to returns ↑ Exposure to S&P 500 stocks basket also added to returns during the period |
|
| Performance Past Does Not Indicate Future [Text] |
THE FUND'S PAST PERFORMANCE IS NO GUARANTEE OF FUTURE RESULTS.
|
|
| Line Graph [Table Text Block] |
Comparison of the change in value of a $10,000 investment for the period indicated.
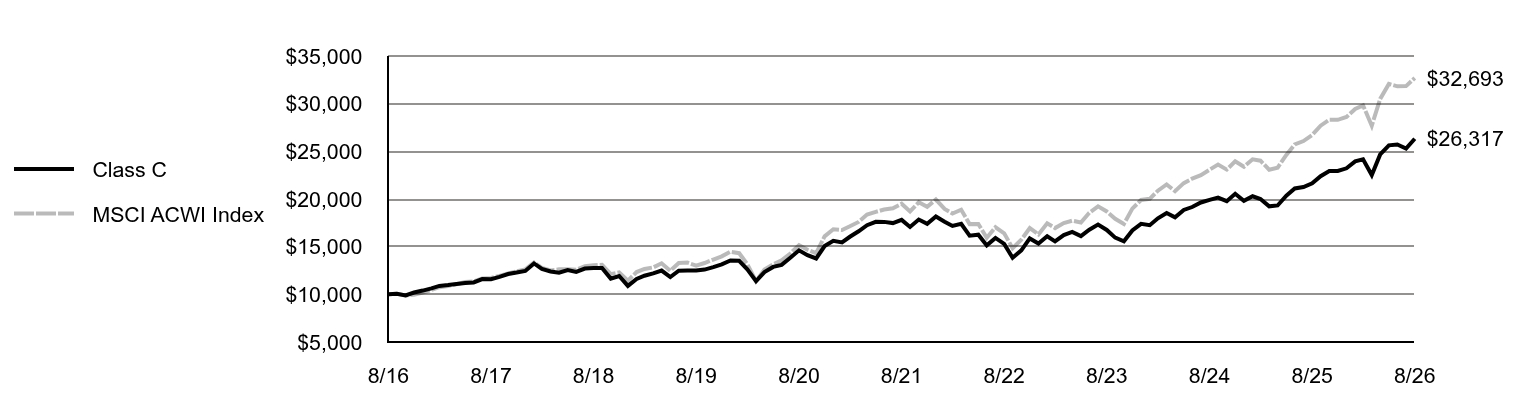
Table Summary
|
Class C |
MSCI ACWI Index |
8/16 |
$10,000 |
$10,000 |
9/16 |
$10,055 |
$10,061 |
10/16 |
$9,890 |
$9,891 |
11/16 |
$10,192 |
$9,966 |
12/16 |
$10,394 |
$10,181 |
1/17 |
$10,626 |
$10,459 |
2/17 |
$10,886 |
$10,753 |
3/17 |
$10,977 |
$10,884 |
4/17 |
$11,089 |
$11,054 |
5/17 |
$11,180 |
$11,298 |
6/17 |
$11,251 |
$11,349 |
7/17 |
$11,601 |
$11,667 |
8/17 |
$11,580 |
$11,711 |
9/17 |
$11,826 |
$11,938 |
10/17 |
$12,128 |
$12,185 |
11/17 |
$12,296 |
$12,421 |
12/17 |
$12,455 |
$12,622 |
1/18 |
$13,241 |
$13,334 |
2/18 |
$12,675 |
$12,774 |
3/18 |
$12,403 |
$12,500 |
4/18 |
$12,271 |
$12,620 |
5/18 |
$12,536 |
$12,635 |
6/18 |
$12,352 |
$12,567 |
7/18 |
$12,705 |
$12,946 |
8/18 |
$12,756 |
$13,048 |
9/18 |
$12,764 |
$13,104 |
10/18 |
$11,653 |
$12,122 |
11/18 |
$11,925 |
$12,300 |
12/18 |
$10,884 |
$11,433 |
1/19 |
$11,609 |
$12,336 |
2/19 |
$11,955 |
$12,666 |
3/19 |
$12,202 |
$12,825 |
4/19 |
$12,495 |
$13,258 |
5/19 |
$11,809 |
$12,472 |
6/19 |
$12,480 |
$13,289 |
7/19 |
$12,495 |
$13,327 |
8/19 |
$12,495 |
$13,011 |
9/19 |
$12,595 |
$13,285 |
10/19 |
$12,850 |
$13,649 |
11/19 |
$13,135 |
$13,982 |
12/19 |
$13,546 |
$14,474 |
1/20 |
$13,520 |
$14,314 |
2/20 |
$12,619 |
$13,158 |
3/20 |
$11,391 |
$11,382 |
4/20 |
$12,335 |
$12,601 |
5/20 |
$12,877 |
$13,149 |
6/20 |
$13,095 |
$13,569 |
7/20 |
$13,838 |
$14,287 |
8/20 |
$14,614 |
$15,161 |
9/20 |
$14,113 |
$14,672 |
10/20 |
$13,763 |
$14,316 |
11/20 |
$15,065 |
$16,080 |
12/20 |
$15,614 |
$16,827 |
1/21 |
$15,452 |
$16,751 |
2/21 |
$16,040 |
$17,139 |
3/21 |
$16,611 |
$17,596 |
4/21 |
$17,250 |
$18,366 |
5/21 |
$17,608 |
$18,651 |
6/21 |
$17,600 |
$18,897 |
7/21 |
$17,472 |
$19,027 |
8/21 |
$17,813 |
$19,504 |
9/21 |
$17,071 |
$18,698 |
10/21 |
$17,847 |
$19,652 |
11/21 |
$17,395 |
$19,179 |
12/21 |
$18,167 |
$19,946 |
1/22 |
$17,613 |
$18,967 |
2/22 |
$17,172 |
$18,477 |
3/22 |
$17,393 |
$18,877 |
4/22 |
$16,158 |
$17,366 |
5/22 |
$16,254 |
$17,386 |
6/22 |
$15,135 |
$15,921 |
7/22 |
$15,919 |
$17,033 |
8/22 |
$15,288 |
$16,406 |
9/22 |
$13,843 |
$14,835 |
10/22 |
$14,609 |
$15,730 |
11/22 |
$15,862 |
$16,950 |
12/22 |
$15,335 |
$16,283 |
1/23 |
$16,090 |
$17,451 |
2/23 |
$15,556 |
$16,950 |
3/23 |
$16,220 |
$17,473 |
4/23 |
$16,542 |
$17,724 |
5/23 |
$16,110 |
$17,534 |
6/23 |
$16,784 |
$18,552 |
7/23 |
$17,317 |
$19,232 |
8/23 |
$16,754 |
$18,694 |
9/23 |
$15,949 |
$17,921 |
10/23 |
$15,566 |
$17,382 |
11/23 |
$16,703 |
$18,987 |
12/23 |
$17,400 |
$19,899 |
1/24 |
$17,248 |
$20,015 |
2/24 |
$17,975 |
$20,874 |
3/24 |
$18,539 |
$21,530 |
4/24 |
$18,073 |
$20,819 |
5/24 |
$18,854 |
$21,665 |
6/24 |
$19,158 |
$22,147 |
7/24 |
$19,635 |
$22,504 |
8/24 |
$19,906 |
$23,076 |
9/24 |
$20,145 |
$23,612 |
10/24 |
$19,776 |
$23,082 |
11/24 |
$20,546 |
$23,945 |
12/24 |
$19,815 |
$23,379 |
1/25 |
$20,285 |
$24,163 |
2/25 |
$19,994 |
$24,018 |
3/25 |
$19,232 |
$23,069 |
4/25 |
$19,322 |
$23,284 |
5/25 |
$20,353 |
$24,622 |
6/25 |
$21,103 |
$25,728 |
7/25 |
$21,249 |
$26,077 |
8/25 |
$21,641 |
$26,721 |
9/25 |
$22,391 |
$27,689 |
10/25 |
$22,929 |
$28,309 |
11/25 |
$22,940 |
$28,305 |
12/25 |
$23,221 |
$28,601 |
1/26 |
$23,944 |
$29,449 |
2/26 |
$24,167 |
$29,827 |
3/26 |
$22,512 |
$27,685 |
4/26 |
$24,679 |
$30,502 |
5/26 |
$25,625 |
$32,075 |
6/26 |
$25,717 |
$31,818 |
7/26 |
$25,297 |
$31,842 |
8/26 |
$26,317 |
$32,693 | |
|
| Average Annual Return [Table Text Block] |
Average Annual Total Returns (%)Footnote Reference1
Table Summary
Fund |
1 Year |
5 Years |
10 Years |
Class C, with conversion to Class A after 8 years |
19.81% |
7.79% |
10.15% |
Class C, with 1% Maximum Contingent Deferred Sales Charge and conversion to Class A after 8 years |
18.81% |
7.79% |
10.15% |
MSCI ACWI Index (net of foreign withholding taxes) |
22.35% |
10.88% |
12.57% |
| Footnote |
Description |
Footnote1 |
Performance prior to August 18, 2025 reflects the Fund’s performance under its former principal investment strategies and is that of the Fund’s former investment sub-adviser. | Performance does not reflect the deduction of taxes that a shareholder would pay on Fund distributions or redemption of Fund shares. Performance assumes that all dividends and distributions, if any, were reinvested. For more recent performance information, visit www.eatonvance.com/performance.php. THE FUND'S PAST PERFORMANCE IS NO GUARANTEE OF FUTURE RESULTS. |
|
| No Deduction of Taxes [Text Block] |
Performance does not reflect the deduction of taxes that a shareholder would pay on Fund distributions or redemption of Fund shares.
|
|
| Material Change Date |
|
Aug. 31, 2025
|
| Updated Performance Information Location [Text Block] |
For more recent performance information, visit www.eatonvance.com/performance.php.
|
|
| AssetsNet |
$ 605,561,232
|
|
| Holdings Count | Holding |
250
|
|
| Advisory Fees Paid, Amount |
$ 3,824,222
|
|
| InvestmentCompanyPortfolioTurnover |
190.00%
|
|
| Additional Fund Statistics [Text Block] |
Table Summary
Total Net Assets |
$605,561,232 |
# of Portfolio Holdings |
250 |
Portfolio Turnover Rate |
190% |
Total Advisory Fees Paid |
$3,824,222 | |
|
| Holdings [Text Block] |
Sector Allocation (% of total investments)
Table Summary
Value |
Value |
Real Estate |
1.0% |
Materials |
1.5% |
Consumer Staples |
1.6% |
Energy |
1.8% |
Short-Term Investments |
3.7% |
Communication Services |
5.3% |
Utilities |
5.5% |
Consumer Discretionary |
6.7% |
Health Care |
7.7% |
Exchange-Traded Funds |
11.2% |
Industrials |
11.6% |
Financials |
15.8% |
Information Technology |
26.6% | |
|
| Largest Holdings [Text Block] |
Top Ten Holdings (% of total investments)Footnote Referencea
Table Summary
iShares Core MSCI Emerging Markets ETF |
4.8% |
NVIDIA Corp. |
4.8% |
Microsoft Corp. |
3.7% |
Apple, Inc. |
3.5% |
Amazon.com, Inc. |
2.5% |
Alphabet, Inc., Class A |
2.3% |
Broadcom, Inc. |
1.8% |
iShares MSCI Brazil ETF |
1.8% |
iShares MSCI Taiwan ETF |
1.6% |
Micron Technology, Inc. |
1.3% |
Total |
28.1% |
| Footnote |
Description |
Footnotea |
Excluding cash equivalents | |
|
| Material Fund Change [Text Block] |
This is a summary of certain changes to the Fund since August 31, 2025. For more complete information, you may review the Fund’s next prospectus, which we expect to be available by January 1, 2027 at www.eatonvance.com/open-end-mutual-fund-documents.php or upon request by contacting us at 1-800-262-1122. The net expense ratio decreased from the prior fiscal year primarily because the reduction in the investment adviser and administration fee and the agreement to reimburse the Fund’s expenses, both effective August 18, 2025, were in effect throughout the current fiscal year. |
|
| Material Fund Change Expenses [Text Block] |
The net expense ratio decreased from the prior fiscal year primarily because the reduction in the investment adviser and administration fee and the agreement to reimburse the Fund’s expenses, both effective August 18, 2025, were in effect throughout the current fiscal year.
|
|
| Summary of Change Legend [Text Block] |
This is a summary of certain changes to the Fund since August 31, 2025. For more complete information, you may review the Fund’s next prospectus, which we expect to be available by January 1, 2027 at www.eatonvance.com/open-end-mutual-fund-documents.php or upon request by contacting us at 1-800-262-1122.
|
|
| Updated Prospectus Phone Number |
1-800-262-1122
|
|
| C000092732 |
|
|
| Shareholder Report [Line Items] |
|
|
| Fund Name |
Eaton Vance Equity Strategy Fund
|
|
| Class Name |
Class I
|
|
| Trading Symbol |
ERBIX
|
|
| Annual or Semi-Annual Statement [Text Block] |
This annual shareholder report contains important information about the Eaton Vance Equity Strategy Fund for the period of September 1, 2025 to August 31, 2026.
|
|
| Additional Information [Text Block] |
You can find additional information about the Fund at www.eatonvance.com/open-end-mutual-fund-documents.php. You can also request this information by contacting us at 1-800-262-1122.
|
|
| Material Fund Change Notice [Text Block] |
This report describes changes to the Fund that occurred during the reporting period.
|
|
| Additional Information Phone Number |
1-800-262-1122
|
|
| Additional Information Website |
<span style="box-sizing: border-box; color: rgb(0, 0, 0); display: inline; flex-wrap: nowrap; font-size: 10.6667px; font-weight: 400; grid-area: auto; line-height: 16px; margin: 0px; overflow: visible; text-align: left; text-align-last: auto; white-space-collapse: preserve-breaks;">www.eatonvance.com/open-end-mutual-fund-documents.php</span>
|
|
| Expenses [Text Block] |
What were the Fund costs for the last year?(based on a hypothetical $10,000 investment)
Table Summary
Class Name |
Costs of a $10,000 investment |
Costs paid as a percentage of a $10,000 investment |
Class I |
$94 |
0.85% | |
|
| Expenses Paid, Amount |
$ 94
|
|
| Expense Ratio, Percent |
0.85%
|
|
| Factors Affecting Performance [Text Block] |
How did the Fund perform last year and what affected its performance?Key contributors to (↑) and detractors from (↓) performance, relative to the MSCI ACWI Index (the Index): ↓ Security selection in the global equities basket detracted from returns during the period ↓ Exposure to Brazil and India equity markets also detracted from performance ↓ Exposure to China equity markets modestly detracted from performance ↑ Exposure to core emerging markets contributed to returns ↑ Exposure to Taiwan and South Korea equities also contributed to returns ↑ Exposure to S&P 500 stocks basket also added to returns during the period |
|
| Performance Past Does Not Indicate Future [Text] |
THE FUND'S PAST PERFORMANCE IS NO GUARANTEE OF FUTURE RESULTS.
|
|
| Line Graph [Table Text Block] |
Comparison of the change in value of a $1,000,000 investment for the period indicated.
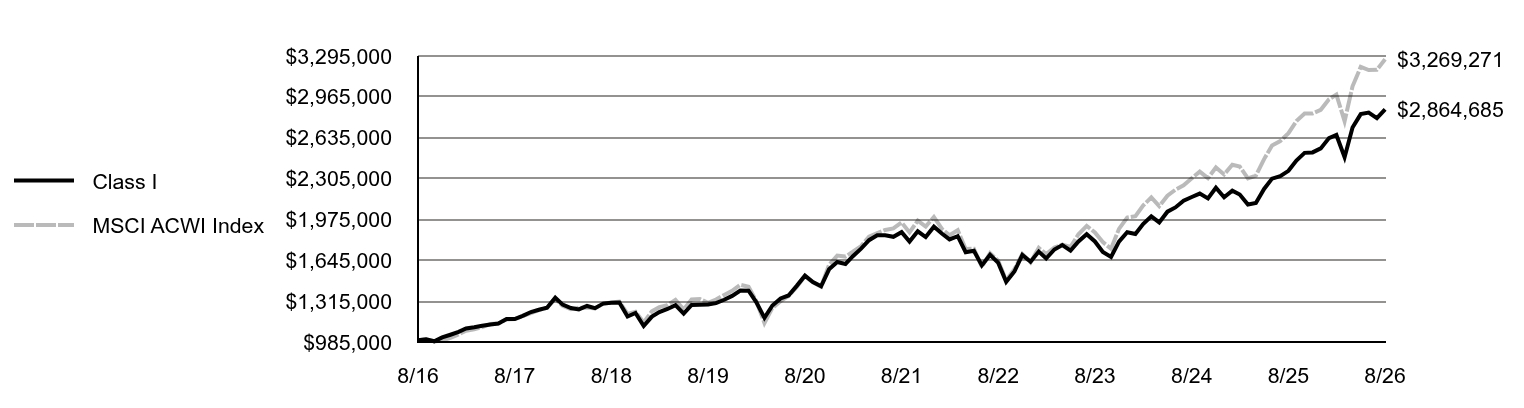
Table Summary
|
Class I |
MSCI ACWI Index |
8/16 |
$1,000,000 |
$1,000,000 |
9/16 |
$1,006,065 |
$1,006,129 |
10/16 |
$990,566 |
$989,052 |
11/16 |
$1,021,563 |
$996,568 |
12/16 |
$1,043,527 |
$1,018,096 |
1/17 |
$1,066,561 |
$1,045,934 |
2/17 |
$1,093,784 |
$1,075,274 |
3/17 |
$1,103,556 |
$1,088,428 |
4/17 |
$1,116,120 |
$1,105,391 |
5/17 |
$1,126,590 |
$1,129,801 |
6/17 |
$1,134,269 |
$1,134,939 |
7/17 |
$1,170,565 |
$1,166,656 |
8/17 |
$1,169,867 |
$1,171,126 |
9/17 |
$1,195,694 |
$1,193,752 |
10/17 |
$1,227,104 |
$1,218,541 |
11/17 |
$1,245,252 |
$1,242,130 |
12/17 |
$1,261,858 |
$1,262,155 |
1/18 |
$1,343,078 |
$1,333,361 |
2/18 |
$1,286,962 |
$1,277,362 |
3/18 |
$1,259,643 |
$1,250,018 |
4/18 |
$1,247,829 |
$1,261,955 |
5/18 |
$1,275,887 |
$1,263,531 |
6/18 |
$1,258,166 |
$1,256,688 |
7/18 |
$1,295,084 |
$1,294,586 |
8/18 |
$1,301,730 |
$1,304,757 |
9/18 |
$1,303,206 |
$1,310,435 |
10/18 |
$1,190,975 |
$1,212,233 |
11/18 |
$1,219,772 |
$1,229,962 |
12/18 |
$1,114,141 |
$1,143,330 |
1/19 |
$1,189,715 |
$1,233,607 |
2/19 |
$1,226,334 |
$1,266,603 |
3/19 |
$1,252,045 |
$1,282,532 |
4/19 |
$1,283,210 |
$1,325,837 |
5/19 |
$1,213,868 |
$1,247,190 |
6/19 |
$1,283,989 |
$1,328,855 |
7/19 |
$1,286,326 |
$1,332,749 |
8/19 |
$1,287,884 |
$1,301,133 |
9/19 |
$1,298,792 |
$1,328,511 |
10/19 |
$1,326,061 |
$1,364,871 |
11/19 |
$1,357,226 |
$1,398,189 |
12/19 |
$1,400,109 |
$1,447,427 |
1/20 |
$1,399,257 |
$1,431,439 |
2/20 |
$1,307,223 |
$1,315,822 |
3/20 |
$1,180,250 |
$1,138,181 |
4/20 |
$1,279,953 |
$1,260,109 |
5/20 |
$1,337,049 |
$1,314,912 |
6/20 |
$1,360,909 |
$1,356,927 |
7/20 |
$1,438,456 |
$1,428,691 |
8/20 |
$1,521,116 |
$1,516,134 |
9/20 |
$1,469,986 |
$1,467,249 |
10/20 |
$1,435,048 |
$1,431,582 |
11/20 |
$1,572,246 |
$1,608,043 |
12/20 |
$1,630,816 |
$1,682,704 |
1/21 |
$1,615,068 |
$1,675,051 |
2/21 |
$1,678,061 |
$1,713,851 |
3/21 |
$1,739,304 |
$1,759,627 |
4/21 |
$1,807,546 |
$1,836,562 |
5/21 |
$1,846,917 |
$1,865,143 |
6/21 |
$1,847,792 |
$1,889,724 |
7/21 |
$1,834,668 |
$1,902,743 |
8/21 |
$1,872,289 |
$1,950,367 |
9/21 |
$1,796,172 |
$1,869,798 |
10/21 |
$1,879,288 |
$1,965,239 |
11/21 |
$1,832,918 |
$1,917,915 |
12/21 |
$1,916,047 |
$1,994,633 |
1/22 |
$1,859,576 |
$1,896,671 |
2/22 |
$1,814,003 |
$1,847,686 |
3/22 |
$1,839,761 |
$1,887,705 |
4/22 |
$1,709,978 |
$1,736,609 |
5/22 |
$1,721,866 |
$1,738,642 |
6/22 |
$1,603,971 |
$1,592,081 |
7/22 |
$1,689,172 |
$1,703,260 |
8/22 |
$1,623,785 |
$1,640,554 |
9/22 |
$1,471,215 |
$1,483,505 |
10/22 |
$1,554,435 |
$1,573,030 |
11/22 |
$1,688,182 |
$1,695,040 |
12/22 |
$1,633,368 |
$1,628,338 |
1/23 |
$1,715,246 |
$1,745,053 |
2/23 |
$1,659,611 |
$1,695,039 |
3/23 |
$1,732,041 |
$1,747,302 |
4/23 |
$1,767,732 |
$1,772,415 |
5/23 |
$1,723,644 |
$1,753,431 |
6/23 |
$1,797,124 |
$1,855,237 |
7/23 |
$1,855,909 |
$1,923,154 |
8/23 |
$1,797,124 |
$1,869,413 |
9/23 |
$1,712,097 |
$1,792,112 |
10/23 |
$1,672,207 |
$1,738,228 |
11/23 |
$1,796,075 |
$1,898,660 |
12/23 |
$1,872,026 |
$1,989,860 |
1/24 |
$1,857,178 |
$2,001,525 |
2/24 |
$1,937,130 |
$2,087,417 |
3/24 |
$1,999,950 |
$2,152,955 |
4/24 |
$1,950,836 |
$2,081,923 |
5/24 |
$2,037,641 |
$2,166,477 |
6/24 |
$2,071,907 |
$2,214,729 |
7/24 |
$2,125,589 |
$2,250,447 |
8/24 |
$2,156,428 |
$2,307,601 |
9/24 |
$2,183,840 |
$2,361,209 |
10/24 |
$2,145,006 |
$2,308,207 |
11/24 |
$2,230,669 |
$2,394,543 |
12/24 |
$2,153,543 |
$2,337,860 |
1/25 |
$2,207,055 |
$2,416,333 |
2/25 |
$2,176,137 |
$2,401,776 |
3/25 |
$2,095,275 |
$2,306,894 |
4/25 |
$2,107,166 |
$2,328,410 |
5/25 |
$2,221,324 |
$2,462,244 |
6/25 |
$2,304,564 |
$2,572,802 |
7/25 |
$2,323,591 |
$2,607,694 |
8/25 |
$2,367,589 |
$2,672,080 |
9/25 |
$2,450,829 |
$2,768,921 |
10/25 |
$2,512,665 |
$2,830,851 |
11/25 |
$2,516,232 |
$2,830,536 |
12/25 |
$2,548,882 |
$2,860,077 |
1/26 |
$2,631,693 |
$2,944,863 |
2/26 |
$2,656,957 |
$2,982,721 |
3/26 |
$2,477,300 |
$2,768,510 |
4/26 |
$2,717,311 |
$3,050,166 |
5/26 |
$2,825,385 |
$3,207,544 |
6/26 |
$2,838,018 |
$3,181,815 |
7/26 |
$2,793,103 |
$3,184,249 |
8/26 |
$2,864,685 |
$3,269,271 | |
|
| Average Annual Return [Table Text Block] |
Average Annual Total Returns (%)Footnote Reference1
Table Summary
Fund |
1 Year |
5 Years |
10 Years |
Class I |
21.00% |
8.87% |
11.09% |
MSCI ACWI Index (net of foreign withholding taxes) |
22.35% |
10.88% |
12.57% |
| Footnote |
Description |
Footnote1 |
Performance prior to August 18, 2025 reflects the Fund’s performance under its former principal investment strategies and is that of the Fund’s former investment sub-adviser. | Performance does not reflect the deduction of taxes that a shareholder would pay on Fund distributions or redemption of Fund shares. Performance assumes that all dividends and distributions, if any, were reinvested. For more recent performance information, visit www.eatonvance.com/performance.php. THE FUND'S PAST PERFORMANCE IS NO GUARANTEE OF FUTURE RESULTS. |
|
| No Deduction of Taxes [Text Block] |
Performance does not reflect the deduction of taxes that a shareholder would pay on Fund distributions or redemption of Fund shares.
|
|
| Material Change Date |
|
Aug. 31, 2025
|
| Updated Performance Information Location [Text Block] |
For more recent performance information, visit www.eatonvance.com/performance.php.
|
|
| AssetsNet |
$ 605,561,232
|
|
| Holdings Count | Holding |
250
|
|
| Advisory Fees Paid, Amount |
$ 3,824,222
|
|
| InvestmentCompanyPortfolioTurnover |
190.00%
|
|
| Additional Fund Statistics [Text Block] |
Table Summary
Total Net Assets |
$605,561,232 |
# of Portfolio Holdings |
250 |
Portfolio Turnover Rate |
190% |
Total Advisory Fees Paid |
$3,824,222 | |
|
| Holdings [Text Block] |
Sector Allocation (% of total investments)
Table Summary
Value |
Value |
Real Estate |
1.0% |
Materials |
1.5% |
Consumer Staples |
1.6% |
Energy |
1.8% |
Short-Term Investments |
3.7% |
Communication Services |
5.3% |
Utilities |
5.5% |
Consumer Discretionary |
6.7% |
Health Care |
7.7% |
Exchange-Traded Funds |
11.2% |
Industrials |
11.6% |
Financials |
15.8% |
Information Technology |
26.6% | |
|
| Largest Holdings [Text Block] |
Top Ten Holdings (% of total investments)Footnote Referencea
Table Summary
iShares Core MSCI Emerging Markets ETF |
4.8% |
NVIDIA Corp. |
4.8% |
Microsoft Corp. |
3.7% |
Apple, Inc. |
3.5% |
Amazon.com, Inc. |
2.5% |
Alphabet, Inc., Class A |
2.3% |
Broadcom, Inc. |
1.8% |
iShares MSCI Brazil ETF |
1.8% |
iShares MSCI Taiwan ETF |
1.6% |
Micron Technology, Inc. |
1.3% |
Total |
28.1% |
| Footnote |
Description |
Footnotea |
Excluding cash equivalents | |
|
| Material Fund Change [Text Block] |
This is a summary of certain changes to the Fund since August 31, 2025. For more complete information, you may review the Fund’s next prospectus, which we expect to be available by January 1, 2027 at www.eatonvance.com/open-end-mutual-fund-documents.php or upon request by contacting us at 1-800-262-1122. The net expense ratio decreased from the prior fiscal year primarily because the reduction in the investment adviser and administration fee and the agreement to reimburse the Fund’s expenses, both effective August 18, 2025, were in effect throughout the current fiscal year. |
|
| Material Fund Change Expenses [Text Block] |
The net expense ratio decreased from the prior fiscal year primarily because the reduction in the investment adviser and administration fee and the agreement to reimburse the Fund’s expenses, both effective August 18, 2025, were in effect throughout the current fiscal year.
|
|
| Summary of Change Legend [Text Block] |
This is a summary of certain changes to the Fund since August 31, 2025. For more complete information, you may review the Fund’s next prospectus, which we expect to be available by January 1, 2027 at www.eatonvance.com/open-end-mutual-fund-documents.php or upon request by contacting us at 1-800-262-1122.
|
|
| Updated Prospectus Phone Number |
1-800-262-1122
|
|
| C000014185 |
|
|
| Shareholder Report [Line Items] |
|
|
| Fund Name |
Eaton Vance China Equity Fund
|
|
| Class Name |
Class A
|
|
| Trading Symbol |
EVCGX
|
|
| Annual or Semi-Annual Statement [Text Block] |
This annual shareholder report contains important information about the Eaton Vance China Equity Fund for the period of September 1, 2025 to August 31, 2026.
|
|
| Additional Information [Text Block] |
You can find additional information about the Fund at www.eatonvance.com/open-end-mutual-fund-documents.php. You can also request this information by contacting us at 1-800-262-1122.
|
|
| Additional Information Phone Number |
1-800-262-1122
|
|
| Additional Information Website |
<span style="box-sizing: border-box; color: rgb(0, 0, 0); display: inline; flex-wrap: nowrap; font-size: 10.6667px; font-weight: 400; grid-area: auto; line-height: 16px; margin: 0px; overflow: visible; text-align: left; text-align-last: auto; white-space-collapse: preserve-breaks;">www.eatonvance.com/open-end-mutual-fund-documents.php</span>
|
|
| Expenses [Text Block] |
What were the Fund costs for the last year?(based on a hypothetical $10,000 investment)
Table Summary
Class Name |
Costs of a $10,000 investment |
Costs paid as a percentage of a $10,000 investment |
Class A |
$146 |
1.50% | |
|
| Expenses Paid, Amount |
$ 146
|
|
| Expense Ratio, Percent |
1.50%
|
|
| Factors Affecting Performance [Text Block] |
How did the Fund perform last year and what affected its performance?Key contributors to (↑) and detractors from (↓) performance, relative to the MSCI China Index (the Index): ↑ An overweight position in global semiconductor equipment maker NAURA Technology helped as the stock gained from ongoing semiconductor production localization ↑ An overweight position in China Construction Bank helped as net interest margin stabilized and state-owned enterprise bank re-rating strengthened capital base ↑ An out-of-index position in Shanghai Xizhi Technology helped as shares rallied from the initial public offering price on the AI optical-interconnect theme. The position was sold by the end of the period ↑ On a sector basis, stock selection in information technology and health care helped performance ↓ Overweight positions in Alibaba and Tencent Holdings detracted as stocks fell sharply amid a broad selloff in Chinese internet and communication services names ↓ No holdings in Bank of China Ltd. detracted as the stock rose amid demand for high-dividend-yielding financials as investors sought portfolio diversification ↓ On a sector basis, stock selection in consumer discretionary, an underweight to materials and an overweight to communication services hurt returns |
|
| Performance Past Does Not Indicate Future [Text] |
THE FUND'S PAST PERFORMANCE IS NO GUARANTEE OF FUTURE RESULTS.
|
|
| Line Graph [Table Text Block] |
Comparison of the change in value of a $10,000 investment for the period indicated.
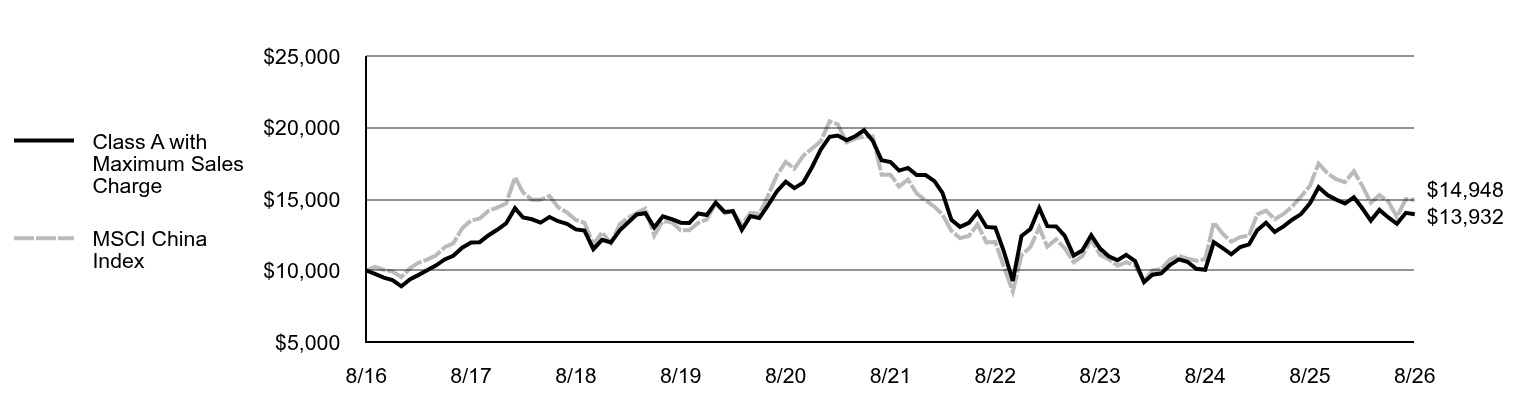
Table Summary
|
Class A with Maximum Sales Charge |
MSCI China Index |
8/16 |
$10,000 |
$10,000 |
9/16 |
$9,768 |
$10,253 |
10/16 |
$9,498 |
$10,054 |
11/16 |
$9,336 |
$9,934 |
12/16 |
$8,897 |
$9,527 |
1/17 |
$9,394 |
$10,174 |
2/17 |
$9,676 |
$10,534 |
3/17 |
$10,013 |
$10,759 |
4/17 |
$10,347 |
$11,046 |
5/17 |
$10,774 |
$11,629 |
6/17 |
$11,032 |
$11,896 |
7/17 |
$11,595 |
$12,953 |
8/17 |
$11,956 |
$13,500 |
9/17 |
$11,980 |
$13,640 |
10/17 |
$12,468 |
$14,182 |
11/17 |
$12,848 |
$14,403 |
12/17 |
$13,290 |
$14,679 |
1/18 |
$14,359 |
$16,512 |
2/18 |
$13,709 |
$15,454 |
3/18 |
$13,583 |
$14,946 |
4/18 |
$13,348 |
$14,942 |
5/18 |
$13,746 |
$15,217 |
6/18 |
$13,447 |
$14,422 |
7/18 |
$13,264 |
$14,063 |
8/18 |
$12,876 |
$13,529 |
9/18 |
$12,787 |
$13,340 |
10/18 |
$11,492 |
$11,810 |
11/18 |
$12,147 |
$12,675 |
12/18 |
$11,965 |
$11,908 |
1/19 |
$12,811 |
$13,225 |
2/19 |
$13,340 |
$13,681 |
3/19 |
$13,915 |
$14,015 |
4/19 |
$14,001 |
$14,327 |
5/19 |
$13,012 |
$12,452 |
6/19 |
$13,794 |
$13,452 |
7/19 |
$13,599 |
$13,379 |
8/19 |
$13,346 |
$12,819 |
9/19 |
$13,317 |
$12,816 |
10/19 |
$13,984 |
$13,333 |
11/19 |
$13,875 |
$13,571 |
12/19 |
$14,746 |
$14,701 |
1/20 |
$14,092 |
$13,995 |
2/20 |
$14,145 |
$14,131 |
3/20 |
$12,844 |
$13,200 |
4/20 |
$13,801 |
$14,033 |
5/20 |
$13,670 |
$13,964 |
6/20 |
$14,555 |
$15,218 |
7/20 |
$15,530 |
$16,655 |
8/20 |
$16,207 |
$17,600 |
9/20 |
$15,761 |
$17,119 |
10/20 |
$16,148 |
$18,025 |
11/20 |
$17,205 |
$18,525 |
12/20 |
$18,452 |
$19,037 |
1/21 |
$19,355 |
$20,439 |
2/21 |
$19,440 |
$20,227 |
3/21 |
$19,113 |
$18,956 |
4/21 |
$19,388 |
$19,219 |
5/21 |
$19,807 |
$19,367 |
6/21 |
$19,074 |
$19,386 |
7/21 |
$17,706 |
$16,702 |
8/21 |
$17,582 |
$16,703 |
9/21 |
$16,986 |
$15,864 |
10/21 |
$17,176 |
$16,365 |
11/21 |
$16,672 |
$15,387 |
12/21 |
$16,673 |
$14,903 |
1/22 |
$16,246 |
$14,463 |
2/22 |
$15,427 |
$13,899 |
3/22 |
$13,541 |
$12,788 |
4/22 |
$13,052 |
$12,265 |
5/22 |
$13,334 |
$12,410 |
6/22 |
$14,071 |
$13,224 |
7/22 |
$13,045 |
$11,968 |
8/22 |
$12,997 |
$11,995 |
9/22 |
$11,317 |
$10,249 |
10/22 |
$9,273 |
$8,526 |
11/22 |
$12,412 |
$11,059 |
12/22 |
$12,889 |
$11,634 |
1/23 |
$14,371 |
$13,005 |
2/23 |
$13,101 |
$11,656 |
3/23 |
$13,079 |
$12,182 |
4/23 |
$12,422 |
$11,554 |
5/23 |
$11,043 |
$10,580 |
6/23 |
$11,400 |
$10,999 |
7/23 |
$12,458 |
$12,183 |
8/23 |
$11,532 |
$11,092 |
9/23 |
$10,991 |
$10,786 |
10/23 |
$10,714 |
$10,327 |
11/23 |
$11,094 |
$10,587 |
12/23 |
$10,656 |
$10,332 |
1/24 |
$9,183 |
$9,235 |
2/24 |
$9,705 |
$10,010 |
3/24 |
$9,801 |
$10,105 |
4/24 |
$10,387 |
$10,771 |
5/24 |
$10,775 |
$11,030 |
6/24 |
$10,609 |
$10,821 |
7/24 |
$10,125 |
$10,678 |
8/24 |
$10,054 |
$10,785 |
9/24 |
$11,987 |
$13,363 |
10/24 |
$11,559 |
$12,573 |
11/24 |
$11,132 |
$12,015 |
12/24 |
$11,646 |
$12,338 |
1/25 |
$11,832 |
$12,452 |
2/25 |
$12,812 |
$13,916 |
3/25 |
$13,339 |
$14,192 |
4/25 |
$12,691 |
$13,586 |
5/25 |
$13,088 |
$13,958 |
6/25 |
$13,549 |
$14,476 |
7/25 |
$13,946 |
$15,172 |
8/25 |
$14,699 |
$15,921 |
9/25 |
$15,825 |
$17,473 |
10/25 |
$15,274 |
$16,807 |
11/25 |
$14,959 |
$16,387 |
12/25 |
$14,681 |
$16,184 |
1/26 |
$15,117 |
$16,944 |
2/26 |
$14,385 |
$15,967 |
3/26 |
$13,488 |
$14,738 |
4/26 |
$14,237 |
$15,273 |
5/26 |
$13,710 |
$14,810 |
6/26 |
$13,266 |
$13,761 |
7/26 |
$14,031 |
$14,999 |
8/26 |
$13,932 |
$14,948 | |
|
| Average Annual Return [Table Text Block] |
Average Annual Total Returns (%)
Table Summary
Fund |
1 Year |
5 Years |
10 Years |
Class A |
(5.22)% |
(4.54)% |
3.93% |
Class A with 5.25% Maximum Sales Charge |
(10.21)% |
(5.57)% |
3.37% |
MSCI China Index (net of foreign withholding taxes) |
(6.11)% |
(2.19)% |
4.10% | Performance does not reflect the deduction of taxes that a shareholder would pay on Fund distributions or redemption of Fund shares. Performance assumes that all dividends and distributions, if any, were reinvested. For more recent performance information, visit www.eatonvance.com/performance.php. THE FUND'S PAST PERFORMANCE IS NO GUARANTEE OF FUTURE RESULTS. |
|
| No Deduction of Taxes [Text Block] |
Performance does not reflect the deduction of taxes that a shareholder would pay on Fund distributions or redemption of Fund shares.
|
|
| Updated Performance Information Location [Text Block] |
For more recent performance information, visit www.eatonvance.com/performance.php.
|
|
| AssetsNet |
$ 33,702,059
|
|
| Holdings Count | Holding |
63
|
|
| Advisory Fees Paid, Amount |
$ 101,348
|
|
| InvestmentCompanyPortfolioTurnover |
34.00%
|
|
| Additional Fund Statistics [Text Block] |
Table Summary
Total Net Assets |
$33,702,059 |
# of Portfolio Holdings |
63 |
Portfolio Turnover Rate |
34% |
Total Advisory Fees Paid |
$101,348 | |
|
| Holdings [Text Block] |
Sector Allocation (% of total investments)
Table Summary
Value |
Value |
Short-Term Investments |
0.0%Footnote Reference* |
Utilities |
1.1% |
Real Estate |
1.3% |
Consumer Staples |
2.1% |
Energy |
4.0% |
Health Care |
5.0% |
Materials |
5.3% |
Industrials |
7.9% |
Information Technology |
14.7% |
Communication Services |
17.7% |
Consumer Discretionary |
18.2% |
Financials |
22.7% |
| Footnote |
Description |
Footnote* |
Amount is less than 0.05%. | |
|
| Largest Holdings [Text Block] |
Top Ten Holdings (% of total investments)Footnote Referencea
Table Summary
Tencent Holdings Ltd. |
17.7% |
Alibaba Group Holding Ltd. |
11.2% |
China Construction Bank Corp., Class H |
10.0% |
NAURA Technology Group Co. Ltd., Class A |
4.6% |
Industrial & Commercial Bank of China Ltd., Class H |
3.7% |
Zijin Mining Group Co. Ltd., Class H |
3.6% |
Wuxi Biologics Cayman, Inc. |
3.3% |
Ping An Insurance Group Co. of China Ltd., Class H |
3.0% |
Contemporary Amperex Technology Co. Ltd., Class A |
2.7% |
China Shenhua Energy Co. Ltd., Class H |
2.1% |
Total |
61.9% |
| Footnote |
Description |
Footnotea |
Excluding cash equivalents | |
|
| Material Fund Change [Text Block] |
|
|
| Updated Prospectus Phone Number |
1-800-262-1122
|
|
| C000014187 |
|
|
| Shareholder Report [Line Items] |
|
|
| Fund Name |
Eaton Vance China Equity Fund
|
|
| Class Name |
Class C
|
|
| Trading Symbol |
ECCGX
|
|
| Annual or Semi-Annual Statement [Text Block] |
This annual shareholder report contains important information about the Eaton Vance China Equity Fund for the period of September 1, 2025 to August 31, 2026.
|
|
| Additional Information [Text Block] |
You can find additional information about the Fund at www.eatonvance.com/open-end-mutual-fund-documents.php. You can also request this information by contacting us at 1-800-262-1122.
|
|
| Additional Information Phone Number |
1-800-262-1122
|
|
| Additional Information Website |
<span style="box-sizing: border-box; color: rgb(0, 0, 0); display: inline; flex-wrap: nowrap; font-size: 10.6667px; font-weight: 400; grid-area: auto; line-height: 16px; margin: 0px; overflow: visible; text-align: left; text-align-last: auto; white-space-collapse: preserve-breaks;">www.eatonvance.com/open-end-mutual-fund-documents.php</span>
|
|
| Expenses [Text Block] |
What were the Fund costs for the last year?(based on a hypothetical $10,000 investment)
Table Summary
Class Name |
Costs of a $10,000 investment |
Costs paid as a percentage of a $10,000 investment |
Class C |
$218 |
2.25% | |
|
| Expenses Paid, Amount |
$ 218
|
|
| Expense Ratio, Percent |
2.25%
|
|
| Factors Affecting Performance [Text Block] |
How did the Fund perform last year and what affected its performance?Key contributors to (↑) and detractors from (↓) performance, relative to the MSCI China Index (the Index): ↑ An overweight position in global semiconductor equipment maker NAURA Technology helped as the stock gained from ongoing semiconductor production localization ↑ An overweight position in China Construction Bank helped as net interest margin stabilized and state-owned enterprise bank re-rating strengthened capital base ↑ An out-of-index position in Shanghai Xizhi Technology helped as shares rallied from the initial public offering price on the AI optical-interconnect theme. The position was sold by the end of the period ↑ On a sector basis, stock selection in information technology and health care helped performance ↓ Overweight positions in Alibaba and Tencent Holdings detracted as stocks fell sharply amid a broad selloff in Chinese internet and communication services names ↓ No holdings in Bank of China Ltd. detracted as the stock rose amid demand for high-dividend-yielding financials as investors sought portfolio diversification ↓ On a sector basis, stock selection in consumer discretionary, an underweight to materials and an overweight to communication services hurt returns |
|
| Performance Past Does Not Indicate Future [Text] |
THE FUND'S PAST PERFORMANCE IS NO GUARANTEE OF FUTURE RESULTS.
|
|
| Line Graph [Table Text Block] |
Comparison of the change in value of a $10,000 investment for the period indicated.
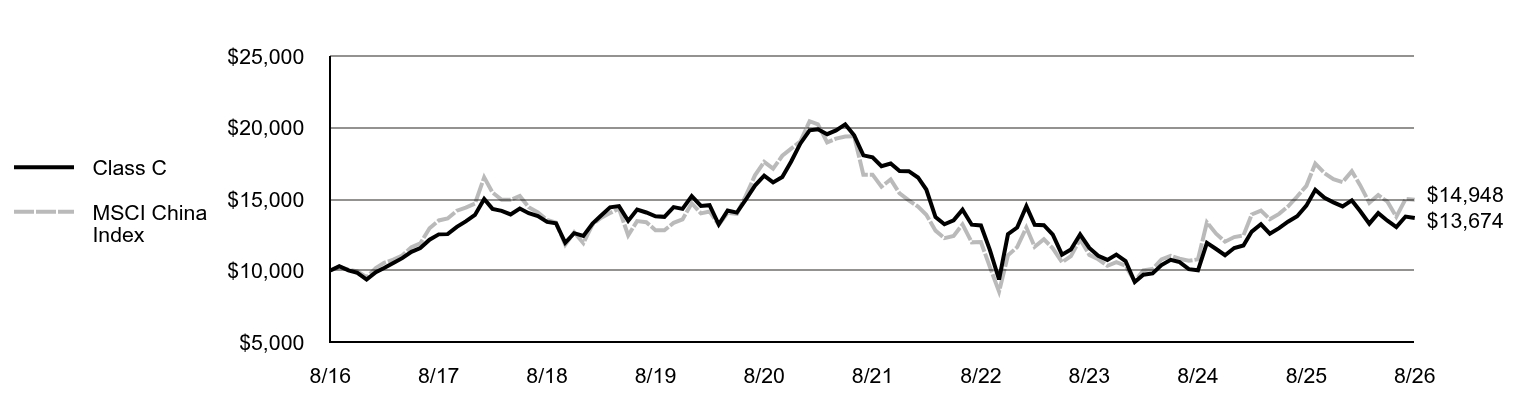
Table Summary
|
Class C |
MSCI China Index |
8/16 |
$10,000 |
$10,000 |
9/16 |
$10,304 |
$10,253 |
10/16 |
$10,010 |
$10,054 |
11/16 |
$9,830 |
$9,934 |
12/16 |
$9,364 |
$9,527 |
1/17 |
$9,884 |
$10,174 |
2/17 |
$10,175 |
$10,534 |
3/17 |
$10,523 |
$10,759 |
4/17 |
$10,865 |
$11,046 |
5/17 |
$11,307 |
$11,629 |
6/17 |
$11,572 |
$11,896 |
7/17 |
$12,154 |
$12,953 |
8/17 |
$12,527 |
$13,500 |
9/17 |
$12,543 |
$13,640 |
10/17 |
$13,047 |
$14,182 |
11/17 |
$13,436 |
$14,403 |
12/17 |
$13,889 |
$14,679 |
1/18 |
$14,997 |
$16,512 |
2/18 |
$14,312 |
$15,454 |
3/18 |
$14,173 |
$14,946 |
4/18 |
$13,923 |
$14,942 |
5/18 |
$14,330 |
$15,217 |
6/18 |
$14,005 |
$14,422 |
7/18 |
$13,807 |
$14,063 |
8/18 |
$13,396 |
$13,529 |
9/18 |
$13,297 |
$13,340 |
10/18 |
$11,939 |
$11,810 |
11/18 |
$12,612 |
$12,675 |
12/18 |
$12,422 |
$11,908 |
1/19 |
$13,287 |
$13,225 |
2/19 |
$13,827 |
$13,681 |
3/19 |
$14,418 |
$14,015 |
4/19 |
$14,501 |
$14,327 |
5/19 |
$13,471 |
$12,452 |
6/19 |
$14,266 |
$13,452 |
7/19 |
$14,056 |
$13,379 |
8/19 |
$13,789 |
$12,819 |
9/19 |
$13,751 |
$12,816 |
10/19 |
$14,431 |
$13,333 |
11/19 |
$14,310 |
$13,571 |
12/19 |
$15,198 |
$14,701 |
1/20 |
$14,516 |
$13,995 |
2/20 |
$14,569 |
$14,131 |
3/20 |
$13,217 |
$13,200 |
4/20 |
$14,195 |
$14,033 |
5/20 |
$14,050 |
$13,964 |
6/20 |
$14,949 |
$15,218 |
7/20 |
$15,939 |
$16,655 |
8/20 |
$16,628 |
$17,600 |
9/20 |
$16,162 |
$17,119 |
10/20 |
$16,543 |
$18,025 |
11/20 |
$17,625 |
$18,525 |
12/20 |
$18,885 |
$19,037 |
1/21 |
$19,805 |
$20,439 |
2/21 |
$19,877 |
$20,227 |
3/21 |
$19,532 |
$18,956 |
4/21 |
$19,798 |
$19,219 |
5/21 |
$20,215 |
$19,367 |
6/21 |
$19,453 |
$19,386 |
7/21 |
$18,052 |
$16,702 |
8/21 |
$17,915 |
$16,703 |
9/21 |
$17,297 |
$15,864 |
10/21 |
$17,477 |
$16,365 |
11/21 |
$16,952 |
$15,387 |
12/21 |
$16,946 |
$14,903 |
1/22 |
$16,505 |
$14,463 |
2/22 |
$15,663 |
$13,899 |
3/22 |
$13,734 |
$12,788 |
4/22 |
$13,233 |
$12,265 |
5/22 |
$13,514 |
$12,410 |
6/22 |
$14,251 |
$13,224 |
7/22 |
$13,203 |
$11,968 |
8/22 |
$13,150 |
$11,995 |
9/22 |
$11,441 |
$10,249 |
10/22 |
$9,369 |
$8,526 |
11/22 |
$12,535 |
$11,059 |
12/22 |
$13,007 |
$11,634 |
1/23 |
$14,489 |
$13,005 |
2/23 |
$13,202 |
$11,656 |
3/23 |
$13,169 |
$12,182 |
4/23 |
$12,505 |
$11,554 |
5/23 |
$11,105 |
$10,580 |
6/23 |
$11,461 |
$10,999 |
7/23 |
$12,514 |
$12,183 |
8/23 |
$11,575 |
$11,092 |
9/23 |
$11,032 |
$10,786 |
10/23 |
$10,741 |
$10,327 |
11/23 |
$11,113 |
$10,587 |
12/23 |
$10,662 |
$10,332 |
1/24 |
$9,193 |
$9,235 |
2/24 |
$9,706 |
$10,010 |
3/24 |
$9,795 |
$10,105 |
4/24 |
$10,379 |
$10,771 |
5/24 |
$10,750 |
$11,030 |
6/24 |
$10,582 |
$10,821 |
7/24 |
$10,096 |
$10,678 |
8/24 |
$10,016 |
$10,785 |
9/24 |
$11,936 |
$13,363 |
10/24 |
$11,503 |
$12,573 |
11/24 |
$11,069 |
$12,015 |
12/24 |
$11,572 |
$12,338 |
1/25 |
$11,752 |
$12,452 |
2/25 |
$12,721 |
$13,916 |
3/25 |
$13,232 |
$14,192 |
4/25 |
$12,577 |
$13,586 |
5/25 |
$12,963 |
$13,958 |
6/25 |
$13,412 |
$14,476 |
7/25 |
$13,797 |
$15,172 |
8/25 |
$14,533 |
$15,921 |
9/25 |
$15,645 |
$17,473 |
10/25 |
$15,080 |
$16,807 |
11/25 |
$14,766 |
$16,387 |
12/25 |
$14,481 |
$16,184 |
1/26 |
$14,899 |
$16,944 |
2/26 |
$14,164 |
$15,967 |
3/26 |
$13,275 |
$14,738 |
4/26 |
$14,010 |
$15,273 |
5/26 |
$13,483 |
$14,810 |
6/26 |
$13,039 |
$13,761 |
7/26 |
$13,774 |
$14,999 |
8/26 |
$13,674 |
$14,948 | |
|
| Average Annual Return [Table Text Block] |
Average Annual Total Returns (%)
Table Summary
Fund |
1 Year |
5 Years |
10 Years |
Class C, with conversion to Class A after 8 years |
(5.91)% |
(5.26)% |
3.18% |
Class C, with 1% Maximum Contingent Deferred Sales Charge and conversion to Class A after 8 years |
(6.84)% |
(5.26)% |
3.18% |
MSCI China Index (net of foreign withholding taxes) |
(6.11)% |
(2.19)% |
4.10% | Performance does not reflect the deduction of taxes that a shareholder would pay on Fund distributions or redemption of Fund shares. Performance assumes that all dividends and distributions, if any, were reinvested. For more recent performance information, visit www.eatonvance.com/performance.php. THE FUND'S PAST PERFORMANCE IS NO GUARANTEE OF FUTURE RESULTS. |
|
| No Deduction of Taxes [Text Block] |
Performance does not reflect the deduction of taxes that a shareholder would pay on Fund distributions or redemption of Fund shares.
|
|
| Updated Performance Information Location [Text Block] |
For more recent performance information, visit www.eatonvance.com/performance.php.
|
|
| AssetsNet |
$ 33,702,059
|
|
| Holdings Count | Holding |
63
|
|
| Advisory Fees Paid, Amount |
$ 101,348
|
|
| InvestmentCompanyPortfolioTurnover |
34.00%
|
|
| Additional Fund Statistics [Text Block] |
Table Summary
Total Net Assets |
$33,702,059 |
# of Portfolio Holdings |
63 |
Portfolio Turnover Rate |
34% |
Total Advisory Fees Paid |
$101,348 | |
|
| Holdings [Text Block] |
Sector Allocation (% of total investments)
Table Summary
Value |
Value |
Short-Term Investments |
0.0%Footnote Reference* |
Utilities |
1.1% |
Real Estate |
1.3% |
Consumer Staples |
2.1% |
Energy |
4.0% |
Health Care |
5.0% |
Materials |
5.3% |
Industrials |
7.9% |
Information Technology |
14.7% |
Communication Services |
17.7% |
Consumer Discretionary |
18.2% |
Financials |
22.7% |
| Footnote |
Description |
Footnote* |
Amount is less than 0.05%. | |
|
| Largest Holdings [Text Block] |
Top Ten Holdings (% of total investments)Footnote Referencea
Table Summary
Tencent Holdings Ltd. |
17.7% |
Alibaba Group Holding Ltd. |
11.2% |
China Construction Bank Corp., Class H |
10.0% |
NAURA Technology Group Co. Ltd., Class A |
4.6% |
Industrial & Commercial Bank of China Ltd., Class H |
3.7% |
Zijin Mining Group Co. Ltd., Class H |
3.6% |
Wuxi Biologics Cayman, Inc. |
3.3% |
Ping An Insurance Group Co. of China Ltd., Class H |
3.0% |
Contemporary Amperex Technology Co. Ltd., Class A |
2.7% |
China Shenhua Energy Co. Ltd., Class H |
2.1% |
Total |
61.9% |
| Footnote |
Description |
Footnotea |
Excluding cash equivalents | |
|
| Material Fund Change [Text Block] |
|
|
| Updated Prospectus Phone Number |
1-800-262-1122
|
|
| C000014184 |
|
|
| Shareholder Report [Line Items] |
|
|
| Fund Name |
Eaton Vance China Equity Fund
|
|
| Class Name |
Class I
|
|
| Trading Symbol |
EICGX
|
|
| Annual or Semi-Annual Statement [Text Block] |
This annual shareholder report contains important information about the Eaton Vance China Equity Fund for the period of September 1, 2025 to August 31, 2026.
|
|
| Additional Information [Text Block] |
You can find additional information about the Fund at www.eatonvance.com/open-end-mutual-fund-documents.php. You can also request this information by contacting us at 1-800-262-1122.
|
|
| Additional Information Phone Number |
1-800-262-1122
|
|
| Additional Information Website |
<span style="box-sizing: border-box; color: rgb(0, 0, 0); display: inline; flex-wrap: nowrap; font-size: 10.6667px; font-weight: 400; grid-area: auto; line-height: 16px; margin: 0px; overflow: visible; text-align: left; text-align-last: auto; white-space-collapse: preserve-breaks;">www.eatonvance.com/open-end-mutual-fund-documents.php</span>
|
|
| Expenses [Text Block] |
What were the Fund costs for the last year?(based on a hypothetical $10,000 investment)
Table Summary
Class Name |
Costs of a $10,000 investment |
Costs paid as a percentage of a $10,000 investment |
Class I |
$122 |
1.25% | |
|
| Expenses Paid, Amount |
$ 122
|
|
| Expense Ratio, Percent |
1.25%
|
|
| Factors Affecting Performance [Text Block] |
How did the Fund perform last year and what affected its performance?Key contributors to (↑) and detractors from (↓) performance, relative to the MSCI China Index (the Index): ↑ An overweight position in global semiconductor equipment maker NAURA Technology helped as the stock gained from ongoing semiconductor production localization ↑ An overweight position in China Construction Bank helped as net interest margin stabilized and state-owned enterprise bank re-rating strengthened capital base ↑ An out-of-index position in Shanghai Xizhi Technology helped as shares rallied from the initial public offering price on the AI optical-interconnect theme. The position was sold by the end of the period ↑ On a sector basis, stock selection in information technology and health care helped performance ↓ Overweight positions in Alibaba and Tencent Holdings detracted as stocks fell sharply amid a broad selloff in Chinese internet and communication services names ↓ No holdings in Bank of China Ltd. detracted as the stock rose amid demand for high-dividend-yielding financials as investors sought portfolio diversification ↓ On a sector basis, stock selection in consumer discretionary, an underweight to materials and an overweight to communication services hurt returns |
|
| Performance Past Does Not Indicate Future [Text] |
THE FUND'S PAST PERFORMANCE IS NO GUARANTEE OF FUTURE RESULTS.
|
|
| Line Graph [Table Text Block] |
Comparison of the change in value of a $1,000,000 investment for the period indicated.
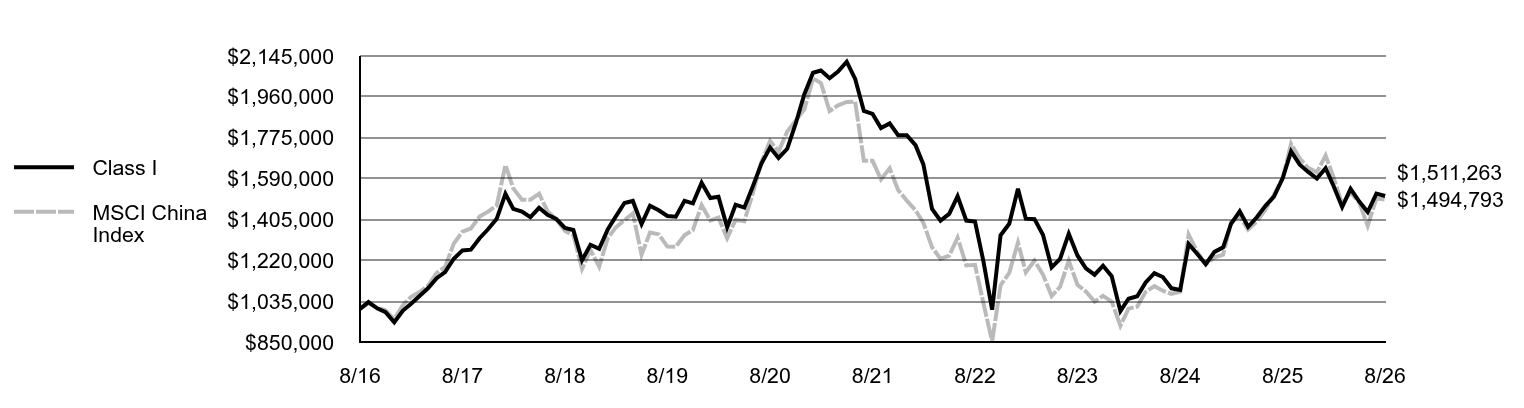
Table Summary
|
Class I |
MSCI China Index |
8/16 |
$1,000,000 |
$1,000,000 |
9/16 |
$1,030,717 |
$1,025,273 |
10/16 |
$1,002,438 |
$1,005,418 |
11/16 |
$985,373 |
$993,384 |
12/16 |
$939,247 |
$952,740 |
1/17 |
$992,440 |
$1,017,407 |
2/17 |
$1,022,484 |
$1,053,408 |
3/17 |
$1,058,438 |
$1,075,898 |
4/17 |
$1,093,407 |
$1,104,590 |
5/17 |
$1,139,212 |
$1,162,868 |
6/17 |
$1,166,794 |
$1,189,635 |
7/17 |
$1,226,882 |
$1,295,339 |
8/17 |
$1,264,806 |
$1,349,963 |
9/17 |
$1,268,254 |
$1,363,990 |
10/17 |
$1,319,969 |
$1,418,200 |
11/17 |
$1,360,356 |
$1,440,307 |
12/17 |
$1,407,534 |
$1,467,879 |
1/18 |
$1,521,107 |
$1,651,189 |
2/18 |
$1,452,743 |
$1,545,446 |
3/18 |
$1,440,063 |
$1,494,579 |
4/18 |
$1,415,253 |
$1,494,225 |
5/18 |
$1,457,705 |
$1,521,668 |
6/18 |
$1,426,279 |
$1,442,237 |
7/18 |
$1,407,534 |
$1,406,264 |
8/18 |
$1,366,736 |
$1,352,880 |
9/18 |
$1,357,364 |
$1,333,953 |
10/18 |
$1,220,084 |
$1,180,958 |
11/18 |
$1,290,102 |
$1,267,519 |
12/18 |
$1,271,429 |
$1,190,805 |
1/19 |
$1,361,206 |
$1,322,495 |
2/19 |
$1,417,619 |
$1,368,147 |
3/19 |
$1,479,492 |
$1,401,473 |
4/19 |
$1,488,591 |
$1,432,692 |
5/19 |
$1,384,256 |
$1,245,195 |
6/19 |
$1,467,360 |
$1,345,194 |
7/19 |
$1,446,736 |
$1,337,904 |
8/19 |
$1,420,652 |
$1,281,904 |
9/19 |
$1,417,619 |
$1,281,578 |
10/19 |
$1,489,198 |
$1,333,312 |
11/19 |
$1,477,672 |
$1,357,086 |
12/19 |
$1,570,873 |
$1,470,134 |
1/20 |
$1,501,783 |
$1,399,521 |
2/20 |
$1,508,064 |
$1,413,130 |
3/20 |
$1,369,254 |
$1,319,951 |
4/20 |
$1,471,634 |
$1,403,296 |
5/20 |
$1,458,444 |
$1,396,369 |
6/20 |
$1,553,287 |
$1,521,788 |
7/20 |
$1,657,551 |
$1,665,506 |
8/20 |
$1,730,410 |
$1,760,031 |
9/20 |
$1,683,303 |
$1,711,938 |
10/20 |
$1,724,757 |
$1,802,486 |
11/20 |
$1,838,443 |
$1,852,470 |
12/20 |
$1,972,259 |
$1,903,735 |
1/21 |
$2,069,278 |
$2,043,908 |
2/21 |
$2,078,980 |
$2,022,744 |
3/21 |
$2,044,330 |
$1,895,620 |
4/21 |
$2,074,129 |
$1,921,928 |
5/21 |
$2,119,173 |
$1,936,712 |
6/21 |
$2,041,558 |
$1,938,608 |
7/21 |
$1,896,030 |
$1,670,242 |
8/21 |
$1,882,863 |
$1,670,309 |
9/21 |
$1,819,107 |
$1,586,413 |
10/21 |
$1,839,897 |
$1,636,472 |
11/21 |
$1,786,537 |
$1,538,745 |
12/21 |
$1,786,615 |
$1,490,256 |
1/22 |
$1,741,439 |
$1,446,293 |
2/22 |
$1,654,003 |
$1,389,890 |
3/22 |
$1,452,171 |
$1,278,753 |
4/22 |
$1,399,709 |
$1,226,532 |
5/22 |
$1,430,312 |
$1,240,988 |
6/22 |
$1,509,733 |
$1,322,394 |
7/22 |
$1,399,709 |
$1,196,805 |
8/22 |
$1,395,337 |
$1,199,478 |
9/22 |
$1,215,364 |
$1,024,901 |
10/22 |
$996,045 |
$852,618 |
11/22 |
$1,333,403 |
$1,105,916 |
12/22 |
$1,385,367 |
$1,163,435 |
1/23 |
$1,544,356 |
$1,300,495 |
2/23 |
$1,408,521 |
$1,165,571 |
3/23 |
$1,406,205 |
$1,218,208 |
4/23 |
$1,335,972 |
$1,155,384 |
5/23 |
$1,187,788 |
$1,057,964 |
6/23 |
$1,226,378 |
$1,099,940 |
7/23 |
$1,340,603 |
$1,218,279 |
8/23 |
$1,241,813 |
$1,109,177 |
9/23 |
$1,183,929 |
$1,078,634 |
10/23 |
$1,154,601 |
$1,032,657 |
11/23 |
$1,195,506 |
$1,058,683 |
12/23 |
$1,147,615 |
$1,033,160 |
1/24 |
$989,786 |
$923,522 |
2/24 |
$1,046,034 |
$1,001,044 |
3/24 |
$1,056,948 |
$1,010,485 |
4/24 |
$1,119,911 |
$1,077,137 |
5/24 |
$1,161,887 |
$1,102,973 |
6/24 |
$1,144,257 |
$1,082,132 |
7/24 |
$1,093,047 |
$1,067,756 |
8/24 |
$1,085,491 |
$1,078,484 |
9/24 |
$1,293,690 |
$1,336,293 |
10/24 |
$1,248,357 |
$1,257,259 |
11/24 |
$1,202,183 |
$1,201,479 |
12/24 |
$1,258,133 |
$1,233,793 |
1/25 |
$1,278,772 |
$1,245,152 |
2/25 |
$1,384,548 |
$1,391,616 |
3/25 |
$1,441,306 |
$1,419,162 |
4/25 |
$1,371,649 |
$1,358,564 |
5/25 |
$1,414,647 |
$1,395,796 |
6/25 |
$1,465,385 |
$1,447,649 |
7/25 |
$1,508,383 |
$1,517,194 |
8/25 |
$1,590,940 |
$1,592,095 |
9/25 |
$1,713,056 |
$1,747,347 |
10/25 |
$1,652,858 |
$1,680,662 |
11/25 |
$1,620,179 |
$1,638,654 |
12/25 |
$1,590,020 |
$1,618,400 |
1/26 |
$1,637,274 |
$1,694,413 |
2/26 |
$1,557,642 |
$1,596,683 |
3/26 |
$1,461,383 |
$1,473,795 |
4/26 |
$1,543,641 |
$1,527,345 |
5/26 |
$1,485,886 |
$1,481,044 |
6/26 |
$1,438,631 |
$1,376,106 |
7/26 |
$1,521,764 |
$1,499,929 |
8/26 |
$1,511,263 |
$1,494,793 | |
|
| Average Annual Return [Table Text Block] |
Average Annual Total Returns (%)
Table Summary
Fund |
1 Year |
5 Years |
10 Years |
Class I |
(5.01)% |
(4.30)% |
4.21% |
MSCI China Index (net of foreign withholding taxes) |
(6.11)% |
(2.19)% |
4.10% | Performance does not reflect the deduction of taxes that a shareholder would pay on Fund distributions or redemption of Fund shares. Performance assumes that all dividends and distributions, if any, were reinvested. For more recent performance information, visit www.eatonvance.com/performance.php. THE FUND'S PAST PERFORMANCE IS NO GUARANTEE OF FUTURE RESULTS. |
|
| No Deduction of Taxes [Text Block] |
Performance does not reflect the deduction of taxes that a shareholder would pay on Fund distributions or redemption of Fund shares.
|
|
| Updated Performance Information Location [Text Block] |
For more recent performance information, visit www.eatonvance.com/performance.php.
|
|
| AssetsNet |
$ 33,702,059
|
|
| Holdings Count | Holding |
63
|
|
| Advisory Fees Paid, Amount |
$ 101,348
|
|
| InvestmentCompanyPortfolioTurnover |
34.00%
|
|
| Additional Fund Statistics [Text Block] |
Table Summary
Total Net Assets |
$33,702,059 |
# of Portfolio Holdings |
63 |
Portfolio Turnover Rate |
34% |
Total Advisory Fees Paid |
$101,348 | |
|
| Holdings [Text Block] |
Sector Allocation (% of total investments)
Table Summary
Value |
Value |
Short-Term Investments |
0.0%Footnote Reference* |
Utilities |
1.1% |
Real Estate |
1.3% |
Consumer Staples |
2.1% |
Energy |
4.0% |
Health Care |
5.0% |
Materials |
5.3% |
Industrials |
7.9% |
Information Technology |
14.7% |
Communication Services |
17.7% |
Consumer Discretionary |
18.2% |
Financials |
22.7% |
| Footnote |
Description |
Footnote* |
Amount is less than 0.05%. | |
|
| Largest Holdings [Text Block] |
Top Ten Holdings (% of total investments)Footnote Referencea
Table Summary
Tencent Holdings Ltd. |
17.7% |
Alibaba Group Holding Ltd. |
11.2% |
China Construction Bank Corp., Class H |
10.0% |
NAURA Technology Group Co. Ltd., Class A |
4.6% |
Industrial & Commercial Bank of China Ltd., Class H |
3.7% |
Zijin Mining Group Co. Ltd., Class H |
3.6% |
Wuxi Biologics Cayman, Inc. |
3.3% |
Ping An Insurance Group Co. of China Ltd., Class H |
3.0% |
Contemporary Amperex Technology Co. Ltd., Class A |
2.7% |
China Shenhua Energy Co. Ltd., Class H |
2.1% |
Total |
61.9% |
| Footnote |
Description |
Footnotea |
Excluding cash equivalents | |
|
| Material Fund Change [Text Block] |
|
|
| Updated Prospectus Phone Number |
1-800-262-1122
|
|
| C000014191 |
|
|
| Shareholder Report [Line Items] |
|
|
| Fund Name |
Eaton Vance Worldwide Health Sciences Fund
|
|
| Class Name |
Class A
|
|
| Trading Symbol |
ETHSX
|
|
| Annual or Semi-Annual Statement [Text Block] |
This annual shareholder report contains important information about the Eaton Vance Worldwide Health Sciences Fund for the period of September 1, 2025 to August 31, 2026.
|
|
| Additional Information [Text Block] |
You can find additional information about the Fund at www.eatonvance.com/open-end-mutual-fund-documents.php. You can also request this information by contacting us at 1-800-262-1122.
|
|
| Additional Information Phone Number |
1-800-262-1122
|
|
| Additional Information Website |
<span style="box-sizing: border-box; color: rgb(0, 0, 0); display: inline; flex-wrap: nowrap; font-size: 10.6667px; font-weight: 400; grid-area: auto; line-height: 16px; margin: 0px; overflow: visible; text-align: left; text-align-last: auto; white-space-collapse: preserve-breaks;">www.eatonvance.com/open-end-mutual-fund-documents.php</span>
|
|
| Expenses [Text Block] |
What were the Fund costs for the last year?(based on a hypothetical $10,000 investment)
Table Summary
Class Name |
Costs of a $10,000 investment |
Costs paid as a percentage of a $10,000 investment |
Class A |
$121 |
1.13% | |
|
| Expenses Paid, Amount |
$ 121
|
|
| Expense Ratio, Percent |
1.13%
|
|
| Factors Affecting Performance [Text Block] |
How did the Fund perform last year and what affected its performance?Key contributors to (↑) and detractors from (↓) performance, relative to the MSCI World Health Care Index (the Index): ↓ Overweight to Zoetis, Inc. detracted due to its lowered 2026 guidance on weaker US pet demand and competition in dermatology and parasiticide products. This was sold by period end ↓ Overweight to Boston Scientific Corp. detracted as its 2026 growth outlook was cut on weaker WATCHMAN demand and electrophysiology US market share losses. This was sold by period end ↓ Overweight to CSL Ltd. hurt due to weaker US flu vaccine demand, lower immunoglobulin and China albumin sales and a chief executive officer change. This was sold by period end ↓ On an industry basis, stock selection in biotechnology detracted the most, followed by health care equipment and supplies, and life science tools and services ↑ Overweight to Eli Lilly & Co. helped as strong Mounjaro and Zepbound GLP-1 drugs sales and US approval of obesity pill Foundayo supported shares ↑ Out-of-index allocation to Structure Therapeutics, Inc. added as shares rose on strong mid-stage trial results for its oral weight-loss drug. This was sold by period end ↑ Overweight to Bristol Myers Squibb Co. helped as growth from newer drugs in cardiomyopathy and blood cancers more than offset declines in older drugs ↑ Stock selection in pharmaceuticals and health care technology helped returns |
|
| Performance Past Does Not Indicate Future [Text] |
THE FUND'S PAST PERFORMANCE IS NO GUARANTEE OF FUTURE RESULTS.
|
|
| Line Graph [Table Text Block] |
Comparison of the change in value of a $10,000 investment for the period indicated.
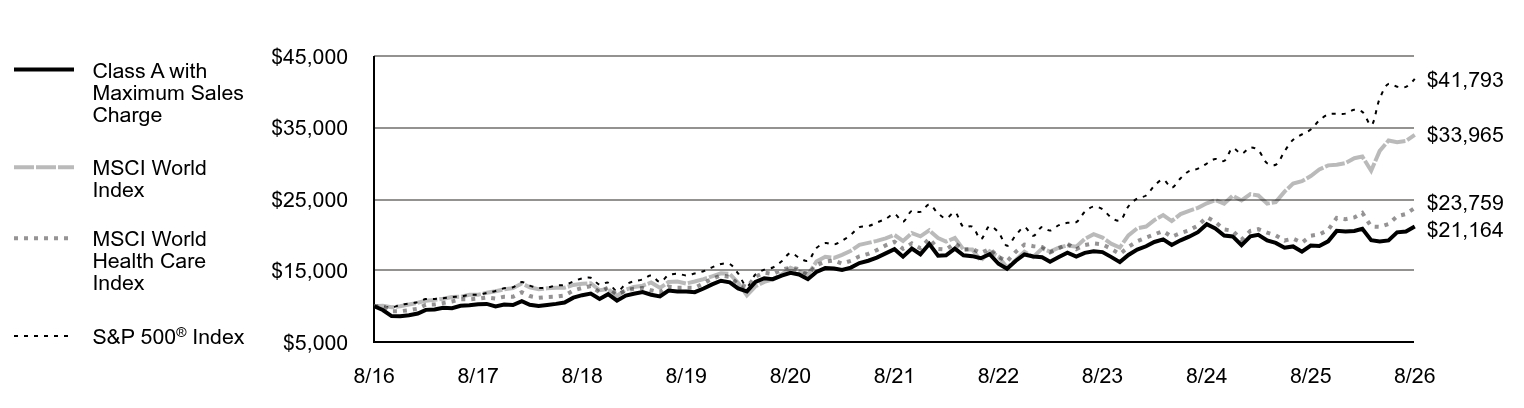
Table Summary
|
Class A with Maximum Sales Charge |
MSCI World Index |
MSCI World Health Care Index |
S&P 500® Index |
8/16 |
$10,000 |
$10,000 |
$10,000 |
$10,000 |
9/16 |
$9,475 |
$10,053 |
$9,987 |
$10,002 |
10/16 |
$8,624 |
$9,859 |
$9,297 |
$9,819 |
11/16 |
$8,607 |
$10,000 |
$9,306 |
$10,183 |
12/16 |
$8,745 |
$10,240 |
$9,452 |
$10,384 |
1/17 |
$8,975 |
$10,487 |
$9,659 |
$10,581 |
2/17 |
$9,493 |
$10,778 |
$10,217 |
$11,001 |
3/17 |
$9,551 |
$10,892 |
$10,250 |
$11,014 |
4/17 |
$9,781 |
$11,054 |
$10,443 |
$11,127 |
5/17 |
$9,724 |
$11,288 |
$10,671 |
$11,284 |
6/17 |
$10,069 |
$11,331 |
$10,961 |
$11,354 |
7/17 |
$10,137 |
$11,602 |
$10,969 |
$11,588 |
8/17 |
$10,281 |
$11,619 |
$11,077 |
$11,623 |
9/17 |
$10,329 |
$11,879 |
$11,226 |
$11,863 |
10/17 |
$9,983 |
$12,104 |
$11,080 |
$12,140 |
11/17 |
$10,233 |
$12,366 |
$11,331 |
$12,512 |
12/17 |
$10,165 |
$12,533 |
$11,324 |
$12,651 |
1/18 |
$10,717 |
$13,195 |
$11,958 |
$13,376 |
2/18 |
$10,204 |
$12,648 |
$11,422 |
$12,883 |
3/18 |
$10,046 |
$12,373 |
$11,184 |
$12,555 |
4/18 |
$10,175 |
$12,515 |
$11,291 |
$12,604 |
5/18 |
$10,332 |
$12,593 |
$11,345 |
$12,907 |
6/18 |
$10,530 |
$12,587 |
$11,495 |
$12,987 |
7/18 |
$11,201 |
$12,980 |
$12,202 |
$13,470 |
8/18 |
$11,546 |
$13,141 |
$12,562 |
$13,909 |
9/18 |
$11,763 |
$13,214 |
$12,817 |
$13,988 |
10/18 |
$11,023 |
$12,244 |
$11,974 |
$13,032 |
11/18 |
$11,684 |
$12,383 |
$12,627 |
$13,297 |
12/18 |
$10,772 |
$11,441 |
$11,608 |
$12,097 |
1/19 |
$11,488 |
$12,332 |
$12,206 |
$13,066 |
2/19 |
$11,748 |
$12,703 |
$12,447 |
$13,486 |
3/19 |
$11,976 |
$12,869 |
$12,553 |
$13,748 |
4/19 |
$11,613 |
$13,326 |
$12,229 |
$14,304 |
5/19 |
$11,385 |
$12,557 |
$11,936 |
$13,395 |
6/19 |
$12,205 |
$13,384 |
$12,741 |
$14,339 |
7/19 |
$12,049 |
$13,451 |
$12,600 |
$14,546 |
8/19 |
$12,049 |
$13,175 |
$12,596 |
$14,315 |
9/19 |
$11,966 |
$13,456 |
$12,583 |
$14,583 |
10/19 |
$12,485 |
$13,798 |
$13,211 |
$14,899 |
11/19 |
$13,056 |
$14,182 |
$13,835 |
$15,440 |
12/19 |
$13,572 |
$14,607 |
$14,306 |
$15,906 |
1/20 |
$13,353 |
$14,518 |
$14,103 |
$15,899 |
2/20 |
$12,487 |
$13,291 |
$13,139 |
$14,591 |
3/20 |
$12,071 |
$11,532 |
$12,664 |
$12,788 |
4/20 |
$13,419 |
$12,792 |
$14,134 |
$14,428 |
5/20 |
$13,923 |
$13,410 |
$14,705 |
$15,115 |
6/20 |
$13,781 |
$13,765 |
$14,508 |
$15,416 |
7/20 |
$14,285 |
$14,423 |
$15,103 |
$16,285 |
8/20 |
$14,669 |
$15,387 |
$15,414 |
$17,455 |
9/20 |
$14,439 |
$14,856 |
$15,201 |
$16,792 |
10/20 |
$13,781 |
$14,400 |
$14,460 |
$16,346 |
11/20 |
$14,789 |
$16,242 |
$15,754 |
$18,135 |
12/20 |
$15,341 |
$16,930 |
$16,240 |
$18,832 |
1/21 |
$15,282 |
$16,762 |
$16,413 |
$18,642 |
2/21 |
$15,070 |
$17,192 |
$15,967 |
$19,156 |
3/21 |
$15,400 |
$17,764 |
$16,358 |
$19,995 |
4/21 |
$16,037 |
$18,590 |
$16,982 |
$21,062 |
5/21 |
$16,367 |
$18,858 |
$17,332 |
$21,209 |
6/21 |
$16,814 |
$19,139 |
$17,851 |
$21,704 |
7/21 |
$17,392 |
$19,482 |
$18,515 |
$22,220 |
8/21 |
$17,981 |
$19,967 |
$19,029 |
$22,895 |
9/21 |
$16,932 |
$19,138 |
$18,032 |
$21,831 |
10/21 |
$18,063 |
$20,222 |
$18,793 |
$23,360 |
11/21 |
$17,274 |
$19,779 |
$18,122 |
$23,198 |
12/21 |
$18,725 |
$20,624 |
$19,457 |
$24,238 |
1/22 |
$17,060 |
$19,533 |
$18,019 |
$22,984 |
2/22 |
$17,124 |
$19,039 |
$17,939 |
$22,295 |
3/22 |
$18,059 |
$19,561 |
$18,803 |
$23,123 |
4/22 |
$17,124 |
$17,936 |
$17,932 |
$21,107 |
5/22 |
$17,009 |
$17,950 |
$18,020 |
$21,146 |
6/22 |
$16,714 |
$16,395 |
$17,448 |
$19,400 |
7/22 |
$17,278 |
$17,697 |
$18,018 |
$21,189 |
8/22 |
$15,946 |
$16,957 |
$16,933 |
$20,325 |
9/22 |
$15,241 |
$15,380 |
$16,266 |
$18,453 |
10/22 |
$16,368 |
$16,485 |
$17,633 |
$19,947 |
11/22 |
$17,239 |
$17,631 |
$18,624 |
$21,062 |
12/22 |
$16,959 |
$16,882 |
$18,403 |
$19,848 |
1/23 |
$16,866 |
$18,077 |
$18,284 |
$21,095 |
2/23 |
$16,238 |
$17,642 |
$17,538 |
$20,581 |
3/23 |
$16,893 |
$18,188 |
$18,109 |
$21,336 |
4/23 |
$17,494 |
$18,506 |
$18,742 |
$21,669 |
5/23 |
$16,959 |
$18,322 |
$17,974 |
$21,763 |
6/23 |
$17,467 |
$19,430 |
$18,547 |
$23,201 |
7/23 |
$17,681 |
$20,082 |
$18,787 |
$23,947 |
8/23 |
$17,574 |
$19,603 |
$18,642 |
$23,566 |
9/23 |
$16,906 |
$18,757 |
$18,036 |
$22,442 |
10/23 |
$16,171 |
$18,213 |
$17,294 |
$21,970 |
11/23 |
$17,173 |
$19,920 |
$18,286 |
$23,977 |
12/23 |
$17,920 |
$20,898 |
$19,095 |
$25,066 |
1/24 |
$18,386 |
$21,149 |
$19,608 |
$25,487 |
2/24 |
$18,990 |
$22,046 |
$20,049 |
$26,848 |
3/24 |
$19,346 |
$22,754 |
$20,521 |
$27,712 |
4/24 |
$18,565 |
$21,909 |
$19,710 |
$26,580 |
5/24 |
$19,223 |
$22,887 |
$20,236 |
$27,898 |
6/24 |
$19,730 |
$23,353 |
$20,619 |
$28,899 |
7/24 |
$20,361 |
$23,765 |
$21,294 |
$29,251 |
8/24 |
$21,471 |
$24,393 |
$22,463 |
$29,960 |
9/24 |
$20,868 |
$24,839 |
$21,794 |
$30,600 |
10/24 |
$19,894 |
$24,347 |
$20,743 |
$30,323 |
11/24 |
$19,771 |
$25,464 |
$20,562 |
$32,102 |
12/24 |
$18,552 |
$24,800 |
$19,310 |
$31,337 |
1/25 |
$19,770 |
$25,675 |
$20,545 |
$32,210 |
2/25 |
$20,000 |
$25,491 |
$20,776 |
$31,790 |
3/25 |
$19,197 |
$24,356 |
$20,295 |
$29,998 |
4/25 |
$18,853 |
$24,572 |
$19,911 |
$29,795 |
5/25 |
$18,179 |
$26,027 |
$19,187 |
$31,670 |
6/25 |
$18,365 |
$27,150 |
$19,465 |
$33,281 |
7/25 |
$17,634 |
$27,499 |
$18,886 |
$34,028 |
8/25 |
$18,494 |
$28,217 |
$19,858 |
$34,718 |
9/25 |
$18,437 |
$29,124 |
$20,050 |
$35,985 |
10/25 |
$19,082 |
$29,707 |
$20,672 |
$36,827 |
11/25 |
$20,544 |
$29,791 |
$22,351 |
$36,918 |
12/25 |
$20,460 |
$30,032 |
$22,174 |
$36,940 |
1/26 |
$20,522 |
$30,704 |
$22,417 |
$37,476 |
2/26 |
$20,830 |
$30,929 |
$23,065 |
$37,191 |
3/26 |
$19,243 |
$28,959 |
$21,154 |
$35,339 |
4/26 |
$19,074 |
$31,736 |
$21,103 |
$39,047 |
5/26 |
$19,212 |
$33,181 |
$21,507 |
$41,102 |
6/26 |
$20,337 |
$32,943 |
$22,582 |
$40,711 |
7/26 |
$20,460 |
$33,112 |
$22,909 |
$40,685 |
8/26 |
$21,164 |
$33,965 |
$23,759 |
$41,793 | |
|
| Average Annual Return [Table Text Block] |
Average Annual Total Returns (%)
Table Summary
Fund |
1 Year |
5 Years |
10 Years |
Class A |
14.46% |
3.32% |
8.37% |
Class A with 5.25% Maximum Sales Charge |
8.49% |
2.20% |
7.78% |
MSCI World Index (net of foreign withholding taxes) |
20.37% |
11.20% |
13.00% |
MSCI World Health Care Index (net of foreign withholding taxes) |
19.65% |
4.54% |
9.03% |
S&P 500® Index |
20.38% |
12.78% |
15.37% | Performance does not reflect the deduction of taxes that a shareholder would pay on Fund distributions or redemption of Fund shares. Performance assumes that all dividends and distributions, if any, were reinvested. For more recent performance information, visit www.eatonvance.com/performance.php. THE FUND'S PAST PERFORMANCE IS NO GUARANTEE OF FUTURE RESULTS. |
|
| No Deduction of Taxes [Text Block] |
Performance does not reflect the deduction of taxes that a shareholder would pay on Fund distributions or redemption of Fund shares.
|
|
| Updated Performance Information Location [Text Block] |
For more recent performance information, visit www.eatonvance.com/performance.php.
|
|
| AssetsNet |
$ 805,680,610
|
|
| Holdings Count | Holding |
41
|
|
| Advisory Fees Paid, Amount |
$ 4,518,327
|
|
| InvestmentCompanyPortfolioTurnover |
30.00%
|
|
| Additional Fund Statistics [Text Block] |
Table Summary
Total Net Assets |
$805,680,610 |
# of Portfolio Holdings |
41 |
Portfolio Turnover Rate |
30% |
Total Advisory Fees Paid |
$4,518,327 | |
|
| Holdings [Text Block] |
Sector Allocation (% of total investments)
Table Summary
Value |
Value |
Short-Term Investments |
0.7% |
Health Care Technology |
1.4% |
Health Care Supplies |
1.9% |
Health Care Services |
3.6% |
Managed Health Care |
5.3% |
Life Sciences Tools & Services |
8.6% |
Health Care Equipment |
11.6% |
Biotechnology |
21.5% |
Pharmaceuticals |
45.4% | |
|
| Largest Holdings [Text Block] |
Top Ten Holdings (% of total investments)Footnote Referencea
Table Summary
Eli Lilly & Co. |
12.0% |
Johnson & Johnson |
7.2% |
AbbVie, Inc |
7.2% |
Merck & Co., Inc. |
6.0% |
Roche Holding AG |
5.3% |
UnitedHealth Group, Inc. |
5.3% |
AstraZeneca PLC |
4.3% |
Bristol-Myers Squibb Co. |
4.3% |
Vertex Pharmaceuticals, Inc. |
3.7% |
Abbott Laboratories |
3.3% |
Total |
58.6% |
| Footnote |
Description |
Footnotea |
Excluding cash equivalents | |
|
| Material Fund Change [Text Block] |
|
|
| Updated Prospectus Phone Number |
1-800-262-1122
|
|
| C000014193 |
|
|
| Shareholder Report [Line Items] |
|
|
| Fund Name |
Eaton Vance Worldwide Health Sciences Fund
|
|
| Class Name |
Class C
|
|
| Trading Symbol |
ECHSX
|
|
| Annual or Semi-Annual Statement [Text Block] |
This annual shareholder report contains important information about the Eaton Vance Worldwide Health Sciences Fund for the period of September 1, 2025 to August 31, 2026.
|
|
| Additional Information [Text Block] |
You can find additional information about the Fund at www.eatonvance.com/open-end-mutual-fund-documents.php. You can also request this information by contacting us at 1-800-262-1122.
|
|
| Additional Information Phone Number |
1-800-262-1122
|
|
| Additional Information Website |
<span style="box-sizing: border-box; color: rgb(0, 0, 0); display: inline; flex-wrap: nowrap; font-size: 10.6667px; font-weight: 400; grid-area: auto; line-height: 16px; margin: 0px; overflow: visible; text-align: left; text-align-last: auto; white-space-collapse: preserve-breaks;">www.eatonvance.com/open-end-mutual-fund-documents.php</span>
|
|
| Expenses [Text Block] |
What were the Fund costs for the last year?(based on a hypothetical $10,000 investment)
Table Summary
Class Name |
Costs of a $10,000 investment |
Costs paid as a percentage of a $10,000 investment |
Class C |
$201 |
1.88% | |
|
| Expenses Paid, Amount |
$ 201
|
|
| Expense Ratio, Percent |
1.88%
|
|
| Factors Affecting Performance [Text Block] |
How did the Fund perform last year and what affected its performance?Key contributors to (↑) and detractors from (↓) performance, relative to the MSCI World Health Care Index (the Index): ↓ Overweight to Zoetis, Inc. detracted due to its lowered 2026 guidance on weaker US pet demand and competition in dermatology and parasiticide products. This was sold by period end ↓ Overweight to Boston Scientific Corp. detracted as its 2026 growth outlook was cut on weaker WATCHMAN demand and electrophysiology US market share losses. This was sold by period end ↓ Overweight to CSL Ltd. hurt due to weaker US flu vaccine demand, lower immunoglobulin and China albumin sales and a chief executive officer change. This was sold by period end ↓ On an industry basis, stock selection in biotechnology detracted the most, followed by health care equipment and supplies, and life science tools and services ↑ Overweight to Eli Lilly & Co. helped as strong Mounjaro and Zepbound GLP-1 drugs sales and US approval of obesity pill Foundayo supported shares ↑ Out-of-index allocation to Structure Therapeutics, Inc. added as shares rose on strong mid-stage trial results for its oral weight-loss drug. This was sold by period end ↑ Overweight to Bristol Myers Squibb Co. helped as growth from newer drugs in cardiomyopathy and blood cancers more than offset declines in older drugs ↑ Stock selection in pharmaceuticals and health care technology helped returns |
|
| Performance Past Does Not Indicate Future [Text] |
THE FUND'S PAST PERFORMANCE IS NO GUARANTEE OF FUTURE RESULTS.
|
|
| Line Graph [Table Text Block] |
Comparison of the change in value of a $10,000 investment for the period indicated.
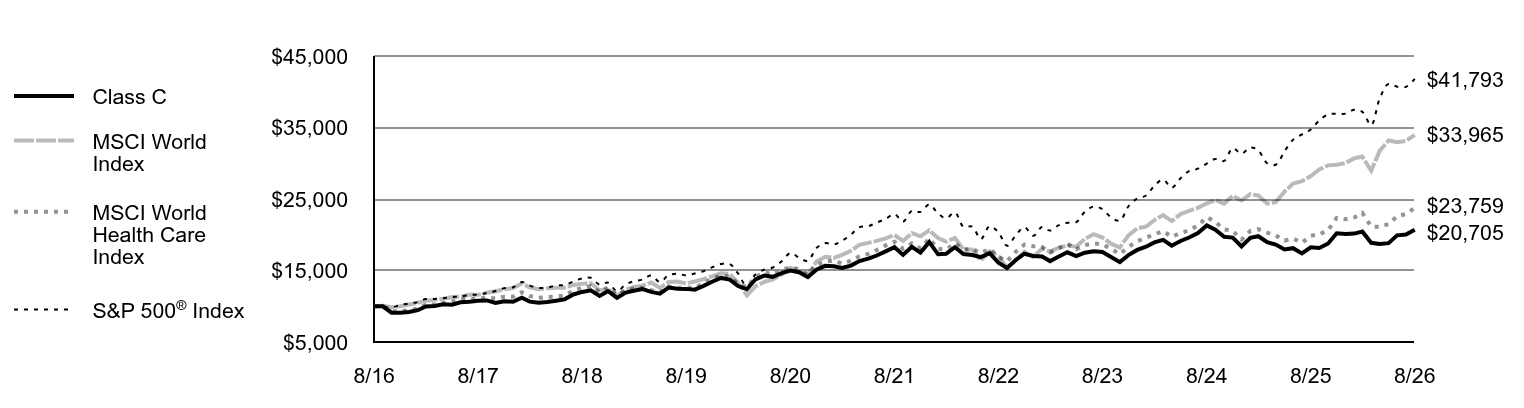
Table Summary
|
Class C |
MSCI World Index |
MSCI World Health Care Index |
S&P 500® Index |
8/16 |
$10,000 |
$10,000 |
$10,000 |
$10,000 |
9/16 |
$9,991 |
$10,053 |
$9,987 |
$10,002 |
10/16 |
$9,093 |
$9,859 |
$9,297 |
$9,819 |
11/16 |
$9,075 |
$10,000 |
$9,306 |
$10,183 |
12/16 |
$9,199 |
$10,240 |
$9,452 |
$10,384 |
1/17 |
$9,447 |
$10,487 |
$9,659 |
$10,581 |
2/17 |
$9,973 |
$10,778 |
$10,217 |
$11,001 |
3/17 |
$10,033 |
$10,892 |
$10,250 |
$11,014 |
4/17 |
$10,271 |
$11,054 |
$10,443 |
$11,127 |
5/17 |
$10,212 |
$11,288 |
$10,671 |
$11,284 |
6/17 |
$10,559 |
$11,331 |
$10,961 |
$11,354 |
7/17 |
$10,628 |
$11,602 |
$10,969 |
$11,588 |
8/17 |
$10,767 |
$11,619 |
$11,077 |
$11,623 |
9/17 |
$10,817 |
$11,879 |
$11,226 |
$11,863 |
10/17 |
$10,450 |
$12,104 |
$11,080 |
$12,140 |
11/17 |
$10,698 |
$12,366 |
$11,331 |
$12,512 |
12/17 |
$10,618 |
$12,533 |
$11,324 |
$12,651 |
1/18 |
$11,189 |
$13,195 |
$11,958 |
$13,376 |
2/18 |
$10,648 |
$12,648 |
$11,422 |
$12,883 |
3/18 |
$10,485 |
$12,373 |
$11,184 |
$12,555 |
4/18 |
$10,597 |
$12,515 |
$11,291 |
$12,604 |
5/18 |
$10,771 |
$12,593 |
$11,345 |
$12,907 |
6/18 |
$10,965 |
$12,587 |
$11,495 |
$12,987 |
7/18 |
$11,648 |
$12,980 |
$12,202 |
$13,470 |
8/18 |
$12,005 |
$13,141 |
$12,562 |
$13,909 |
9/18 |
$12,219 |
$13,214 |
$12,817 |
$13,988 |
10/18 |
$11,444 |
$12,244 |
$11,974 |
$13,032 |
11/18 |
$12,127 |
$12,383 |
$12,627 |
$13,297 |
12/18 |
$11,175 |
$11,441 |
$11,608 |
$12,097 |
1/19 |
$11,909 |
$12,332 |
$12,206 |
$13,066 |
2/19 |
$12,164 |
$12,703 |
$12,447 |
$13,486 |
3/19 |
$12,398 |
$12,869 |
$12,553 |
$13,748 |
4/19 |
$12,015 |
$13,326 |
$12,229 |
$14,304 |
5/19 |
$11,771 |
$12,557 |
$11,936 |
$13,395 |
6/19 |
$12,611 |
$13,384 |
$12,741 |
$14,339 |
7/19 |
$12,440 |
$13,451 |
$12,600 |
$14,546 |
8/19 |
$12,430 |
$13,175 |
$12,596 |
$14,315 |
9/19 |
$12,324 |
$13,456 |
$12,583 |
$14,583 |
10/19 |
$12,855 |
$13,798 |
$13,211 |
$14,899 |
11/19 |
$13,429 |
$14,182 |
$13,835 |
$15,440 |
12/19 |
$13,958 |
$14,607 |
$14,306 |
$15,906 |
1/20 |
$13,725 |
$14,518 |
$14,103 |
$15,899 |
2/20 |
$12,825 |
$13,291 |
$13,139 |
$14,591 |
3/20 |
$12,380 |
$11,532 |
$12,664 |
$12,788 |
4/20 |
$13,769 |
$12,792 |
$14,134 |
$14,428 |
5/20 |
$14,281 |
$13,410 |
$14,705 |
$15,115 |
6/20 |
$14,114 |
$13,765 |
$14,508 |
$15,416 |
7/20 |
$14,625 |
$14,423 |
$15,103 |
$16,285 |
8/20 |
$15,003 |
$15,387 |
$15,414 |
$17,455 |
9/20 |
$14,758 |
$14,856 |
$15,201 |
$16,792 |
10/20 |
$14,081 |
$14,400 |
$14,460 |
$16,346 |
11/20 |
$15,103 |
$16,242 |
$15,754 |
$18,135 |
12/20 |
$15,655 |
$16,930 |
$16,240 |
$18,832 |
1/21 |
$15,584 |
$16,762 |
$16,413 |
$18,642 |
2/21 |
$15,359 |
$17,192 |
$15,967 |
$19,156 |
3/21 |
$15,690 |
$17,764 |
$16,358 |
$19,995 |
4/21 |
$16,329 |
$18,590 |
$16,982 |
$21,062 |
5/21 |
$16,660 |
$18,858 |
$17,332 |
$21,209 |
6/21 |
$17,097 |
$19,139 |
$17,851 |
$21,704 |
7/21 |
$17,677 |
$19,482 |
$18,515 |
$22,220 |
8/21 |
$18,256 |
$19,967 |
$19,029 |
$22,895 |
9/21 |
$17,180 |
$19,138 |
$18,032 |
$21,831 |
10/21 |
$18,315 |
$20,222 |
$18,793 |
$23,360 |
11/21 |
$17,511 |
$19,779 |
$18,122 |
$23,198 |
12/21 |
$18,972 |
$20,624 |
$19,457 |
$24,238 |
1/22 |
$17,265 |
$19,533 |
$18,019 |
$22,984 |
2/22 |
$17,329 |
$19,039 |
$17,939 |
$22,295 |
3/22 |
$18,259 |
$19,561 |
$18,803 |
$23,123 |
4/22 |
$17,304 |
$17,936 |
$17,932 |
$21,107 |
5/22 |
$17,176 |
$17,950 |
$18,020 |
$21,146 |
6/22 |
$16,871 |
$16,395 |
$17,448 |
$19,400 |
7/22 |
$17,418 |
$17,697 |
$18,018 |
$21,189 |
8/22 |
$16,081 |
$16,957 |
$16,933 |
$20,325 |
9/22 |
$15,356 |
$15,380 |
$16,266 |
$18,453 |
10/22 |
$16,476 |
$16,485 |
$17,633 |
$19,947 |
11/22 |
$17,342 |
$17,631 |
$18,624 |
$21,062 |
12/22 |
$17,041 |
$16,882 |
$18,403 |
$19,848 |
1/23 |
$16,949 |
$18,077 |
$18,284 |
$21,095 |
2/23 |
$16,313 |
$17,642 |
$17,538 |
$20,581 |
3/23 |
$16,949 |
$18,188 |
$18,109 |
$21,336 |
4/23 |
$17,545 |
$18,506 |
$18,742 |
$21,669 |
5/23 |
$17,002 |
$18,322 |
$17,974 |
$21,763 |
6/23 |
$17,492 |
$19,430 |
$18,547 |
$23,201 |
7/23 |
$17,704 |
$20,082 |
$18,787 |
$23,947 |
8/23 |
$17,585 |
$19,603 |
$18,642 |
$23,566 |
9/23 |
$16,896 |
$18,757 |
$18,036 |
$22,442 |
10/23 |
$16,167 |
$18,213 |
$17,294 |
$21,970 |
11/23 |
$17,147 |
$19,920 |
$18,286 |
$23,977 |
12/23 |
$17,878 |
$20,898 |
$19,095 |
$25,066 |
1/24 |
$18,326 |
$21,149 |
$19,608 |
$25,487 |
2/24 |
$18,923 |
$22,046 |
$20,049 |
$26,848 |
3/24 |
$19,276 |
$22,754 |
$20,521 |
$27,712 |
4/24 |
$18,475 |
$21,909 |
$19,710 |
$26,580 |
5/24 |
$19,127 |
$22,887 |
$20,236 |
$27,898 |
6/24 |
$19,615 |
$23,353 |
$20,619 |
$28,899 |
7/24 |
$20,240 |
$23,765 |
$21,294 |
$29,251 |
8/24 |
$21,312 |
$24,393 |
$22,463 |
$29,960 |
9/24 |
$20,715 |
$24,839 |
$21,794 |
$30,600 |
10/24 |
$19,724 |
$24,347 |
$20,743 |
$30,323 |
11/24 |
$19,602 |
$25,464 |
$20,562 |
$32,102 |
12/24 |
$18,363 |
$24,800 |
$19,310 |
$31,337 |
1/25 |
$19,567 |
$25,675 |
$20,545 |
$32,210 |
2/25 |
$19,794 |
$25,491 |
$20,776 |
$31,790 |
3/25 |
$18,972 |
$24,356 |
$20,295 |
$29,998 |
4/25 |
$18,632 |
$24,572 |
$19,911 |
$29,795 |
5/25 |
$17,952 |
$26,027 |
$19,187 |
$31,670 |
6/25 |
$18,122 |
$27,150 |
$19,465 |
$33,281 |
7/25 |
$17,385 |
$27,499 |
$18,886 |
$34,028 |
8/25 |
$18,235 |
$28,217 |
$19,858 |
$34,718 |
9/25 |
$18,150 |
$29,124 |
$20,050 |
$35,985 |
10/25 |
$18,774 |
$29,707 |
$20,672 |
$36,827 |
11/25 |
$20,205 |
$29,791 |
$22,351 |
$36,918 |
12/25 |
$20,100 |
$30,032 |
$22,174 |
$36,940 |
1/26 |
$20,161 |
$30,704 |
$22,417 |
$37,476 |
2/26 |
$20,448 |
$30,929 |
$23,065 |
$37,191 |
3/26 |
$18,875 |
$28,959 |
$21,154 |
$35,339 |
4/26 |
$18,694 |
$31,736 |
$21,103 |
$39,047 |
5/26 |
$18,830 |
$33,181 |
$21,507 |
$41,102 |
6/26 |
$19,919 |
$32,943 |
$22,582 |
$40,711 |
7/26 |
$20,025 |
$33,112 |
$22,909 |
$40,685 |
8/26 |
$20,705 |
$33,965 |
$23,759 |
$41,793 | |
|
| Average Annual Return [Table Text Block] |
Average Annual Total Returns (%)
Table Summary
Fund |
1 Year |
5 Years |
10 Years |
Class C, with conversion to Class A after 8 years |
13.55% |
2.55% |
7.55% |
Class C, with 1% Maximum Contingent Deferred Sales Charge and conversion to Class A after 8 years |
12.55% |
2.55% |
7.55% |
MSCI World Index (net of foreign withholding taxes) |
20.37% |
11.20% |
13.00% |
MSCI World Health Care Index (net of foreign withholding taxes) |
19.65% |
4.54% |
9.03% |
S&P 500® Index |
20.38% |
12.78% |
15.37% | Performance does not reflect the deduction of taxes that a shareholder would pay on Fund distributions or redemption of Fund shares. Performance assumes that all dividends and distributions, if any, were reinvested. For more recent performance information, visit www.eatonvance.com/performance.php. THE FUND'S PAST PERFORMANCE IS NO GUARANTEE OF FUTURE RESULTS. |
|
| No Deduction of Taxes [Text Block] |
Performance does not reflect the deduction of taxes that a shareholder would pay on Fund distributions or redemption of Fund shares.
|
|
| Updated Performance Information Location [Text Block] |
For more recent performance information, visit www.eatonvance.com/performance.php.
|
|
| AssetsNet |
$ 805,680,610
|
|
| Holdings Count | Holding |
41
|
|
| Advisory Fees Paid, Amount |
$ 4,518,327
|
|
| InvestmentCompanyPortfolioTurnover |
30.00%
|
|
| Additional Fund Statistics [Text Block] |
Table Summary
Total Net Assets |
$805,680,610 |
# of Portfolio Holdings |
41 |
Portfolio Turnover Rate |
30% |
Total Advisory Fees Paid |
$4,518,327 | |
|
| Holdings [Text Block] |
Sector Allocation (% of total investments)
Table Summary
Value |
Value |
Short-Term Investments |
0.7% |
Health Care Technology |
1.4% |
Health Care Supplies |
1.9% |
Health Care Services |
3.6% |
Managed Health Care |
5.3% |
Life Sciences Tools & Services |
8.6% |
Health Care Equipment |
11.6% |
Biotechnology |
21.5% |
Pharmaceuticals |
45.4% | |
|
| Largest Holdings [Text Block] |
Top Ten Holdings (% of total investments)Footnote Referencea
Table Summary
Eli Lilly & Co. |
12.0% |
Johnson & Johnson |
7.2% |
AbbVie, Inc |
7.2% |
Merck & Co., Inc. |
6.0% |
Roche Holding AG |
5.3% |
UnitedHealth Group, Inc. |
5.3% |
AstraZeneca PLC |
4.3% |
Bristol-Myers Squibb Co. |
4.3% |
Vertex Pharmaceuticals, Inc. |
3.7% |
Abbott Laboratories |
3.3% |
Total |
58.6% |
| Footnote |
Description |
Footnotea |
Excluding cash equivalents | |
|
| Material Fund Change [Text Block] |
|
|
| Updated Prospectus Phone Number |
1-800-262-1122
|
|
| C000081646 |
|
|
| Shareholder Report [Line Items] |
|
|
| Fund Name |
Eaton Vance Worldwide Health Sciences Fund
|
|
| Class Name |
Class I
|
|
| Trading Symbol |
EIHSX
|
|
| Annual or Semi-Annual Statement [Text Block] |
This annual shareholder report contains important information about the Eaton Vance Worldwide Health Sciences Fund for the period of September 1, 2025 to August 31, 2026.
|
|
| Additional Information [Text Block] |
You can find additional information about the Fund at www.eatonvance.com/open-end-mutual-fund-documents.php. You can also request this information by contacting us at 1-800-262-1122.
|
|
| Additional Information Phone Number |
1-800-262-1122
|
|
| Additional Information Website |
<span style="box-sizing: border-box; color: rgb(0, 0, 0); display: inline; flex-wrap: nowrap; font-size: 10.6667px; font-weight: 400; grid-area: auto; line-height: 16px; margin: 0px; overflow: visible; text-align: left; text-align-last: auto; white-space-collapse: preserve-breaks;">www.eatonvance.com/open-end-mutual-fund-documents.php</span>
|
|
| Expenses [Text Block] |
What were the Fund costs for the last year?(based on a hypothetical $10,000 investment)
Table Summary
Class Name |
Costs of a $10,000 investment |
Costs paid as a percentage of a $10,000 investment |
Class I |
$94 |
0.88% | |
|
| Expenses Paid, Amount |
$ 94
|
|
| Expense Ratio, Percent |
0.88%
|
|
| Factors Affecting Performance [Text Block] |
How did the Fund perform last year and what affected its performance?Key contributors to (↑) and detractors from (↓) performance, relative to the MSCI World Health Care Index (the Index): ↓ Overweight to Zoetis, Inc. detracted due to its lowered 2026 guidance on weaker US pet demand and competition in dermatology and parasiticide products. This was sold by period end ↓ Overweight to Boston Scientific Corp. detracted as its 2026 growth outlook was cut on weaker WATCHMAN demand and electrophysiology US market share losses. This was sold by period end ↓ Overweight to CSL Ltd. hurt due to weaker US flu vaccine demand, lower immunoglobulin and China albumin sales and a chief executive officer change. This was sold by period end ↓ On an industry basis, stock selection in biotechnology detracted the most, followed by health care equipment and supplies, and life science tools and services ↑ Overweight to Eli Lilly & Co. helped as strong Mounjaro and Zepbound GLP-1 drugs sales and US approval of obesity pill Foundayo supported shares ↑ Out-of-index allocation to Structure Therapeutics, Inc. added as shares rose on strong mid-stage trial results for its oral weight-loss drug. This was sold by period end ↑ Overweight to Bristol Myers Squibb Co. helped as growth from newer drugs in cardiomyopathy and blood cancers more than offset declines in older drugs ↑ Stock selection in pharmaceuticals and health care technology helped returns |
|
| Performance Past Does Not Indicate Future [Text] |
THE FUND'S PAST PERFORMANCE IS NO GUARANTEE OF FUTURE RESULTS.
|
|
| Line Graph [Table Text Block] |
Comparison of the change in value of a $1,000,000 investment for the period indicated.
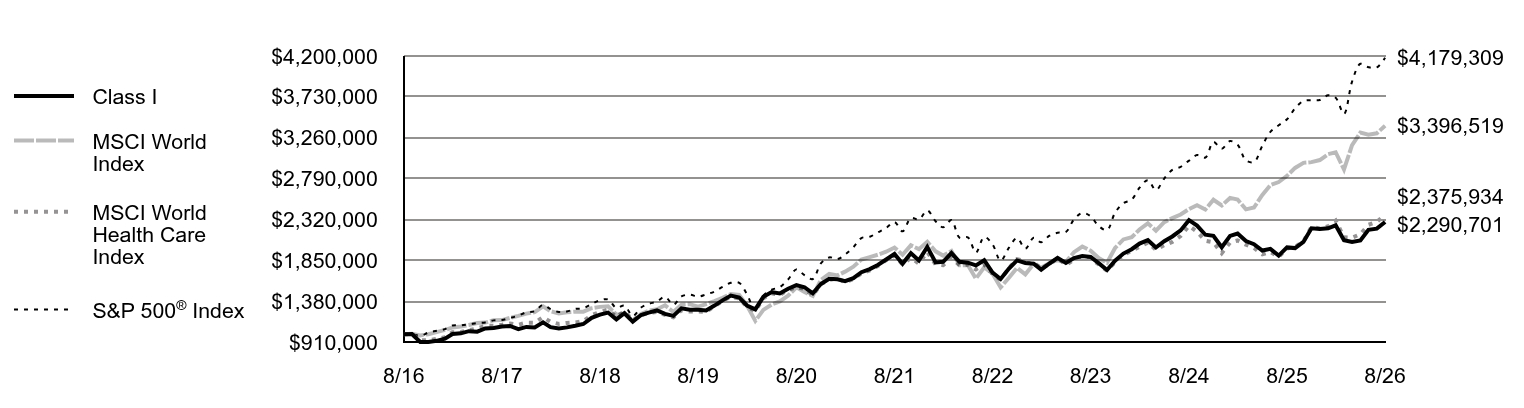
Table Summary
|
Class I |
MSCI World Index |
MSCI World Health Care Index |
S&P 500® Index |
8/16 |
$1,000,000 |
$1,000,000 |
$1,000,000 |
$1,000,000 |
9/16 |
$1,000,882 |
$1,005,312 |
$998,682 |
$1,000,189 |
10/16 |
$910,935 |
$985,856 |
$929,748 |
$981,944 |
11/16 |
$910,053 |
$1,000,032 |
$930,578 |
$1,018,311 |
12/16 |
$923,384 |
$1,023,961 |
$945,203 |
$1,038,439 |
1/17 |
$949,199 |
$1,048,674 |
$965,864 |
$1,058,134 |
2/17 |
$1,002,815 |
$1,077,768 |
$1,021,719 |
$1,100,148 |
3/17 |
$1,009,765 |
$1,089,249 |
$1,024,978 |
$1,101,432 |
4/17 |
$1,034,587 |
$1,105,377 |
$1,044,335 |
$1,112,743 |
5/17 |
$1,028,630 |
$1,128,761 |
$1,067,108 |
$1,128,403 |
6/17 |
$1,065,367 |
$1,133,104 |
$1,096,060 |
$1,135,446 |
7/17 |
$1,072,317 |
$1,160,221 |
$1,096,879 |
$1,158,793 |
8/17 |
$1,088,203 |
$1,161,855 |
$1,107,685 |
$1,162,341 |
9/17 |
$1,094,160 |
$1,187,932 |
$1,122,575 |
$1,186,318 |
10/17 |
$1,057,424 |
$1,210,382 |
$1,108,042 |
$1,214,001 |
11/17 |
$1,083,239 |
$1,236,608 |
$1,133,096 |
$1,251,234 |
12/17 |
$1,076,222 |
$1,253,332 |
$1,132,355 |
$1,265,146 |
1/18 |
$1,135,389 |
$1,319,508 |
$1,195,817 |
$1,337,581 |
2/18 |
$1,081,322 |
$1,264,844 |
$1,142,206 |
$1,288,281 |
3/18 |
$1,065,001 |
$1,237,275 |
$1,118,444 |
$1,255,542 |
4/18 |
$1,078,262 |
$1,251,493 |
$1,129,123 |
$1,260,359 |
5/18 |
$1,096,624 |
$1,259,335 |
$1,134,461 |
$1,290,711 |
6/18 |
$1,117,026 |
$1,258,734 |
$1,149,547 |
$1,298,656 |
7/18 |
$1,188,435 |
$1,298,049 |
$1,220,164 |
$1,346,983 |
8/18 |
$1,225,159 |
$1,314,109 |
$1,256,240 |
$1,390,875 |
9/18 |
$1,248,621 |
$1,321,427 |
$1,281,698 |
$1,398,792 |
10/18 |
$1,170,072 |
$1,224,397 |
$1,197,421 |
$1,303,184 |
11/18 |
$1,240,460 |
$1,238,306 |
$1,262,679 |
$1,329,741 |
12/18 |
$1,143,967 |
$1,144,148 |
$1,160,819 |
$1,209,678 |
1/19 |
$1,220,232 |
$1,233,169 |
$1,220,580 |
$1,306,616 |
2/19 |
$1,248,159 |
$1,270,250 |
$1,244,670 |
$1,348,569 |
3/19 |
$1,272,865 |
$1,286,934 |
$1,255,274 |
$1,374,774 |
4/19 |
$1,234,195 |
$1,332,568 |
$1,222,914 |
$1,430,438 |
5/19 |
$1,210,564 |
$1,255,678 |
$1,193,620 |
$1,339,537 |
6/19 |
$1,297,570 |
$1,338,421 |
$1,274,142 |
$1,433,942 |
7/19 |
$1,281,458 |
$1,345,050 |
$1,259,971 |
$1,454,551 |
8/19 |
$1,281,458 |
$1,317,538 |
$1,259,593 |
$1,431,511 |
9/19 |
$1,272,865 |
$1,345,576 |
$1,258,271 |
$1,458,295 |
10/19 |
$1,328,720 |
$1,379,818 |
$1,321,088 |
$1,489,881 |
11/19 |
$1,388,873 |
$1,418,246 |
$1,383,514 |
$1,543,962 |
12/19 |
$1,444,651 |
$1,460,734 |
$1,430,637 |
$1,590,562 |
1/20 |
$1,421,936 |
$1,451,843 |
$1,410,306 |
$1,589,938 |
2/20 |
$1,329,942 |
$1,329,126 |
$1,313,907 |
$1,459,056 |
3/20 |
$1,285,649 |
$1,153,226 |
$1,266,442 |
$1,278,844 |
4/20 |
$1,429,886 |
$1,279,209 |
$1,413,443 |
$1,442,783 |
5/20 |
$1,484,402 |
$1,341,005 |
$1,470,475 |
$1,511,500 |
6/20 |
$1,468,501 |
$1,376,476 |
$1,450,803 |
$1,541,560 |
7/20 |
$1,523,016 |
$1,442,329 |
$1,510,310 |
$1,628,481 |
8/20 |
$1,563,903 |
$1,538,697 |
$1,541,354 |
$1,745,537 |
9/20 |
$1,540,052 |
$1,485,613 |
$1,520,141 |
$1,679,212 |
10/20 |
$1,469,637 |
$1,440,042 |
$1,445,978 |
$1,634,556 |
11/20 |
$1,577,532 |
$1,624,168 |
$1,575,398 |
$1,813,481 |
12/20 |
$1,637,445 |
$1,693,027 |
$1,624,043 |
$1,883,206 |
1/21 |
$1,631,340 |
$1,676,201 |
$1,641,339 |
$1,864,193 |
2/21 |
$1,609,361 |
$1,719,152 |
$1,596,701 |
$1,915,598 |
3/21 |
$1,644,772 |
$1,776,352 |
$1,635,794 |
$1,999,493 |
4/21 |
$1,713,151 |
$1,859,024 |
$1,698,242 |
$2,106,204 |
5/21 |
$1,748,562 |
$1,885,804 |
$1,733,170 |
$2,120,914 |
6/21 |
$1,796,184 |
$1,913,915 |
$1,785,103 |
$2,170,427 |
7/21 |
$1,858,458 |
$1,948,195 |
$1,851,526 |
$2,221,985 |
8/21 |
$1,921,953 |
$1,996,683 |
$1,902,892 |
$2,289,546 |
9/21 |
$1,809,615 |
$1,913,779 |
$1,803,151 |
$2,183,059 |
10/21 |
$1,931,722 |
$2,022,177 |
$1,879,271 |
$2,336,009 |
11/21 |
$1,848,689 |
$1,977,865 |
$1,812,183 |
$2,319,822 |
12/21 |
$2,003,808 |
$2,062,399 |
$1,945,660 |
$2,423,788 |
1/22 |
$1,825,986 |
$1,953,276 |
$1,801,902 |
$2,298,364 |
2/22 |
$1,832,621 |
$1,903,875 |
$1,793,858 |
$2,229,548 |
3/22 |
$1,933,475 |
$1,956,124 |
$1,880,252 |
$2,312,330 |
4/22 |
$1,832,621 |
$1,793,622 |
$1,793,158 |
$2,110,690 |
5/22 |
$1,822,005 |
$1,794,980 |
$1,801,999 |
$2,114,563 |
6/22 |
$1,791,484 |
$1,639,496 |
$1,744,836 |
$1,940,019 |
7/22 |
$1,851,200 |
$1,769,666 |
$1,801,797 |
$2,118,897 |
8/22 |
$1,709,208 |
$1,695,680 |
$1,693,263 |
$2,032,484 |
9/22 |
$1,634,895 |
$1,538,049 |
$1,626,587 |
$1,845,295 |
10/22 |
$1,754,327 |
$1,648,501 |
$1,763,274 |
$1,994,693 |
11/22 |
$1,848,546 |
$1,763,122 |
$1,862,377 |
$2,106,165 |
12/22 |
$1,818,650 |
$1,688,247 |
$1,840,318 |
$1,984,819 |
1/23 |
$1,810,333 |
$1,807,701 |
$1,828,409 |
$2,109,533 |
2/23 |
$1,742,410 |
$1,764,247 |
$1,753,803 |
$2,058,063 |
3/23 |
$1,813,105 |
$1,818,761 |
$1,810,868 |
$2,133,623 |
4/23 |
$1,878,255 |
$1,850,643 |
$1,874,184 |
$2,166,925 |
5/23 |
$1,820,036 |
$1,832,168 |
$1,797,438 |
$2,176,344 |
6/23 |
$1,875,482 |
$1,942,973 |
$1,854,727 |
$2,320,147 |
7/23 |
$1,899,047 |
$2,008,243 |
$1,878,665 |
$2,394,681 |
8/23 |
$1,887,958 |
$1,960,275 |
$1,864,194 |
$2,356,554 |
9/23 |
$1,817,263 |
$1,875,711 |
$1,803,564 |
$2,244,199 |
10/23 |
$1,738,252 |
$1,821,286 |
$1,729,396 |
$2,197,011 |
11/23 |
$1,844,987 |
$1,992,035 |
$1,828,560 |
$2,397,654 |
12/23 |
$1,927,315 |
$2,089,833 |
$1,909,460 |
$2,506,581 |
1/24 |
$1,977,172 |
$2,114,912 |
$1,960,751 |
$2,548,702 |
2/24 |
$2,042,698 |
$2,204,579 |
$2,004,918 |
$2,684,791 |
3/24 |
$2,081,159 |
$2,275,423 |
$2,052,115 |
$2,771,174 |
4/24 |
$1,997,114 |
$2,190,903 |
$1,971,005 |
$2,657,986 |
5/24 |
$2,069,763 |
$2,288,731 |
$2,023,648 |
$2,789,782 |
6/24 |
$2,123,893 |
$2,335,302 |
$2,061,944 |
$2,889,885 |
7/24 |
$2,193,692 |
$2,376,456 |
$2,129,370 |
$2,925,062 |
8/24 |
$2,311,924 |
$2,439,267 |
$2,246,342 |
$2,996,014 |
9/24 |
$2,249,247 |
$2,483,939 |
$2,179,380 |
$3,060,000 |
10/24 |
$2,143,835 |
$2,434,666 |
$2,074,300 |
$3,032,250 |
11/24 |
$2,131,015 |
$2,546,384 |
$2,056,189 |
$3,210,247 |
12/24 |
$1,999,397 |
$2,480,024 |
$1,931,039 |
$3,133,720 |
1/25 |
$2,130,602 |
$2,567,540 |
$2,054,537 |
$3,220,986 |
2/25 |
$2,157,440 |
$2,549,061 |
$2,077,635 |
$3,178,958 |
3/25 |
$2,070,963 |
$2,435,576 |
$2,029,457 |
$2,999,842 |
4/25 |
$2,035,180 |
$2,457,221 |
$1,991,067 |
$2,979,501 |
5/25 |
$1,962,122 |
$2,602,668 |
$1,918,694 |
$3,167,044 |
6/25 |
$1,981,505 |
$2,714,981 |
$1,946,455 |
$3,328,097 |
7/25 |
$1,903,974 |
$2,749,930 |
$1,888,646 |
$3,402,789 |
8/25 |
$1,997,906 |
$2,821,663 |
$1,985,798 |
$3,471,769 |
9/25 |
$1,990,451 |
$2,912,368 |
$2,004,972 |
$3,598,489 |
10/25 |
$2,060,527 |
$2,970,689 |
$2,067,162 |
$3,682,743 |
11/25 |
$2,218,570 |
$2,979,081 |
$2,235,131 |
$3,691,769 |
12/25 |
$2,210,607 |
$3,003,162 |
$2,217,402 |
$3,694,029 |
1/26 |
$2,218,616 |
$3,070,370 |
$2,241,688 |
$3,747,593 |
2/26 |
$2,252,256 |
$3,092,861 |
$2,306,469 |
$3,719,112 |
3/26 |
$2,080,854 |
$2,895,861 |
$2,115,381 |
$3,533,918 |
4/26 |
$2,061,631 |
$3,173,627 |
$2,110,320 |
$3,904,720 |
5/26 |
$2,079,252 |
$3,318,094 |
$2,150,733 |
$4,110,236 |
6/26 |
$2,200,995 |
$3,294,285 |
$2,258,203 |
$4,071,094 |
7/26 |
$2,213,810 |
$3,311,191 |
$2,290,852 |
$4,068,511 |
8/26 |
$2,290,701 |
$3,396,519 |
$2,375,934 |
$4,179,309 | |
|
| Average Annual Return [Table Text Block] |
Average Annual Total Returns (%)
Table Summary
Fund |
1 Year |
5 Years |
10 Years |
Class I |
14.66% |
3.57% |
8.64% |
MSCI World Index (net of foreign withholding taxes) |
20.37% |
11.20% |
13.00% |
MSCI World Health Care Index (net of foreign withholding taxes) |
19.65% |
4.54% |
9.03% |
S&P 500® Index |
20.38% |
12.78% |
15.37% | Performance does not reflect the deduction of taxes that a shareholder would pay on Fund distributions or redemption of Fund shares. Performance assumes that all dividends and distributions, if any, were reinvested. For more recent performance information, visit www.eatonvance.com/performance.php. THE FUND'S PAST PERFORMANCE IS NO GUARANTEE OF FUTURE RESULTS. |
|
| No Deduction of Taxes [Text Block] |
Performance does not reflect the deduction of taxes that a shareholder would pay on Fund distributions or redemption of Fund shares.
|
|
| Updated Performance Information Location [Text Block] |
For more recent performance information, visit www.eatonvance.com/performance.php.
|
|
| AssetsNet |
$ 805,680,610
|
|
| Holdings Count | Holding |
41
|
|
| Advisory Fees Paid, Amount |
$ 4,518,327
|
|
| InvestmentCompanyPortfolioTurnover |
30.00%
|
|
| Additional Fund Statistics [Text Block] |
Table Summary
Total Net Assets |
$805,680,610 |
# of Portfolio Holdings |
41 |
Portfolio Turnover Rate |
30% |
Total Advisory Fees Paid |
$4,518,327 | |
|
| Holdings [Text Block] |
Sector Allocation (% of total investments)
Table Summary
Value |
Value |
Short-Term Investments |
0.7% |
Health Care Technology |
1.4% |
Health Care Supplies |
1.9% |
Health Care Services |
3.6% |
Managed Health Care |
5.3% |
Life Sciences Tools & Services |
8.6% |
Health Care Equipment |
11.6% |
Biotechnology |
21.5% |
Pharmaceuticals |
45.4% | |
|
| Largest Holdings [Text Block] |
Top Ten Holdings (% of total investments)Footnote Referencea
Table Summary
Eli Lilly & Co. |
12.0% |
Johnson & Johnson |
7.2% |
AbbVie, Inc |
7.2% |
Merck & Co., Inc. |
6.0% |
Roche Holding AG |
5.3% |
UnitedHealth Group, Inc. |
5.3% |
AstraZeneca PLC |
4.3% |
Bristol-Myers Squibb Co. |
4.3% |
Vertex Pharmaceuticals, Inc. |
3.7% |
Abbott Laboratories |
3.3% |
Total |
58.6% |
| Footnote |
Description |
Footnotea |
Excluding cash equivalents | |
|
| Material Fund Change [Text Block] |
|
|
| Updated Prospectus Phone Number |
1-800-262-1122
|
|
| C000014194 |
|
|
| Shareholder Report [Line Items] |
|
|
| Fund Name |
Eaton Vance Worldwide Health Sciences Fund
|
|
| Class Name |
Class R
|
|
| Trading Symbol |
ERHSX
|
|
| Annual or Semi-Annual Statement [Text Block] |
This annual shareholder report contains important information about the Eaton Vance Worldwide Health Sciences Fund for the period of September 1, 2025 to August 31, 2026.
|
|
| Additional Information [Text Block] |
You can find additional information about the Fund at www.eatonvance.com/open-end-mutual-fund-documents.php. You can also request this information by contacting us at 1-800-262-1122.
|
|
| Additional Information Phone Number |
1-800-262-1122
|
|
| Additional Information Website |
<span style="box-sizing: border-box; color: rgb(0, 0, 0); display: inline; flex-wrap: nowrap; font-size: 10.6667px; font-weight: 400; grid-area: auto; line-height: 16px; margin: 0px; overflow: visible; text-align: left; text-align-last: auto; white-space-collapse: preserve-breaks;">www.eatonvance.com/open-end-mutual-fund-documents.php</span>
|
|
| Expenses [Text Block] |
What were the Fund costs for the last year?(based on a hypothetical $10,000 investment)
Table Summary
Class Name |
Costs of a $10,000 investment |
Costs paid as a percentage of a $10,000 investment |
Class R |
$148 |
1.38% | |
|
| Expenses Paid, Amount |
$ 148
|
|
| Expense Ratio, Percent |
1.38%
|
|
| Factors Affecting Performance [Text Block] |
How did the Fund perform last year and what affected its performance?Key contributors to (↑) and detractors from (↓) performance, relative to the MSCI World Health Care Index (the Index): ↓ Overweight to Zoetis, Inc. detracted due to its lowered 2026 guidance on weaker US pet demand and competition in dermatology and parasiticide products. This was sold by period end ↓ Overweight to Boston Scientific Corp. detracted as its 2026 growth outlook was cut on weaker WATCHMAN demand and electrophysiology US market share losses. This was sold by period end ↓ Overweight to CSL Ltd. hurt due to weaker US flu vaccine demand, lower immunoglobulin and China albumin sales and a chief executive officer change. This was sold by period end ↓ On an industry basis, stock selection in biotechnology detracted the most, followed by health care equipment and supplies, and life science tools and services ↑ Overweight to Eli Lilly & Co. helped as strong Mounjaro and Zepbound GLP-1 drugs sales and US approval of obesity pill Foundayo supported shares ↑ Out-of-index allocation to Structure Therapeutics, Inc. added as shares rose on strong mid-stage trial results for its oral weight-loss drug. This was sold by period end ↑ Overweight to Bristol Myers Squibb Co. helped as growth from newer drugs in cardiomyopathy and blood cancers more than offset declines in older drugs ↑ Stock selection in pharmaceuticals and health care technology helped returns |
|
| Performance Past Does Not Indicate Future [Text] |
THE FUND'S PAST PERFORMANCE IS NO GUARANTEE OF FUTURE RESULTS.
|
|
| Line Graph [Table Text Block] |
Comparison of the change in value of a $10,000 investment for the period indicated.
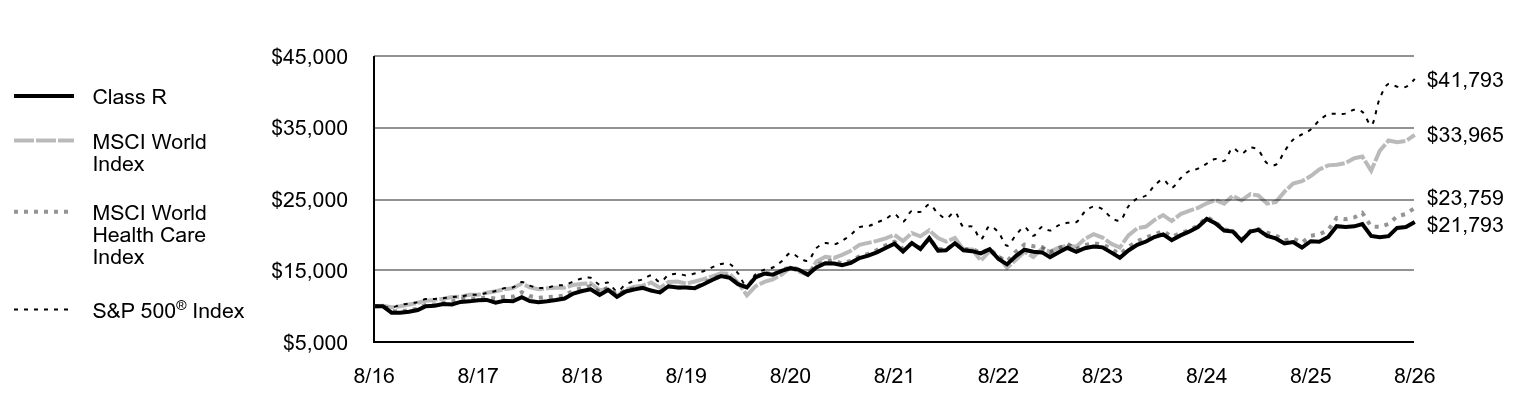
Table Summary
|
Class R |
MSCI World Index |
MSCI World Health Care Index |
S&P 500® Index |
8/16 |
$10,000 |
$10,000 |
$10,000 |
$10,000 |
9/16 |
$10,000 |
$10,053 |
$9,987 |
$10,002 |
10/16 |
$9,102 |
$9,859 |
$9,297 |
$9,819 |
11/16 |
$9,086 |
$10,000 |
$9,306 |
$10,183 |
12/16 |
$9,222 |
$10,240 |
$9,452 |
$10,384 |
1/17 |
$9,468 |
$10,487 |
$9,659 |
$10,581 |
2/17 |
$10,009 |
$10,778 |
$10,217 |
$11,001 |
3/17 |
$10,066 |
$10,892 |
$10,250 |
$11,014 |
4/17 |
$10,313 |
$11,054 |
$10,443 |
$11,127 |
5/17 |
$10,256 |
$11,288 |
$10,671 |
$11,284 |
6/17 |
$10,607 |
$11,331 |
$10,961 |
$11,354 |
7/17 |
$10,683 |
$11,602 |
$10,969 |
$11,588 |
8/17 |
$10,825 |
$11,619 |
$11,077 |
$11,623 |
9/17 |
$10,882 |
$11,879 |
$11,226 |
$11,863 |
10/17 |
$10,512 |
$12,104 |
$11,080 |
$12,140 |
11/17 |
$10,768 |
$12,366 |
$11,331 |
$12,512 |
12/17 |
$10,691 |
$12,533 |
$11,324 |
$12,651 |
1/18 |
$11,276 |
$13,195 |
$11,958 |
$13,376 |
2/18 |
$10,740 |
$12,648 |
$11,422 |
$12,883 |
3/18 |
$10,574 |
$12,373 |
$11,184 |
$12,555 |
4/18 |
$10,691 |
$12,515 |
$11,291 |
$12,604 |
5/18 |
$10,867 |
$12,593 |
$11,345 |
$12,907 |
6/18 |
$11,071 |
$12,587 |
$11,495 |
$12,987 |
7/18 |
$11,772 |
$12,980 |
$12,202 |
$13,470 |
8/18 |
$12,132 |
$13,141 |
$12,562 |
$13,909 |
9/18 |
$12,356 |
$13,214 |
$12,817 |
$13,988 |
10/18 |
$11,577 |
$12,244 |
$11,974 |
$13,032 |
11/18 |
$12,269 |
$12,383 |
$12,627 |
$13,297 |
12/18 |
$11,313 |
$11,441 |
$11,608 |
$12,097 |
1/19 |
$12,066 |
$12,332 |
$12,206 |
$13,066 |
2/19 |
$12,321 |
$12,703 |
$12,447 |
$13,486 |
3/19 |
$12,565 |
$12,869 |
$12,553 |
$13,748 |
4/19 |
$12,189 |
$13,326 |
$12,229 |
$14,304 |
5/19 |
$11,934 |
$12,557 |
$11,936 |
$13,395 |
6/19 |
$12,800 |
$13,384 |
$12,741 |
$14,339 |
7/19 |
$12,627 |
$13,451 |
$12,600 |
$14,546 |
8/19 |
$12,627 |
$13,175 |
$12,596 |
$14,315 |
9/19 |
$12,535 |
$13,456 |
$12,583 |
$14,583 |
10/19 |
$13,075 |
$13,798 |
$13,211 |
$14,899 |
11/19 |
$13,675 |
$14,182 |
$13,835 |
$15,440 |
12/19 |
$14,214 |
$14,607 |
$14,306 |
$15,906 |
1/20 |
$13,979 |
$14,518 |
$14,103 |
$15,899 |
2/20 |
$13,081 |
$13,291 |
$13,139 |
$14,591 |
3/20 |
$12,632 |
$11,532 |
$12,664 |
$12,788 |
4/20 |
$14,043 |
$12,792 |
$14,134 |
$14,428 |
5/20 |
$14,567 |
$13,410 |
$14,705 |
$15,115 |
6/20 |
$14,417 |
$13,765 |
$14,508 |
$15,416 |
7/20 |
$14,941 |
$14,423 |
$15,103 |
$16,285 |
8/20 |
$15,336 |
$15,387 |
$15,414 |
$17,455 |
9/20 |
$15,090 |
$14,856 |
$15,201 |
$16,792 |
10/20 |
$14,396 |
$14,400 |
$14,460 |
$16,346 |
11/20 |
$15,443 |
$16,242 |
$15,754 |
$18,135 |
12/20 |
$16,023 |
$16,930 |
$16,240 |
$18,832 |
1/21 |
$15,966 |
$16,762 |
$16,413 |
$18,642 |
2/21 |
$15,738 |
$17,192 |
$15,967 |
$19,156 |
3/21 |
$16,069 |
$17,764 |
$16,358 |
$19,995 |
4/21 |
$16,741 |
$18,590 |
$16,982 |
$21,062 |
5/21 |
$17,083 |
$18,858 |
$17,332 |
$21,209 |
6/21 |
$17,539 |
$19,139 |
$17,851 |
$21,704 |
7/21 |
$18,143 |
$19,482 |
$18,515 |
$22,220 |
8/21 |
$18,747 |
$19,967 |
$19,029 |
$22,895 |
9/21 |
$17,653 |
$19,138 |
$18,032 |
$21,831 |
10/21 |
$18,826 |
$20,222 |
$18,793 |
$23,360 |
11/21 |
$18,006 |
$19,779 |
$18,122 |
$23,198 |
12/21 |
$19,521 |
$20,624 |
$19,457 |
$24,238 |
1/22 |
$17,765 |
$19,533 |
$18,019 |
$22,984 |
2/22 |
$17,839 |
$19,039 |
$17,939 |
$22,295 |
3/22 |
$18,809 |
$19,561 |
$18,803 |
$23,123 |
4/22 |
$17,826 |
$17,936 |
$17,932 |
$21,107 |
5/22 |
$17,704 |
$17,950 |
$18,020 |
$21,146 |
6/22 |
$17,397 |
$16,395 |
$17,448 |
$19,400 |
7/22 |
$17,974 |
$17,697 |
$18,018 |
$21,189 |
8/22 |
$16,599 |
$16,957 |
$16,933 |
$20,325 |
9/22 |
$15,862 |
$15,380 |
$16,266 |
$18,453 |
10/22 |
$17,016 |
$16,485 |
$17,633 |
$19,947 |
11/22 |
$17,912 |
$17,631 |
$18,624 |
$21,062 |
12/22 |
$17,623 |
$16,882 |
$18,403 |
$19,848 |
1/23 |
$17,534 |
$18,077 |
$18,284 |
$21,095 |
2/23 |
$16,871 |
$17,642 |
$17,538 |
$20,581 |
3/23 |
$17,547 |
$18,188 |
$18,109 |
$21,336 |
4/23 |
$18,171 |
$18,506 |
$18,742 |
$21,669 |
5/23 |
$17,610 |
$18,322 |
$17,974 |
$21,763 |
6/23 |
$18,120 |
$19,430 |
$18,547 |
$23,201 |
7/23 |
$18,350 |
$20,082 |
$18,787 |
$23,947 |
8/23 |
$18,235 |
$19,603 |
$18,642 |
$23,566 |
9/23 |
$17,534 |
$18,757 |
$18,036 |
$22,442 |
10/23 |
$16,782 |
$18,213 |
$17,294 |
$21,970 |
11/23 |
$17,802 |
$19,920 |
$18,286 |
$23,977 |
12/23 |
$18,581 |
$20,898 |
$19,095 |
$25,066 |
1/24 |
$19,050 |
$21,149 |
$19,608 |
$25,487 |
2/24 |
$19,675 |
$22,046 |
$20,049 |
$26,848 |
3/24 |
$20,053 |
$22,754 |
$20,521 |
$27,712 |
4/24 |
$19,232 |
$21,909 |
$19,710 |
$26,580 |
5/24 |
$19,910 |
$22,887 |
$20,236 |
$27,898 |
6/24 |
$20,431 |
$23,353 |
$20,619 |
$28,899 |
7/24 |
$21,083 |
$23,765 |
$21,294 |
$29,251 |
8/24 |
$22,216 |
$24,393 |
$22,463 |
$29,960 |
9/24 |
$21,604 |
$24,839 |
$21,794 |
$30,600 |
10/24 |
$20,574 |
$24,347 |
$20,743 |
$30,323 |
11/24 |
$20,457 |
$25,464 |
$20,562 |
$32,102 |
12/24 |
$19,177 |
$24,800 |
$19,310 |
$31,337 |
1/25 |
$20,437 |
$25,675 |
$20,545 |
$32,210 |
2/25 |
$20,681 |
$25,491 |
$20,776 |
$31,790 |
3/25 |
$19,841 |
$24,356 |
$20,295 |
$29,998 |
4/25 |
$19,488 |
$24,572 |
$19,911 |
$29,795 |
5/25 |
$18,784 |
$26,027 |
$19,187 |
$31,670 |
6/25 |
$18,974 |
$27,150 |
$19,465 |
$33,281 |
7/25 |
$18,215 |
$27,499 |
$18,886 |
$34,028 |
8/25 |
$19,095 |
$28,217 |
$19,858 |
$34,718 |
9/25 |
$19,028 |
$29,124 |
$20,050 |
$35,985 |
10/25 |
$19,692 |
$29,707 |
$20,672 |
$36,827 |
11/25 |
$21,196 |
$29,791 |
$22,351 |
$36,918 |
12/25 |
$21,100 |
$30,032 |
$22,174 |
$36,940 |
1/26 |
$21,172 |
$30,704 |
$22,417 |
$37,476 |
2/26 |
$21,490 |
$30,929 |
$23,065 |
$37,191 |
3/26 |
$19,830 |
$28,959 |
$21,154 |
$35,339 |
4/26 |
$19,657 |
$31,736 |
$21,103 |
$39,047 |
5/26 |
$19,801 |
$33,181 |
$21,507 |
$41,102 |
6/26 |
$20,956 |
$32,943 |
$22,582 |
$40,711 |
7/26 |
$21,071 |
$33,112 |
$22,909 |
$40,685 |
8/26 |
$21,793 |
$33,965 |
$23,759 |
$41,793 | |
|
| Average Annual Return [Table Text Block] |
Average Annual Total Returns (%)
Table Summary
Fund |
1 Year |
5 Years |
10 Years |
Class R |
14.13% |
3.06% |
8.10% |
MSCI World Index (net of foreign withholding taxes) |
20.37% |
11.20% |
13.00% |
MSCI World Health Care Index (net of foreign withholding taxes) |
19.65% |
4.54% |
9.03% |
S&P 500® Index |
20.38% |
12.78% |
15.37% | Performance does not reflect the deduction of taxes that a shareholder would pay on Fund distributions or redemption of Fund shares. Performance assumes that all dividends and distributions, if any, were reinvested. For more recent performance information, visit www.eatonvance.com/performance.php. THE FUND'S PAST PERFORMANCE IS NO GUARANTEE OF FUTURE RESULTS. |
|
| No Deduction of Taxes [Text Block] |
Performance does not reflect the deduction of taxes that a shareholder would pay on Fund distributions or redemption of Fund shares.
|
|
| Updated Performance Information Location [Text Block] |
For more recent performance information, visit www.eatonvance.com/performance.php.
|
|
| AssetsNet |
$ 805,680,610
|
|
| Holdings Count | Holding |
41
|
|
| Advisory Fees Paid, Amount |
$ 4,518,327
|
|
| InvestmentCompanyPortfolioTurnover |
30.00%
|
|
| Additional Fund Statistics [Text Block] |
Table Summary
Total Net Assets |
$805,680,610 |
# of Portfolio Holdings |
41 |
Portfolio Turnover Rate |
30% |
Total Advisory Fees Paid |
$4,518,327 | |
|
| Holdings [Text Block] |
Sector Allocation (% of total investments)
Table Summary
Value |
Value |
Short-Term Investments |
0.7% |
Health Care Technology |
1.4% |
Health Care Supplies |
1.9% |
Health Care Services |
3.6% |
Managed Health Care |
5.3% |
Life Sciences Tools & Services |
8.6% |
Health Care Equipment |
11.6% |
Biotechnology |
21.5% |
Pharmaceuticals |
45.4% | |
|
| Largest Holdings [Text Block] |
Top Ten Holdings (% of total investments)Footnote Referencea
Table Summary
Eli Lilly & Co. |
12.0% |
Johnson & Johnson |
7.2% |
AbbVie, Inc |
7.2% |
Merck & Co., Inc. |
6.0% |
Roche Holding AG |
5.3% |
UnitedHealth Group, Inc. |
5.3% |
AstraZeneca PLC |
4.3% |
Bristol-Myers Squibb Co. |
4.3% |
Vertex Pharmaceuticals, Inc. |
3.7% |
Abbott Laboratories |
3.3% |
Total |
58.6% |
| Footnote |
Description |
Footnotea |
Excluding cash equivalents | |
|
| Material Fund Change [Text Block] |
|
|
| Updated Prospectus Phone Number |
1-800-262-1122
|
|