Pay vs Performance Disclosure - USD ($)
Dec. 13, 2024
Jul. 26, 2025
Jul. 25, 2026
Jul. 26, 2025
Jul. 27, 2024
Jul. 29, 2023
Jul. 30, 2022
PAY VERSUS PERFORMANCE
As required by Dodd-Frank Wall Street Reform and Consumer Protection Act and Item 402(v) of Regulation S-K, the following disclosure is provided about the relationship between executive compensation and the Company’s performance on select financial metrics. The “Compensation Actually Paid” and other compensation figures shown here are calculated in accordance with applicable regulatory guidance.
Fiscal Year | Summary Compensation Table Total for PEO (John J. Sumas)(1) | Compensation Actually Paid to PEO (John J. Sumas)(2) | Summary Compensation Table Total for PEO (Robert Sumas)(3) | Compensation Actually Paid to PEO (Robert Sumas)(2) | Average Summary Compensation Table Total for non-PEO NEOs(4) | Average Compensation Actually Paid to non-PEO NEOs(2) | Value of Initial Fixed $100 Investment Based(5) | GAAP Net Income(6) ($ in Millions) | Adjusted Net Income(7) ($ in Millions) | |||||||||||||||||||||
TSR | Peer Group TSR | |||||||||||||||||||||||||||||
2026 | $2,964,394 | $3,169,270 | $1,948,481 | $2,079,655 | $226.72 | $195.23 | $52.5 | $52.7 | ||||||||||||||||||||||
2025 | 1,554,607 | 1,694,487 | $902,261 | $972,788 | 1,567,794 | 1,637,073 | 186.06 | 190.94 | 56.4 | 56.4 | ||||||||||||||||||||
2024 | 1,432,211 | 1,601,724 | 1,322,414 | 1,421,465 | 153.57 | 146.15 | 50.5 | 51.9 | ||||||||||||||||||||||
2023 | 1,955,159 | 1,975,907 | 1,823,359 | 1,844,107 | 112.93 | 127.54 | 49.7 | 48.9 | ||||||||||||||||||||||
2022 | 1,251,742 | 1,252,210 | 1,124,397 | 1,124,865 | 104.59 | 123.70 | 26.8 | 35.4 | ||||||||||||||||||||||
(1) | Represents the total compensation for Mr. John J. Sumas, our Chief Executive Officer, for 2026 and 2025. Mr. J. Sumas was appointed as Chief Executive Officer effective December 13, 2024. |
(2) | Represents the total compensation from the Summary Compensation Table for our Principal Executive Officer (“PEO”) and the average total compensation for our named executive officers other than the PEO (referred to in this Pay Versus Performance disclosure as our “non-PEO NEOs”) during 2026, 2025, 2024, 2023 and 2022 as adjusted to reflect changes in the fair value of outstanding stock and option awards in accordance with Item 402(v) of Regulation S-K. The adjustments to the values reported in the Summary Compensation table are set forth below in the Reconciliation of Summary Compensation Totals and Compensation Actually Paid. |
(3) | Represents the total compensation for Mr. Robert Sumas, our former Chief Executive Officer and PEO, for 2025 (through December 13, 2024), 2024, 2023 and 2022. Mr. R. Sumas stepped down as Chief Executive Officer effective December 13, 2024. |
(4) | Represents the average total compensation for Messrs. John P. Sumas, Nicholas J. Sumas II, John Van Orden and Luigi Perri, our non-PEO NEOs, from the Summary Compensation Table for 2026; Messrs. John P. Sumas and Nicholas J. Sumas II for 2025; Messrs. William Sumas, John P. Sumas, John J. Sumas and Nicholas J. Sumas II for 2024; and Messrs. William Sumas and John P. Sumas for 2023 and 2022. |
(5) | Total Shareholder Return (“TSR”), for each fiscal year is based on a $100 common equity investment at the close of July 31, 2021, measuring through and including the end of the applicable year. Cumulative TSR is calculated by dividing (a) the sum of the cumulative amount of dividends for the measurement period, assuming dividend reinvestment, and the difference between the Company’s share price at the end and the beginning of the measurement period by (b) the Company’s share price at the beginning of the measurement period. The peer group selected by the Company for purposes of the TSR benchmarking for the pay versus performance disclosures is the Dow Jones U.S. Food Retailers & Wholesalers Total Stock Market Index, which is the same peer group the Company uses for the performance graph in its Annual Report on Form 10-K pursuant to Item 201(e) of Regulation S-K. |
(6) | The dollar amounts reported represent the amount of net income reflected in the Company’s audited financial statements for the applicable fiscal year. |
(7) | Adjusted Net Income is defined as net income excluding certain non-routine transactions that, in the opinion of management, affect the comparability of operating results from period to period. For a reconciliation of Net Income to Adjusted Net Income, see our Annual Report on Form 10-K for the fiscal years presented. |
The following table shows the amounts deducted from and added to the Summary Compensation Table total to calculate “compensation actually paid” to our PEOs.
PEO John J. Sumas | PEO Robert Sumas | |||||||||||||||||
2026 ($) | 2025 ($) | 2025 ($) | 2024 ($) | 2023 ($) | 2022 ($) | |||||||||||||
Summary Compensation Table Total | $2,964,394 | $1,554,607 | $902,261 | $1,432,211 | $1,955,159 | $1,251,742 | ||||||||||||
Deduct: Stock and Option Awards | (1,382,071) | — | — | — | (595,400) | — | ||||||||||||
Deduct: Change in Pension Value and Nonqualified Deferred Compensation Earnings | — | — | (69,353) | (18,727) | — | — | ||||||||||||
Equity Award Adjustments: | ||||||||||||||||||
Add (Deduct): Year-End Fair Value of Equity Awards Granted in the Year | 1,408,847 | — | — | — | 606,320 | — | ||||||||||||
Add (Deduct): Year over Year Change in Fair Value of Equity Awards Granted in Prior Years that are Unvested at Year End | — | 139,880 | 139,880 | 188,240 | — | 468 | ||||||||||||
Add (Deduct): Year over Year Change in Fair Value of Equity Awards Granted in Prior Years that Vested in the Year | 178,100 | — | — | — | 9,828 | — | ||||||||||||
Compensation Actually Paid | $3,169,270 | $1,694,487 | $972,788 | $1,601,724 | $1,975,907 | $1,252,210 | ||||||||||||
The following table shows the amounts deducted from and added to the average Summary Compensation Table total compensation to calculate the average “compensation actually paid” to our non-PEO NEOs.
Average Non-PEO NEOs | |||||||||||||||
2026 ($) | 2025 ($) | 2024 ($) | 2023 ($) | 2022 ($) | |||||||||||
Summary Compensation Table Total | $1,948,481 | $1,567,794 | $1,322,414 | $1,823,359 | $1,124,397 | ||||||||||
Deduct: Stock and Option Awards | (760,148) | — | — | (595,400) | — | ||||||||||
Deduct: Change in Pension Value and Nonqualified Deferred Compensation Earnings | (41,102) | (70,601) | (65,529) | — | — | ||||||||||
Equity Award Adjustments: | |||||||||||||||
Add (Deduct): Year-End Fair Value of Equity Awards Granted in the Year | 774,874 | — | — | 606,320 | — | ||||||||||
Add (Deduct): Year over Year Change in Fair Value of Equity Awards Granted in Prior Years that are Unvested at Year End | — | 139,880 | 141,180 | — | 468 | ||||||||||
Add (Deduct): Year over Year Change in Fair Value of Equity Awards Granted in Prior Years that Vested in the Year | 157,550 | — | 23,400 | 9,828 | — | ||||||||||
Compensation Actually Paid | $2,079,655 | $1,637,073 | $1,421,465 | $1,844,107 | $1,124,865 | ||||||||||
(1) | Represents the total compensation for Mr. John J. Sumas, our Chief Executive Officer, for 2026 and 2025. Mr. J. Sumas was appointed as Chief Executive Officer effective December 13, 2024. |
(3) | Represents the total compensation for Mr. Robert Sumas, our former Chief Executive Officer and PEO, for 2025 (through December 13, 2024), 2024, 2023 and 2022. Mr. R. Sumas stepped down as Chief Executive Officer effective December 13, 2024. |
(4) | Represents the average total compensation for Messrs. John P. Sumas, Nicholas J. Sumas II, John Van Orden and Luigi Perri, our non-PEO NEOs, from the Summary Compensation Table for 2026; Messrs. John P. Sumas and Nicholas J. Sumas II for 2025; Messrs. William Sumas, John P. Sumas, John J. Sumas and Nicholas J. Sumas II for 2024; and Messrs. William Sumas and John P. Sumas for 2023 and 2022. |
(5) | Total Shareholder Return (“TSR”), for each fiscal year is based on a $100 common equity investment at the close of July 31, 2021, measuring through and including the end of the applicable year. Cumulative TSR is calculated by dividing (a) the sum of the cumulative amount of dividends for the measurement period, assuming dividend reinvestment, and the difference between the Company’s share price at the end and the beginning of the measurement period by (b) the Company’s share price at the beginning of the measurement period. The peer group selected by the Company for purposes of the TSR benchmarking for the pay versus performance disclosures is the Dow Jones U.S. Food Retailers & Wholesalers Total Stock Market Index, which is the same peer group the Company uses for the performance graph in its Annual Report on Form 10-K pursuant to Item 201(e) of Regulation S-K. |
(2) | Represents the total compensation from the Summary Compensation Table for our Principal Executive Officer (“PEO”) and the average total compensation for our named executive officers other than the PEO (referred to in this Pay Versus Performance disclosure as our “non-PEO NEOs”) during 2026, 2025, 2024, 2023 and 2022 as adjusted to reflect changes in the fair value of outstanding stock and option awards in accordance with Item 402(v) of Regulation S-K. The adjustments to the values reported in the Summary Compensation table are set forth below in the Reconciliation of Summary Compensation Totals and Compensation Actually Paid. |
The following table shows the amounts deducted from and added to the Summary Compensation Table total to calculate “compensation actually paid” to our PEOs.
PEO John J. Sumas | PEO Robert Sumas | |||||||||||||||||
2026 ($) | 2025 ($) | 2025 ($) | 2024 ($) | 2023 ($) | 2022 ($) | |||||||||||||
Summary Compensation Table Total | $2,964,394 | $1,554,607 | $902,261 | $1,432,211 | $1,955,159 | $1,251,742 | ||||||||||||
Deduct: Stock and Option Awards | (1,382,071) | — | — | — | (595,400) | — | ||||||||||||
Deduct: Change in Pension Value and Nonqualified Deferred Compensation Earnings | — | — | (69,353) | (18,727) | — | — | ||||||||||||
Equity Award Adjustments: | ||||||||||||||||||
Add (Deduct): Year-End Fair Value of Equity Awards Granted in the Year | 1,408,847 | — | — | — | 606,320 | — | ||||||||||||
Add (Deduct): Year over Year Change in Fair Value of Equity Awards Granted in Prior Years that are Unvested at Year End | — | 139,880 | 139,880 | 188,240 | — | 468 | ||||||||||||
Add (Deduct): Year over Year Change in Fair Value of Equity Awards Granted in Prior Years that Vested in the Year | 178,100 | — | — | — | 9,828 | — | ||||||||||||
Compensation Actually Paid | $3,169,270 | $1,694,487 | $972,788 | $1,601,724 | $1,975,907 | $1,252,210 | ||||||||||||
(2) | Represents the total compensation from the Summary Compensation Table for our Principal Executive Officer (“PEO”) and the average total compensation for our named executive officers other than the PEO (referred to in this Pay Versus Performance disclosure as our “non-PEO NEOs”) during 2026, 2025, 2024, 2023 and 2022 as adjusted to reflect changes in the fair value of outstanding stock and option awards in accordance with Item 402(v) of Regulation S-K. The adjustments to the values reported in the Summary Compensation table are set forth below in the Reconciliation of Summary Compensation Totals and Compensation Actually Paid. |
The following table shows the amounts deducted from and added to the average Summary Compensation Table total compensation to calculate the average “compensation actually paid” to our non-PEO NEOs.
Average Non-PEO NEOs | |||||||||||||||
2026 ($) | 2025 ($) | 2024 ($) | 2023 ($) | 2022 ($) | |||||||||||
Summary Compensation Table Total | $1,948,481 | $1,567,794 | $1,322,414 | $1,823,359 | $1,124,397 | ||||||||||
Deduct: Stock and Option Awards | (760,148) | — | — | (595,400) | — | ||||||||||
Deduct: Change in Pension Value and Nonqualified Deferred Compensation Earnings | (41,102) | (70,601) | (65,529) | — | — | ||||||||||
Equity Award Adjustments: | |||||||||||||||
Add (Deduct): Year-End Fair Value of Equity Awards Granted in the Year | 774,874 | — | — | 606,320 | — | ||||||||||
Add (Deduct): Year over Year Change in Fair Value of Equity Awards Granted in Prior Years that are Unvested at Year End | — | 139,880 | 141,180 | — | 468 | ||||||||||
Add (Deduct): Year over Year Change in Fair Value of Equity Awards Granted in Prior Years that Vested in the Year | 157,550 | — | 23,400 | 9,828 | — | ||||||||||
Compensation Actually Paid | $2,079,655 | $1,637,073 | $1,421,465 | $1,844,107 | $1,124,865 | ||||||||||
The table below shows the relationship between the compensation actually paid to the PEO and Average non-PEO NEOs relative to Village Super Market’s TSR and the cumulative TSR for the peer group reflected in the Pay Versus Performance Table above.
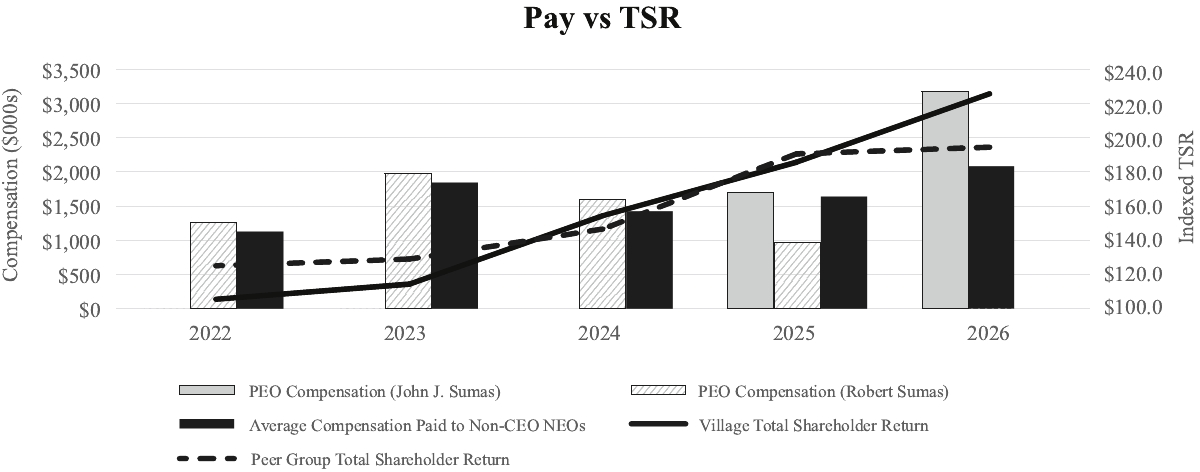
The table below shows the relationship between the compensation actually paid to the PEO and Average non-PEO NEOs relative to GAAP Net Income.
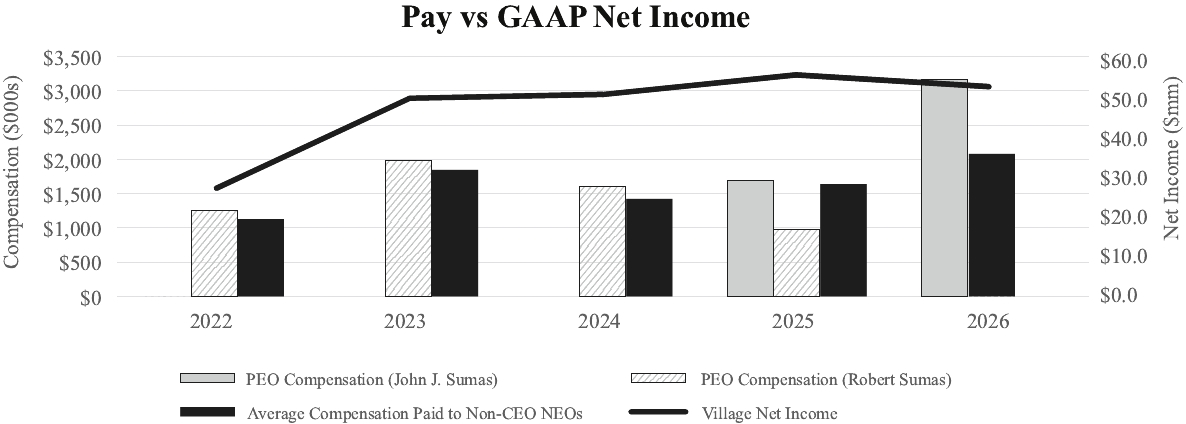
The table below shows the relationship between the compensation actually paid to the PEO and Average non-PEO NEOs relative to Adjusted Net Income.
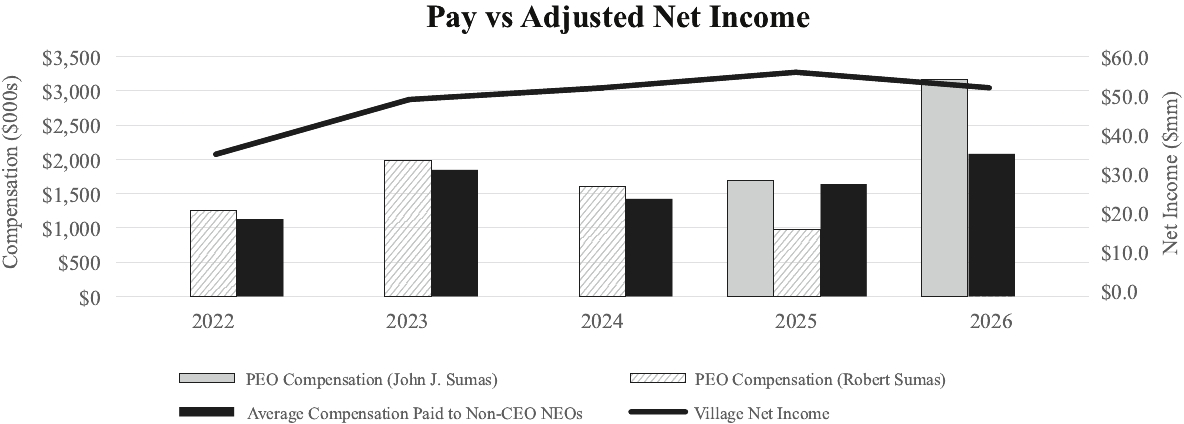
The table below shows the relationship between the compensation actually paid to the PEO and Average non-PEO NEOs relative to Village Super Market’s TSR and the cumulative TSR for the peer group reflected in the Pay Versus Performance Table above.
Most Important Financial Performance Measures
The following table presents the financial performance measures that the Company considers to have been the most important in linking compensation actually paid to its named executive officers in fiscal 2026 to the Company’s performance.
Financial Performance Measure | Description | ||
Adjusted Net Income | Adjusted Net Income is defined as net income excluding certain non-routine transactions that, in the opinion of management, affect the comparability of operating results from period to period. | ||
EBITDA | EBITDA is defined as net income before interest expense, interest income, income taxes, and depreciation and amortization expense. | ||
Same Store Sales | New stores, replacement stores and stores with banner changes are included in same store sales in the quarter after the store has been in operation for four full fiscal quarters. Store renovations and expansions are included in same store sales immediately. | ||