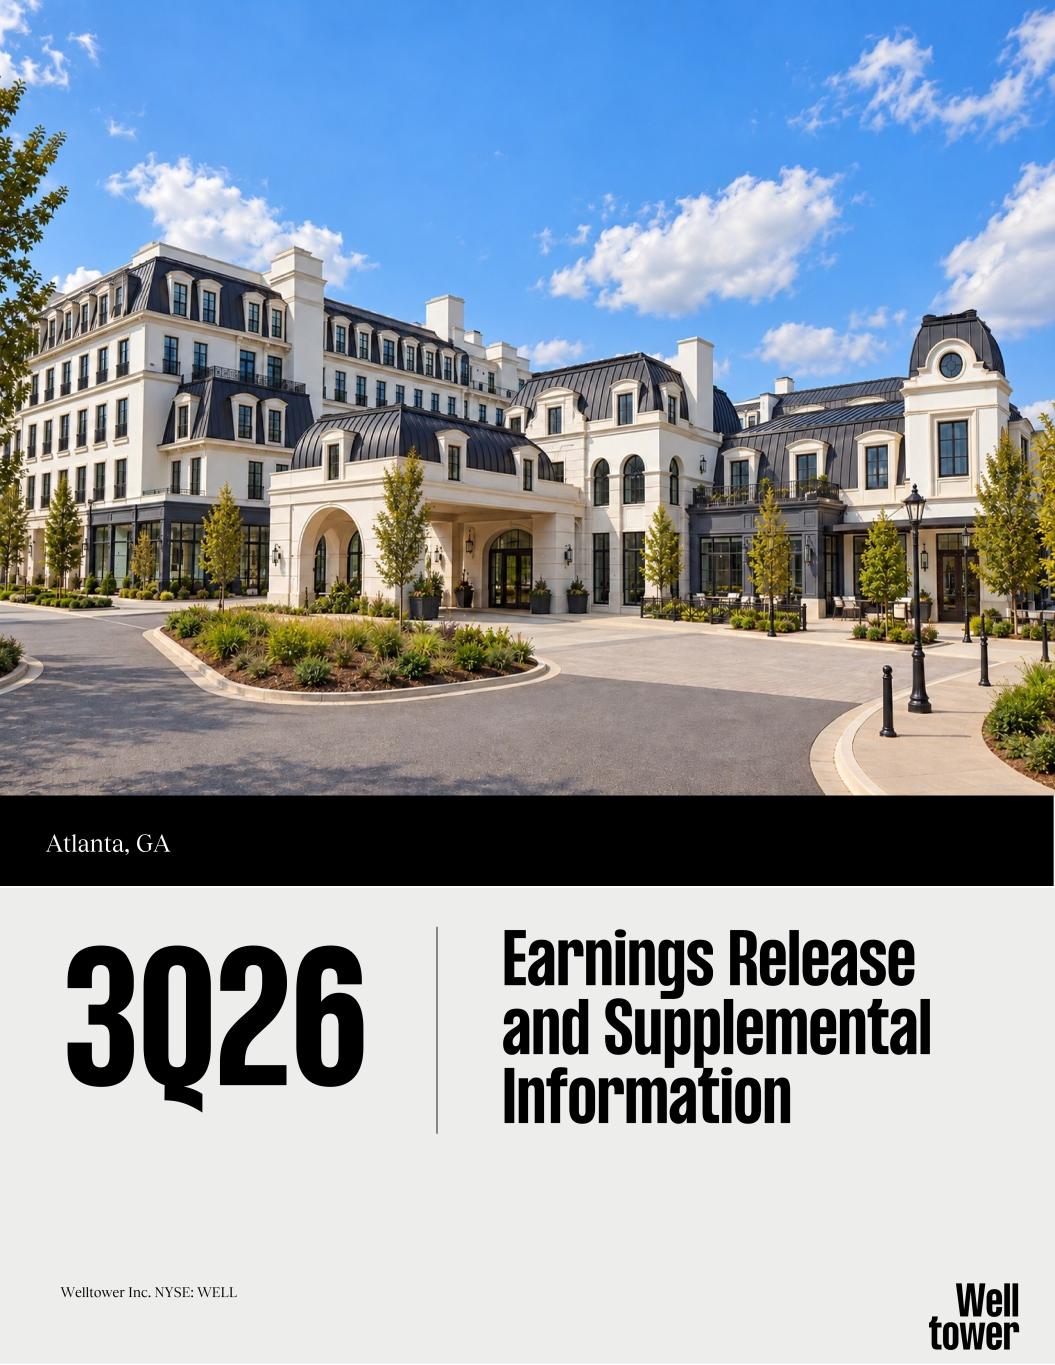
Atlanta, GA 3Q26 Earnings Release and Supplemental Information Well tower Welltower Inc. NYSE: WELL
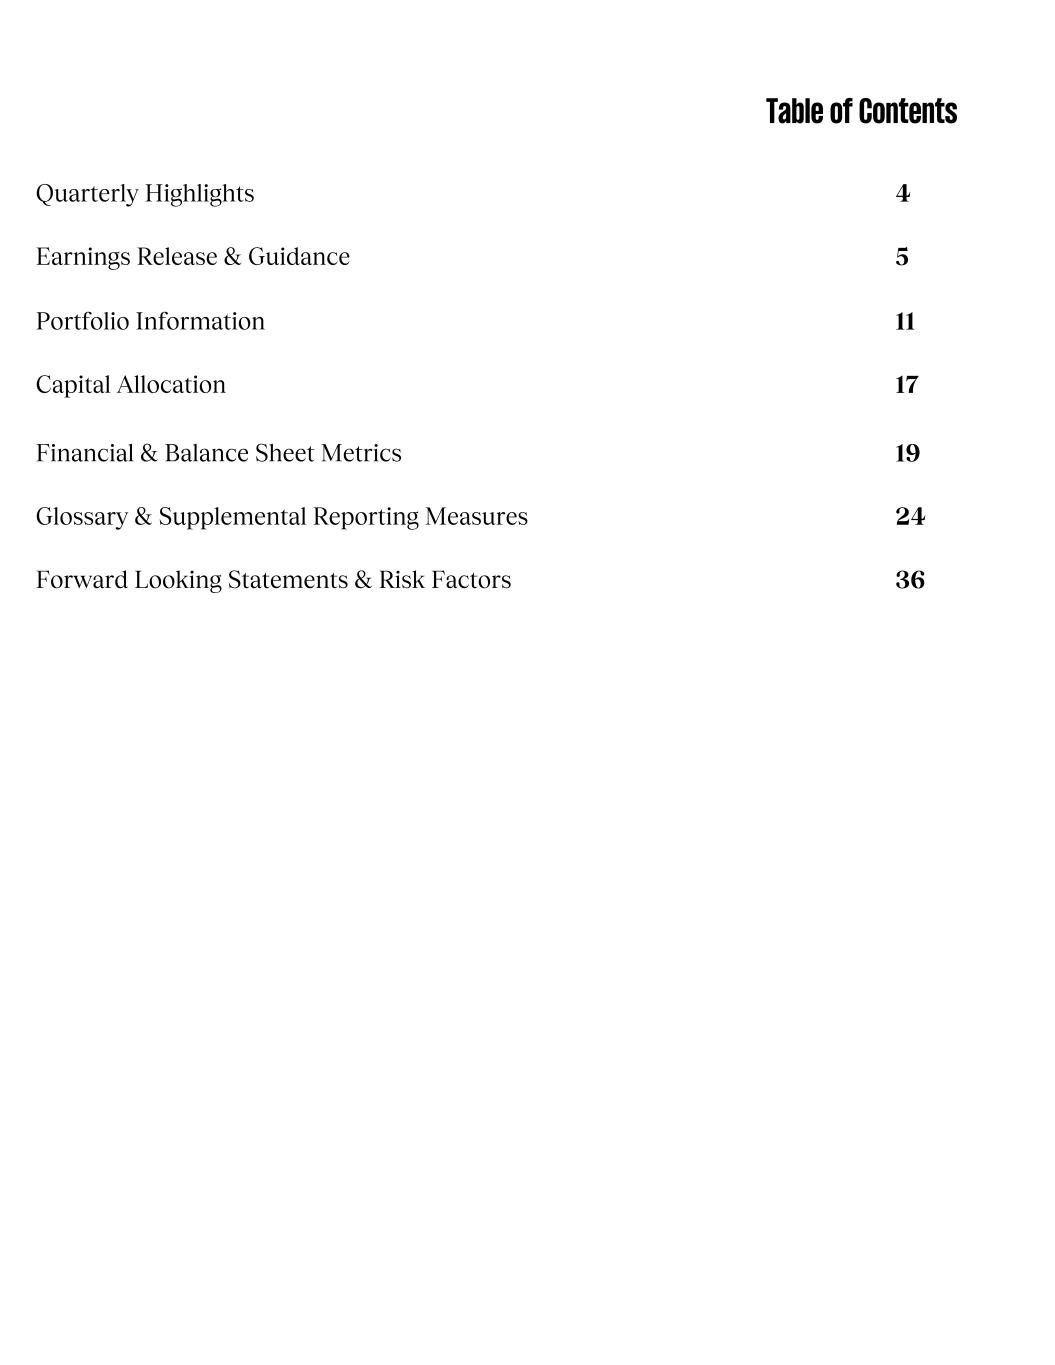
Table of Contents Quarterly Highlights 4 Earnings Release & Guidance 5 Portfolio Information 11 Capital Allocation 17 Financial & Balance Sheet Metrics 19 Glossary & Supplemental Reporting Measures 24 Forward Looking Statements & Risk Factors 36

Our North Star Deliver long-term compounding of per-share growth for existing investors
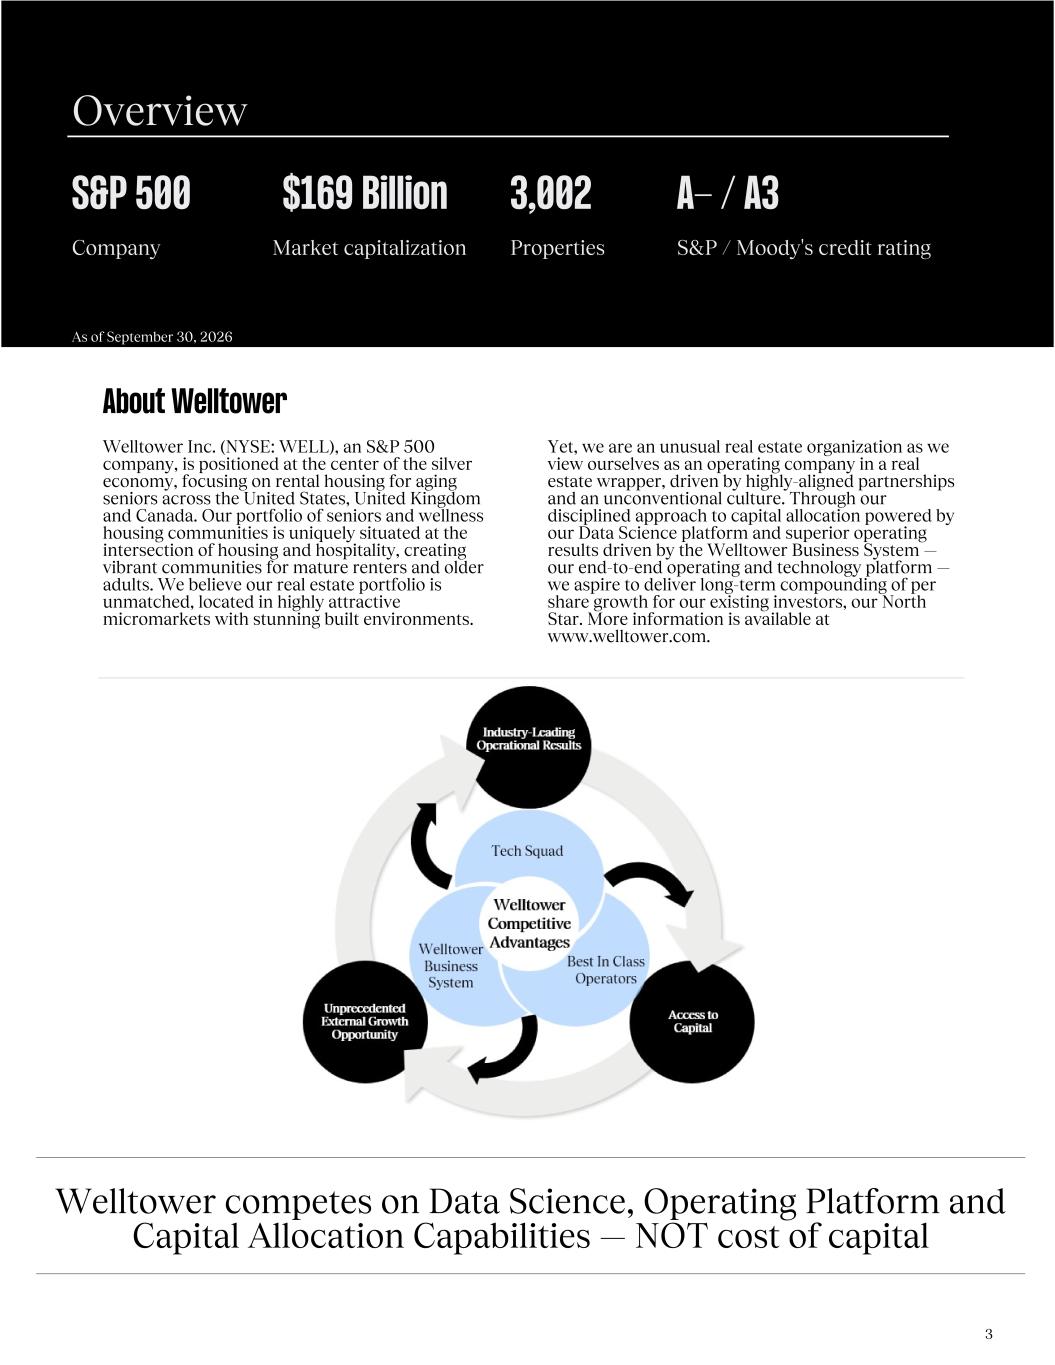
3 Overview S&P 500 $169 Billion 3,002 A- / A3 Company Market capitalization Properties S&P / Moody's credit rating As of September 30, 2026 About Welltower Welltower Inc. (NYSE: WELL), an S&P 500 company, is positioned at the center of the silver economy, focusing on rental housing for aging seniors across the United States, United Kingdom and Canada. Our portfolio of seniors and wellness housing communities is uniquely situated at the intersection of housing and hospitality, creating vibrant communities for mature renters and older adults. We believe our real estate portfolio is unmatched, located in highly attractive micromarkets with stunning built environments. Yet, we are an unusual real estate organization as we view ourselves as an operating company in a real estate wrapper, driven by highly-aligned partnerships and an unconventional culture. Through our disciplined approach to capital allocation powered by our Data Science platform and superior operating results driven by the Welltower Business System — our end-to-end operating and technology platform — we aspire to deliver long-term compounding of per share growth for our existing investors, our North Star. More information is available at www.welltower.com. Welltower competes on Data Science, Operating Platform and Capital Allocation Capabilities — NOT cost of capital
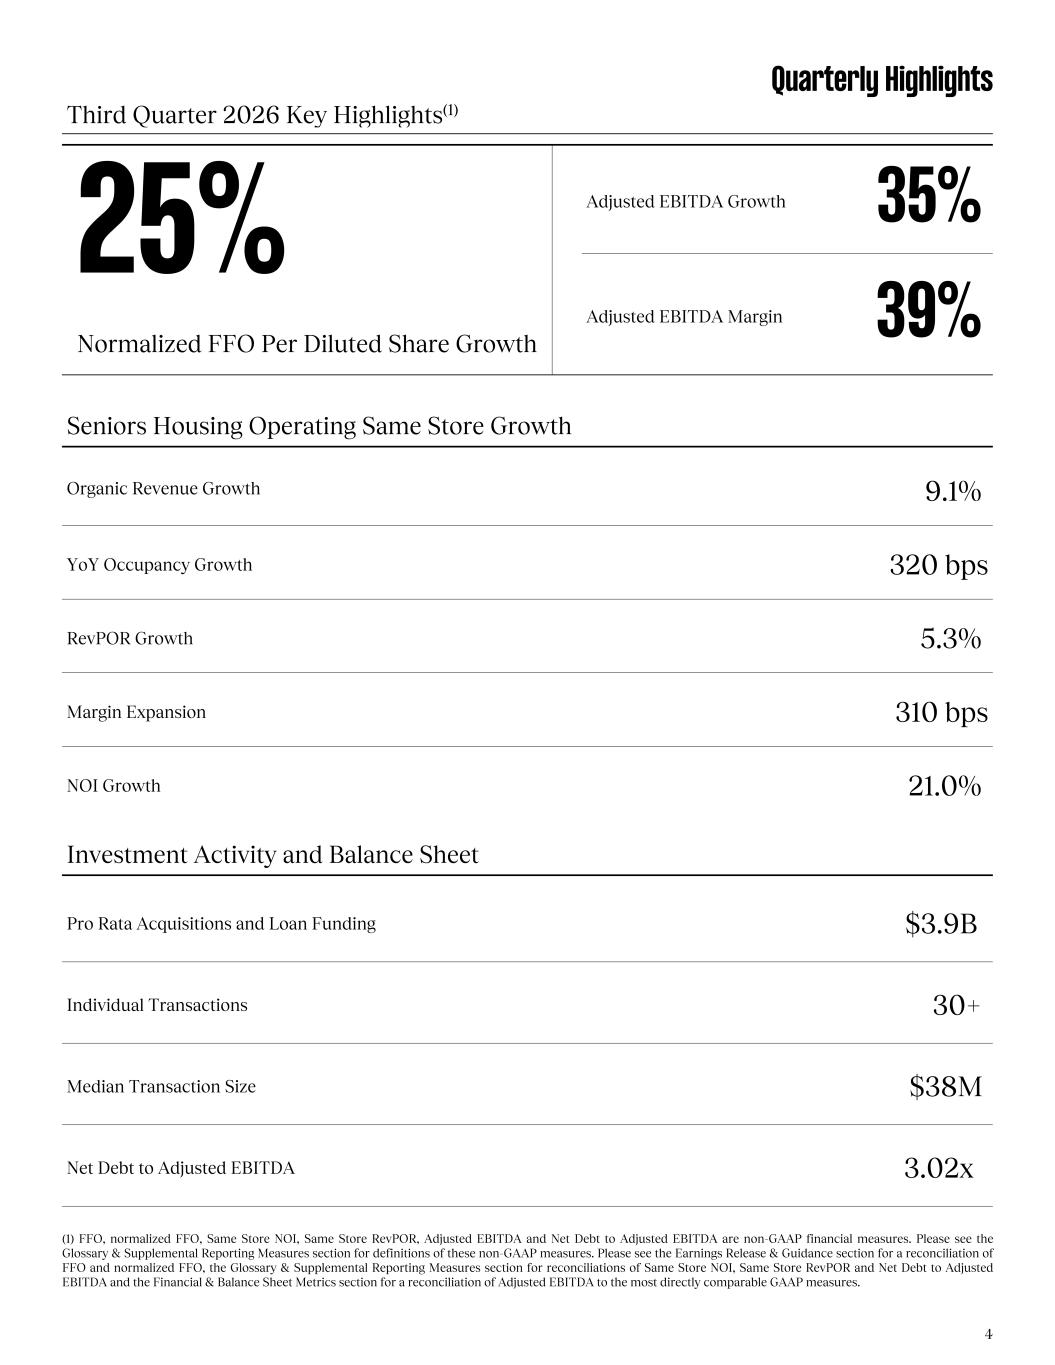
25% Adjusted EBITDA Growth 35% Adjusted EBITDA Margin 39% Normalized FFO Per Diluted Share Growth Seniors Housing Operating Same Store Growth Organic Revenue Growth 9.1% YoY Occupancy Growth 320 bps RevPOR Growth 5.3% Margin Expansion 310 bps NOI Growth 21.0% Investment Activity and Balance Sheet Pro Rata Acquisitions and Loan Funding $3.9B Individual Transactions 30+ Median Transaction Size $38M Net Debt to Adjusted EBITDA 3.02x (1) FFO, normalized FFO, Same Store NOI, Same Store RevPOR, Adjusted EBITDA and Net Debt to Adjusted EBITDA are non-GAAP financial measures. Please see the Glossary & Supplemental Reporting Measures section for definitions of these non-GAAP measures. Please see the Earnings Release & Guidance section for a reconciliation of FFO and normalized FFO, the Glossary & Supplemental Reporting Measures section for reconciliations of Same Store NOI, Same Store RevPOR and Net Debt to Adjusted EBITDA and the Financial & Balance Sheet Metrics section for a reconciliation of Adjusted EBITDA to the most directly comparable GAAP measures. 4 Third Quarter 2026 Key Highlights(1) Quarterly Highlights

Earnings Release & Guidance San Jose, CA
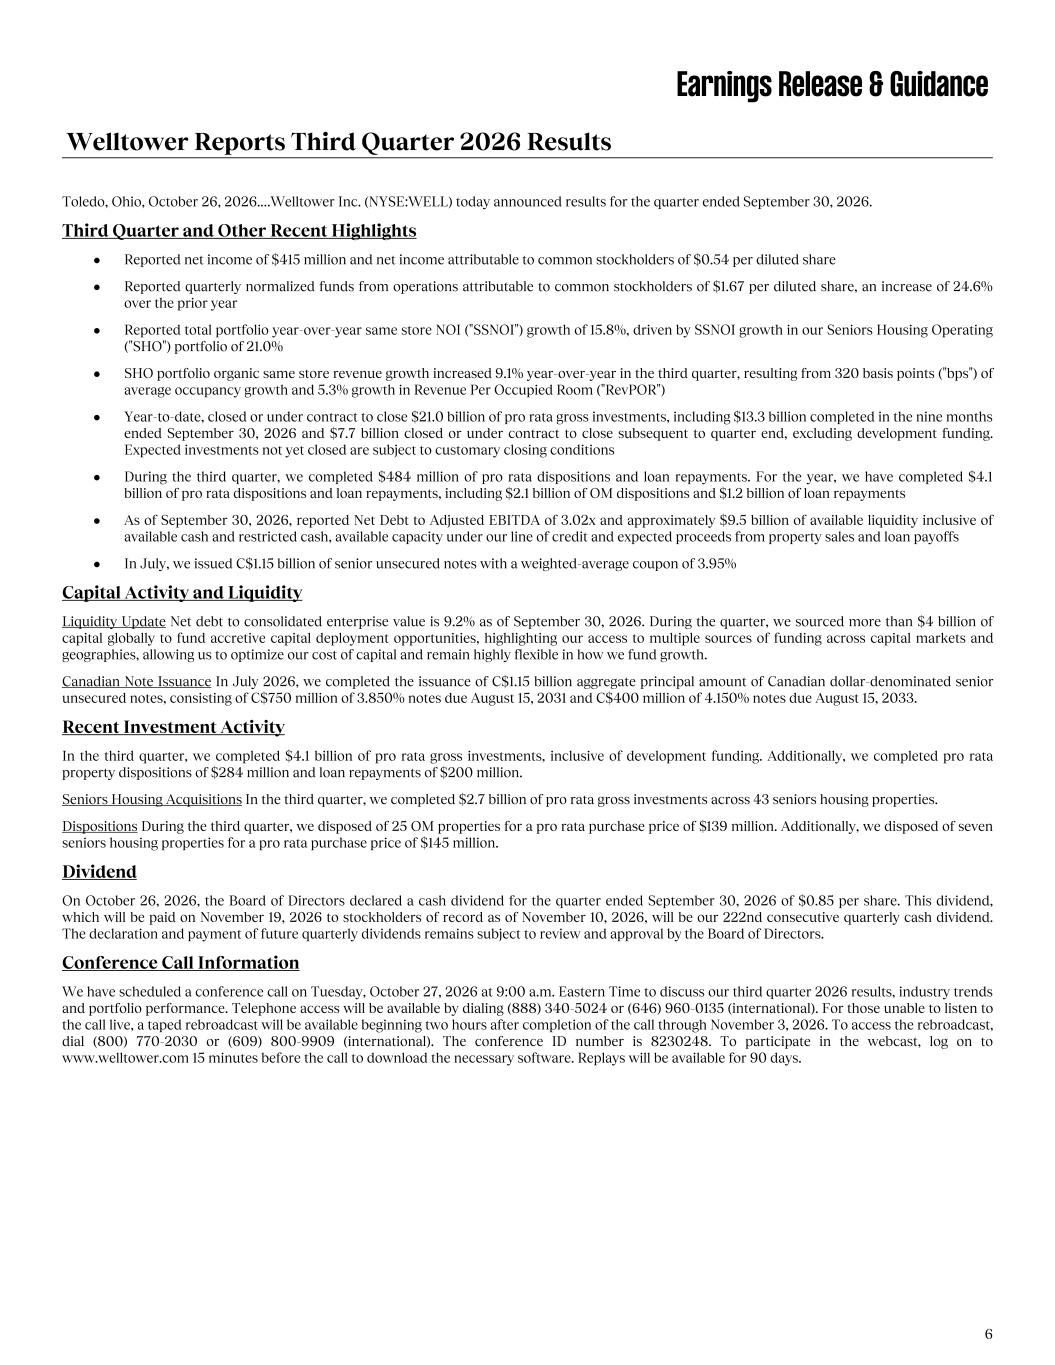
Earnings Release & Guidance Welltower Reports Third Quarter 2026 Results Toledo, Ohio, October 26, 2026.…Welltower Inc. (NYSE:WELL) today announced results for the quarter ended September 30, 2026. Third Quarter and Other Recent Highlights • Reported net income of $415 million and net income attributable to common stockholders of $0.54 per diluted share • Reported quarterly normalized funds from operations attributable to common stockholders of $1.67 per diluted share, an increase of 24.6% over the prior year • Reported total portfolio year-over-year same store NOI ("SSNOI") growth of 15.8%, driven by SSNOI growth in our Seniors Housing Operating ("SHO") portfolio of 21.0% • SHO portfolio organic same store revenue growth increased 9.1% year-over-year in the third quarter, resulting from 320 basis points ("bps") of average occupancy growth and 5.3% growth in Revenue Per Occupied Room ("RevPOR") • Year-to-date, closed or under contract to close $21.0 billion of pro rata gross investments, including $13.3 billion completed in the nine months ended September 30, 2026 and $7.7 billion closed or under contract to close subsequent to quarter end, excluding development funding. Expected investments not yet closed are subject to customary closing conditions • During the third quarter, we completed $484 million of pro rata dispositions and loan repayments. For the year, we have completed $4.1 billion of pro rata dispositions and loan repayments, including $2.1 billion of OM dispositions and $1.2 billion of loan repayments • As of September 30, 2026, reported Net Debt to Adjusted EBITDA of 3.02x and approximately $9.5 billion of available liquidity inclusive of available cash and restricted cash, available capacity under our line of credit and expected proceeds from property sales and loan payoffs • In July, we issued C$1.15 billion of senior unsecured notes with a weighted-average coupon of 3.95% Capital Activity and Liquidity Liquidity Update Net debt to consolidated enterprise value is 9.2% as of September 30, 2026. During the quarter, we sourced more than $4 billion of capital globally to fund accretive capital deployment opportunities, highlighting our access to multiple sources of funding across capital markets and geographies, allowing us to optimize our cost of capital and remain highly flexible in how we fund growth. Canadian Note Issuance In July 2026, we completed the issuance of C$1.15 billion aggregate principal amount of Canadian dollar-denominated senior unsecured notes, consisting of C$750 million of 3.850% notes due August 15, 2031 and C$400 million of 4.150% notes due August 15, 2033. Recent Investment Activity In the third quarter, we completed $4.1 billion of pro rata gross investments, inclusive of development funding. Additionally, we completed pro rata property dispositions of $284 million and loan repayments of $200 million. Seniors Housing Acquisitions In the third quarter, we completed $2.7 billion of pro rata gross investments across 43 seniors housing properties. Dispositions During the third quarter, we disposed of 25 OM properties for a pro rata purchase price of $139 million. Additionally, we disposed of seven seniors housing properties for a pro rata purchase price of $145 million. Dividend On October 26, 2026, the Board of Directors declared a cash dividend for the quarter ended September 30, 2026 of $0.85 per share. This dividend, which will be paid on November 19, 2026 to stockholders of record as of November 10, 2026, will be our 222nd consecutive quarterly cash dividend. The declaration and payment of future quarterly dividends remains subject to review and approval by the Board of Directors. Conference Call Information We have scheduled a conference call on Tuesday, October 27, 2026 at 9:00 a.m. Eastern Time to discuss our third quarter 2026 results, industry trends and portfolio performance. Telephone access will be available by dialing (888) 340-5024 or (646) 960-0135 (international). For those unable to listen to the call live, a taped rebroadcast will be available beginning two hours after completion of the call through November 3, 2026. To access the rebroadcast, dial (800) 770-2030 or (609) 800-9909 (international). The conference ID number is 8230248. To participate in the webcast, log on to www.welltower.com 15 minutes before the call to download the necessary software. Replays will be available for 90 days. 6
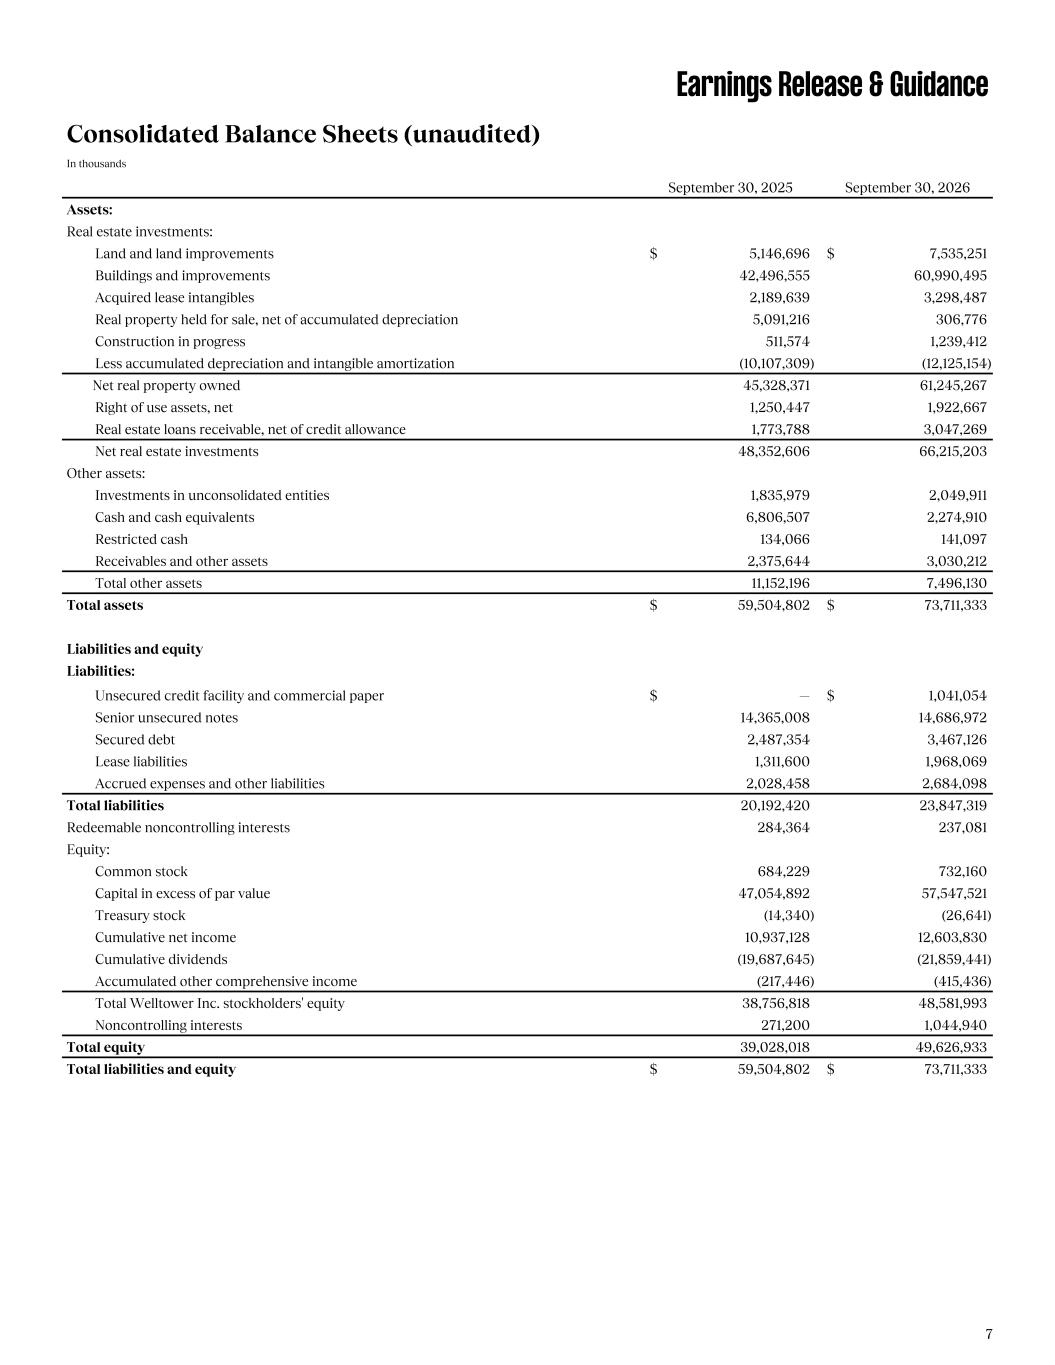
Earnings Release & Guidance Consolidated Balance Sheets (unaudited) In thousands September 30, 2025 September 30, 2026 Assets: Real estate investments: Land and land improvements $ 5,146,696 $ 7,535,251 Buildings and improvements 42,496,555 60,990,495 Acquired lease intangibles 2,189,639 3,298,487 Real property held for sale, net of accumulated depreciation 5,091,216 306,776 Construction in progress 511,574 1,239,412 Less accumulated depreciation and intangible amortization (10,107,309) (12,125,154) Net real property owned 45,328,371 61,245,267 Right of use assets, net 1,250,447 1,922,667 Real estate loans receivable, net of credit allowance 1,773,788 3,047,269 Net real estate investments 48,352,606 66,215,203 Other assets: Investments in unconsolidated entities 1,835,979 2,049,911 Cash and cash equivalents 6,806,507 2,274,910 Restricted cash 134,066 141,097 Receivables and other assets 2,375,644 3,030,212 Total other assets 11,152,196 7,496,130 Total assets $ 59,504,802 $ 73,711,333 Liabilities and equity Liabilities: Unsecured credit facility and commercial paper $ — $ 1,041,054 Senior unsecured notes 14,365,008 14,686,972 Secured debt 2,487,354 3,467,126 Lease liabilities 1,311,600 1,968,069 Accrued expenses and other liabilities 2,028,458 2,684,098 Total liabilities 20,192,420 23,847,319 Redeemable noncontrolling interests 284,364 237,081 Equity: Common stock 684,229 732,160 Capital in excess of par value 47,054,892 57,547,521 Treasury stock (14,340) (26,641) Cumulative net income 10,937,128 12,603,830 Cumulative dividends (19,687,645) (21,859,441) Accumulated other comprehensive income (217,446) (415,436) Total Welltower Inc. stockholders' equity 38,756,818 48,581,993 Noncontrolling interests 271,200 1,044,940 Total equity 39,028,018 49,626,933 Total liabilities and equity $ 59,504,802 $ 73,711,333 7
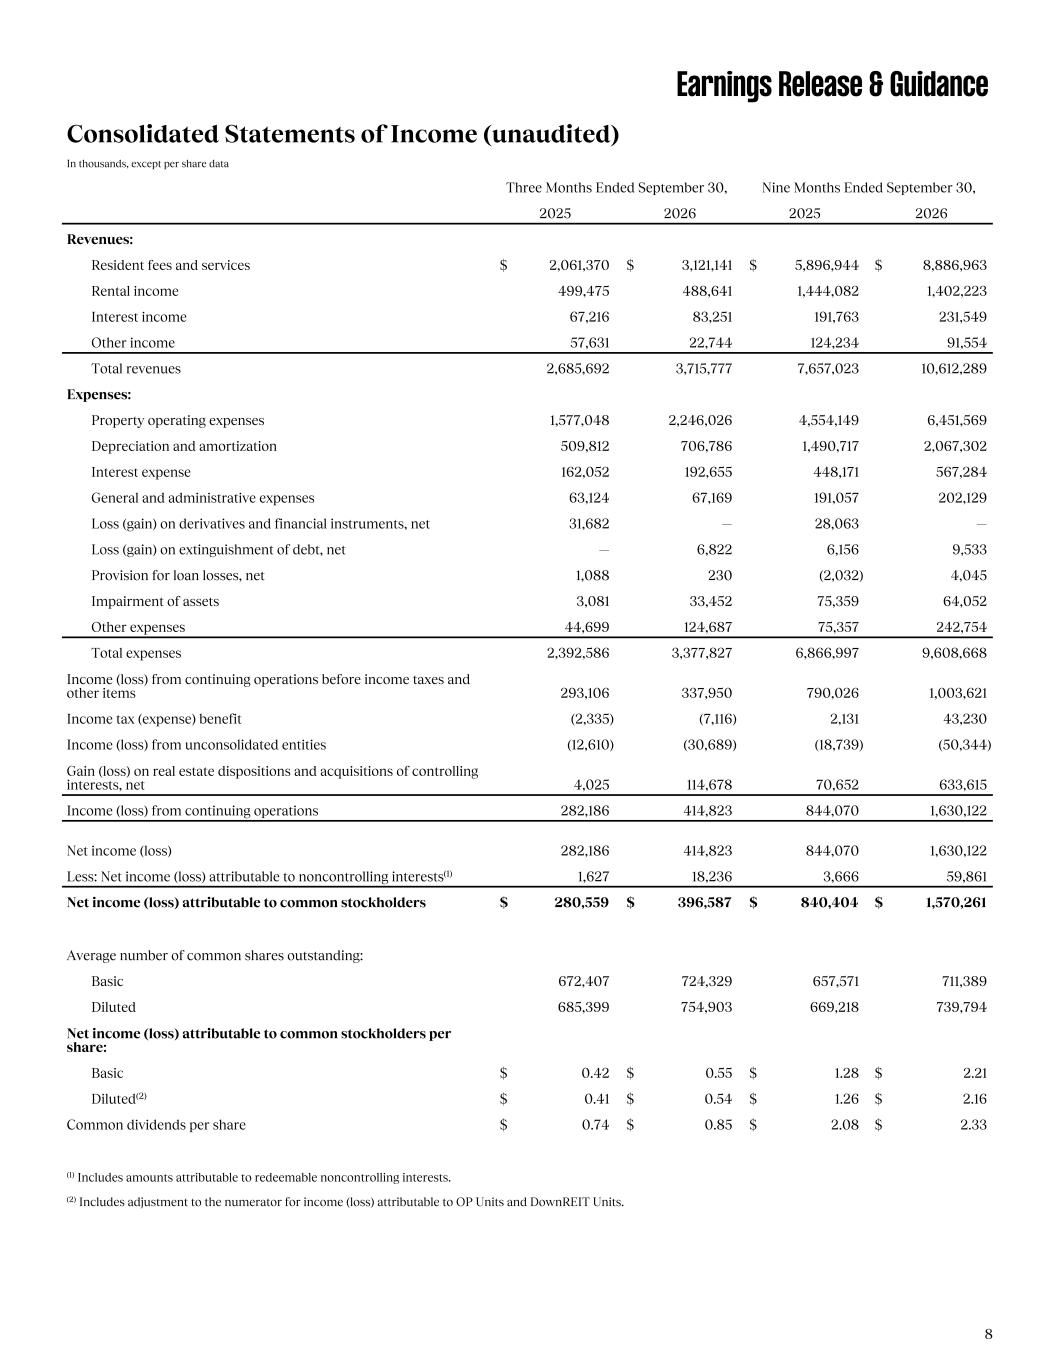
Earnings Release & Guidance Consolidated Statements of Income (unaudited) In thousands, except per share data Three Months Ended September 30, Nine Months Ended September 30, 2025 2026 2025 2026 Revenues: Resident fees and services $ 2,061,370 $ 3,121,141 $ 5,896,944 $ 8,886,963 Rental income 499,475 488,641 1,444,082 1,402,223 Interest income 67,216 83,251 191,763 231,549 Other income 57,631 22,744 124,234 91,554 Total revenues 2,685,692 3,715,777 7,657,023 10,612,289 Expenses: Property operating expenses 1,577,048 2,246,026 4,554,149 6,451,569 Depreciation and amortization 509,812 706,786 1,490,717 2,067,302 Interest expense 162,052 192,655 448,171 567,284 General and administrative expenses 63,124 67,169 191,057 202,129 Loss (gain) on derivatives and financial instruments, net 31,682 — 28,063 — Loss (gain) on extinguishment of debt, net — 6,822 6,156 9,533 Provision for loan losses, net 1,088 230 (2,032) 4,045 Impairment of assets 3,081 33,452 75,359 64,052 Other expenses 44,699 124,687 75,357 242,754 Total expenses 2,392,586 3,377,827 6,866,997 9,608,668 Income (loss) from continuing operations before income taxes and other items 293,106 337,950 790,026 1,003,621 Income tax (expense) benefit (2,335) (7,116) 2,131 43,230 Income (loss) from unconsolidated entities (12,610) (30,689) (18,739) (50,344) Gain (loss) on real estate dispositions and acquisitions of controlling interests, net 4,025 114,678 70,652 633,615 Income (loss) from continuing operations 282,186 414,823 844,070 1,630,122 Net income (loss) 282,186 414,823 844,070 1,630,122 Less: Net income (loss) attributable to noncontrolling interests(1) 1,627 18,236 3,666 59,861 Net income (loss) attributable to common stockholders $ 280,559 $ 396,587 $ 840,404 $ 1,570,261 Average number of common shares outstanding: Basic 672,407 724,329 657,571 711,389 Diluted 685,399 754,903 669,218 739,794 Net income (loss) attributable to common stockholders per share: Basic $ 0.42 $ 0.55 $ 1.28 $ 2.21 Diluted(2) $ 0.41 $ 0.54 $ 1.26 $ 2.16 Common dividends per share $ 0.74 $ 0.85 $ 2.08 $ 2.33 (1) Includes amounts attributable to redeemable noncontrolling interests. (2) Includes adjustment to the numerator for income (loss) attributable to OP Units and DownREIT Units. 8
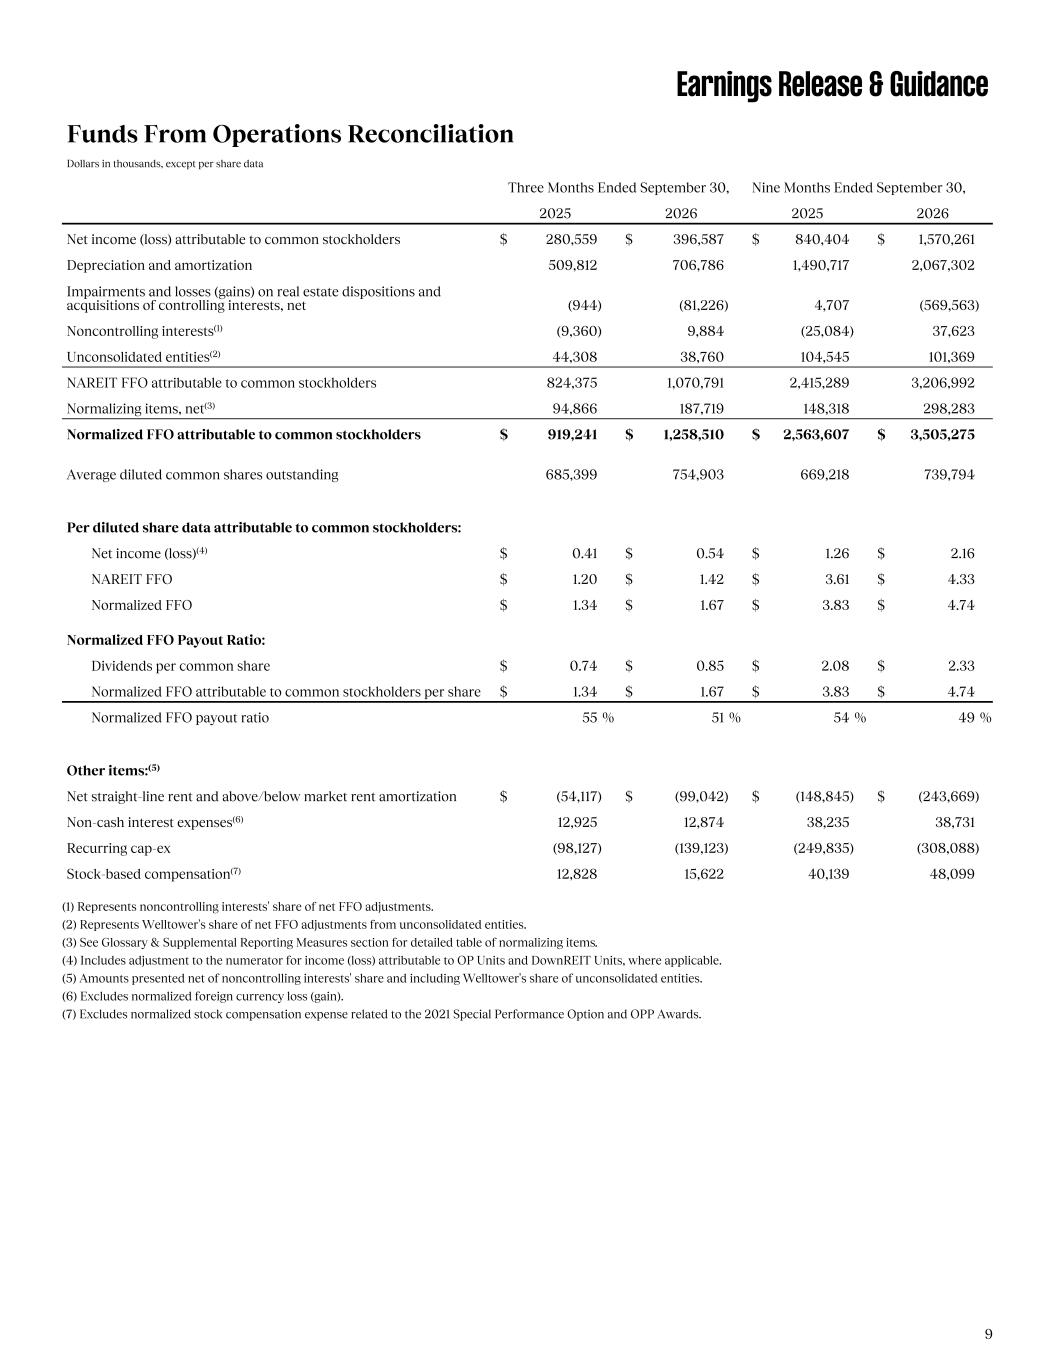
Earnings Release & Guidance Funds From Operations Reconciliation Dollars in thousands, except per share data Three Months Ended September 30, Nine Months Ended September 30, 2025 2026 2025 2026 Net income (loss) attributable to common stockholders $ 280,559 $ 396,587 $ 840,404 $ 1,570,261 Depreciation and amortization 509,812 706,786 1,490,717 2,067,302 Impairments and losses (gains) on real estate dispositions and acquisitions of controlling interests, net (944) (81,226) 4,707 (569,563) Noncontrolling interests(1) (9,360) 9,884 (25,084) 37,623 Unconsolidated entities(2) 44,308 38,760 104,545 101,369 NAREIT FFO attributable to common stockholders 824,375 1,070,791 2,415,289 3,206,992 Normalizing items, net(3) 94,866 187,719 148,318 298,283 Normalized FFO attributable to common stockholders $ 919,241 $ 1,258,510 $ 2,563,607 $ 3,505,275 Average diluted common shares outstanding 685,399 754,903 669,218 739,794 Per diluted share data attributable to common stockholders: Net income (loss)(4) $ 0.41 $ 0.54 $ 1.26 $ 2.16 NAREIT FFO $ 1.20 $ 1.42 $ 3.61 $ 4.33 Normalized FFO $ 1.34 $ 1.67 $ 3.83 $ 4.74 Normalized FFO Payout Ratio: Dividends per common share $ 0.74 $ 0.85 $ 2.08 $ 2.33 Normalized FFO attributable to common stockholders per share $ 1.34 $ 1.67 $ 3.83 $ 4.74 Normalized FFO payout ratio 55 % 51 % 54 % 49 % Other items:(5) Net straight-line rent and above/below market rent amortization $ (54,117) $ (99,042) $ (148,845) $ (243,669) Non-cash interest expenses(6) 12,925 12,874 38,235 38,731 Recurring cap-ex (98,127) (139,123) (249,835) (308,088) Stock-based compensation(7) 12,828 15,622 40,139 48,099 (1) Represents noncontrolling interests' share of net FFO adjustments. (2) Represents Welltower's share of net FFO adjustments from unconsolidated entities. (3) See Glossary & Supplemental Reporting Measures section for detailed table of normalizing items. (4) Includes adjustment to the numerator for income (loss) attributable to OP Units and DownREIT Units, where applicable. (5) Amounts presented net of noncontrolling interests' share and including Welltower's share of unconsolidated entities. (6) Excludes normalized foreign currency loss (gain). (7) Excludes normalized stock compensation expense related to the 2021 Special Performance Option and OPP Awards. 9
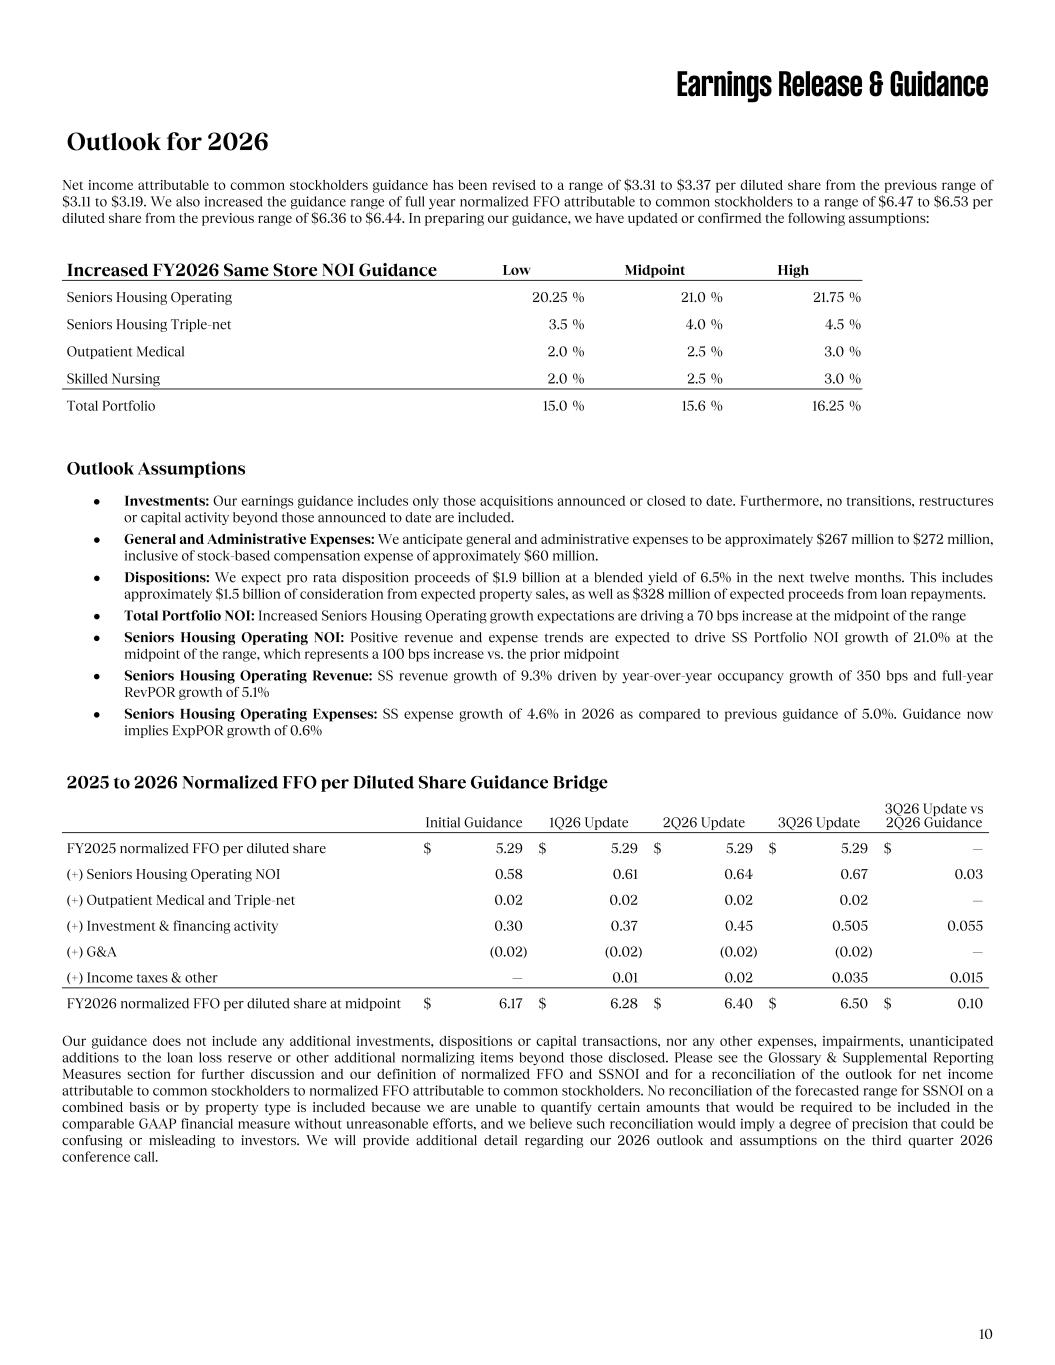
Earnings Release & Guidance Outlook for 2026 Net income attributable to common stockholders guidance has been revised to a range of $3.31 to $3.37 per diluted share from the previous range of $3.11 to $3.19. We also increased the guidance range of full year normalized FFO attributable to common stockholders to a range of $6.47 to $6.53 per diluted share from the previous range of $6.36 to $6.44. In preparing our guidance, we have updated or confirmed the following assumptions: Increased FY2026 Same Store NOI Guidance Low Midpoint High Seniors Housing Operating 20.25 % 21.0 % 21.75 % Seniors Housing Triple-net 3.5 % 4.0 % 4.5 % Outpatient Medical 2.0 % 2.5 % 3.0 % Skilled Nursing 2.0 % 2.5 % 3.0 % Total Portfolio 15.0 % 15.6 % 16.25 % Outlook Assumptions • Investments: Our earnings guidance includes only those acquisitions announced or closed to date. Furthermore, no transitions, restructures or capital activity beyond those announced to date are included. • General and Administrative Expenses: We anticipate general and administrative expenses to be approximately $267 million to $272 million, inclusive of stock-based compensation expense of approximately $60 million. • Dispositions: We expect pro rata disposition proceeds of $1.9 billion at a blended yield of 6.5% in the next twelve months. This includes approximately $1.5 billion of consideration from expected property sales, as well as $328 million of expected proceeds from loan repayments. • Total Portfolio NOI: Increased Seniors Housing Operating growth expectations are driving a 70 bps increase at the midpoint of the range • Seniors Housing Operating NOI: Positive revenue and expense trends are expected to drive SS Portfolio NOI growth of 21.0% at the midpoint of the range, which represents a 100 bps increase vs. the prior midpoint • Seniors Housing Operating Revenue: SS revenue growth of 9.3% driven by year-over-year occupancy growth of 350 bps and full-year RevPOR growth of 5.1% • Seniors Housing Operating Expenses: SS expense growth of 4.6% in 2026 as compared to previous guidance of 5.0%. Guidance now implies ExpPOR growth of 0.6% 2025 to 2026 Normalized FFO per Diluted Share Guidance Bridge Initial Guidance 1Q26 Update 2Q26 Update 3Q26 Update 3Q26 Update vs 2Q26 Guidance FY2025 normalized FFO per diluted share $ 5.29 $ 5.29 $ 5.29 $ 5.29 $ — (+) Seniors Housing Operating NOI 0.58 0.61 0.64 0.67 0.03 (+) Outpatient Medical and Triple-net 0.02 0.02 0.02 0.02 — (+) Investment & financing activity 0.30 0.37 0.45 0.505 0.055 (+) G&A (0.02) (0.02) (0.02) (0.02) — (+) Income taxes & other — 0.01 0.02 0.035 0.015 FY2026 normalized FFO per diluted share at midpoint $ 6.17 $ 6.28 $ 6.40 $ 6.50 $ 0.10 Our guidance does not include any additional investments, dispositions or capital transactions, nor any other expenses, impairments, unanticipated additions to the loan loss reserve or other additional normalizing items beyond those disclosed. Please see the Glossary & Supplemental Reporting Measures section for further discussion and our definition of normalized FFO and SSNOI and for a reconciliation of the outlook for net income attributable to common stockholders to normalized FFO attributable to common stockholders. No reconciliation of the forecasted range for SSNOI on a combined basis or by property type is included because we are unable to quantify certain amounts that would be required to be included in the comparable GAAP financial measure without unreasonable efforts, and we believe such reconciliation would imply a degree of precision that could be confusing or misleading to investors. We will provide additional detail regarding our 2026 outlook and assumptions on the third quarter 2026 conference call. 10

Portfolio Information Boston, MA
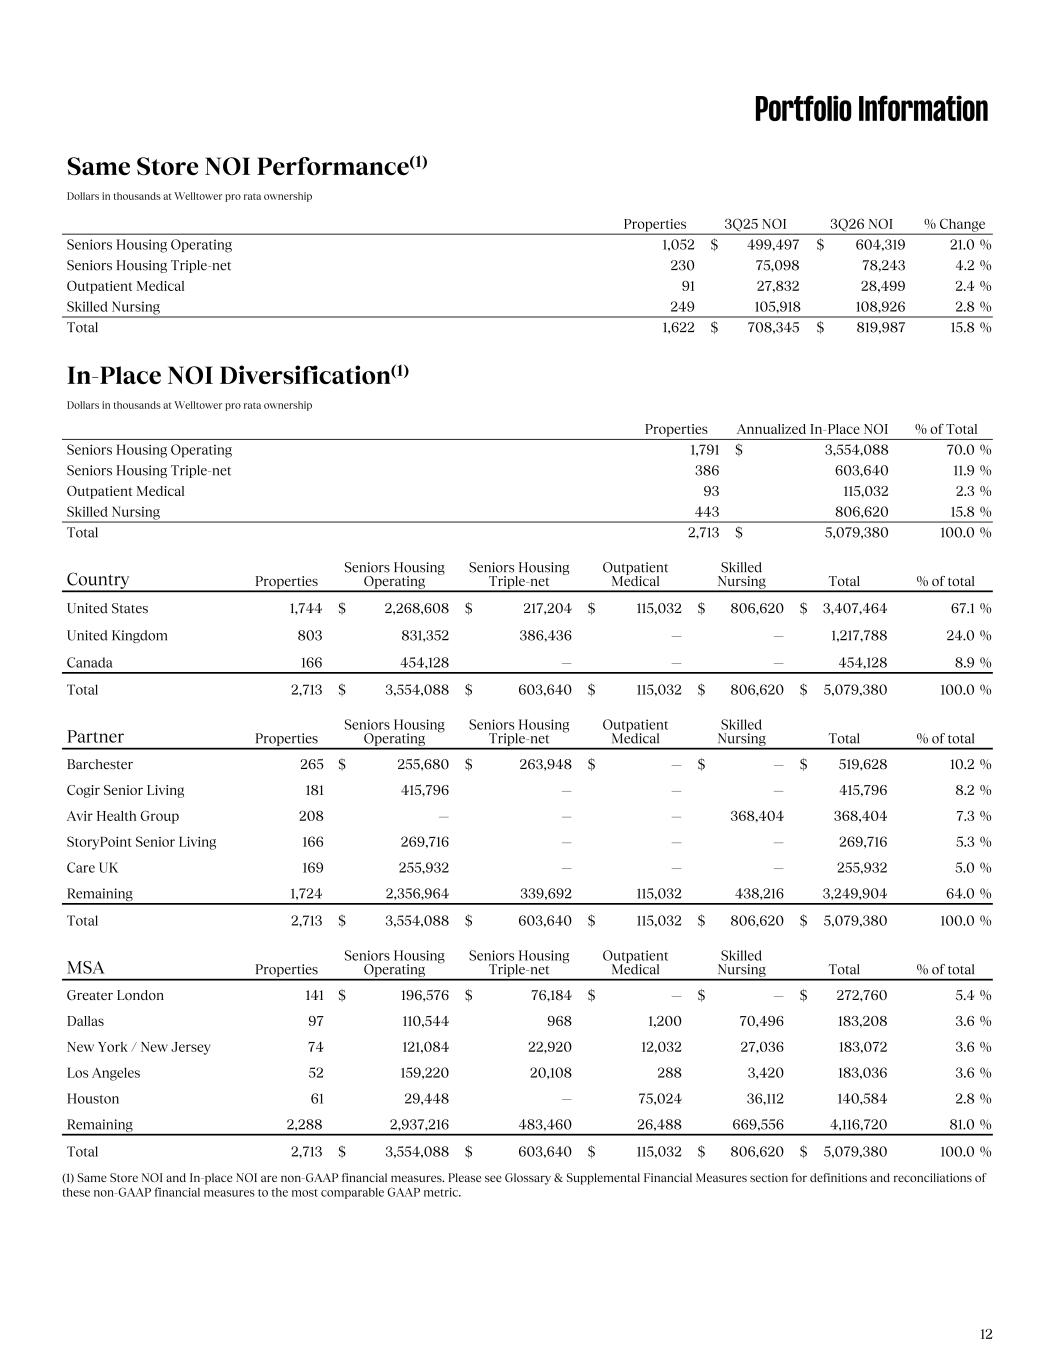
Portfolio Information Same Store NOI Performance(1) Dollars in thousands at Welltower pro rata ownership Properties 3Q25 NOI 3Q26 NOI % Change Seniors Housing Operating 1,052 $ 499,497 $ 604,319 21.0 % Seniors Housing Triple-net 230 75,098 78,243 4.2 % Outpatient Medical 91 27,832 28,499 2.4 % Skilled Nursing 249 105,918 108,926 2.8 % Total 1,622 $ 708,345 $ 819,987 15.8 % In-Place NOI Diversification(1) Dollars in thousands at Welltower pro rata ownership Properties Annualized In-Place NOI % of Total Seniors Housing Operating 1,791 $ 3,554,088 70.0 % Seniors Housing Triple-net 386 603,640 11.9 % Outpatient Medical 93 115,032 2.3 % Skilled Nursing 443 806,620 15.8 % Total 2,713 $ 5,079,380 100.0 % Country Properties Seniors Housing Operating Seniors Housing Triple-net Outpatient Medical Skilled Nursing Total % of total United States 1,744 $ 2,268,608 $ 217,204 $ 115,032 $ 806,620 $ 3,407,464 67.1 % United Kingdom 803 831,352 386,436 — — 1,217,788 24.0 % Canada 166 454,128 — — — 454,128 8.9 % Total 2,713 $ 3,554,088 $ 603,640 $ 115,032 $ 806,620 $ 5,079,380 100.0 % Partner Properties Seniors Housing Operating Seniors Housing Triple-net Outpatient Medical Skilled Nursing Total % of total Barchester 265 $ 255,680 $ 263,948 $ — $ — $ 519,628 10.2 % Cogir Senior Living 181 415,796 — — — 415,796 8.2 % Avir Health Group 208 — — — 368,404 368,404 7.3 % StoryPoint Senior Living 166 269,716 — — — 269,716 5.3 % Care UK 169 255,932 — — — 255,932 5.0 % Remaining 1,724 2,356,964 339,692 115,032 438,216 3,249,904 64.0 % Total 2,713 $ 3,554,088 $ 603,640 $ 115,032 $ 806,620 $ 5,079,380 100.0 % MSA Properties Seniors Housing Operating Seniors Housing Triple-net Outpatient Medical Skilled Nursing Total % of total Greater London 141 $ 196,576 $ 76,184 $ — $ — $ 272,760 5.4 % Dallas 97 110,544 968 1,200 70,496 183,208 3.6 % New York / New Jersey 74 121,084 22,920 12,032 27,036 183,072 3.6 % Los Angeles 52 159,220 20,108 288 3,420 183,036 3.6 % Houston 61 29,448 — 75,024 36,112 140,584 2.8 % Remaining 2,288 2,937,216 483,460 26,488 669,556 4,116,720 81.0 % Total 2,713 $ 3,554,088 $ 603,640 $ 115,032 $ 806,620 $ 5,079,380 100.0 % (1) Same Store NOI and In-place NOI are non-GAAP financial measures. Please see Glossary & Supplemental Financial Measures section for definitions and reconciliations of these non-GAAP financial measures to the most comparable GAAP metric. 12
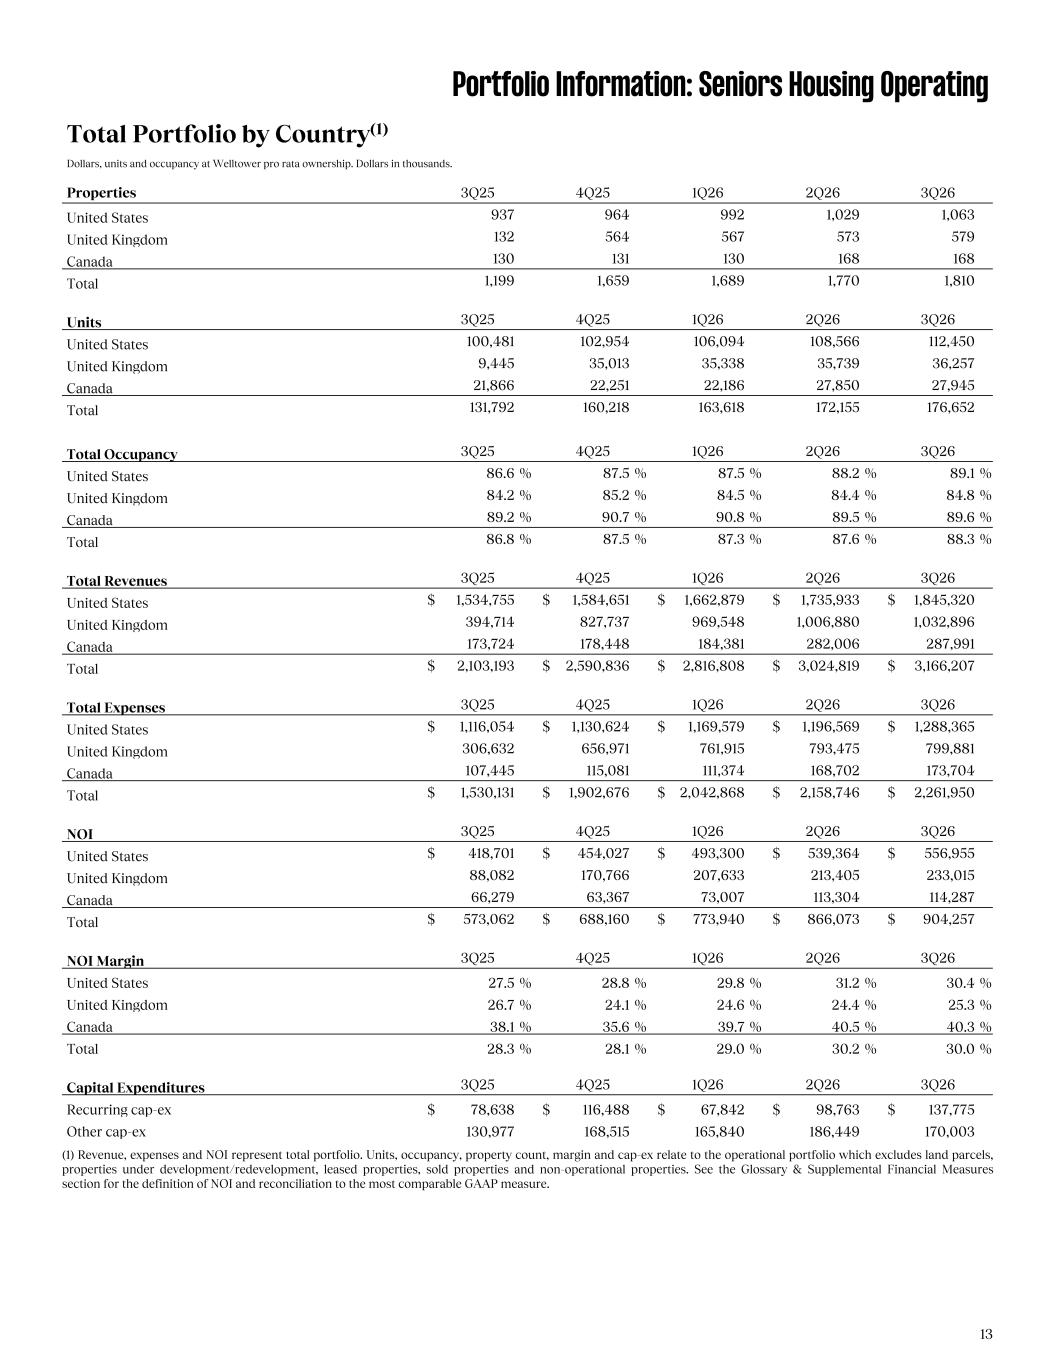
Portfolio Information: Seniors Housing Operating Total Portfolio by Country(1) Dollars, units and occupancy at Welltower pro rata ownership. Dollars in thousands. Properties 3Q25 4Q25 1Q26 2Q26 3Q26 United States 937 964 992 1,029 1,063 United Kingdom 132 564 567 573 579 Canada 130 131 130 168 168 Total 1,199 1,659 1,689 1,770 1,810 Units 3Q25 4Q25 1Q26 2Q26 3Q26 United States 100,481 102,954 106,094 108,566 112,450 United Kingdom 9,445 35,013 35,338 35,739 36,257 Canada 21,866 22,251 22,186 27,850 27,945 Total 131,792 160,218 163,618 172,155 176,652 Total Occupancy 3Q25 4Q25 1Q26 2Q26 3Q26 United States 86.6 % 87.5 % 87.5 % 88.2 % 89.1 % United Kingdom 84.2 % 85.2 % 84.5 % 84.4 % 84.8 % Canada 89.2 % 90.7 % 90.8 % 89.5 % 89.6 % Total 86.8 % 87.5 % 87.3 % 87.6 % 88.3 % Total Revenues 3Q25 4Q25 1Q26 2Q26 3Q26 United States $ 1,534,755 $ 1,584,651 $ 1,662,879 $ 1,735,933 $ 1,845,320 United Kingdom 394,714 827,737 969,548 1,006,880 1,032,896 Canada 173,724 178,448 184,381 282,006 287,991 Total $ 2,103,193 $ 2,590,836 $ 2,816,808 $ 3,024,819 $ 3,166,207 Total Expenses 3Q25 4Q25 1Q26 2Q26 3Q26 United States $ 1,116,054 $ 1,130,624 $ 1,169,579 $ 1,196,569 $ 1,288,365 United Kingdom 306,632 656,971 761,915 793,475 799,881 Canada 107,445 115,081 111,374 168,702 173,704 Total $ 1,530,131 $ 1,902,676 $ 2,042,868 $ 2,158,746 $ 2,261,950 NOI 3Q25 4Q25 1Q26 2Q26 3Q26 United States $ 418,701 $ 454,027 $ 493,300 $ 539,364 $ 556,955 United Kingdom 88,082 170,766 207,633 213,405 233,015 Canada 66,279 63,367 73,007 113,304 114,287 Total $ 573,062 $ 688,160 $ 773,940 $ 866,073 $ 904,257 NOI Margin 3Q25 4Q25 1Q26 2Q26 3Q26 United States 27.5 % 28.8 % 29.8 % 31.2 % 30.4 % United Kingdom 26.7 % 24.1 % 24.6 % 24.4 % 25.3 % Canada 38.1 % 35.6 % 39.7 % 40.5 % 40.3 % Total 28.3 % 28.1 % 29.0 % 30.2 % 30.0 % Capital Expenditures 3Q25 4Q25 1Q26 2Q26 3Q26 Recurring cap-ex $ 78,638 $ 116,488 $ 67,842 $ 98,763 $ 137,775 Other cap-ex 130,977 168,515 165,840 186,449 170,003 (1) Revenue, expenses and NOI represent total portfolio. Units, occupancy, property count, margin and cap-ex relate to the operational portfolio which excludes land parcels, properties under development/redevelopment, leased properties, sold properties and non-operational properties. See the Glossary & Supplemental Financial Measures section for the definition of NOI and reconciliation to the most comparable GAAP measure. 13
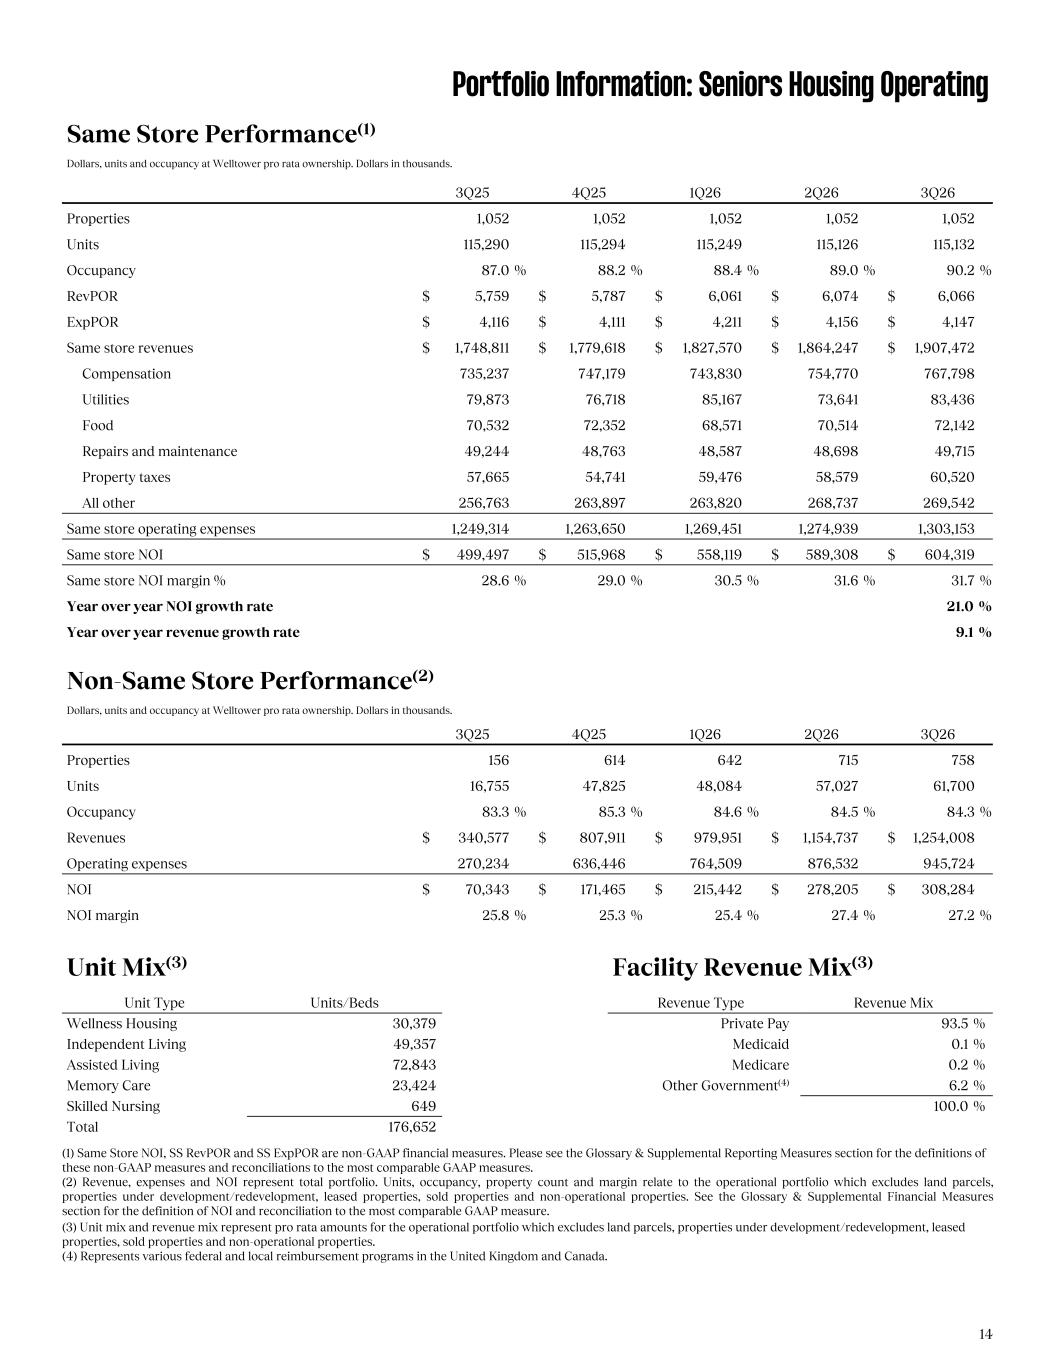
Portfolio Information: Seniors Housing Operating Same Store Performance(1) Dollars, units and occupancy at Welltower pro rata ownership. Dollars in thousands. 3Q25 4Q25 1Q26 2Q26 3Q26 Properties 1,052 1,052 1,052 1,052 1,052 Units 115,290 115,294 115,249 115,126 115,132 Occupancy 87.0 % 88.2 % 88.4 % 89.0 % 90.2 % RevPOR $ 5,759 $ 5,787 $ 6,061 $ 6,074 $ 6,066 ExpPOR $ 4,116 $ 4,111 $ 4,211 $ 4,156 $ 4,147 Same store revenues $ 1,748,811 $ 1,779,618 $ 1,827,570 $ 1,864,247 $ 1,907,472 Compensation 735,237 747,179 743,830 754,770 767,798 Utilities 79,873 76,718 85,167 73,641 83,436 Food 70,532 72,352 68,571 70,514 72,142 Repairs and maintenance 49,244 48,763 48,587 48,698 49,715 Property taxes 57,665 54,741 59,476 58,579 60,520 All other 256,763 263,897 263,820 268,737 269,542 Same store operating expenses 1,249,314 1,263,650 1,269,451 1,274,939 1,303,153 Same store NOI $ 499,497 $ 515,968 $ 558,119 $ 589,308 $ 604,319 Same store NOI margin % 28.6 % 29.0 % 30.5 % 31.6 % 31.7 % Year over year NOI growth rate 21.0 % Year over year revenue growth rate 9.1 % Non-Same Store Performance(2) Dollars, units and occupancy at Welltower pro rata ownership. Dollars in thousands. 3Q25 4Q25 1Q26 2Q26 3Q26 Properties 156 614 642 715 758 Units 16,755 47,825 48,084 57,027 61,700 Occupancy 83.3 % 85.3 % 84.6 % 84.5 % 84.3 % Revenues $ 340,577 $ 807,911 $ 979,951 $ 1,154,737 $ 1,254,008 Operating expenses 270,234 636,446 764,509 876,532 945,724 NOI $ 70,343 $ 171,465 $ 215,442 $ 278,205 $ 308,284 NOI margin 25.8 % 25.3 % 25.4 % 27.4 % 27.2 % Unit Mix(3) Facility Revenue Mix(3) Unit Type Units/Beds Revenue Type Revenue Mix Wellness Housing 30,379 Private Pay 93.5 % Independent Living 49,357 Medicaid 0.1 % Assisted Living 72,843 Medicare 0.2 % Memory Care 23,424 Other Government(4) 6.2 % Skilled Nursing 649 100.0 % Total 176,652 (1) Same Store NOI, SS RevPOR and SS ExpPOR are non-GAAP financial measures. Please see the Glossary & Supplemental Reporting Measures section for the definitions of these non-GAAP measures and reconciliations to the most comparable GAAP measures. (2) Revenue, expenses and NOI represent total portfolio. Units, occupancy, property count and margin relate to the operational portfolio which excludes land parcels, properties under development/redevelopment, leased properties, sold properties and non-operational properties. See the Glossary & Supplemental Financial Measures section for the definition of NOI and reconciliation to the most comparable GAAP measure. (3) Unit mix and revenue mix represent pro rata amounts for the operational portfolio which excludes land parcels, properties under development/redevelopment, leased properties, sold properties and non-operational properties. (4) Represents various federal and local reimbursement programs in the United Kingdom and Canada. 14
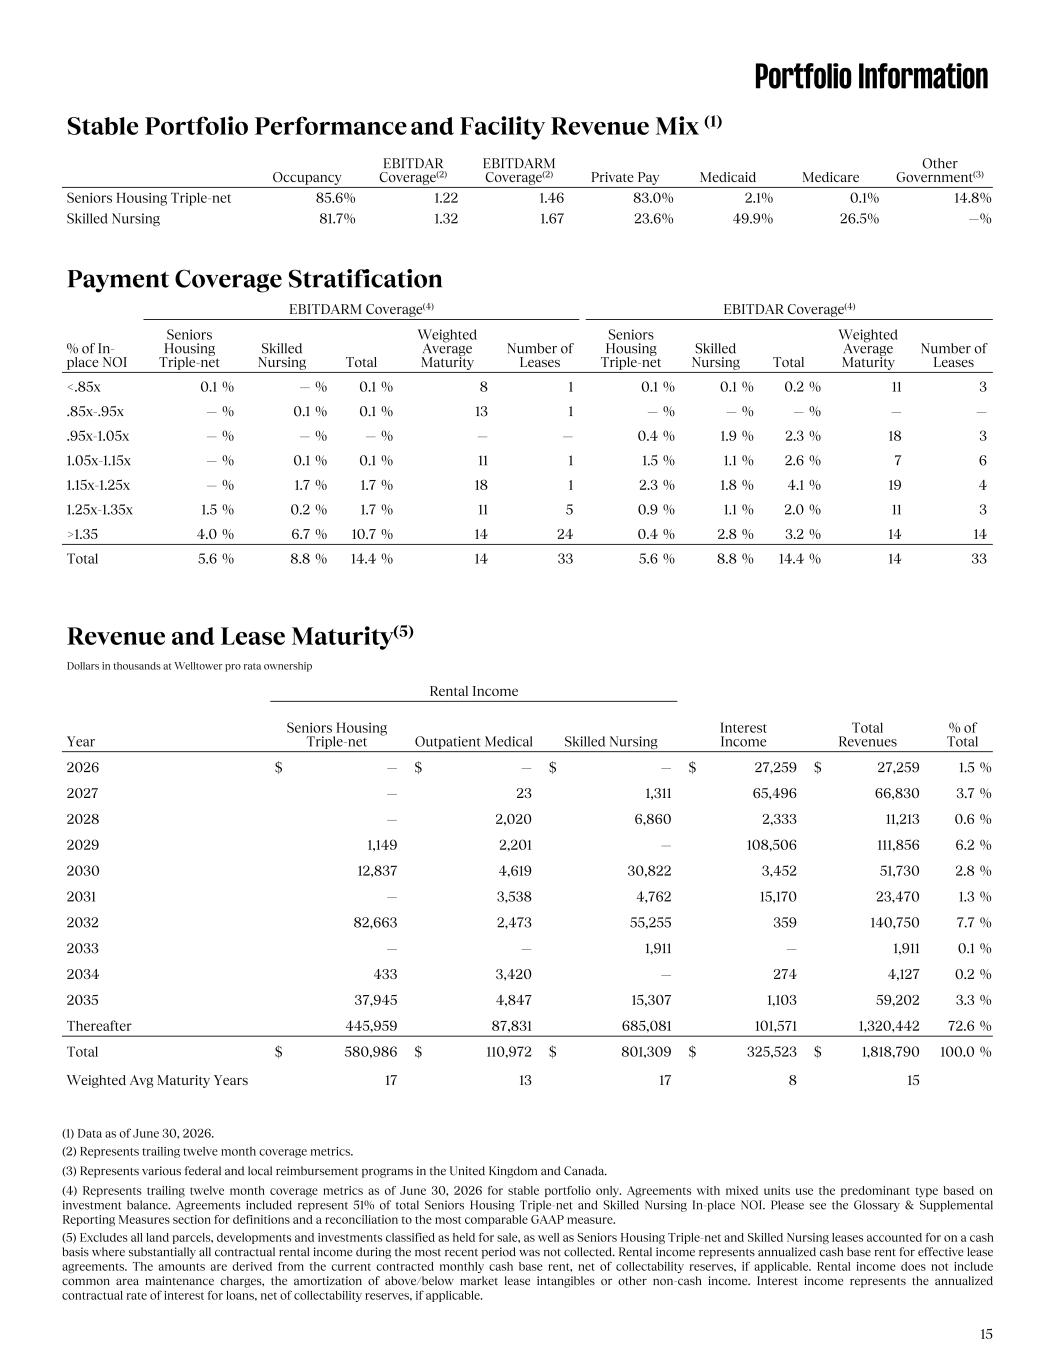
Portfolio Information Stable Portfolio Performance and Facility Revenue Mix (1) Occupancy EBITDAR Coverage(2) EBITDARM Coverage(2) Private Pay Medicaid Medicare Other Government(3) Seniors Housing Triple-net 85.6 % 1.22 1.46 83.0 % 2.1 % 0.1 % 14.8 % Skilled Nursing 81.7 % 1.32 1.67 23.6 % 49.9 % 26.5 % — % Payment Coverage Stratification EBITDARM Coverage(4) EBITDAR Coverage(4) % of In- place NOI Seniors Housing Triple-net Skilled Nursing Total Weighted Average Maturity Number of Leases Seniors Housing Triple-net Skilled Nursing Total Weighted Average Maturity Number of Leases <.85x 0.1 % — % 0.1 % 8 1 0.1 % 0.1 % 0.2 % 11 3 .85x-.95x — % 0.1 % 0.1 % 13 1 — % — % — % — — .95x-1.05x — % — % — % — — 0.4 % 1.9 % 2.3 % 18 3 1.05x-1.15x — % 0.1 % 0.1 % 11 1 1.5 % 1.1 % 2.6 % 7 6 1.15x-1.25x — % 1.7 % 1.7 % 18 1 2.3 % 1.8 % 4.1 % 19 4 1.25x-1.35x 1.5 % 0.2 % 1.7 % 11 5 0.9 % 1.1 % 2.0 % 11 3 >1.35 4.0 % 6.7 % 10.7 % 14 24 0.4 % 2.8 % 3.2 % 14 14 Total 5.6 % 8.8 % 14.4 % 14 33 5.6 % 8.8 % 14.4 % 14 33 Revenue and Lease Maturity(5) Dollars in thousands at Welltower pro rata ownership Rental Income Year Seniors Housing Triple-net Outpatient Medical Skilled Nursing Interest Income Total Revenues % of Total 2026 $ — $ — $ — $ 27,259 $ 27,259 1.5 % 2027 — 23 1,311 65,496 66,830 3.7 % 2028 — 2,020 6,860 2,333 11,213 0.6 % 2029 1,149 2,201 — 108,506 111,856 6.2 % 2030 12,837 4,619 30,822 3,452 51,730 2.8 % 2031 — 3,538 4,762 15,170 23,470 1.3 % 2032 82,663 2,473 55,255 359 140,750 7.7 % 2033 — — 1,911 — 1,911 0.1 % 2034 433 3,420 — 274 4,127 0.2 % 2035 37,945 4,847 15,307 1,103 59,202 3.3 % Thereafter 445,959 87,831 685,081 101,571 1,320,442 72.6 % Total $ 580,986 $ 110,972 $ 801,309 $ 325,523 $ 1,818,790 100.0 % Weighted Avg Maturity Years 17 13 17 8 15 (1) Data as of June 30, 2026. (2) Represents trailing twelve month coverage metrics. (3) Represents various federal and local reimbursement programs in the United Kingdom and Canada. (4) Represents trailing twelve month coverage metrics as of June 30, 2026 for stable portfolio only. Agreements with mixed units use the predominant type based on investment balance. Agreements included represent 51% of total Seniors Housing Triple-net and Skilled Nursing In-place NOI. Please see the Glossary & Supplemental Reporting Measures section for definitions and a reconciliation to the most comparable GAAP measure. (5) Excludes all land parcels, developments and investments classified as held for sale, as well as Seniors Housing Triple-net and Skilled Nursing leases accounted for on a cash basis where substantially all contractual rental income during the most recent period was not collected. Rental income represents annualized cash base rent for effective lease agreements. The amounts are derived from the current contracted monthly cash base rent, net of collectability reserves, if applicable. Rental income does not include common area maintenance charges, the amortization of above/below market lease intangibles or other non-cash income. Interest income represents the annualized contractual rate of interest for loans, net of collectability reserves, if applicable. 15
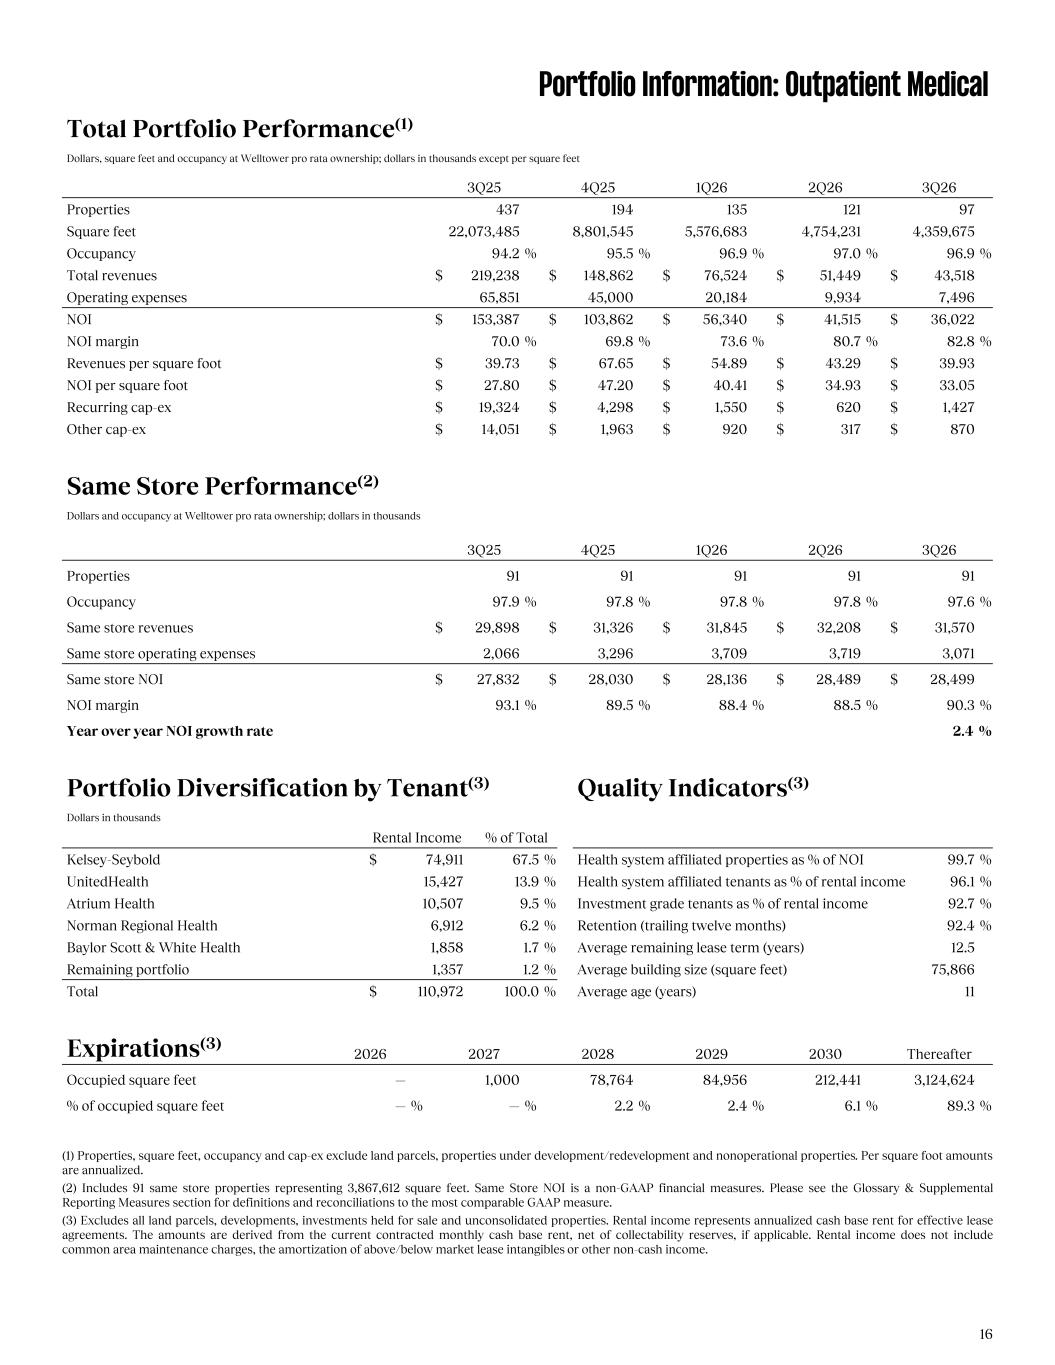
Portfolio Information: Outpatient Medical Total Portfolio Performance(1) Dollars, square feet and occupancy at Welltower pro rata ownership; dollars in thousands except per square feet 3Q25 4Q25 1Q26 2Q26 3Q26 Properties 437 194 135 121 97 Square feet 22,073,485 8,801,545 5,576,683 4,754,231 4,359,675 Occupancy 94.2 % 95.5 % 96.9 % 97.0 % 96.9 % Total revenues $ 219,238 $ 148,862 $ 76,524 $ 51,449 $ 43,518 Operating expenses 65,851 45,000 20,184 9,934 7,496 NOI $ 153,387 $ 103,862 $ 56,340 $ 41,515 $ 36,022 NOI margin 70.0 % 69.8 % 73.6 % 80.7 % 82.8 % Revenues per square foot $ 39.73 $ 67.65 $ 54.89 $ 43.29 $ 39.93 NOI per square foot $ 27.80 $ 47.20 $ 40.41 $ 34.93 $ 33.05 Recurring cap-ex $ 19,324 $ 4,298 $ 1,550 $ 620 $ 1,427 Other cap-ex $ 14,051 $ 1,963 $ 920 $ 317 $ 870 Same Store Performance(2) Dollars and occupancy at Welltower pro rata ownership; dollars in thousands 3Q25 4Q25 1Q26 2Q26 3Q26 Properties 91 91 91 91 91 Occupancy 97.9 % 97.8 % 97.8 % 97.8 % 97.6 % Same store revenues $ 29,898 $ 31,326 $ 31,845 $ 32,208 $ 31,570 Same store operating expenses 2,066 3,296 3,709 3,719 3,071 Same store NOI $ 27,832 $ 28,030 $ 28,136 $ 28,489 $ 28,499 NOI margin 93.1 % 89.5 % 88.4 % 88.5 % 90.3 % Year over year NOI growth rate 2.4 % Portfolio Diversification by Tenant(3) Quality Indicators(3) Dollars in thousands Rental Income % of Total Kelsey-Seybold $ 74,911 67.5 % Health system affiliated properties as % of NOI 99.7 % UnitedHealth 15,427 13.9 % Health system affiliated tenants as % of rental income 96.1 % Atrium Health 10,507 9.5 % Investment grade tenants as % of rental income 92.7 % Norman Regional Health 6,912 6.2 % Retention (trailing twelve months) 92.4 % Baylor Scott & White Health 1,858 1.7 % Average remaining lease term (years) 12.5 Remaining portfolio 1,357 1.2 % Average building size (square feet) 75,866 Total $ 110,972 100.0 % Average age (years) 11 Expirations(3) 2026 2027 2028 2029 2030 Thereafter Occupied square feet — 1,000 78,764 84,956 212,441 3,124,624 % of occupied square feet — % — % 2.2 % 2.4 % 6.1 % 89.3 % (1) Properties, square feet, occupancy and cap-ex exclude land parcels, properties under development/redevelopment and nonoperational properties. Per square foot amounts are annualized. (2) Includes 91 same store properties representing 3,867,612 square feet. Same Store NOI is a non-GAAP financial measures. Please see the Glossary & Supplemental Reporting Measures section for definitions and reconciliations to the most comparable GAAP measure. (3) Excludes all land parcels, developments, investments held for sale and unconsolidated properties. Rental income represents annualized cash base rent for effective lease agreements. The amounts are derived from the current contracted monthly cash base rent, net of collectability reserves, if applicable. Rental income does not include common area maintenance charges, the amortization of above/below market lease intangibles or other non-cash income. 16

Capital Allocation New York, NY
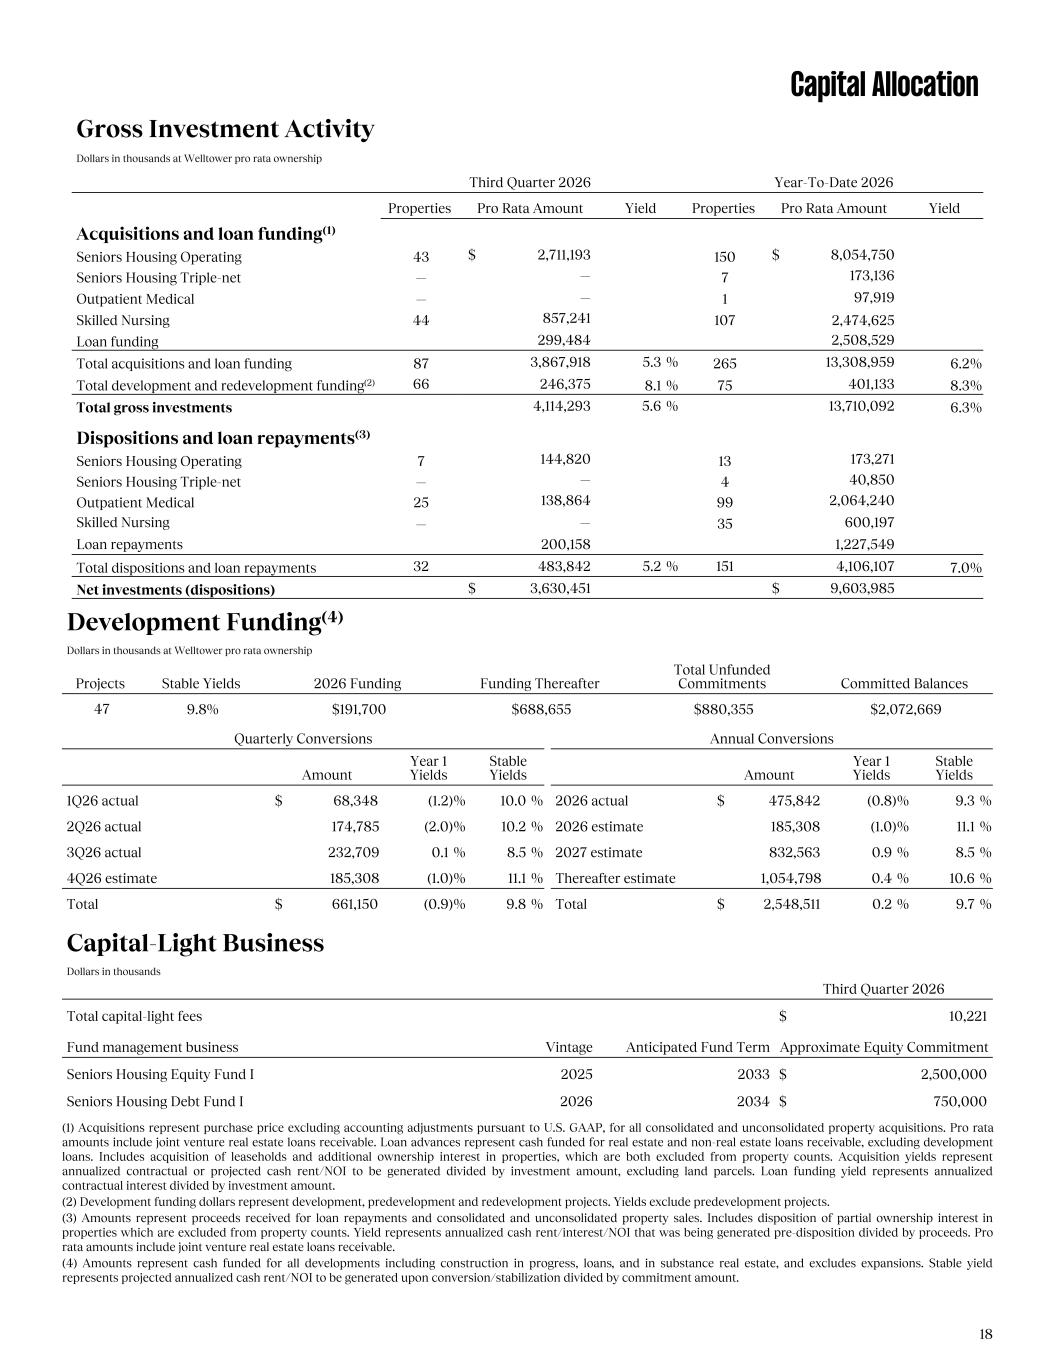
Capital Allocation Gross Investment Activity Dollars in thousands at Welltower pro rata ownership Third Quarter 2026 Year-To-Date 2026 Properties Pro Rata Amount Yield Properties Pro Rata Amount Yield Acquisitions and loan funding(1) Seniors Housing Operating 43 $ 2,711,193 150 $ 8,054,750 Seniors Housing Triple-net — — 7 173,136 Outpatient Medical — — 1 97,919 Skilled Nursing 44 857,241 107 2,474,625 Loan funding 299,484 2,508,529 Total acquisitions and loan funding 87 3,867,918 5.3 % 265 13,308,959 6.2 % Total development and redevelopment funding(2) 66 246,375 8.1 % 75 401,133 8.3 % Total gross investments 4,114,293 5.6 % 13,710,092 6.3 % Dispositions and loan repayments(3) Seniors Housing Operating 7 144,820 13 173,271 Seniors Housing Triple-net — — 4 40,850 Outpatient Medical 25 138,864 99 2,064,240 Skilled Nursing — — 35 600,197 Loan repayments 200,158 1,227,549 Total dispositions and loan repayments 32 483,842 5.2 % 151 4,106,107 7.0 % Net investments (dispositions) $ 3,630,451 $ 9,603,985 Development Funding(4) Dollars in thousands at Welltower pro rata ownership Projects Stable Yields 2026 Funding Funding Thereafter Total Unfunded Commitments Committed Balances 47 9.8% $191,700 $688,655 $880,355 $2,072,669 Quarterly Conversions Annual Conversions Amount Year 1 Yields Stable Yields Amount Year 1 Yields Stable Yields 1Q26 actual $ 68,348 (1.2) % 10.0 % 2026 actual $ 475,842 (0.8) % 9.3 % 2Q26 actual 174,785 (2.0) % 10.2 % 2026 estimate 185,308 (1.0) % 11.1 % 3Q26 actual 232,709 0.1 % 8.5 % 2027 estimate 832,563 0.9 % 8.5 % 4Q26 estimate 185,308 (1.0) % 11.1 % Thereafter estimate 1,054,798 0.4 % 10.6 % Total $ 661,150 (0.9) % 9.8 % Total $ 2,548,511 0.2 % 9.7 % Capital-Light Business Dollars in thousands Third Quarter 2026 Total capital-light fees $ 10,221 Fund management business Vintage Anticipated Fund Term Approximate Equity Commitment Seniors Housing Equity Fund I 2025 2033 $ 2,500,000 Seniors Housing Debt Fund I 2026 2034 $ 750,000 (1) Acquisitions represent purchase price excluding accounting adjustments pursuant to U.S. GAAP, for all consolidated and unconsolidated property acquisitions. Pro rata amounts include joint venture real estate loans receivable. Loan advances represent cash funded for real estate and non-real estate loans receivable, excluding development loans. Includes acquisition of leaseholds and additional ownership interest in properties, which are both excluded from property counts. Acquisition yields represent annualized contractual or projected cash rent/NOI to be generated divided by investment amount, excluding land parcels. Loan funding yield represents annualized contractual interest divided by investment amount. (2) Development funding dollars represent development, predevelopment and redevelopment projects. Yields exclude predevelopment projects. (3) Amounts represent proceeds received for loan repayments and consolidated and unconsolidated property sales. Includes disposition of partial ownership interest in properties which are excluded from property counts. Yield represents annualized cash rent/interest/NOI that was being generated pre-disposition divided by proceeds. Pro rata amounts include joint venture real estate loans receivable. (4) Amounts represent cash funded for all developments including construction in progress, loans, and in substance real estate, and excludes expansions. Stable yield represents projected annualized cash rent/NOI to be generated upon conversion/stabilization divided by commitment amount. 18

Financial & Balance Sheet Metrics London, England
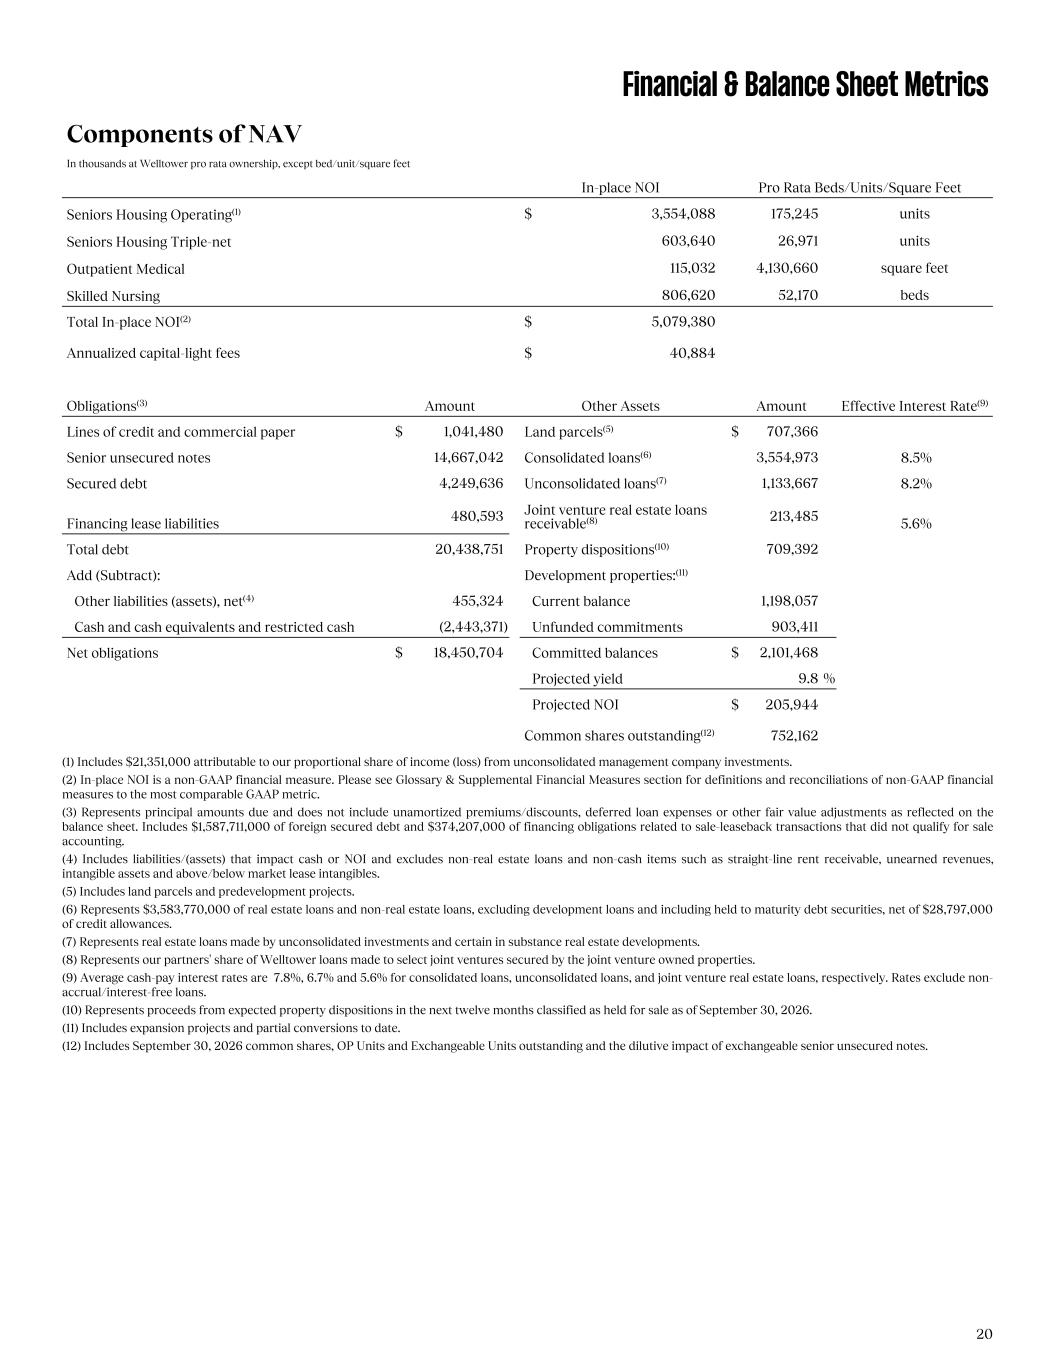
Financial & Balance Sheet Metrics Components of NAV In thousands at Welltower pro rata ownership, except bed/unit/square feet In-place NOI Pro Rata Beds/Units/Square Feet Seniors Housing Operating(1) $ 3,554,088 175,245 units Seniors Housing Triple-net 603,640 26,971 units Outpatient Medical 115,032 4,130,660 square feet Skilled Nursing 806,620 52,170 beds Total In-place NOI(2) $ 5,079,380 Annualized capital-light fees $ 40,884 Obligations(3) Amount Other Assets Amount Effective Interest Rate(9) Lines of credit and commercial paper $ 1,041,480 Land parcels(5) $ 707,366 Senior unsecured notes 14,667,042 Consolidated loans(6) 3,554,973 8.5% Secured debt 4,249,636 Unconsolidated loans(7) 1,133,667 8.2% Financing lease liabilities 480,593 Joint venture real estate loans receivable(8) 213,485 5.6% Total debt 20,438,751 Property dispositions(10) 709,392 Add (Subtract): Development properties:(11) Other liabilities (assets), net(4) 455,324 Current balance 1,198,057 Cash and cash equivalents and restricted cash (2,443,371) Unfunded commitments 903,411 Net obligations $ 18,450,704 Committed balances $ 2,101,468 Projected yield 9.8 % Projected NOI $ 205,944 Common shares outstanding(12) 752,162 (1) Includes $21,351,000 attributable to our proportional share of income (loss) from unconsolidated management company investments. (2) In-place NOI is a non-GAAP financial measure. Please see Glossary & Supplemental Financial Measures section for definitions and reconciliations of non-GAAP financial measures to the most comparable GAAP metric. (3) Represents principal amounts due and does not include unamortized premiums/discounts, deferred loan expenses or other fair value adjustments as reflected on the balance sheet. Includes $1,587,711,000 of foreign secured debt and $374,207,000 of financing obligations related to sale-leaseback transactions that did not qualify for sale accounting. (4) Includes liabilities/(assets) that impact cash or NOI and excludes non-real estate loans and non-cash items such as straight-line rent receivable, unearned revenues, intangible assets and above/below market lease intangibles. (5) Includes land parcels and predevelopment projects. (6) Represents $3,583,770,000 of real estate loans and non-real estate loans, excluding development loans and including held to maturity debt securities, net of $28,797,000 of credit allowances. (7) Represents real estate loans made by unconsolidated investments and certain in substance real estate developments. (8) Represents our partners' share of Welltower loans made to select joint ventures secured by the joint venture owned properties. (9) Average cash-pay interest rates are 7.8%, 6.7% and 5.6% for consolidated loans, unconsolidated loans, and joint venture real estate loans, respectively. Rates exclude non- accrual/interest-free loans. (10) Represents proceeds from expected property dispositions in the next twelve months classified as held for sale as of September 30, 2026. (11) Includes expansion projects and partial conversions to date. (12) Includes September 30, 2026 common shares, OP Units and Exchangeable Units outstanding and the dilutive impact of exchangeable senior unsecured notes. 20
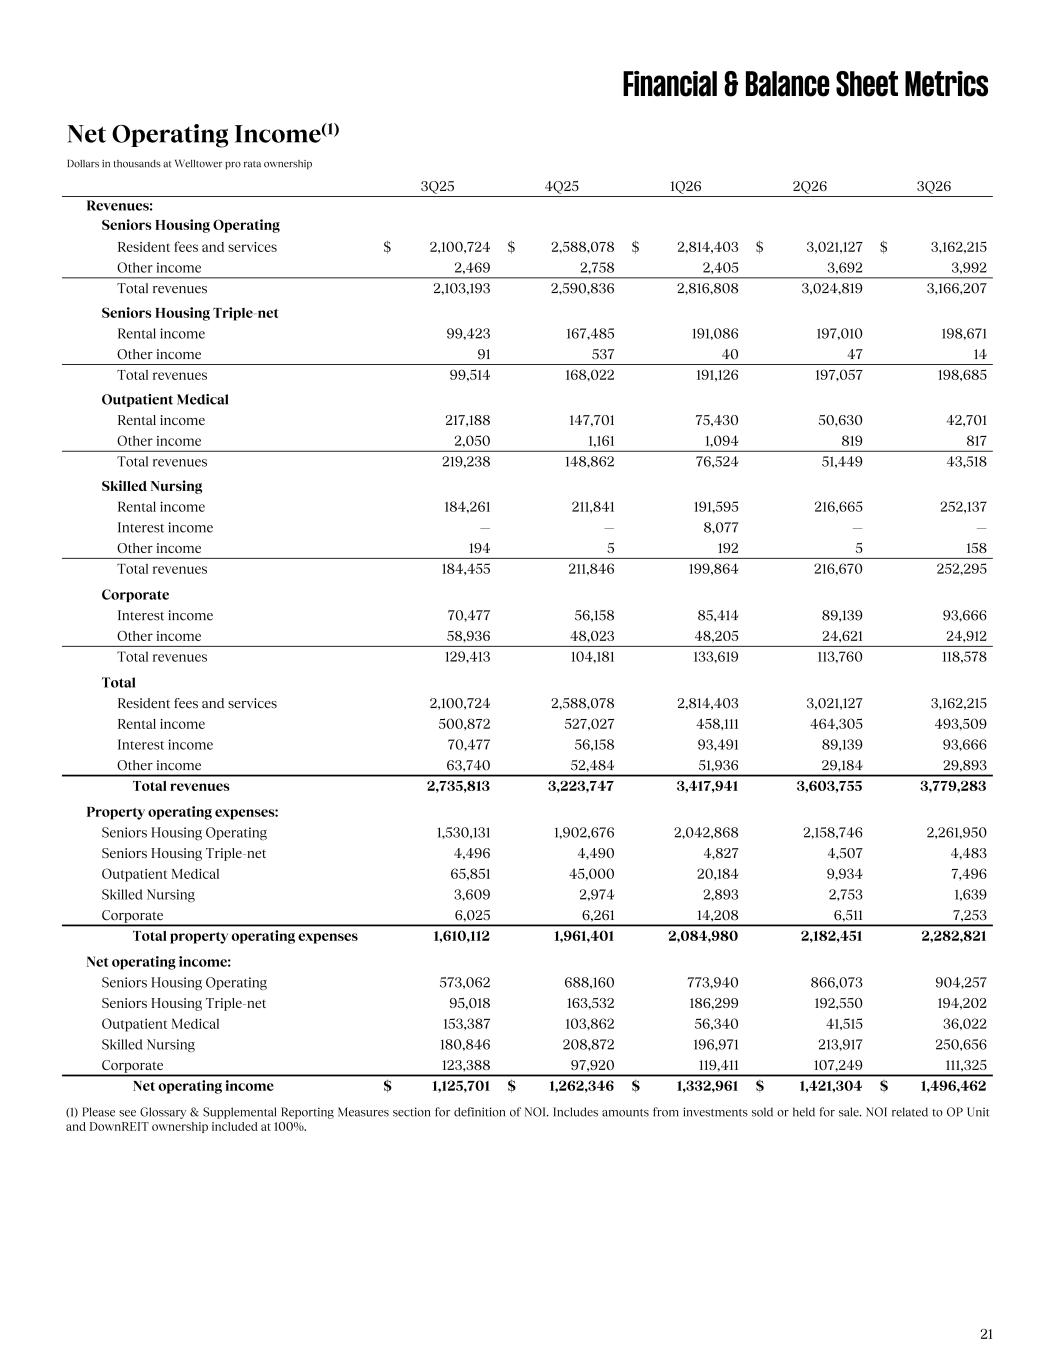
Financial & Balance Sheet Metrics Net Operating Income(1) Dollars in thousands at Welltower pro rata ownership 3Q25 4Q25 1Q26 2Q26 3Q26 Revenues: Seniors Housing Operating Resident fees and services $ 2,100,724 $ 2,588,078 $ 2,814,403 $ 3,021,127 $ 3,162,215 Other income 2,469 2,758 2,405 3,692 3,992 Total revenues 2,103,193 2,590,836 2,816,808 3,024,819 3,166,207 Seniors Housing Triple-net Rental income 99,423 167,485 191,086 197,010 198,671 Other income 91 537 40 47 14 Total revenues 99,514 168,022 191,126 197,057 198,685 Outpatient Medical Rental income 217,188 147,701 75,430 50,630 42,701 Other income 2,050 1,161 1,094 819 817 Total revenues 219,238 148,862 76,524 51,449 43,518 Skilled Nursing Rental income 184,261 211,841 191,595 216,665 252,137 Interest income — — 8,077 — — Other income 194 5 192 5 158 Total revenues 184,455 211,846 199,864 216,670 252,295 Corporate Interest income 70,477 56,158 85,414 89,139 93,666 Other income 58,936 48,023 48,205 24,621 24,912 Total revenues 129,413 104,181 133,619 113,760 118,578 Total Resident fees and services 2,100,724 2,588,078 2,814,403 3,021,127 3,162,215 Rental income 500,872 527,027 458,111 464,305 493,509 Interest income 70,477 56,158 93,491 89,139 93,666 Other income 63,740 52,484 51,936 29,184 29,893 Total revenues 2,735,813 3,223,747 3,417,941 3,603,755 3,779,283 Property operating expenses: Seniors Housing Operating 1,530,131 1,902,676 2,042,868 2,158,746 2,261,950 Seniors Housing Triple-net 4,496 4,490 4,827 4,507 4,483 Outpatient Medical 65,851 45,000 20,184 9,934 7,496 Skilled Nursing 3,609 2,974 2,893 2,753 1,639 Corporate 6,025 6,261 14,208 6,511 7,253 Total property operating expenses 1,610,112 1,961,401 2,084,980 2,182,451 2,282,821 Net operating income: Seniors Housing Operating 573,062 688,160 773,940 866,073 904,257 Seniors Housing Triple-net 95,018 163,532 186,299 192,550 194,202 Outpatient Medical 153,387 103,862 56,340 41,515 36,022 Skilled Nursing 180,846 208,872 196,971 213,917 250,656 Corporate 123,388 97,920 119,411 107,249 111,325 Net operating income $ 1,125,701 $ 1,262,346 $ 1,332,961 $ 1,421,304 $ 1,496,462 (1) Please see Glossary & Supplemental Reporting Measures section for definition of NOI. Includes amounts from investments sold or held for sale. NOI related to OP Unit and DownREIT ownership included at 100%. 21
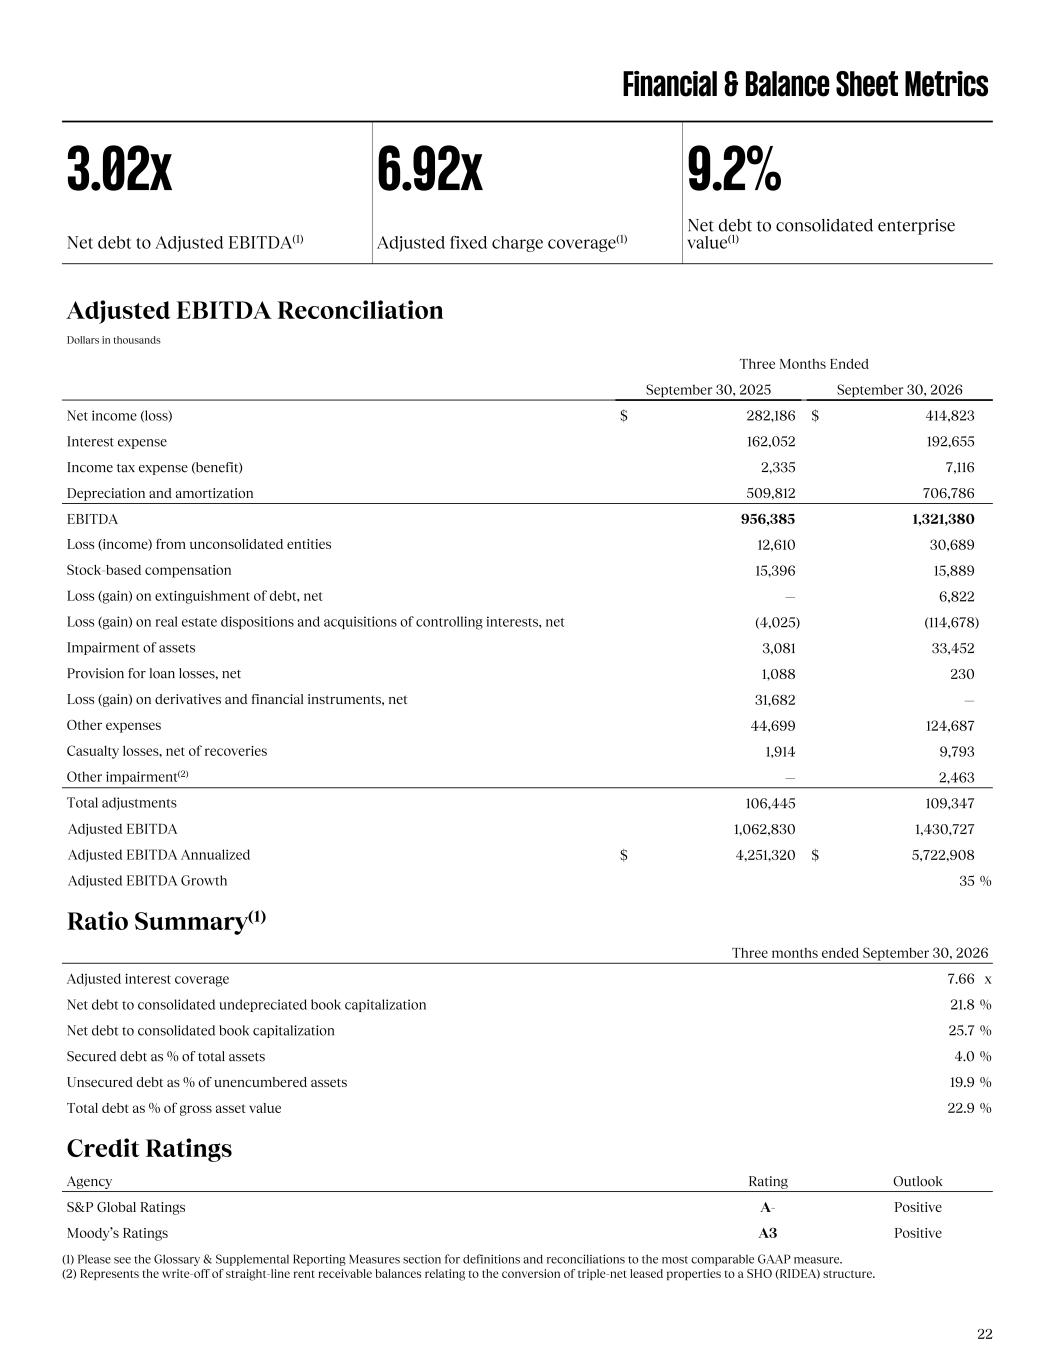
Financial & Balance Sheet Metrics 3.02x 6.92x 9.2% Net debt to Adjusted EBITDA(1) Adjusted fixed charge coverage(1) Net debt to consolidated enterprise value(1) Adjusted EBITDA Reconciliation Dollars in thousands Three Months Ended September 30, 2025 September 30, 2026 Net income (loss) $ 282,186 $ 414,823 Interest expense 162,052 192,655 Income tax expense (benefit) 2,335 7,116 Depreciation and amortization 509,812 706,786 EBITDA 956,385 1,321,380 Loss (income) from unconsolidated entities 12,610 30,689 Stock-based compensation 15,396 15,889 Loss (gain) on extinguishment of debt, net — 6,822 Loss (gain) on real estate dispositions and acquisitions of controlling interests, net (4,025) (114,678) Impairment of assets 3,081 33,452 Provision for loan losses, net 1,088 230 Loss (gain) on derivatives and financial instruments, net 31,682 — Other expenses 44,699 124,687 Casualty losses, net of recoveries 1,914 9,793 Other impairment(2) — 2,463 Total adjustments 106,445 109,347 Adjusted EBITDA 1,062,830 1,430,727 Adjusted EBITDA Annualized $ 4,251,320 $ 5,722,908 Adjusted EBITDA Growth 35 % Ratio Summary(1) Three months ended September 30, 2026 Adjusted interest coverage 7.66 x Net debt to consolidated undepreciated book capitalization 21.8 % Net debt to consolidated book capitalization 25.7 % Secured debt as % of total assets 4.0 % Unsecured debt as % of unencumbered assets 19.9 % Total debt as % of gross asset value 22.9 % Credit Ratings Agency Rating Outlook S&P Global Ratings A- Positive Moody’s Ratings A3 Positive (1) Please see the Glossary & Supplemental Reporting Measures section for definitions and reconciliations to the most comparable GAAP measure. (2) Represents the write-off of straight-line rent receivable balances relating to the conversion of triple-net leased properties to a SHO (RIDEA) structure. 22
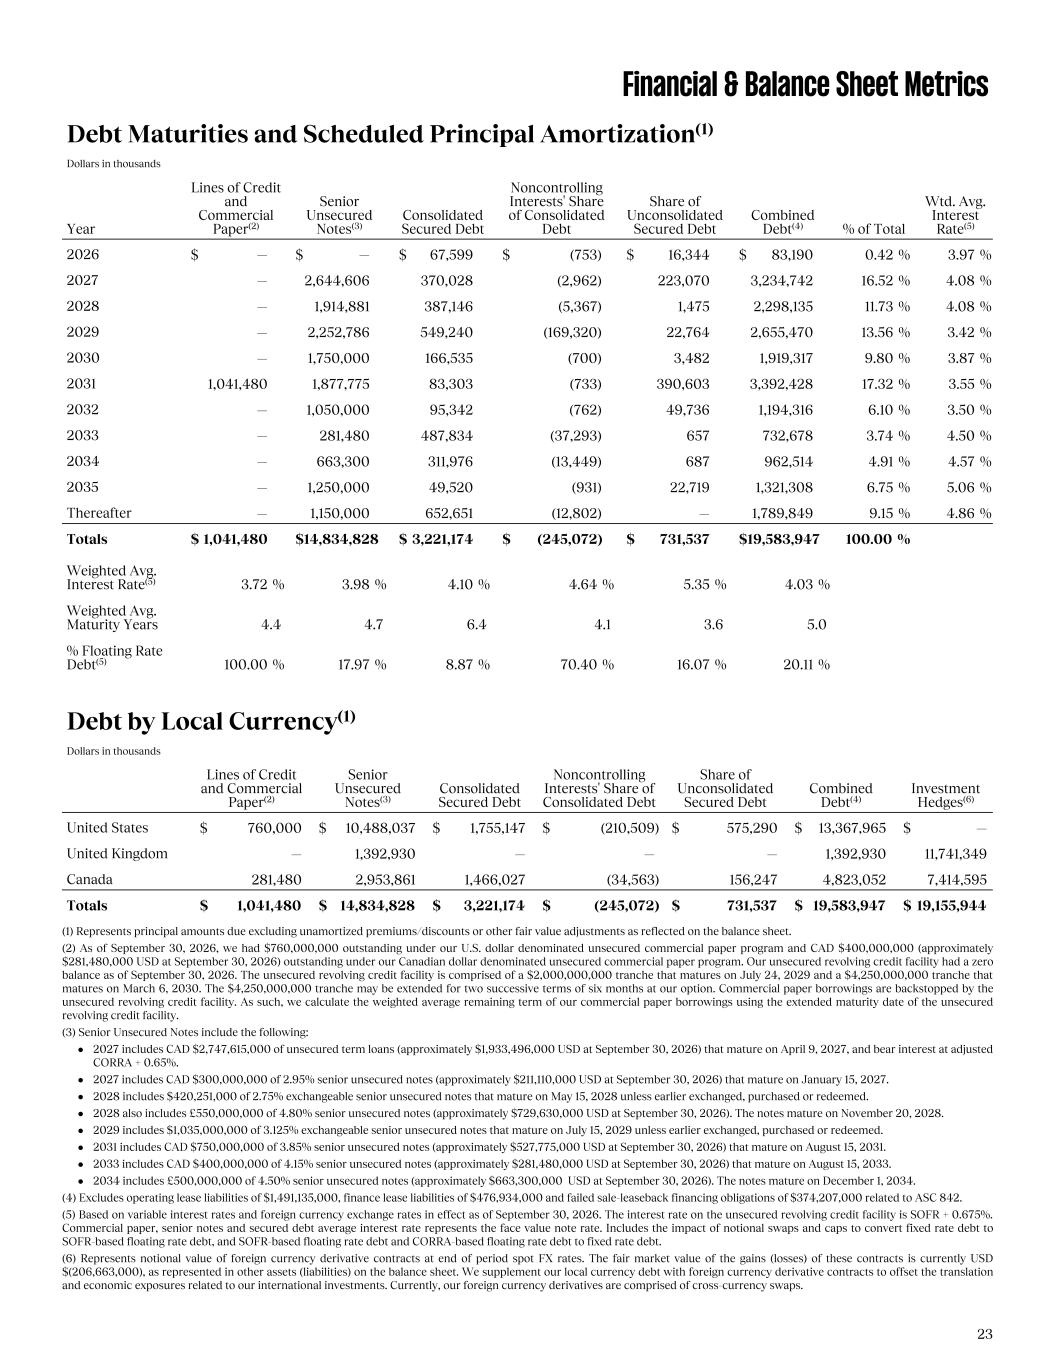
Financial & Balance Sheet Metrics Debt Maturities and Scheduled Principal Amortization(1) Dollars in thousands Year Lines of Credit and Commercial Paper(2) Senior Unsecured Notes(3) Consolidated Secured Debt Noncontrolling Interests' Share of Consolidated Debt Share of Unconsolidated Secured Debt Combined Debt(4) % of Total Wtd. Avg. Interest Rate(5) 2026 $ — $ — $ 67,599 $ (753) $ 16,344 $ 83,190 0.42 % 3.97 % 2027 — 2,644,606 370,028 (2,962) 223,070 3,234,742 16.52 % 4.08 % 2028 — 1,914,881 387,146 (5,367) 1,475 2,298,135 11.73 % 4.08 % 2029 — 2,252,786 549,240 (169,320) 22,764 2,655,470 13.56 % 3.42 % 2030 — 1,750,000 166,535 (700) 3,482 1,919,317 9.80 % 3.87 % 2031 1,041,480 1,877,775 83,303 (733) 390,603 3,392,428 17.32 % 3.55 % 2032 — 1,050,000 95,342 (762) 49,736 1,194,316 6.10 % 3.50 % 2033 — 281,480 487,834 (37,293) 657 732,678 3.74 % 4.50 % 2034 — 663,300 311,976 (13,449) 687 962,514 4.91 % 4.57 % 2035 — 1,250,000 49,520 (931) 22,719 1,321,308 6.75 % 5.06 % Thereafter — 1,150,000 652,651 (12,802) — 1,789,849 9.15 % 4.86 % Totals $ 1,041,480 $ 14,834,828 $ 3,221,174 $ (245,072) $ 731,537 $ 19,583,947 100.00 % Weighted Avg. Interest Rate(5) 3.72 % 3.98 % 4.10 % 4.64 % 5.35 % 4.03 % Weighted Avg. Maturity Years 4.4 4.7 6.4 4.1 3.6 5.0 % Floating Rate Debt(5) 100.00 % 17.97 % 8.87 % 70.40 % 16.07 % 20.11 % Debt by Local Currency(1) Dollars in thousands Lines of Credit and Commercial Paper(2) Senior Unsecured Notes(3) Consolidated Secured Debt Noncontrolling Interests' Share of Consolidated Debt Share of Unconsolidated Secured Debt Combined Debt(4) Investment Hedges(6) United States $ 760,000 $ 10,488,037 $ 1,755,147 $ (210,509) $ 575,290 $ 13,367,965 $ — United Kingdom — 1,392,930 — — — 1,392,930 11,741,349 Canada 281,480 2,953,861 1,466,027 (34,563) 156,247 4,823,052 7,414,595 Totals $ 1,041,480 $ 14,834,828 $ 3,221,174 $ (245,072) $ 731,537 $ 19,583,947 $ 19,155,944 (1) Represents principal amounts due excluding unamortized premiums/discounts or other fair value adjustments as reflected on the balance sheet. (2) As of September 30, 2026, we had $760,000,000 outstanding under our U.S. dollar denominated unsecured commercial paper program and CAD $400,000,000 (approximately $281,480,000 USD at September 30, 2026) outstanding under our Canadian dollar denominated unsecured commercial paper program. Our unsecured revolving credit facility had a zero balance as of September 30, 2026. The unsecured revolving credit facility is comprised of a $2,000,000,000 tranche that matures on July 24, 2029 and a $4,250,000,000 tranche that matures on March 6, 2030. The $4,250,000,000 tranche may be extended for two successive terms of six months at our option. Commercial paper borrowings are backstopped by the unsecured revolving credit facility. As such, we calculate the weighted average remaining term of our commercial paper borrowings using the extended maturity date of the unsecured revolving credit facility. (3) Senior Unsecured Notes include the following: • 2027 includes CAD $2,747,615,000 of unsecured term loans (approximately $1,933,496,000 USD at September 30, 2026) that mature on April 9, 2027, and bear interest at adjusted CORRA + 0.65%. • 2027 includes CAD $300,000,000 of 2.95% senior unsecured notes (approximately $211,110,000 USD at September 30, 2026) that mature on January 15, 2027. • 2028 includes $420,251,000 of 2.75% exchangeable senior unsecured notes that mature on May 15, 2028 unless earlier exchanged, purchased or redeemed. • 2028 also includes £550,000,000 of 4.80% senior unsecured notes (approximately $729,630,000 USD at September 30, 2026). The notes mature on November 20, 2028. • 2029 includes $1,035,000,000 of 3.125% exchangeable senior unsecured notes that mature on July 15, 2029 unless earlier exchanged, purchased or redeemed. • 2031 includes CAD $750,000,000 of 3.85% senior unsecured notes (approximately $527,775,000 USD at September 30, 2026) that mature on August 15, 2031. • 2033 includes CAD $400,000,000 of 4.15% senior unsecured notes (approximately $281,480,000 USD at September 30, 2026) that mature on August 15, 2033. • 2034 includes £500,000,000 of 4.50% senior unsecured notes (approximately $663,300,000 USD at September 30, 2026). The notes mature on December 1, 2034. (4) Excludes operating lease liabilities of $1,491,135,000, finance lease liabilities of $476,934,000 and failed sale-leaseback financing obligations of $374,207,000 related to ASC 842. (5) Based on variable interest rates and foreign currency exchange rates in effect as of September 30, 2026. The interest rate on the unsecured revolving credit facility is SOFR + 0.675%. Commercial paper, senior notes and secured debt average interest rate represents the face value note rate. Includes the impact of notional swaps and caps to convert fixed rate debt to SOFR-based floating rate debt, and SOFR-based floating rate debt and CORRA-based floating rate debt to fixed rate debt. (6) Represents notional value of foreign currency derivative contracts at end of period spot FX rates. The fair market value of the gains (losses) of these contracts is currently USD $(206,663,000), as represented in other assets (liabilities) on the balance sheet. We supplement our local currency debt with foreign currency derivative contracts to offset the translation and economic exposures related to our international investments. Currently, our foreign currency derivatives are comprised of cross-currency swaps. 23

Glossary & Supplemental Reporting Measures Vancouver, BC
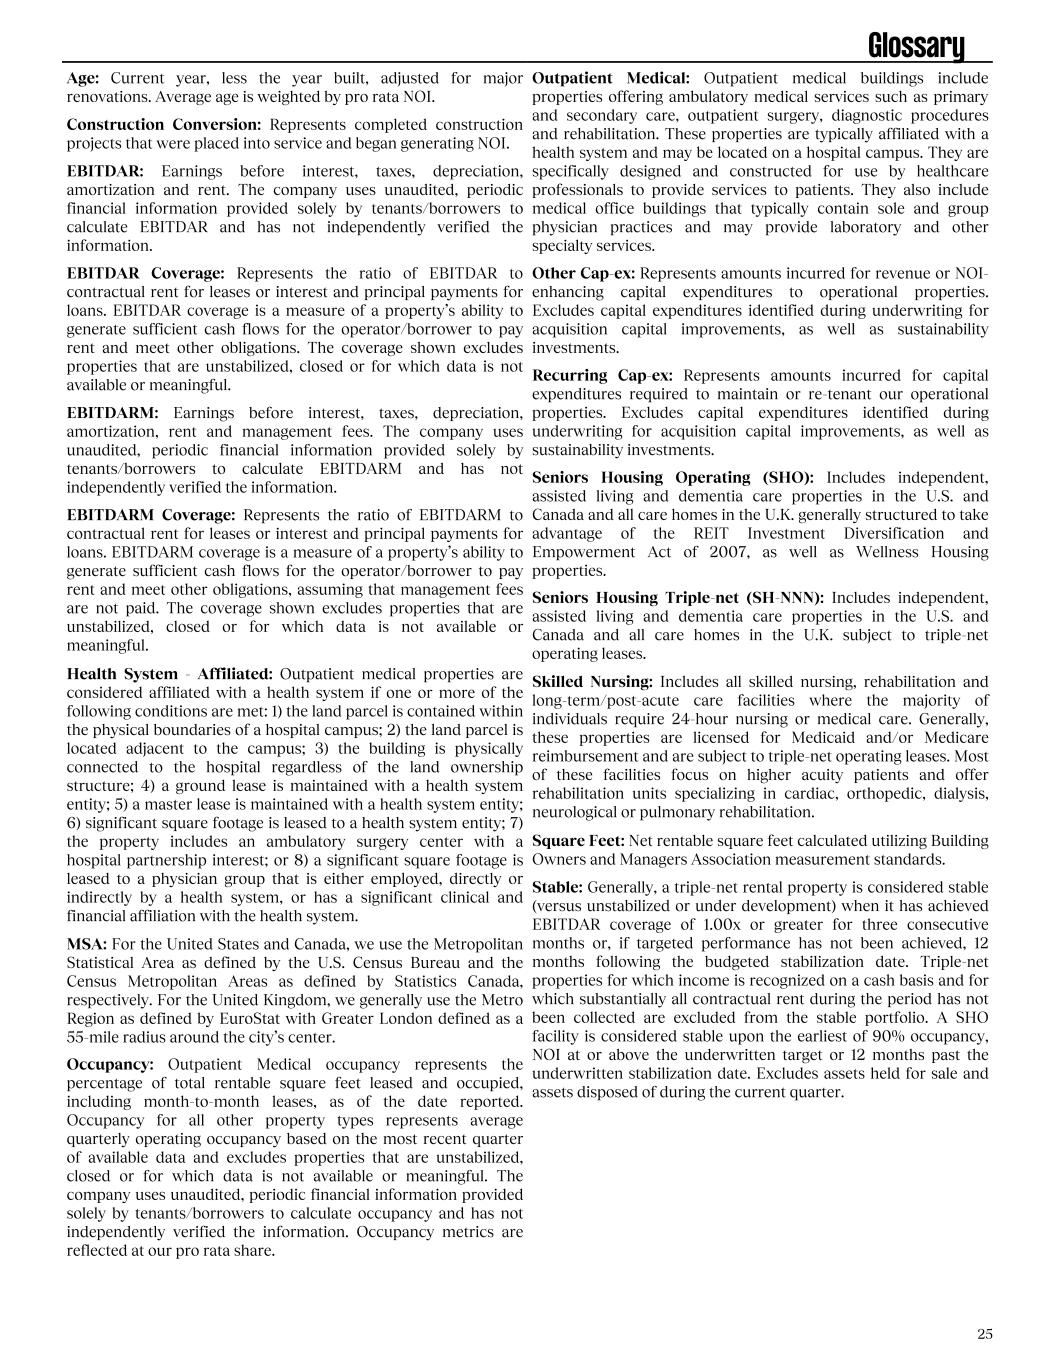
Age: Current year, less the year built, adjusted for major renovations. Average age is weighted by pro rata NOI. Construction Conversion: Represents completed construction projects that were placed into service and began generating NOI. EBITDAR: Earnings before interest, taxes, depreciation, amortization and rent. The company uses unaudited, periodic financial information provided solely by tenants/borrowers to calculate EBITDAR and has not independently verified the information. EBITDAR Coverage: Represents the ratio of EBITDAR to contractual rent for leases or interest and principal payments for loans. EBITDAR coverage is a measure of a property’s ability to generate sufficient cash flows for the operator/borrower to pay rent and meet other obligations. The coverage shown excludes properties that are unstabilized, closed or for which data is not available or meaningful. EBITDARM: Earnings before interest, taxes, depreciation, amortization, rent and management fees. The company uses unaudited, periodic financial information provided solely by tenants/borrowers to calculate EBITDARM and has not independently verified the information. EBITDARM Coverage: Represents the ratio of EBITDARM to contractual rent for leases or interest and principal payments for loans. EBITDARM coverage is a measure of a property’s ability to generate sufficient cash flows for the operator/borrower to pay rent and meet other obligations, assuming that management fees are not paid. The coverage shown excludes properties that are unstabilized, closed or for which data is not available or meaningful. Health System - Affiliated: Outpatient medical properties are considered affiliated with a health system if one or more of the following conditions are met: 1) the land parcel is contained within the physical boundaries of a hospital campus; 2) the land parcel is located adjacent to the campus; 3) the building is physically connected to the hospital regardless of the land ownership structure; 4) a ground lease is maintained with a health system entity; 5) a master lease is maintained with a health system entity; 6) significant square footage is leased to a health system entity; 7) the property includes an ambulatory surgery center with a hospital partnership interest; or 8) a significant square footage is leased to a physician group that is either employed, directly or indirectly by a health system, or has a significant clinical and financial affiliation with the health system. MSA: For the United States and Canada, we use the Metropolitan Statistical Area as defined by the U.S. Census Bureau and the Census Metropolitan Areas as defined by Statistics Canada, respectively. For the United Kingdom, we generally use the Metro Region as defined by EuroStat with Greater London defined as a 55-mile radius around the city’s center. Occupancy: Outpatient Medical occupancy represents the percentage of total rentable square feet leased and occupied, including month-to-month leases, as of the date reported. Occupancy for all other property types represents average quarterly operating occupancy based on the most recent quarter of available data and excludes properties that are unstabilized, closed or for which data is not available or meaningful. The company uses unaudited, periodic financial information provided solely by tenants/borrowers to calculate occupancy and has not independently verified the information. Occupancy metrics are reflected at our pro rata share. Outpatient Medical: Outpatient medical buildings include properties offering ambulatory medical services such as primary and secondary care, outpatient surgery, diagnostic procedures and rehabilitation. These properties are typically affiliated with a health system and may be located on a hospital campus. They are specifically designed and constructed for use by healthcare professionals to provide services to patients. They also include medical office buildings that typically contain sole and group physician practices and may provide laboratory and other specialty services. Other Cap-ex: Represents amounts incurred for revenue or NOI- enhancing capital expenditures to operational properties. Excludes capital expenditures identified during underwriting for acquisition capital improvements, as well as sustainability investments. Recurring Cap-ex: Represents amounts incurred for capital expenditures required to maintain or re-tenant our operational properties. Excludes capital expenditures identified during underwriting for acquisition capital improvements, as well as sustainability investments. Seniors Housing Operating (SHO): Includes independent, assisted living and dementia care properties in the U.S. and Canada and all care homes in the U.K. generally structured to take advantage of the REIT Investment Diversification and Empowerment Act of 2007, as well as Wellness Housing properties. Seniors Housing Triple-net (SH-NNN): Includes independent, assisted living and dementia care properties in the U.S. and Canada and all care homes in the U.K. subject to triple-net operating leases. Skilled Nursing: Includes all skilled nursing, rehabilitation and long-term/post-acute care facilities where the majority of individuals require 24-hour nursing or medical care. Generally, these properties are licensed for Medicaid and/or Medicare reimbursement and are subject to triple-net operating leases. Most of these facilities focus on higher acuity patients and offer rehabilitation units specializing in cardiac, orthopedic, dialysis, neurological or pulmonary rehabilitation. Square Feet: Net rentable square feet calculated utilizing Building Owners and Managers Association measurement standards. Stable: Generally, a triple-net rental property is considered stable (versus unstabilized or under development) when it has achieved EBITDAR coverage of 1.00x or greater for three consecutive months or, if targeted performance has not been achieved, 12 months following the budgeted stabilization date. Triple-net properties for which income is recognized on a cash basis and for which substantially all contractual rent during the period has not been collected are excluded from the stable portfolio. A SHO facility is considered stable upon the earliest of 90% occupancy, NOI at or above the underwritten target or 12 months past the underwritten stabilization date. Excludes assets held for sale and assets disposed of during the current quarter. Glossary 25
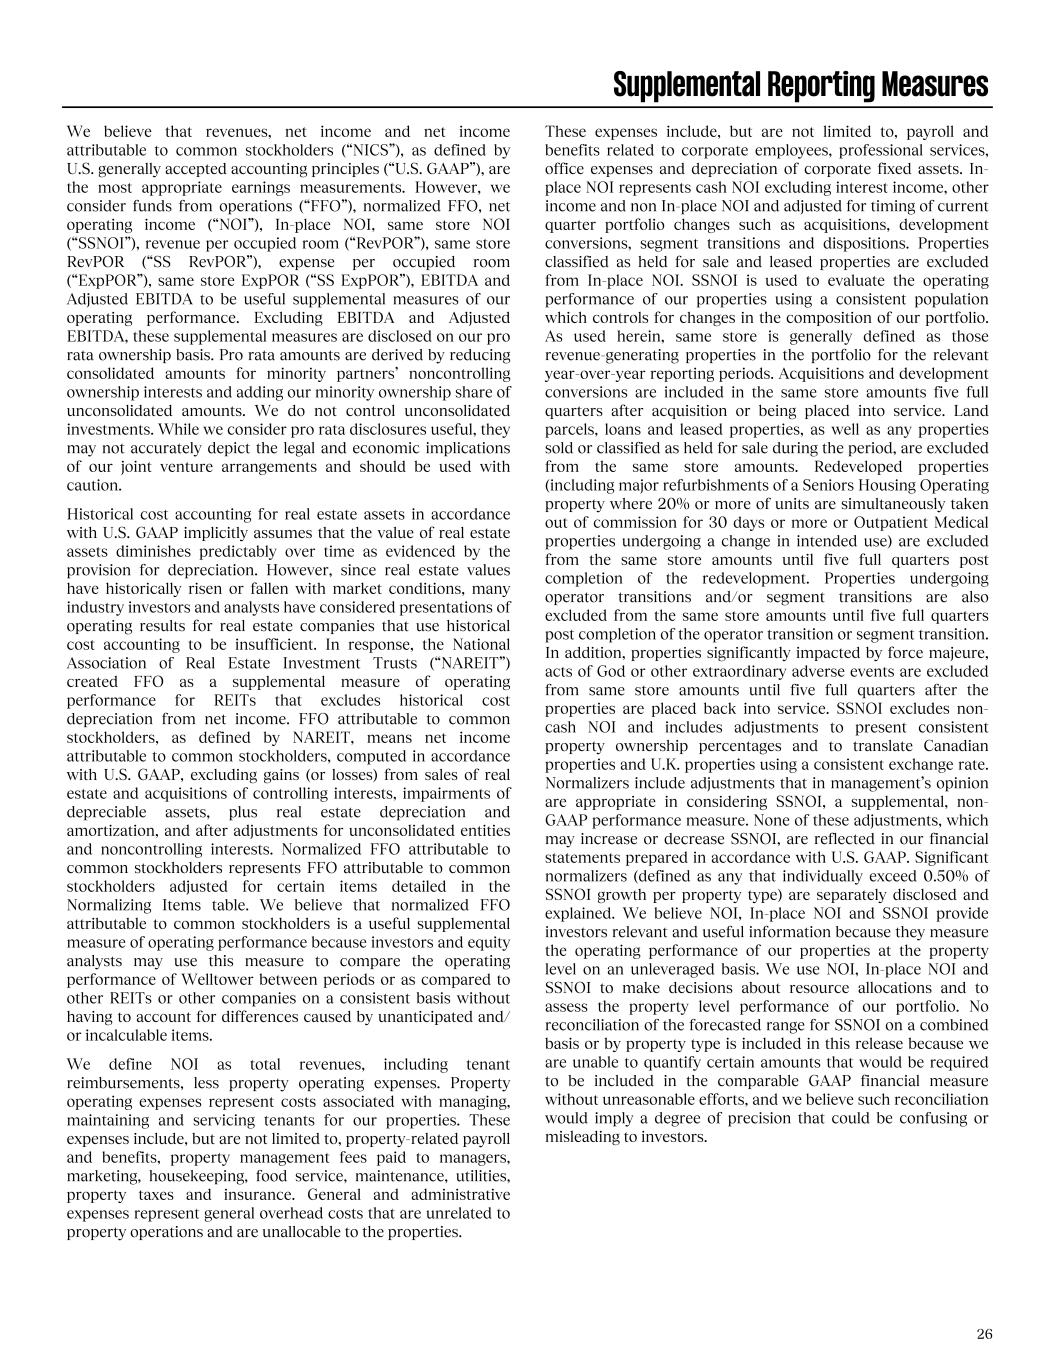
Supplemental Reporting Measures 26 We believe that revenues, net income and net income attributable to common stockholders (“NICS”), as defined by U.S. generally accepted accounting principles (“U.S. GAAP”), are the most appropriate earnings measurements. However, we consider funds from operations (“FFO”), normalized FFO, net operating income (“NOI”), In-place NOI, same store NOI (“SSNOI”), revenue per occupied room (“RevPOR”), same store RevPOR (“SS RevPOR”), expense per occupied room (“ExpPOR”), same store ExpPOR (“SS ExpPOR”), EBITDA and Adjusted EBITDA to be useful supplemental measures of our operating performance. Excluding EBITDA and Adjusted EBITDA, these supplemental measures are disclosed on our pro rata ownership basis. Pro rata amounts are derived by reducing consolidated amounts for minority partners’ noncontrolling ownership interests and adding our minority ownership share of unconsolidated amounts. We do not control unconsolidated investments. While we consider pro rata disclosures useful, they may not accurately depict the legal and economic implications of our joint venture arrangements and should be used with caution. Historical cost accounting for real estate assets in accordance with U.S. GAAP implicitly assumes that the value of real estate assets diminishes predictably over time as evidenced by the provision for depreciation. However, since real estate values have historically risen or fallen with market conditions, many industry investors and analysts have considered presentations of operating results for real estate companies that use historical cost accounting to be insufficient. In response, the National Association of Real Estate Investment Trusts (“NAREIT”) created FFO as a supplemental measure of operating performance for REITs that excludes historical cost depreciation from net income. FFO attributable to common stockholders, as defined by NAREIT, means net income attributable to common stockholders, computed in accordance with U.S. GAAP, excluding gains (or losses) from sales of real estate and acquisitions of controlling interests, impairments of depreciable assets, plus real estate depreciation and amortization, and after adjustments for unconsolidated entities and noncontrolling interests. Normalized FFO attributable to common stockholders represents FFO attributable to common stockholders adjusted for certain items detailed in the Normalizing Items table. We believe that normalized FFO attributable to common stockholders is a useful supplemental measure of operating performance because investors and equity analysts may use this measure to compare the operating performance of Welltower between periods or as compared to other REITs or other companies on a consistent basis without having to account for differences caused by unanticipated and/ or incalculable items. We define NOI as total revenues, including tenant reimbursements, less property operating expenses. Property operating expenses represent costs associated with managing, maintaining and servicing tenants for our properties. These expenses include, but are not limited to, property-related payroll and benefits, property management fees paid to managers, marketing, housekeeping, food service, maintenance, utilities, property taxes and insurance. General and administrative expenses represent general overhead costs that are unrelated to property operations and are unallocable to the properties. These expenses include, but are not limited to, payroll and benefits related to corporate employees, professional services, office expenses and depreciation of corporate fixed assets. In- place NOI represents cash NOI excluding interest income, other income and non In-place NOI and adjusted for timing of current quarter portfolio changes such as acquisitions, development conversions, segment transitions and dispositions. Properties classified as held for sale and leased properties are excluded from In-place NOI. SSNOI is used to evaluate the operating performance of our properties using a consistent population which controls for changes in the composition of our portfolio. As used herein, same store is generally defined as those revenue-generating properties in the portfolio for the relevant year-over-year reporting periods. Acquisitions and development conversions are included in the same store amounts five full quarters after acquisition or being placed into service. Land parcels, loans and leased properties, as well as any properties sold or classified as held for sale during the period, are excluded from the same store amounts. Redeveloped properties (including major refurbishments of a Seniors Housing Operating property where 20% or more of units are simultaneously taken out of commission for 30 days or more or Outpatient Medical properties undergoing a change in intended use) are excluded from the same store amounts until five full quarters post completion of the redevelopment. Properties undergoing operator transitions and/or segment transitions are also excluded from the same store amounts until five full quarters post completion of the operator transition or segment transition. In addition, properties significantly impacted by force majeure, acts of God or other extraordinary adverse events are excluded from same store amounts until five full quarters after the properties are placed back into service. SSNOI excludes non- cash NOI and includes adjustments to present consistent property ownership percentages and to translate Canadian properties and U.K. properties using a consistent exchange rate. Normalizers include adjustments that in management’s opinion are appropriate in considering SSNOI, a supplemental, non- GAAP performance measure. None of these adjustments, which may increase or decrease SSNOI, are reflected in our financial statements prepared in accordance with U.S. GAAP. Significant normalizers (defined as any that individually exceed 0.50% of SSNOI growth per property type) are separately disclosed and explained. We believe NOI, In-place NOI and SSNOI provide investors relevant and useful information because they measure the operating performance of our properties at the property level on an unleveraged basis. We use NOI, In-place NOI and SSNOI to make decisions about resource allocations and to assess the property level performance of our portfolio. No reconciliation of the forecasted range for SSNOI on a combined basis or by property type is included in this release because we are unable to quantify certain amounts that would be required to be included in the comparable GAAP financial measure without unreasonable efforts, and we believe such reconciliation would imply a degree of precision that could be confusing or misleading to investors.
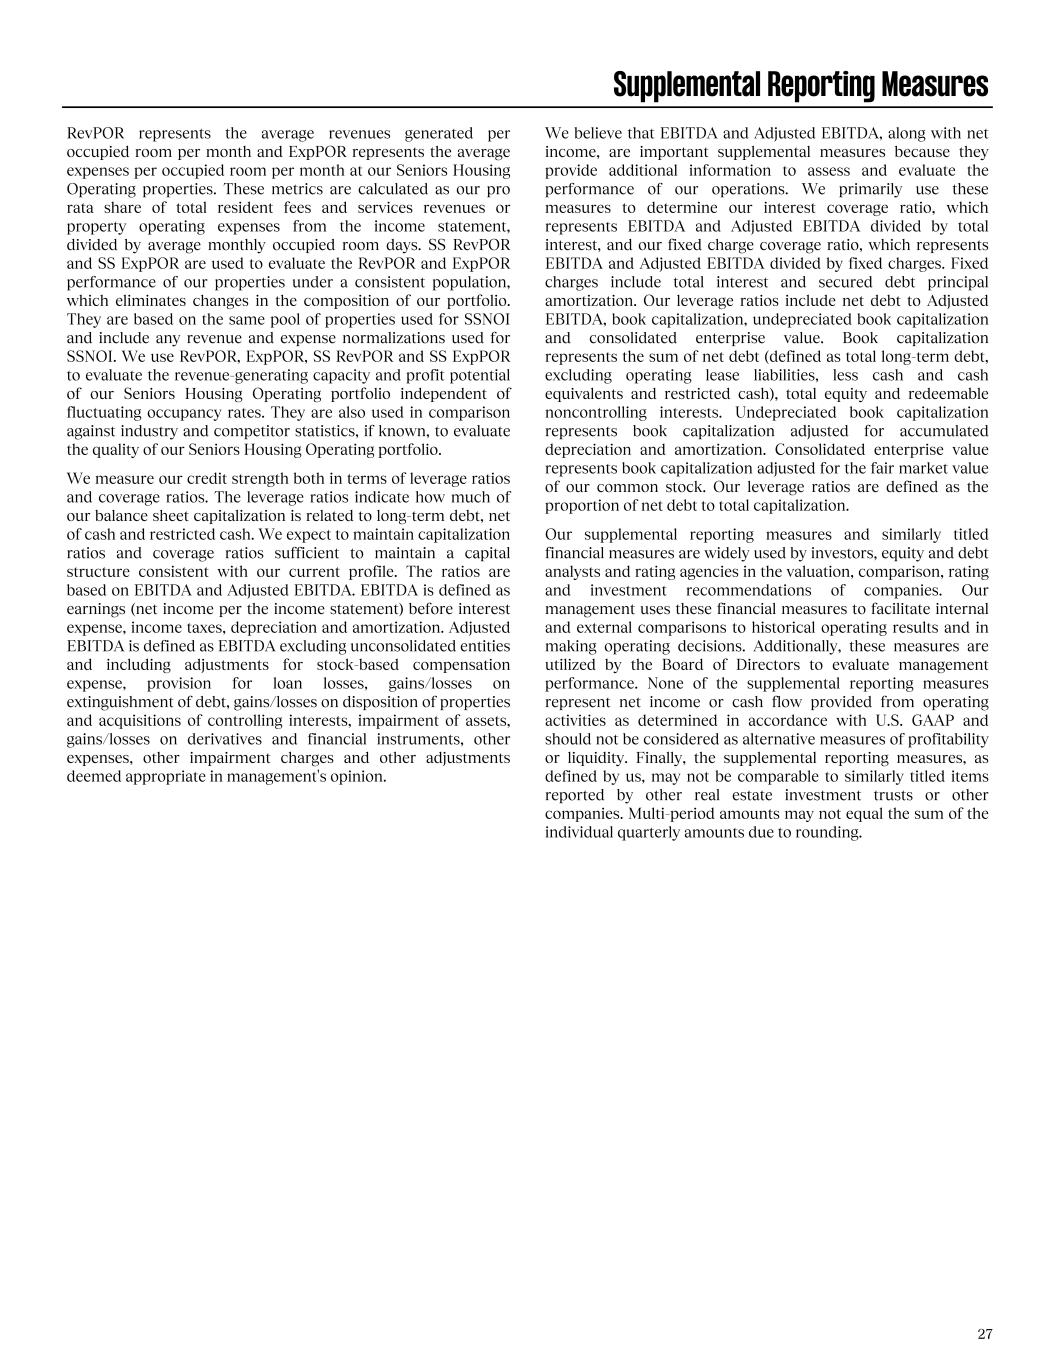
Supplemental Reporting Measures 27 RevPOR represents the average revenues generated per occupied room per month and ExpPOR represents the average expenses per occupied room per month at our Seniors Housing Operating properties. These metrics are calculated as our pro rata share of total resident fees and services revenues or property operating expenses from the income statement, divided by average monthly occupied room days. SS RevPOR and SS ExpPOR are used to evaluate the RevPOR and ExpPOR performance of our properties under a consistent population, which eliminates changes in the composition of our portfolio. They are based on the same pool of properties used for SSNOI and include any revenue and expense normalizations used for SSNOI. We use RevPOR, ExpPOR, SS RevPOR and SS ExpPOR to evaluate the revenue-generating capacity and profit potential of our Seniors Housing Operating portfolio independent of fluctuating occupancy rates. They are also used in comparison against industry and competitor statistics, if known, to evaluate the quality of our Seniors Housing Operating portfolio. We measure our credit strength both in terms of leverage ratios and coverage ratios. The leverage ratios indicate how much of our balance sheet capitalization is related to long-term debt, net of cash and restricted cash. We expect to maintain capitalization ratios and coverage ratios sufficient to maintain a capital structure consistent with our current profile. The ratios are based on EBITDA and Adjusted EBITDA. EBITDA is defined as earnings (net income per the income statement) before interest expense, income taxes, depreciation and amortization. Adjusted EBITDA is defined as EBITDA excluding unconsolidated entities and including adjustments for stock-based compensation expense, provision for loan losses, gains/losses on extinguishment of debt, gains/losses on disposition of properties and acquisitions of controlling interests, impairment of assets, gains/losses on derivatives and financial instruments, other expenses, other impairment charges and other adjustments deemed appropriate in management's opinion. We believe that EBITDA and Adjusted EBITDA, along with net income, are important supplemental measures because they provide additional information to assess and evaluate the performance of our operations. We primarily use these measures to determine our interest coverage ratio, which represents EBITDA and Adjusted EBITDA divided by total interest, and our fixed charge coverage ratio, which represents EBITDA and Adjusted EBITDA divided by fixed charges. Fixed charges include total interest and secured debt principal amortization. Our leverage ratios include net debt to Adjusted EBITDA, book capitalization, undepreciated book capitalization and consolidated enterprise value. Book capitalization represents the sum of net debt (defined as total long-term debt, excluding operating lease liabilities, less cash and cash equivalents and restricted cash), total equity and redeemable noncontrolling interests. Undepreciated book capitalization represents book capitalization adjusted for accumulated depreciation and amortization. Consolidated enterprise value represents book capitalization adjusted for the fair market value of our common stock. Our leverage ratios are defined as the proportion of net debt to total capitalization. Our supplemental reporting measures and similarly titled financial measures are widely used by investors, equity and debt analysts and rating agencies in the valuation, comparison, rating and investment recommendations of companies. Our management uses these financial measures to facilitate internal and external comparisons to historical operating results and in making operating decisions. Additionally, these measures are utilized by the Board of Directors to evaluate management performance. None of the supplemental reporting measures represent net income or cash flow provided from operating activities as determined in accordance with U.S. GAAP and should not be considered as alternative measures of profitability or liquidity. Finally, the supplemental reporting measures, as defined by us, may not be comparable to similarly titled items reported by other real estate investment trusts or other companies. Multi-period amounts may not equal the sum of the individual quarterly amounts due to rounding.
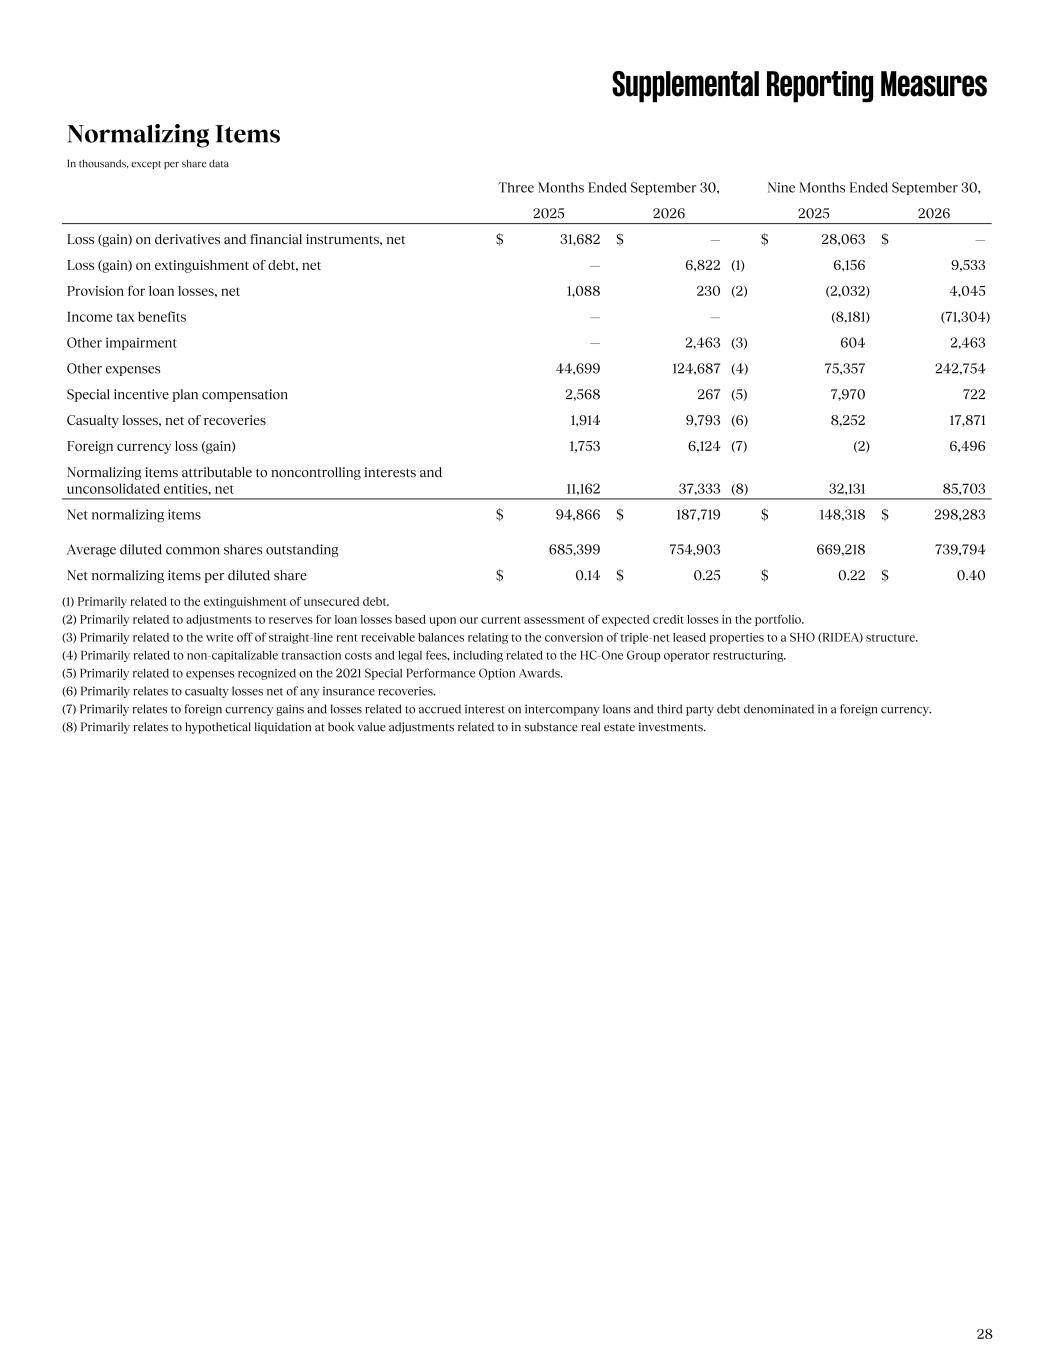
Supplemental Reporting Measures Normalizing Items In thousands, except per share data Three Months Ended September 30, Nine Months Ended September 30, 2025 2026 2025 2026 Loss (gain) on derivatives and financial instruments, net $ 31,682 $ — $ 28,063 $ — Loss (gain) on extinguishment of debt, net — 6,822 (1) 6,156 9,533 Provision for loan losses, net 1,088 230 (2) (2,032) 4,045 Income tax benefits — — (8,181) (71,304) Other impairment — 2,463 (3) 604 2,463 Other expenses 44,699 124,687 (4) 75,357 242,754 Special incentive plan compensation 2,568 267 (5) 7,970 722 Casualty losses, net of recoveries 1,914 9,793 (6) 8,252 17,871 Foreign currency loss (gain) 1,753 6,124 (7) (2) 6,496 Normalizing items attributable to noncontrolling interests and unconsolidated entities, net 11,162 37,333 (8) 32,131 85,703 Net normalizing items $ 94,866 $ 187,719 $ 148,318 $ 298,283 Average diluted common shares outstanding 685,399 754,903 669,218 739,794 Net normalizing items per diluted share $ 0.14 $ 0.25 $ 0.22 $ 0.40 (1) Primarily related to the extinguishment of unsecured debt. (2) Primarily related to adjustments to reserves for loan losses based upon our current assessment of expected credit losses in the portfolio. (3) Primarily related to the write off of straight-line rent receivable balances relating to the conversion of triple-net leased properties to a SHO (RIDEA) structure. (4) Primarily related to non-capitalizable transaction costs and legal fees, including related to the HC-One Group operator restructuring. (5) Primarily related to expenses recognized on the 2021 Special Performance Option Awards. (6) Primarily relates to casualty losses net of any insurance recoveries. (7) Primarily relates to foreign currency gains and losses related to accrued interest on intercompany loans and third party debt denominated in a foreign currency. (8) Primarily relates to hypothetical liquidation at book value adjustments related to in substance real estate investments. 28
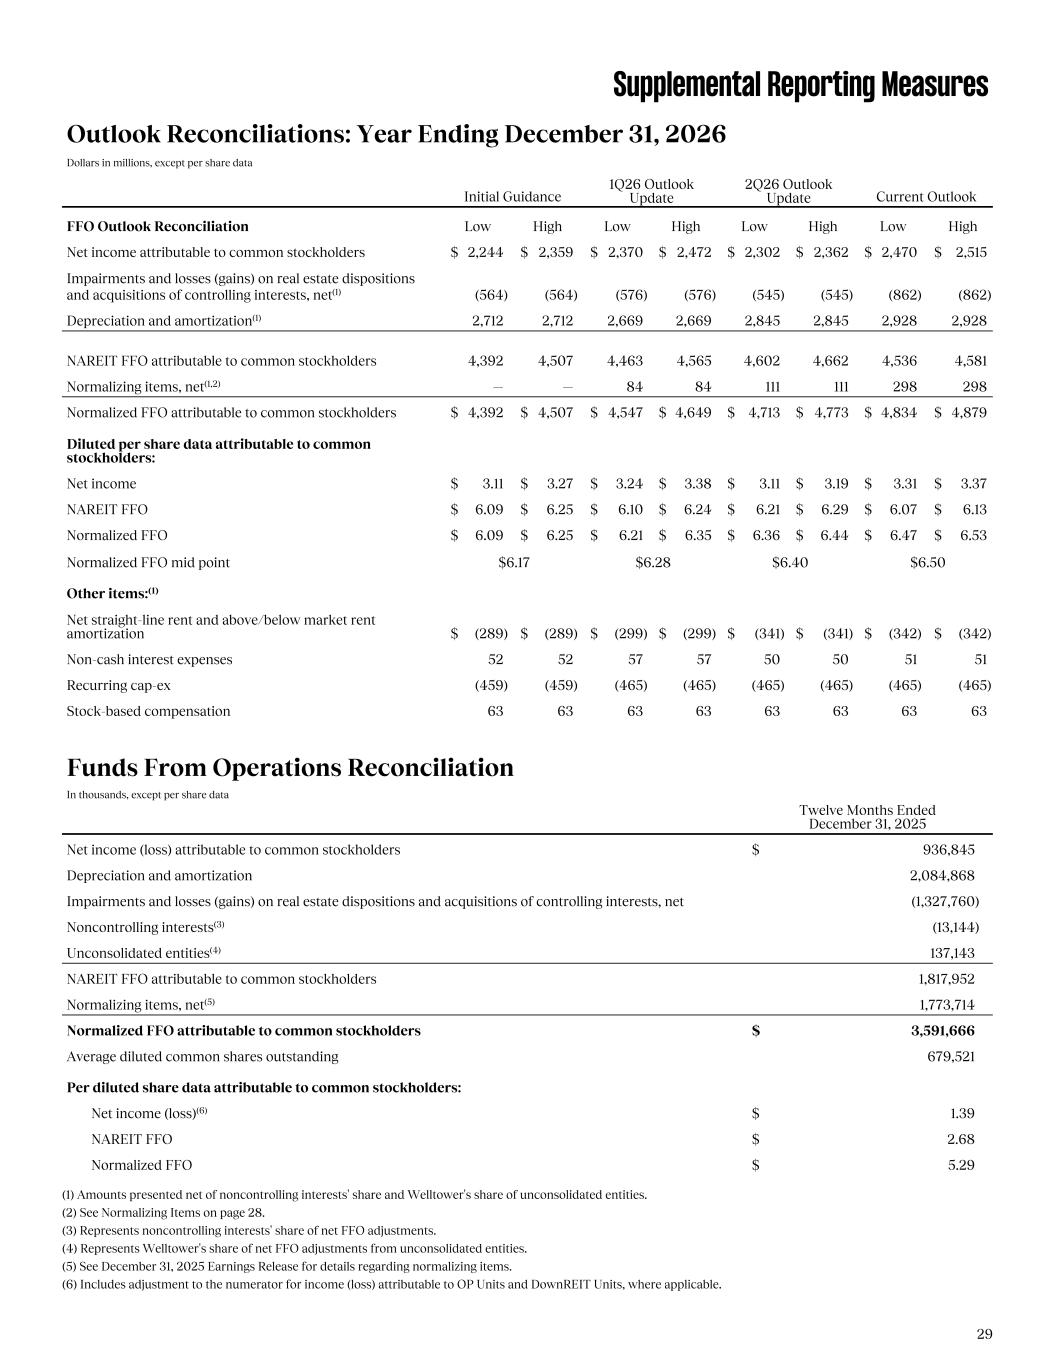
Supplemental Reporting Measures Outlook Reconciliations: Year Ending December 31, 2026 Dollars in millions, except per share data Initial Guidance 1Q26 Outlook Update 2Q26 Outlook Update Current Outlook FFO Outlook Reconciliation Low High Low High Low High Low High Net income attributable to common stockholders $ 2,244 $ 2,359 $ 2,370 $ 2,472 $ 2,302 $ 2,362 $ 2,470 $ 2,515 Impairments and losses (gains) on real estate dispositions and acquisitions of controlling interests, net(1) (564) (564) (576) (576) (545) (545) (862) (862) Depreciation and amortization(1) 2,712 2,712 2,669 2,669 2,845 2,845 2,928 2,928 NAREIT FFO attributable to common stockholders 4,392 4,507 4,463 4,565 4,602 4,662 4,536 4,581 Normalizing items, net(1,2) — — 84 84 111 111 298 298 Normalized FFO attributable to common stockholders $ 4,392 $ 4,507 $ 4,547 $ 4,649 $ 4,713 $ 4,773 $ 4,834 $ 4,879 Diluted per share data attributable to common stockholders: Net income $ 3.11 $ 3.27 $ 3.24 $ 3.38 $ 3.11 $ 3.19 $ 3.31 $ 3.37 NAREIT FFO $ 6.09 $ 6.25 $ 6.10 $ 6.24 $ 6.21 $ 6.29 $ 6.07 $ 6.13 Normalized FFO $ 6.09 $ 6.25 $ 6.21 $ 6.35 $ 6.36 $ 6.44 $ 6.47 $ 6.53 Normalized FFO mid point $6.17 $6.28 $6.40 $6.50 Other items:(1) Net straight-line rent and above/below market rent amortization $ (289) $ (289) $ (299) $ (299) $ (341) $ (341) $ (342) $ (342) Non-cash interest expenses 52 52 57 57 50 50 51 51 Recurring cap-ex (459) (459) (465) (465) (465) (465) (465) (465) Stock-based compensation 63 63 63 63 63 63 63 63 Funds From Operations Reconciliation In thousands, except per share data Twelve Months Ended December 31, 2025 Net income (loss) attributable to common stockholders $ 936,845 Depreciation and amortization 2,084,868 Impairments and losses (gains) on real estate dispositions and acquisitions of controlling interests, net (1,327,760) Noncontrolling interests(3) (13,144) Unconsolidated entities(4) 137,143 NAREIT FFO attributable to common stockholders 1,817,952 Normalizing items, net(5) 1,773,714 Normalized FFO attributable to common stockholders $ 3,591,666 Average diluted common shares outstanding 679,521 Per diluted share data attributable to common stockholders: Net income (loss)(6) $ 1.39 NAREIT FFO $ 2.68 Normalized FFO $ 5.29 (1) Amounts presented net of noncontrolling interests' share and Welltower's share of unconsolidated entities. (2) See Normalizing Items on page 28. (3) Represents noncontrolling interests' share of net FFO adjustments. (4) Represents Welltower's share of net FFO adjustments from unconsolidated entities. (5) See December 31, 2025 Earnings Release for details regarding normalizing items. (6) Includes adjustment to the numerator for income (loss) attributable to OP Units and DownREIT Units, where applicable. 29
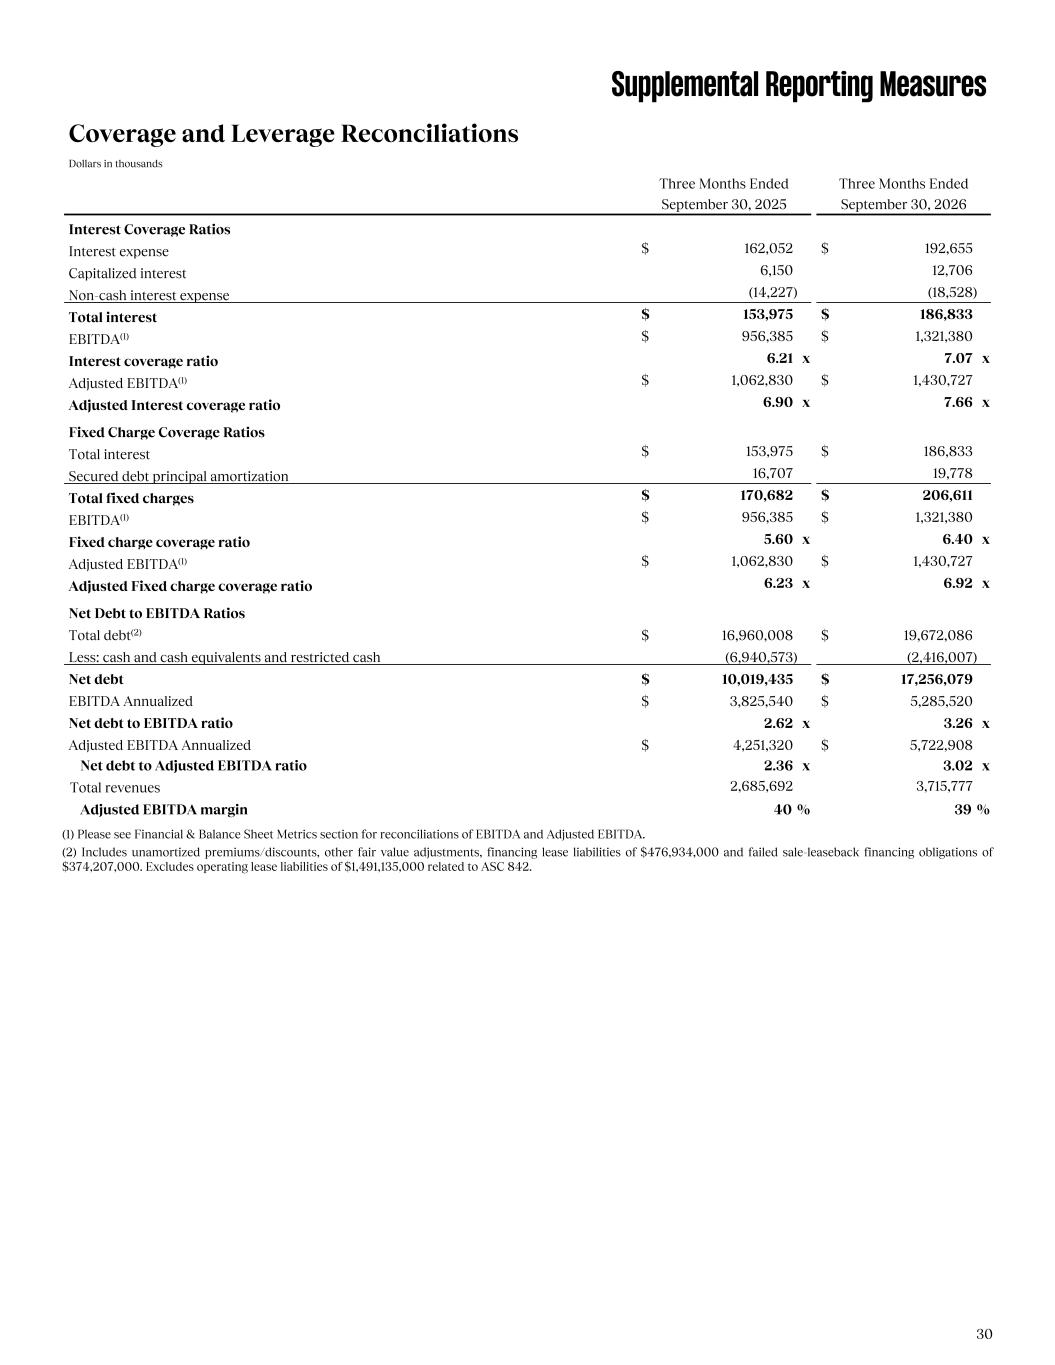
Supplemental Reporting Measures Coverage and Leverage Reconciliations Dollars in thousands Three Months Ended Three Months Ended September 30, 2025 September 30, 2026 Interest Coverage Ratios Interest expense $ 162,052 $ 192,655 Capitalized interest 6,150 12,706 Non-cash interest expense (14,227) (18,528) Total interest $ 153,975 $ 186,833 EBITDA(1) $ 956,385 $ 1,321,380 Interest coverage ratio 6.21 x 7.07 x Adjusted EBITDA(1) $ 1,062,830 $ 1,430,727 Adjusted Interest coverage ratio 6.90 x 7.66 x Fixed Charge Coverage Ratios Total interest $ 153,975 $ 186,833 Secured debt principal amortization 16,707 19,778 Total fixed charges $ 170,682 $ 206,611 EBITDA(1) $ 956,385 $ 1,321,380 Fixed charge coverage ratio 5.60 x 6.40 x Adjusted EBITDA(1) $ 1,062,830 $ 1,430,727 Adjusted Fixed charge coverage ratio 6.23 x 6.92 x Net Debt to EBITDA Ratios Total debt(2) $ 16,960,008 $ 19,672,086 Less: cash and cash equivalents and restricted cash (6,940,573) (2,416,007) Net debt $ 10,019,435 $ 17,256,079 EBITDA Annualized $ 3,825,540 $ 5,285,520 Net debt to EBITDA ratio 2.62 x 3.26 x Adjusted EBITDA Annualized $ 4,251,320 $ 5,722,908 Net debt to Adjusted EBITDA ratio 2.36 x 3.02 x Total revenues 2,685,692 3,715,777 Adjusted EBITDA margin 40 % 39 % (1) Please see Financial & Balance Sheet Metrics section for reconciliations of EBITDA and Adjusted EBITDA. (2) Includes unamortized premiums/discounts, other fair value adjustments, financing lease liabilities of $476,934,000 and failed sale-leaseback financing obligations of $374,207,000. Excludes operating lease liabilities of $1,491,135,000 related to ASC 842. 30
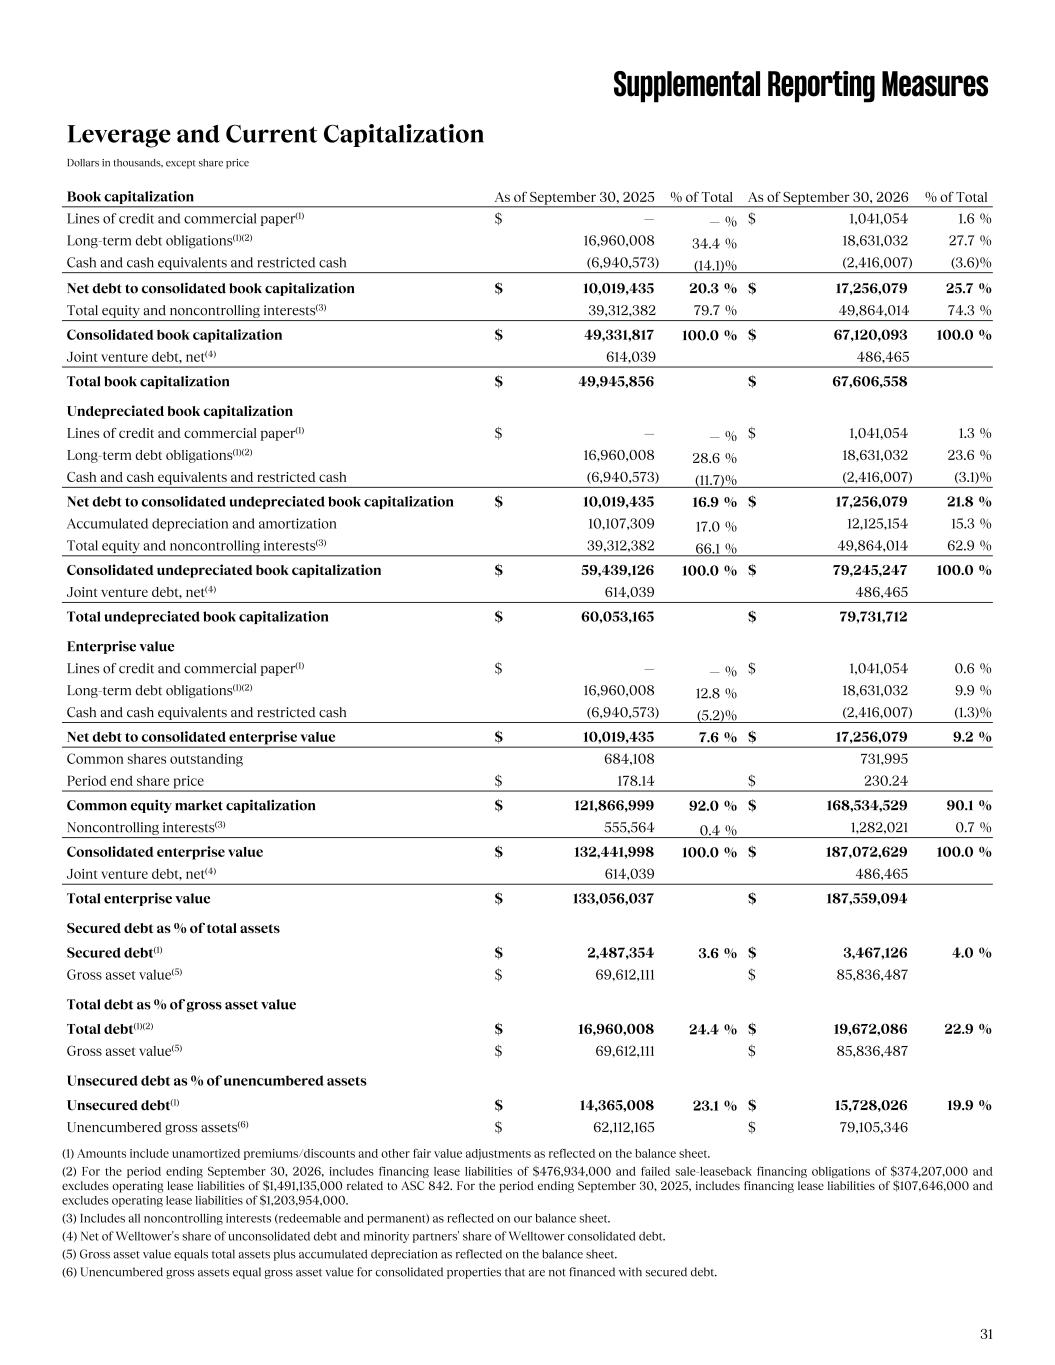
Supplemental Reporting Measures Leverage and Current Capitalization Dollars in thousands, except share price Book capitalization As of September 30, 2025 % of Total As of September 30, 2026 % of Total Lines of credit and commercial paper(1) $ — — % $ 1,041,054 1.6 % Long-term debt obligations(1)(2) 16,960,008 34.4 % 18,631,032 27.7 % Cash and cash equivalents and restricted cash (6,940,573) (14.1) % (2,416,007) (3.6) % Net debt to consolidated book capitalization $ 10,019,435 20.3 % $ 17,256,079 25.7 % Total equity and noncontrolling interests(3) 39,312,382 79.7 % 49,864,014 74.3 % Consolidated book capitalization $ 49,331,817 100.0 % $ 67,120,093 100.0 % Joint venture debt, net(4) 614,039 486,465 Total book capitalization $ 49,945,856 $ 67,606,558 Undepreciated book capitalization Lines of credit and commercial paper(1) $ — — % $ 1,041,054 1.3 % Long-term debt obligations(1)(2) 16,960,008 28.6 % 18,631,032 23.6 % Cash and cash equivalents and restricted cash (6,940,573) (11.7) % (2,416,007) (3.1) % Net debt to consolidated undepreciated book capitalization $ 10,019,435 16.9 % $ 17,256,079 21.8 % Accumulated depreciation and amortization 10,107,309 17.0 % 12,125,154 15.3 % Total equity and noncontrolling interests(3) 39,312,382 66.1 % 49,864,014 62.9 % Consolidated undepreciated book capitalization $ 59,439,126 100.0 % $ 79,245,247 100.0 % Joint venture debt, net(4) 614,039 486,465 Total undepreciated book capitalization $ 60,053,165 $ 79,731,712 Enterprise value Lines of credit and commercial paper(1) $ — — % $ 1,041,054 0.6 % Long-term debt obligations(1)(2) 16,960,008 12.8 % 18,631,032 9.9 % Cash and cash equivalents and restricted cash (6,940,573) (5.2) % (2,416,007) (1.3) % Net debt to consolidated enterprise value $ 10,019,435 7.6 % $ 17,256,079 9.2 % Common shares outstanding 684,108 731,995 Period end share price $ 178.14 $ 230.24 Common equity market capitalization $ 121,866,999 92.0 % $ 168,534,529 90.1 % Noncontrolling interests(3) 555,564 0.4 % 1,282,021 0.7 % Consolidated enterprise value $ 132,441,998 100.0 % $ 187,072,629 100.0 % Joint venture debt, net(4) 614,039 486,465 Total enterprise value $ 133,056,037 $ 187,559,094 Secured debt as % of total assets Secured debt(1) $ 2,487,354 3.6 % $ 3,467,126 4.0 % Gross asset value(5) $ 69,612,111 $ 85,836,487 Total debt as % of gross asset value Total debt(1)(2) $ 16,960,008 24.4 % $ 19,672,086 22.9 % Gross asset value(5) $ 69,612,111 $ 85,836,487 Unsecured debt as % of unencumbered assets Unsecured debt(1) $ 14,365,008 23.1 % $ 15,728,026 19.9 % Unencumbered gross assets(6) $ 62,112,165 $ 79,105,346 (1) Amounts include unamortized premiums/discounts and other fair value adjustments as reflected on the balance sheet. (2) For the period ending September 30, 2026, includes financing lease liabilities of $476,934,000 and failed sale-leaseback financing obligations of $374,207,000 and excludes operating lease liabilities of $1,491,135,000 related to ASC 842. For the period ending September 30, 2025, includes financing lease liabilities of $107,646,000 and excludes operating lease liabilities of $1,203,954,000. (3) Includes all noncontrolling interests (redeemable and permanent) as reflected on our balance sheet. (4) Net of Welltower's share of unconsolidated debt and minority partners' share of Welltower consolidated debt. (5) Gross asset value equals total assets plus accumulated depreciation as reflected on the balance sheet. (6) Unencumbered gross assets equal gross asset value for consolidated properties that are not financed with secured debt. 31
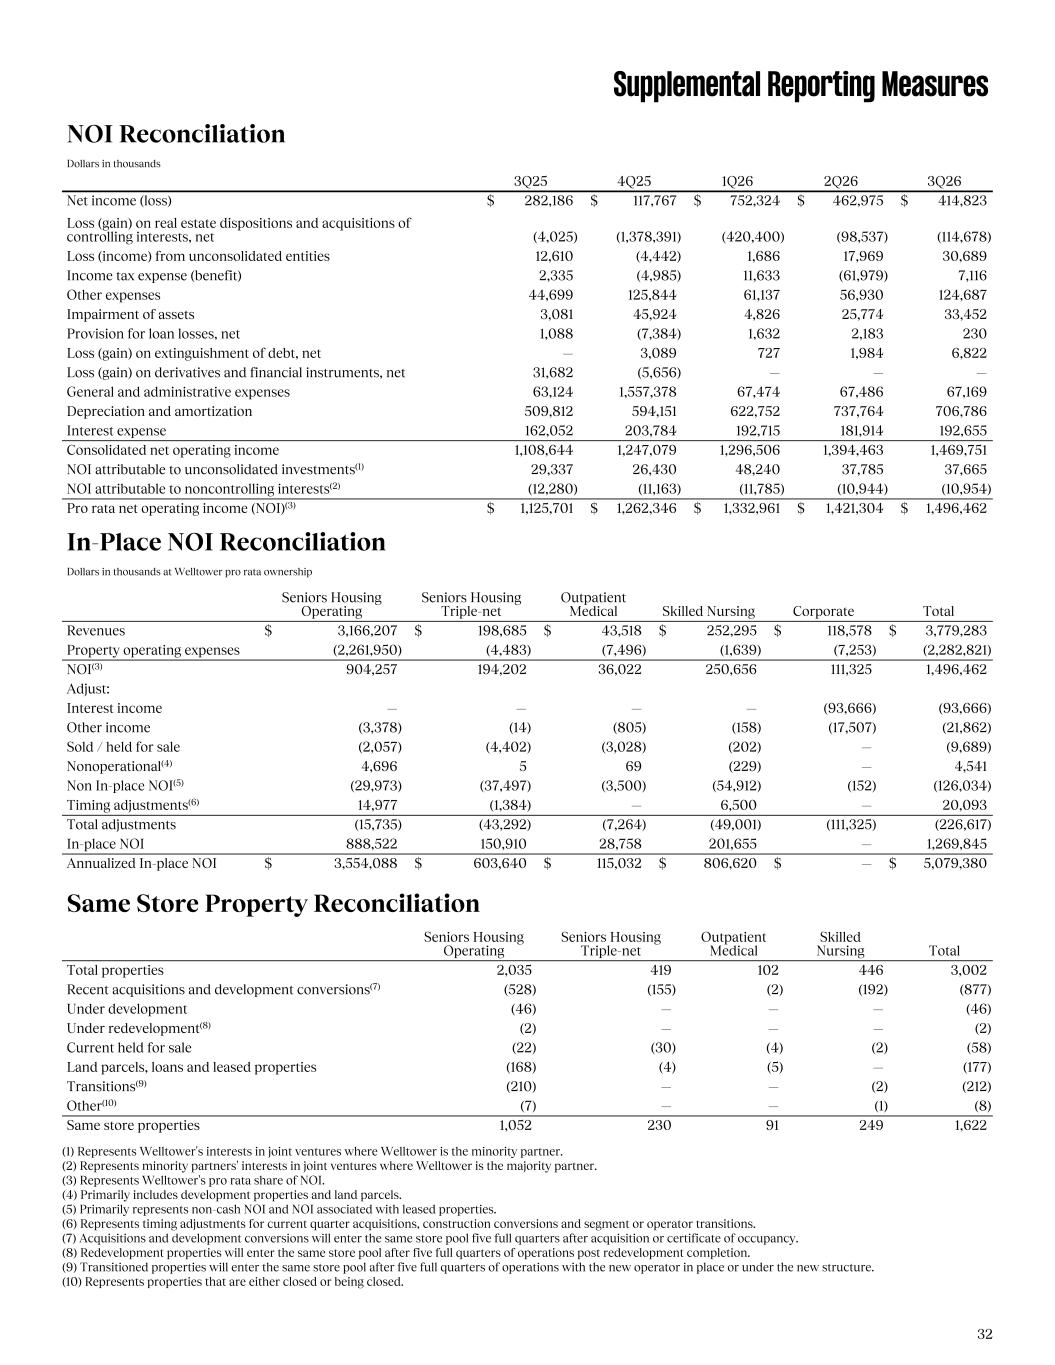
Supplemental Reporting Measures NOI Reconciliation Dollars in thousands 3Q25 4Q25 1Q26 2Q26 3Q26 Net income (loss) $ 282,186 $ 117,767 $ 752,324 $ 462,975 $ 414,823 Loss (gain) on real estate dispositions and acquisitions of controlling interests, net (4,025) (1,378,391) (420,400) (98,537) (114,678) Loss (income) from unconsolidated entities 12,610 (4,442) 1,686 17,969 30,689 Income tax expense (benefit) 2,335 (4,985) 11,633 (61,979) 7,116 Other expenses 44,699 125,844 61,137 56,930 124,687 Impairment of assets 3,081 45,924 4,826 25,774 33,452 Provision for loan losses, net 1,088 (7,384) 1,632 2,183 230 Loss (gain) on extinguishment of debt, net — 3,089 727 1,984 6,822 Loss (gain) on derivatives and financial instruments, net 31,682 (5,656) — — — General and administrative expenses 63,124 1,557,378 67,474 67,486 67,169 Depreciation and amortization 509,812 594,151 622,752 737,764 706,786 Interest expense 162,052 203,784 192,715 181,914 192,655 Consolidated net operating income 1,108,644 1,247,079 1,296,506 1,394,463 1,469,751 NOI attributable to unconsolidated investments(1) 29,337 26,430 48,240 37,785 37,665 NOI attributable to noncontrolling interests(2) (12,280) (11,163) (11,785) (10,944) (10,954) Pro rata net operating income (NOI)(3) $ 1,125,701 $ 1,262,346 $ 1,332,961 $ 1,421,304 $ 1,496,462 In-Place NOI Reconciliation Dollars in thousands at Welltower pro rata ownership Seniors Housing Operating Seniors Housing Triple-net Outpatient Medical Skilled Nursing Corporate Total Revenues $ 3,166,207 $ 198,685 $ 43,518 $ 252,295 $ 118,578 $ 3,779,283 Property operating expenses (2,261,950) (4,483) (7,496) (1,639) (7,253) (2,282,821) NOI(3) 904,257 194,202 36,022 250,656 111,325 1,496,462 Adjust: Interest income — — — — (93,666) (93,666) Other income (3,378) (14) (805) (158) (17,507) (21,862) Sold / held for sale (2,057) (4,402) (3,028) (202) — (9,689) Nonoperational(4) 4,696 5 69 (229) — 4,541 Non In-place NOI(5) (29,973) (37,497) (3,500) (54,912) (152) (126,034) Timing adjustments(6) 14,977 (1,384) — 6,500 — 20,093 Total adjustments (15,735) (43,292) (7,264) (49,001) (111,325) (226,617) In-place NOI 888,522 150,910 28,758 201,655 — 1,269,845 Annualized In-place NOI $ 3,554,088 $ 603,640 $ 115,032 $ 806,620 $ — $ 5,079,380 Same Store Property Reconciliation Seniors Housing Operating Seniors Housing Triple-net Outpatient Medical Skilled Nursing Total Total properties 2,035 419 102 446 3,002 Recent acquisitions and development conversions(7) (528) (155) (2) (192) (877) Under development (46) — — — (46) Under redevelopment(8) (2) — — — (2) Current held for sale (22) (30) (4) (2) (58) Land parcels, loans and leased properties (168) (4) (5) — (177) Transitions(9) (210) — — (2) (212) Other(10) (7) — — (1) (8) Same store properties 1,052 230 91 249 1,622 (1) Represents Welltower's interests in joint ventures where Welltower is the minority partner. (2) Represents minority partners' interests in joint ventures where Welltower is the majority partner. (3) Represents Welltower's pro rata share of NOI. (4) Primarily includes development properties and land parcels. (5) Primarily represents non-cash NOI and NOI associated with leased properties. (6) Represents timing adjustments for current quarter acquisitions, construction conversions and segment or operator transitions. (7) Acquisitions and development conversions will enter the same store pool five full quarters after acquisition or certificate of occupancy. (8) Redevelopment properties will enter the same store pool after five full quarters of operations post redevelopment completion. (9) Transitioned properties will enter the same store pool after five full quarters of operations with the new operator in place or under the new structure. (10) Represents properties that are either closed or being closed. 32
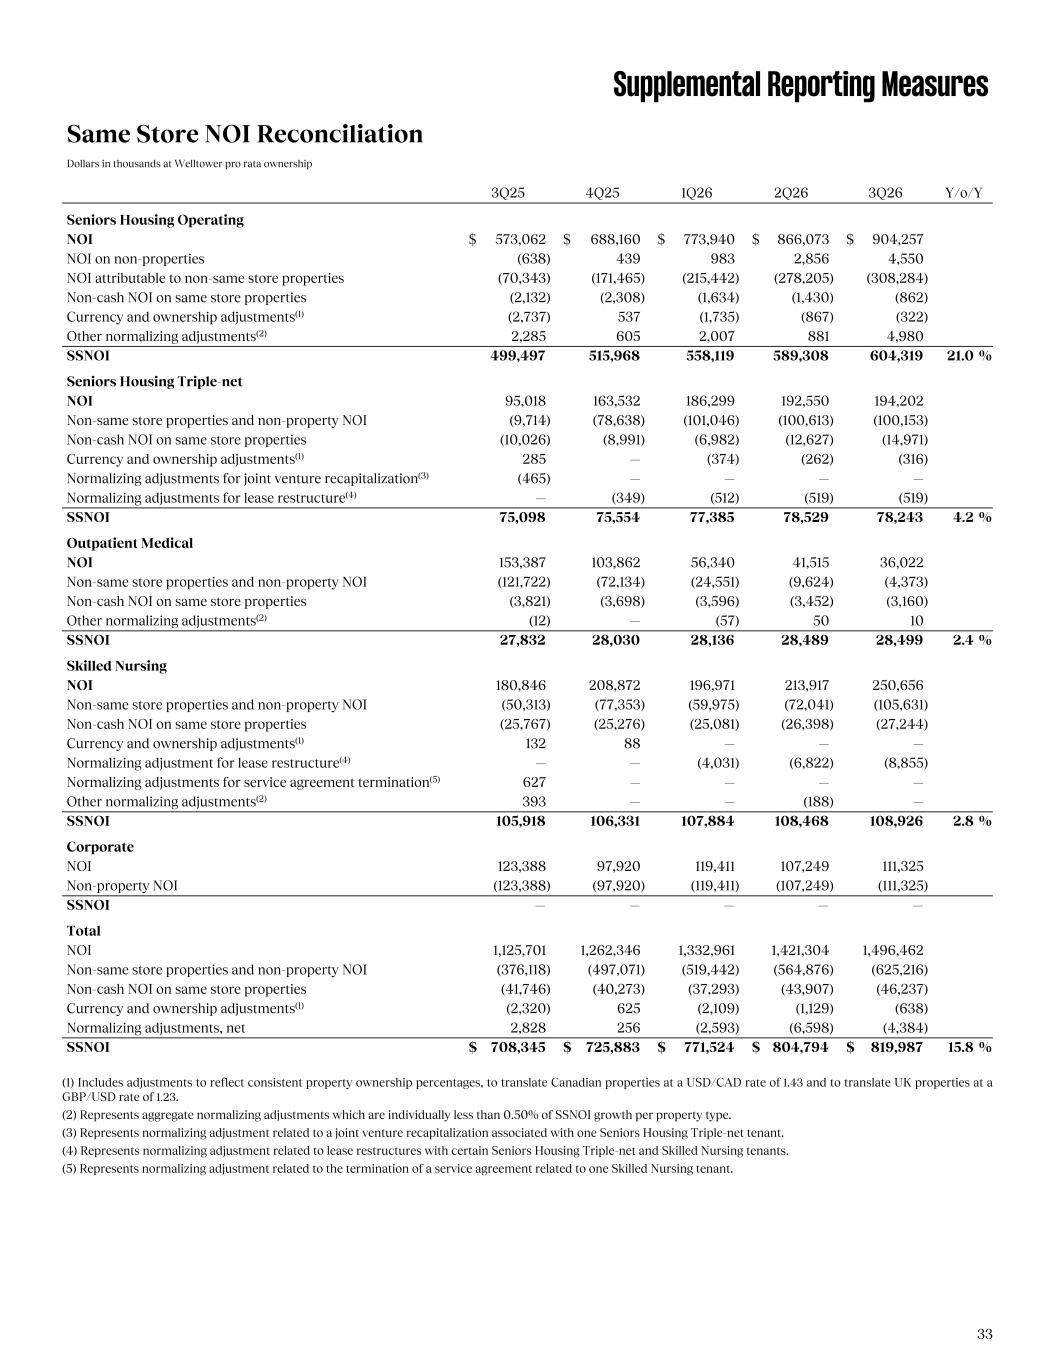
Supplemental Reporting Measures Same Store NOI Reconciliation Dollars in thousands at Welltower pro rata ownership 3Q25 4Q25 1Q26 2Q26 3Q26 Y/o/Y Seniors Housing Operating NOI $ 573,062 $ 688,160 $ 773,940 $ 866,073 $ 904,257 NOI on non-properties (638) 439 983 2,856 4,550 NOI attributable to non-same store properties (70,343) (171,465) (215,442) (278,205) (308,284) Non-cash NOI on same store properties (2,132) (2,308) (1,634) (1,430) (862) Currency and ownership adjustments(1) (2,737) 537 (1,735) (867) (322) Other normalizing adjustments(2) 2,285 605 2,007 881 4,980 SSNOI 499,497 515,968 558,119 589,308 604,319 21.0 % Seniors Housing Triple-net NOI 95,018 163,532 186,299 192,550 194,202 Non-same store properties and non-property NOI (9,714) (78,638) (101,046) (100,613) (100,153) Non-cash NOI on same store properties (10,026) (8,991) (6,982) (12,627) (14,971) Currency and ownership adjustments(1) 285 — (374) (262) (316) Normalizing adjustments for joint venture recapitalization(3) (465) — — — — Normalizing adjustments for lease restructure(4) — (349) (512) (519) (519) SSNOI 75,098 75,554 77,385 78,529 78,243 4.2 % Outpatient Medical NOI 153,387 103,862 56,340 41,515 36,022 Non-same store properties and non-property NOI (121,722) (72,134) (24,551) (9,624) (4,373) Non-cash NOI on same store properties (3,821) (3,698) (3,596) (3,452) (3,160) Other normalizing adjustments(2) (12) — (57) 50 10 SSNOI 27,832 28,030 28,136 28,489 28,499 2.4 % Skilled Nursing NOI 180,846 208,872 196,971 213,917 250,656 Non-same store properties and non-property NOI (50,313) (77,353) (59,975) (72,041) (105,631) Non-cash NOI on same store properties (25,767) (25,276) (25,081) (26,398) (27,244) Currency and ownership adjustments(1) 132 88 — — — Normalizing adjustment for lease restructure(4) — — (4,031) (6,822) (8,855) Normalizing adjustments for service agreement termination(5) 627 — — — — Other normalizing adjustments(2) 393 — — (188) — SSNOI 105,918 106,331 107,884 108,468 108,926 2.8 % Corporate NOI 123,388 97,920 119,411 107,249 111,325 Non-property NOI (123,388) (97,920) (119,411) (107,249) (111,325) SSNOI — — — — — Total NOI 1,125,701 1,262,346 1,332,961 1,421,304 1,496,462 Non-same store properties and non-property NOI (376,118) (497,071) (519,442) (564,876) (625,216) Non-cash NOI on same store properties (41,746) (40,273) (37,293) (43,907) (46,237) Currency and ownership adjustments(1) (2,320) 625 (2,109) (1,129) (638) Normalizing adjustments, net 2,828 256 (2,593) (6,598) (4,384) SSNOI $ 708,345 $ 725,883 $ 771,524 $ 804,794 $ 819,987 15.8 % (1) Includes adjustments to reflect consistent property ownership percentages, to translate Canadian properties at a USD/CAD rate of 1.43 and to translate UK properties at a GBP/USD rate of 1.23. (2) Represents aggregate normalizing adjustments which are individually less than 0.50% of SSNOI growth per property type. (3) Represents normalizing adjustment related to a joint venture recapitalization associated with one Seniors Housing Triple-net tenant. (4) Represents normalizing adjustment related to lease restructures with certain Seniors Housing Triple-net and Skilled Nursing tenants. (5) Represents normalizing adjustment related to the termination of a service agreement related to one Skilled Nursing tenant. 33
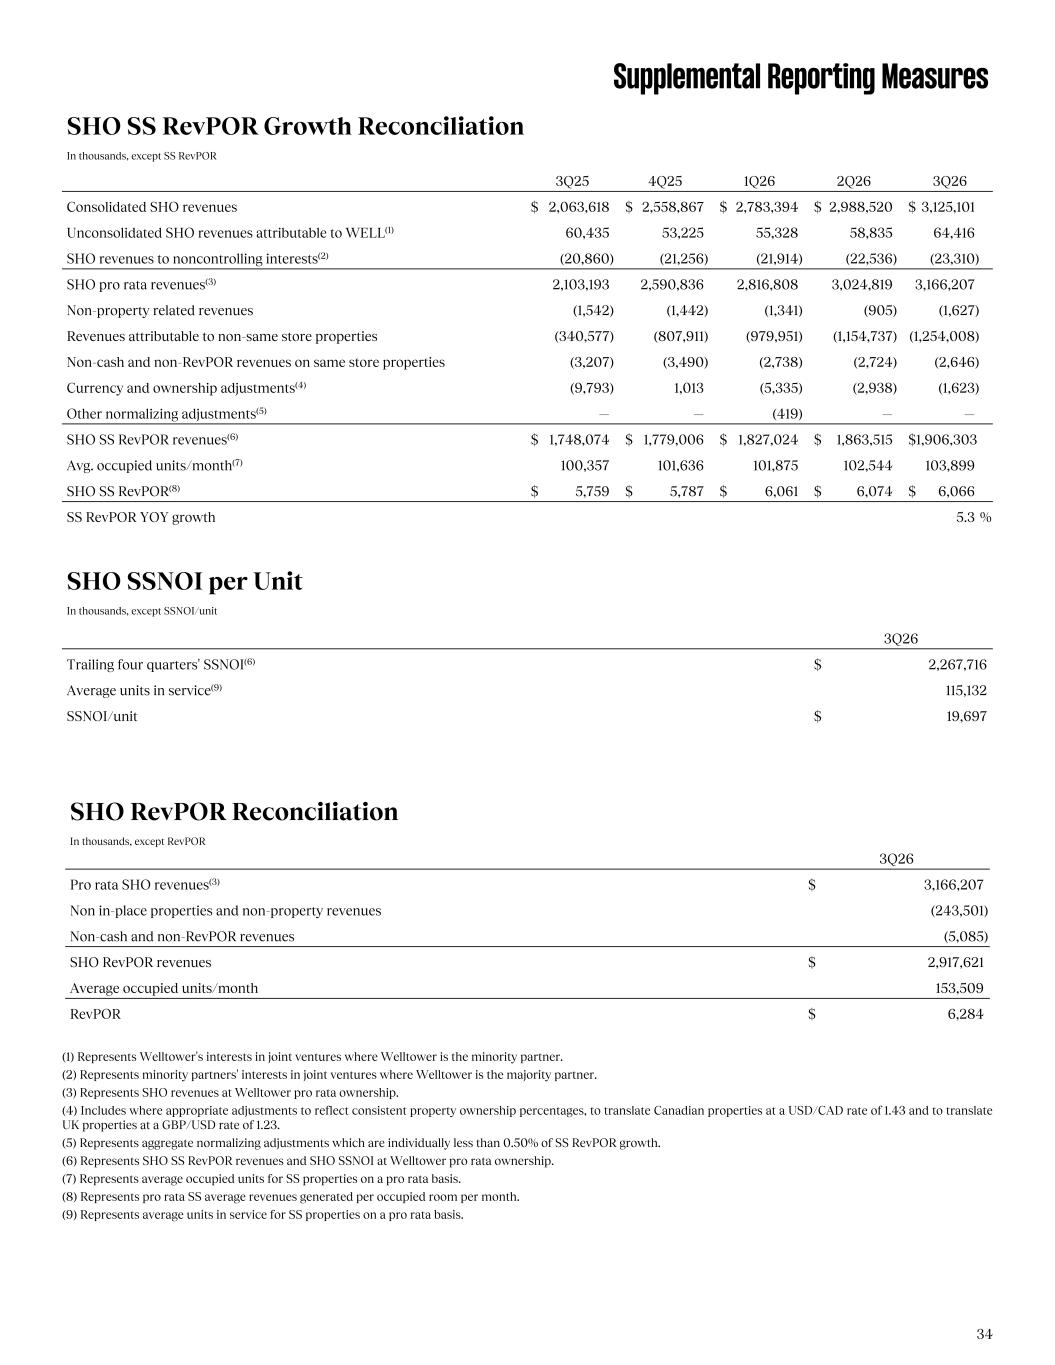
Supplemental Reporting Measures SHO SS RevPOR Growth Reconciliation In thousands, except SS RevPOR 3Q25 4Q25 1Q26 2Q26 3Q26 Consolidated SHO revenues $ 2,063,618 $ 2,558,867 $ 2,783,394 $ 2,988,520 $ 3,125,101 Unconsolidated SHO revenues attributable to WELL(1) 60,435 53,225 55,328 58,835 64,416 SHO revenues to noncontrolling interests(2) (20,860) (21,256) (21,914) (22,536) (23,310) SHO pro rata revenues(3) 2,103,193 2,590,836 2,816,808 3,024,819 3,166,207 Non-property related revenues (1,542) (1,442) (1,341) (905) (1,627) Revenues attributable to non-same store properties (340,577) (807,911) (979,951) (1,154,737) (1,254,008) Non-cash and non-RevPOR revenues on same store properties (3,207) (3,490) (2,738) (2,724) (2,646) Currency and ownership adjustments(4) (9,793) 1,013 (5,335) (2,938) (1,623) Other normalizing adjustments(5) — — (419) — — SHO SS RevPOR revenues(6) $ 1,748,074 $ 1,779,006 $ 1,827,024 $ 1,863,515 $ 1,906,303 Avg. occupied units/month(7) 100,357 101,636 101,875 102,544 103,899 SHO SS RevPOR(8) $ 5,759 $ 5,787 $ 6,061 $ 6,074 $ 6,066 SS RevPOR YOY growth 5.3 % SHO SSNOI per Unit In thousands, except SSNOI/unit 3Q26 Trailing four quarters' SSNOI(6) $ 2,267,716 Average units in service(9) 115,132 SSNOI/unit $ 19,697 SHO RevPOR Reconciliation In thousands, except RevPOR 3Q26 Pro rata SHO revenues(3) $ 3,166,207 Non in-place properties and non-property revenues (243,501) Non-cash and non-RevPOR revenues (5,085) SHO RevPOR revenues $ 2,917,621 Average occupied units/month 153,509 RevPOR $ 6,284 (1) Represents Welltower's interests in joint ventures where Welltower is the minority partner. (2) Represents minority partners' interests in joint ventures where Welltower is the majority partner. (3) Represents SHO revenues at Welltower pro rata ownership. (4) Includes where appropriate adjustments to reflect consistent property ownership percentages, to translate Canadian properties at a USD/CAD rate of 1.43 and to translate UK properties at a GBP/USD rate of 1.23. (5) Represents aggregate normalizing adjustments which are individually less than 0.50% of SS RevPOR growth. (6) Represents SHO SS RevPOR revenues and SHO SSNOI at Welltower pro rata ownership. (7) Represents average occupied units for SS properties on a pro rata basis. (8) Represents pro rata SS average revenues generated per occupied room per month. (9) Represents average units in service for SS properties on a pro rata basis. 34
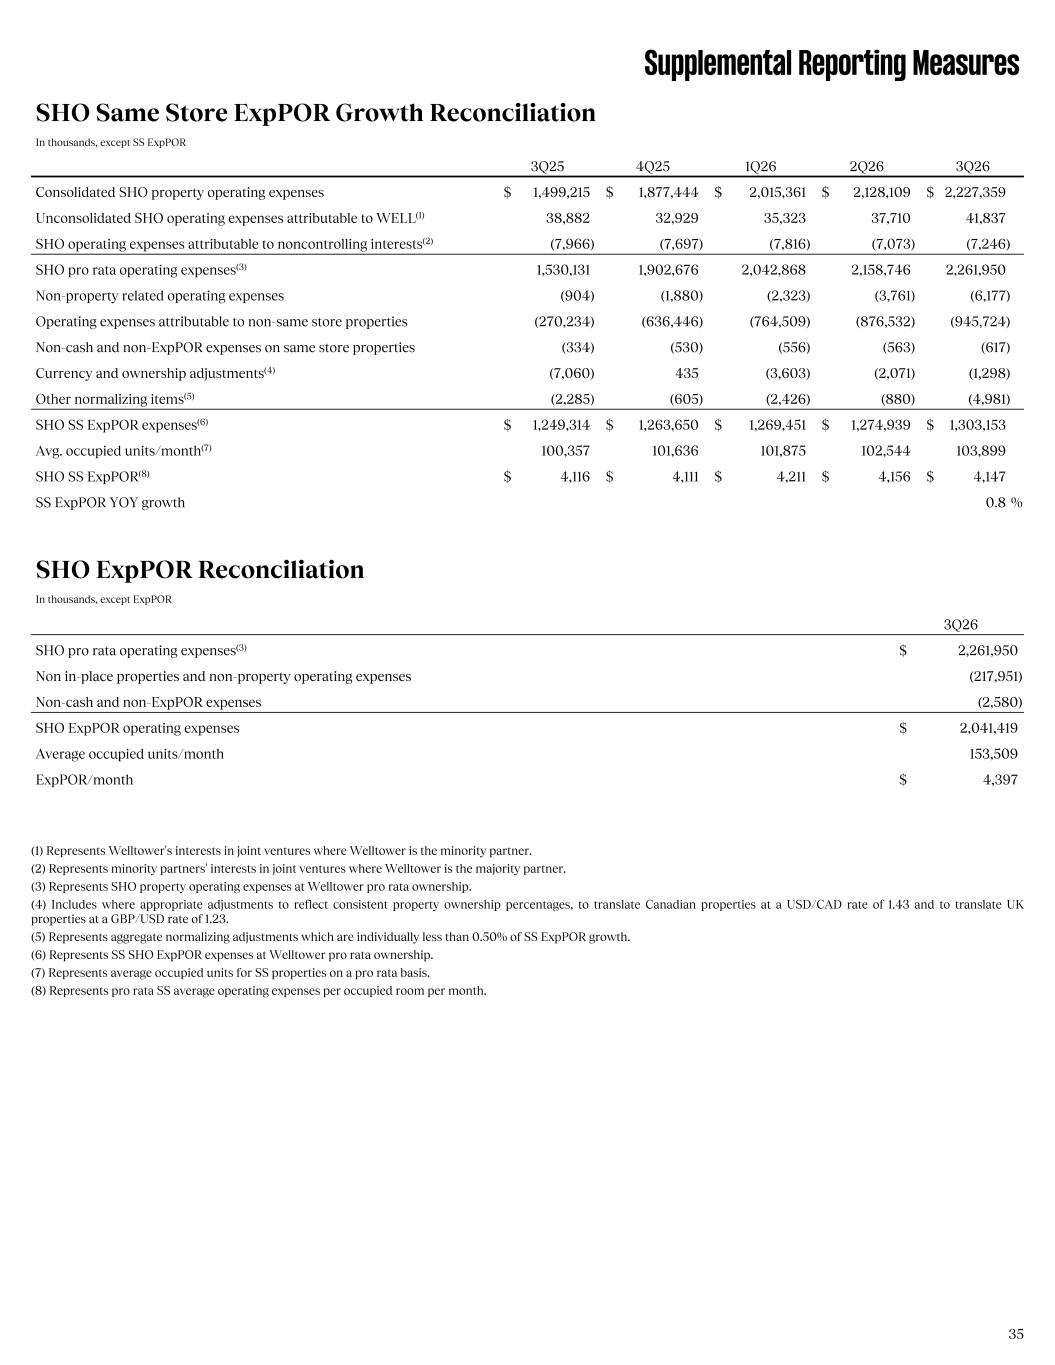
Supplemental Reporting Measures SHO Same Store ExpPOR Growth Reconciliation In thousands, except SS ExpPOR 3Q25 4Q25 1Q26 2Q26 3Q26 Consolidated SHO property operating expenses $ 1,499,215 $ 1,877,444 $ 2,015,361 $ 2,128,109 $ 2,227,359 Unconsolidated SHO operating expenses attributable to WELL(1) 38,882 32,929 35,323 37,710 41,837 SHO operating expenses attributable to noncontrolling interests(2) (7,966) (7,697) (7,816) (7,073) (7,246) SHO pro rata operating expenses(3) 1,530,131 1,902,676 2,042,868 2,158,746 — 2,261,950 Non-property related operating expenses (904) (1,880) (2,323) (3,761) (6,177) Operating expenses attributable to non-same store properties (270,234) (636,446) (764,509) (876,532) (945,724) Non-cash and non-ExpPOR expenses on same store properties (334) (530) (556) (563) (617) Currency and ownership adjustments(4) (7,060) 435 (3,603) (2,071) (1,298) Other normalizing items(5) (2,285) (605) (2,426) (880) (4,981) SHO SS ExpPOR expenses(6) $ 1,249,314 $ 1,263,650 $ 1,269,451 $ 1,274,939 $ 1,303,153 Avg. occupied units/month(7) 100,357 101,636 101,875 102,544 103,899 SHO SS ExpPOR(8) $ 4,116 $ 4,111 $ 4,211 $ 4,156 $ 4,147 SS ExpPOR YOY growth 0.8 % SHO ExpPOR Reconciliation In thousands, except ExpPOR 3Q26 SHO pro rata operating expenses(3) $ 2,261,950 Non in-place properties and non-property operating expenses (217,951) Non-cash and non-ExpPOR expenses (2,580) SHO ExpPOR operating expenses $ 2,041,419 Average occupied units/month 153,509 ExpPOR/month $ 4,397 (1) Represents Welltower's interests in joint ventures where Welltower is the minority partner. (2) Represents minority partners' interests in joint ventures where Welltower is the majority partner. (3) Represents SHO property operating expenses at Welltower pro rata ownership. (4) Includes where appropriate adjustments to reflect consistent property ownership percentages, to translate Canadian properties at a USD/CAD rate of 1.43 and to translate UK properties at a GBP/USD rate of 1.23. (5) Represents aggregate normalizing adjustments which are individually less than 0.50% of SS ExpPOR growth. (6) Represents SS SHO ExpPOR expenses at Welltower pro rata ownership. (7) Represents average occupied units for SS properties on a pro rata basis. (8) Represents pro rata SS average operating expenses per occupied room per month. 35

Los Angeles, CA Forward-Looking Statements & Risk Factors
Forward-Looking Statements & Risk Factors This document contains "forward-looking statements" as defined in the Private Securities Litigation Reform Act of 1995. When Welltower uses words such as "may," "will," "intend," "should," "believe," "expect," "anticipate," "project," "pro forma," "estimate" or similar expressions that do not relate solely to historical matters, Welltower is making forward-looking statements. These statements include, among others, management’s expectations regarding the favorable impact of the acquisitions made and additional acquisition pipeline and our statements under the section “Outlook for 2026.” Forward- looking statements are not guarantees of future performance and involve risks and uncertainties that may cause Welltower's actual results to differ materially from Welltower's expectations discussed in the forward-looking statements. This may be a result of various factors, including, but not limited to: the impact of macroeconomic and geopolitical developments, including economic downturns, elevated inflation and interest rates, political or social conflict, unrest or violence or similar events; the status of the economy; the status of capital markets, including availability and cost of capital; issues facing the healthcare industry, including compliance with, and changes to, regulations and payment policies, responding to government investigations and punitive settlements, public perception of the healthcare industry and operators’/tenants’ difficulty in cost effectively obtaining and maintaining adequate liability and other insurance; changes in financing terms; competition within the healthcare and seniors housing industries; negative developments in the operating results or financial condition of operators/tenants, including, but not limited to, their ability to pay rent and repay loans; Welltower's ability to transition or sell properties with profitable results; the failure to make new investments or acquisitions as and when anticipated; natural disasters, public health emergencies and extreme weather affecting Welltower's properties; Welltower's ability to re-lease space at similar rates as vacancies occur; Welltower's ability to timely reinvest sale proceeds at similar rates to assets sold; operator/tenant or joint venture partner bankruptcies or insolvencies; the cooperation of joint venture partners; government regulations affecting Medicare and Medicaid reimbursement rates and operational requirements; liability or contract claims by or against operators/tenants; unanticipated difficulties and/or expenditures relating to future investments or acquisitions; environmental laws affecting Welltower's properties; changes in rules or practices governing Welltower's financial reporting; the movement of U.S. and foreign currency exchange rates and changes to U.S. and global monetary, fiscal or trade policies; Welltower's approach to artificial intelligence; Welltower's ability to maintain its qualification as a REIT; key management personnel recruitment and retention; geopolitical tensions or conflicts, such as the ongoing conflict between Russia and Ukraine and in the Middle East, and other risks described in Welltower's reports filed from time to time with the SEC. Welltower undertakes no obligation to update or revise publicly any forward-looking statements, whether because of new information, future events or otherwise, or to update the reasons why actual results could differ from those projected in any forward-looking statements. Additional Information The information in this supplemental information package should be read in conjunction with our Annual Report on Form 10-K, Quarterly Reports on Form 10-Q, Current Reports on Form 8-K and other information filed with, or furnished to, the SEC. The reconciliations of Non-GAAP measures are an integral part of the information presented herein. You can access our Annual Report on Form 10-K, Quarterly Reports on Form 10-Q, Current Reports on Form 8-K and amendments to those reports filed or furnished pursuant to Section 13(a) or 15(d) of the Exchange Act at www.welltower.com as soon as reasonably practicable after they are filed with, or furnished to, the SEC. You can also review these SEC filings and other information by accessing the SEC's website at http://www.sec.gov. We routinely post important information on our website at www.welltower.com in the “Investors” section, including corporate and investor presentations and financial information. We intend to use our website as a means of disclosing material, non-public information and for complying with our disclosure obligations under Regulation FD. Such disclosures will be included on our website under the heading "Investors." Accordingly, investors should monitor such portion of our website in addition to following our press releases, public conference calls and filings with the SEC. The information on or connected to our website is not, and shall not be deemed to be, a part of, or incorporated into this supplemental information package. 37