Shareholder Report
|
12 Months Ended |
|
Aug. 31, 2026
USD ($)
Holding
|
|---|
| Shareholder Report [Line Items] |
|
| Document Type |
N-CSR
|
| Amendment Flag |
false
|
| Registrant Name |
EATON VANCE MUNICIPALS TRUST
|
| Entity Central Index Key |
0000778365
|
| Entity Investment Company Type |
N-1A
|
| Document Period End Date |
Aug. 31, 2026
|
| Shareholder Report Annual or Semi-Annual |
Annual Shareholder Report
|
| C000013178 |
|
| Shareholder Report [Line Items] |
|
| Fund Name |
Eaton Vance Georgia Municipal Income Fund
|
| Class Name |
Class A
|
| Trading Symbol |
ETGAX
|
| Annual or Semi-Annual Statement [Text Block] |
This annual shareholder report contains important information about the Eaton Vance Georgia Municipal Income Fund for the period of September 1, 2025 to August 31, 2026.
|
| Additional Information [Text Block] |
You can find additional information about the Fund at www.eatonvance.com/open-end-mutual-fund-documents.php. You can also request this information by contacting us at 1-800-262-1122.
|
| Additional Information Phone Number |
1-800-262-1122
|
| Additional Information Website |
<span style="box-sizing: border-box; color: rgb(0, 0, 0); display: inline; flex-wrap: nowrap; font-size: 10.6667px; font-weight: 400; grid-area: auto; line-height: 16px; margin: 0px; overflow: visible; text-align: left; text-align-last: auto; white-space-collapse: preserve-breaks;">www.eatonvance.com/open-end-mutual-fund-documents.php</span>
|
| Expenses [Text Block] |
What were the Fund costs for the last year?(based on a hypothetical $10,000 investment)
Table Summary
Class Name |
Costs of a $10,000 investment |
Costs paid as a percentage of a $10,000 investment |
Class A |
$75 |
0.73% | |
| Expenses Paid, Amount |
$ 75
|
| Expense Ratio, Percent |
0.73%
|
| Factors Affecting Performance [Text Block] |
How did the Fund perform last year and what affected its performance?Key contributors to (↑) and detractors from (↓) performance, relative to the Bloomberg Municipal Bond Index (the Index): ↑ Security selections in the transportation sector contributed to index-relative returns during the period ↑ An overweight exposure to and security selection in bonds with maturities of 17 to 22 years, contributed to relative performance ↑ An overweight exposure to and security selection in bonds with coupon rates between 4% and 4.99% also helped returns ↓ An out-of-index exposure to variable-rate demand notes (VRDNs) detracted from relative returns during the period ↓ An overweight position in industrial development revenue (IDR) bonds detracted from performance ↓ An overweight position in pre-refunded securities detracted from performance |
| Performance Past Does Not Indicate Future [Text] |
THE FUND'S PAST PERFORMANCE IS NO GUARANTEE OF FUTURE RESULTS.
|
| Line Graph [Table Text Block] |
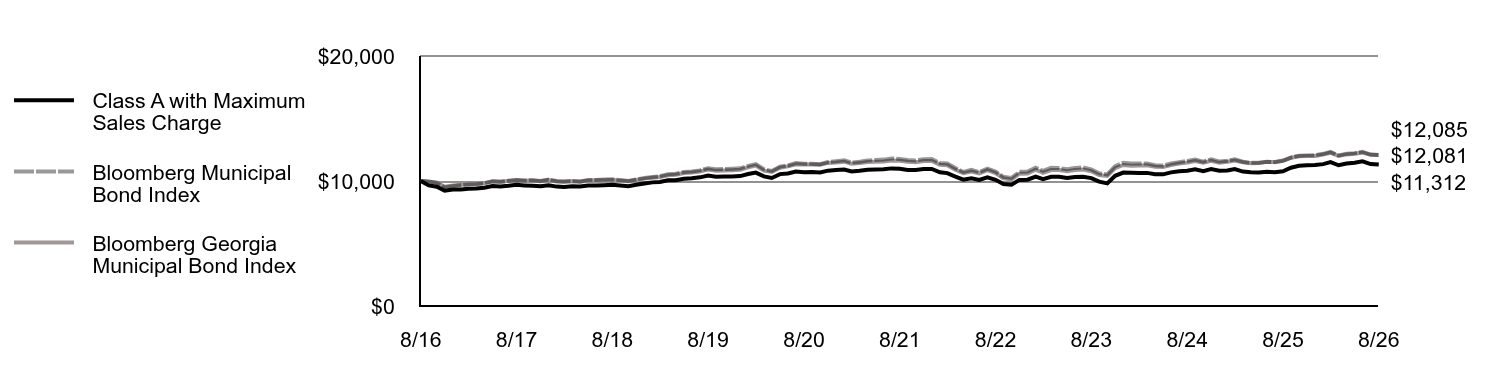
Table Summary
|
Class A with Maximum Sales Charge |
Bloomberg Municipal Bond Index |
Bloomberg Georgia Municipal Bond Index |
8/16 |
$10,000 |
$10,000 |
$10,000 |
9/16 |
$9,644 |
$9,950 |
$9,951 |
10/16 |
$9,546 |
$9,846 |
$9,869 |
11/16 |
$9,218 |
$9,479 |
$9,539 |
12/16 |
$9,318 |
$9,590 |
$9,640 |
1/17 |
$9,329 |
$9,653 |
$9,699 |
2/17 |
$9,385 |
$9,720 |
$9,759 |
3/17 |
$9,397 |
$9,741 |
$9,771 |
4/17 |
$9,465 |
$9,812 |
$9,832 |
5/17 |
$9,600 |
$9,968 |
$9,973 |
6/17 |
$9,567 |
$9,932 |
$9,938 |
7/17 |
$9,612 |
$10,012 |
$10,003 |
8/17 |
$9,693 |
$10,088 |
$10,068 |
9/17 |
$9,649 |
$10,037 |
$10,013 |
10/17 |
$9,617 |
$10,062 |
$10,035 |
11/17 |
$9,573 |
$10,008 |
$9,981 |
12/17 |
$9,653 |
$10,112 |
$10,069 |
1/18 |
$9,551 |
$9,993 |
$9,964 |
2/18 |
$9,528 |
$9,963 |
$9,947 |
3/18 |
$9,574 |
$10,000 |
$9,970 |
4/18 |
$9,552 |
$9,964 |
$9,938 |
5/18 |
$9,645 |
$10,079 |
$10,037 |
6/18 |
$9,647 |
$10,087 |
$10,051 |
7/18 |
$9,669 |
$10,112 |
$10,068 |
8/18 |
$9,692 |
$10,138 |
$10,085 |
9/18 |
$9,646 |
$10,072 |
$10,025 |
10/18 |
$9,587 |
$10,010 |
$9,974 |
11/18 |
$9,693 |
$10,121 |
$10,083 |
12/18 |
$9,797 |
$10,242 |
$10,191 |
1/19 |
$9,890 |
$10,319 |
$10,267 |
2/19 |
$9,925 |
$10,375 |
$10,317 |
3/19 |
$10,053 |
$10,539 |
$10,459 |
4/19 |
$10,063 |
$10,578 |
$10,495 |
5/19 |
$10,179 |
$10,724 |
$10,634 |
6/19 |
$10,223 |
$10,764 |
$10,678 |
7/19 |
$10,291 |
$10,850 |
$10,759 |
8/19 |
$10,429 |
$11,022 |
$10,916 |
9/19 |
$10,344 |
$10,933 |
$10,812 |
10/19 |
$10,353 |
$10,953 |
$10,837 |
11/19 |
$10,362 |
$10,980 |
$10,867 |
12/19 |
$10,394 |
$11,014 |
$10,902 |
1/20 |
$10,558 |
$11,212 |
$11,090 |
2/20 |
$10,673 |
$11,356 |
$11,234 |
3/20 |
$10,368 |
$10,944 |
$10,826 |
4/20 |
$10,243 |
$10,807 |
$10,723 |
5/20 |
$10,551 |
$11,151 |
$11,058 |
6/20 |
$10,606 |
$11,242 |
$11,168 |
7/20 |
$10,758 |
$11,432 |
$11,341 |
8/20 |
$10,703 |
$11,378 |
$11,312 |
9/20 |
$10,720 |
$11,381 |
$11,329 |
10/20 |
$10,689 |
$11,346 |
$11,303 |
11/20 |
$10,828 |
$11,518 |
$11,449 |
12/20 |
$10,881 |
$11,588 |
$11,489 |
1/21 |
$10,921 |
$11,662 |
$11,547 |
2/21 |
$10,765 |
$11,476 |
$11,373 |
3/21 |
$10,817 |
$11,547 |
$11,440 |
4/21 |
$10,894 |
$11,644 |
$11,517 |
5/21 |
$10,921 |
$11,679 |
$11,537 |
6/21 |
$10,934 |
$11,711 |
$11,558 |
7/21 |
$11,009 |
$11,808 |
$11,648 |
8/21 |
$10,973 |
$11,765 |
$11,611 |
9/21 |
$10,888 |
$11,680 |
$11,534 |
10/21 |
$10,876 |
$11,645 |
$11,494 |
11/21 |
$10,952 |
$11,745 |
$11,592 |
12/21 |
$10,965 |
$11,764 |
$11,605 |
1/22 |
$10,693 |
$11,442 |
$11,307 |
2/22 |
$10,633 |
$11,401 |
$11,269 |
3/22 |
$10,348 |
$11,031 |
$10,909 |
4/22 |
$10,102 |
$10,726 |
$10,630 |
5/22 |
$10,217 |
$10,885 |
$10,764 |
6/22 |
$10,084 |
$10,707 |
$10,608 |
7/22 |
$10,301 |
$10,990 |
$10,869 |
8/22 |
$10,092 |
$10,749 |
$10,633 |
9/22 |
$9,758 |
$10,336 |
$10,220 |
10/22 |
$9,701 |
$10,250 |
$10,120 |
11/22 |
$10,088 |
$10,730 |
$10,585 |
12/22 |
$10,107 |
$10,761 |
$10,600 |
1/23 |
$10,355 |
$11,070 |
$10,902 |
2/23 |
$10,149 |
$10,819 |
$10,660 |
3/23 |
$10,336 |
$11,059 |
$10,877 |
4/23 |
$10,333 |
$11,034 |
$10,878 |
5/23 |
$10,241 |
$10,939 |
$10,773 |
6/23 |
$10,315 |
$11,048 |
$10,872 |
7/23 |
$10,339 |
$11,092 |
$10,912 |
8/23 |
$10,234 |
$10,932 |
$10,779 |
9/23 |
$9,949 |
$10,612 |
$10,472 |
10/23 |
$9,806 |
$10,521 |
$10,399 |
11/23 |
$10,415 |
$11,189 |
$11,027 |
12/23 |
$10,675 |
$11,449 |
$11,280 |
1/24 |
$10,661 |
$11,391 |
$11,214 |
2/24 |
$10,649 |
$11,406 |
$11,238 |
3/24 |
$10,649 |
$11,405 |
$11,258 |
4/24 |
$10,544 |
$11,264 |
$11,136 |
5/24 |
$10,532 |
$11,231 |
$11,112 |
6/24 |
$10,691 |
$11,403 |
$11,271 |
7/24 |
$10,771 |
$11,507 |
$11,399 |
8/24 |
$10,824 |
$11,598 |
$11,482 |
9/24 |
$10,932 |
$11,712 |
$11,605 |
10/24 |
$10,787 |
$11,542 |
$11,460 |
11/24 |
$10,949 |
$11,741 |
$11,622 |
12/24 |
$10,816 |
$11,570 |
$11,455 |
1/25 |
$10,845 |
$11,628 |
$11,540 |
2/25 |
$10,953 |
$11,743 |
$11,639 |
3/25 |
$10,752 |
$11,544 |
$11,496 |
4/25 |
$10,701 |
$11,451 |
$11,413 |
5/25 |
$10,675 |
$11,459 |
$11,445 |
6/25 |
$10,746 |
$11,530 |
$11,529 |
7/25 |
$10,694 |
$11,507 |
$11,529 |
8/25 |
$10,780 |
$11,607 |
$11,638 |
9/25 |
$11,058 |
$11,876 |
$11,857 |
10/25 |
$11,213 |
$12,023 |
$11,972 |
11/25 |
$11,258 |
$12,050 |
$12,004 |
12/25 |
$11,276 |
$12,061 |
$12,006 |
1/26 |
$11,348 |
$12,174 |
$12,116 |
2/26 |
$11,505 |
$12,326 |
$12,264 |
3/26 |
$11,257 |
$12,040 |
$11,998 |
4/26 |
$11,401 |
$12,178 |
$12,128 |
5/26 |
$11,460 |
$12,223 |
$12,175 |
6/26 |
$11,576 |
$12,341 |
$12,281 |
7/26 |
$11,355 |
$12,113 |
$12,095 |
8/26 |
$11,312 |
$12,085 |
$12,081 |
|
| Average Annual Return [Table Text Block] |
Table Summary
Fund |
1 Year |
5 Years |
10 Years |
Class A |
4.96% |
0.61% |
1.58% |
Class A with 3.25% Maximum Sales Charge |
1.59% |
(0.05)% |
1.24% |
Bloomberg Municipal Bond Index |
4.12% |
0.54% |
1.91% |
Bloomberg Georgia Municipal Bond Index |
3.80% |
0.80% |
1.91% | |
| No Deduction of Taxes [Text Block] |
Performance does not reflect the deduction of taxes that a shareholder would pay on Fund distributions or redemption of Fund shares.
|
| Updated Performance Information Location [Text Block] |
For more recent performance information, visit www.eatonvance.com/performance.php.
|
| AssetsNet |
$ 139,523,719
|
| Holdings Count | Holding |
133
|
| Advisory Fees Paid, Amount |
$ 479,127
|
| InvestmentCompanyPortfolioTurnover |
37.00%
|
| Additional Fund Statistics [Text Block] |
Table Summary
Total Net Assets |
$139,523,719 |
# of Portfolio Holdings |
133 |
Portfolio Turnover Rate |
37% |
Total Advisory Fees Paid |
$479,127 | |
| Holdings [Text Block] |
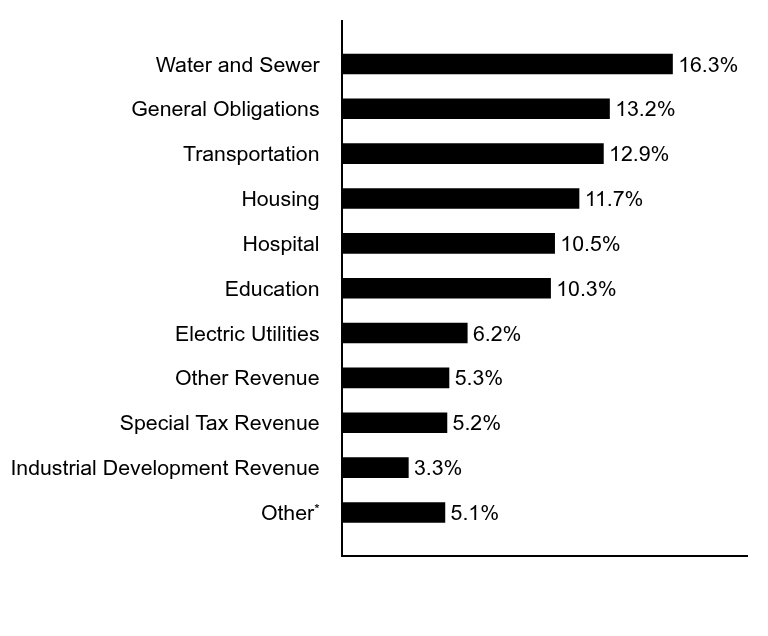
Sector Allocation (% of total investments)
Table Summary
Value |
Value |
OtherFootnote Reference* |
5.1% |
Industrial Development Revenue |
3.3% |
Special Tax Revenue |
5.2% |
Other Revenue |
5.3% |
Electric Utilities |
6.2% |
Education |
10.3% |
Hospital |
10.5% |
Housing |
11.7% |
Transportation |
12.9% |
General Obligations |
13.2% |
Water and Sewer |
16.3% |
| Footnote |
Description |
Footnote* |
Sectors less than 3% each. | |
| Credit Quality Explanation [Text Block] |
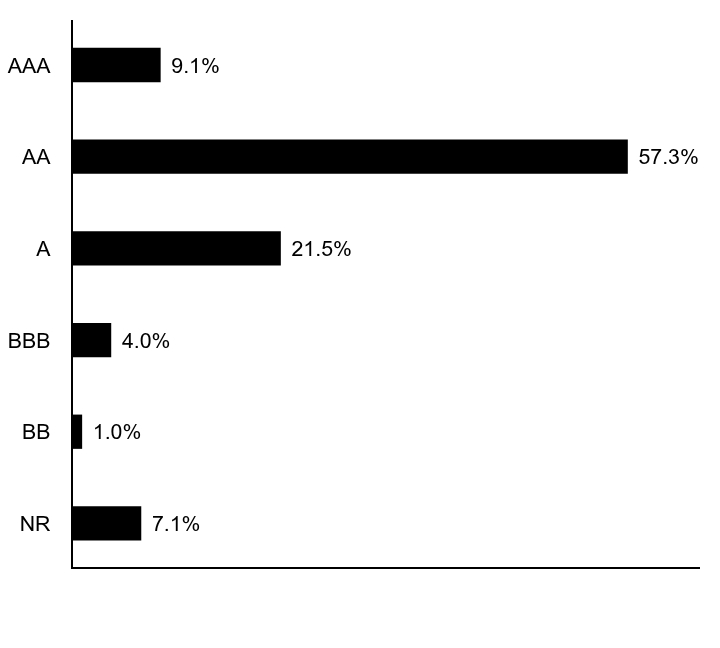
Credit Quality (% of total investments)Footnote Referencea
Table Summary
Value |
Value |
NR |
7.1% |
BB |
1.0% |
BBB |
4.0% |
A |
21.5% |
AA |
57.3% |
AAA |
9.1% |
| Footnote |
Description |
Footnotea |
Ratings are based on Moody’s Investors Service, Inc. (“Moody’s”), S&P Global Ratings (“S&P”) or Fitch Ratings (“Fitch”). If securities are rated differently by the ratings agencies, the highest rating is applied. Moody's ratings are converted to the S&P and Fitch scale with ratings ranging from AAA, being the highest, to D, being the lowest. Ratings of BBB or higher are considered to be investment-grade quality. Holdings designated as “Not Rated” (if any) are not rated by the national ratings agencies stated above. | |
| Material Fund Change [Text Block] |
|
| Updated Prospectus Phone Number |
1-800-262-1122
|
| C000013180 |
|
| Shareholder Report [Line Items] |
|
| Fund Name |
Eaton Vance Georgia Municipal Income Fund
|
| Class Name |
Class C
|
| Trading Symbol |
ECGAX
|
| Annual or Semi-Annual Statement [Text Block] |
This annual shareholder report contains important information about the Eaton Vance Georgia Municipal Income Fund for the period of September 1, 2025 to August 31, 2026.
|
| Additional Information [Text Block] |
You can find additional information about the Fund at www.eatonvance.com/open-end-mutual-fund-documents.php. You can also request this information by contacting us at 1-800-262-1122.
|
| Additional Information Phone Number |
1-800-262-1122
|
| Additional Information Website |
<span style="box-sizing: border-box; color: rgb(0, 0, 0); display: inline; flex-wrap: nowrap; font-size: 10.6667px; font-weight: 400; grid-area: auto; line-height: 16px; margin: 0px; overflow: visible; text-align: left; text-align-last: auto; white-space-collapse: preserve-breaks;">www.eatonvance.com/open-end-mutual-fund-documents.php</span>
|
| Expenses [Text Block] |
What were the Fund costs for the last year?(based on a hypothetical $10,000 investment)
Table Summary
Class Name |
Costs of a $10,000 investment |
Costs paid as a percentage of a $10,000 investment |
Class C |
$151 |
1.48% | |
| Expenses Paid, Amount |
$ 151
|
| Expense Ratio, Percent |
1.48%
|
| Factors Affecting Performance [Text Block] |
How did the Fund perform last year and what affected its performance?Key contributors to (↑) and detractors from (↓) performance, relative to the Bloomberg Municipal Bond Index (the Index): ↓ An out-of-index exposure to variable-rate demand notes (VRDNs) detracted from relative returns during the period ↓ An overweight position in industrial development revenue (IDR) bonds detracted from performance ↓ An overweight position in pre-refunded securities detracted from performance ↑ Security selections in the transportation sector contributed to index-relative returns during the period ↑ An overweight exposure to and security selection in bonds with maturities of 17 to 22 years, contributed to relative performance ↑ An overweight exposure to and security selection in bonds with coupon rates between 4% and 4.99% also helped returns |
| Performance Past Does Not Indicate Future [Text] |
THE FUND'S PAST PERFORMANCE IS NO GUARANTEE OF FUTURE RESULTS.
|
| Line Graph [Table Text Block] |
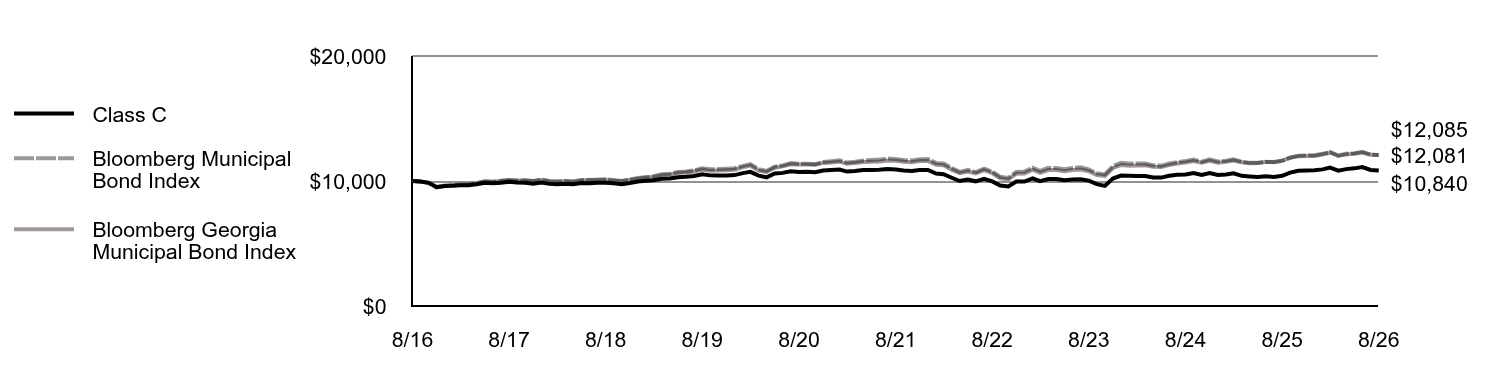
Table Summary
|
Class C |
Bloomberg Municipal Bond Index |
Bloomberg Georgia Municipal Bond Index |
8/16 |
$10,000 |
$10,000 |
$10,000 |
9/16 |
$9,955 |
$9,950 |
$9,951 |
10/16 |
$9,855 |
$9,846 |
$9,869 |
11/16 |
$9,503 |
$9,479 |
$9,539 |
12/16 |
$9,605 |
$9,590 |
$9,640 |
1/17 |
$9,611 |
$9,653 |
$9,699 |
2/17 |
$9,661 |
$9,720 |
$9,759 |
3/17 |
$9,668 |
$9,741 |
$9,771 |
4/17 |
$9,740 |
$9,812 |
$9,832 |
5/17 |
$9,865 |
$9,968 |
$9,973 |
6/17 |
$9,829 |
$9,932 |
$9,938 |
7/17 |
$9,867 |
$10,012 |
$10,003 |
8/17 |
$9,941 |
$10,088 |
$10,068 |
9/17 |
$9,883 |
$10,037 |
$10,013 |
10/17 |
$9,858 |
$10,062 |
$10,035 |
11/17 |
$9,789 |
$10,008 |
$9,981 |
12/17 |
$9,872 |
$10,112 |
$10,069 |
1/18 |
$9,770 |
$9,993 |
$9,964 |
2/18 |
$9,733 |
$9,963 |
$9,947 |
3/18 |
$9,773 |
$10,000 |
$9,970 |
4/18 |
$9,737 |
$9,964 |
$9,938 |
5/18 |
$9,831 |
$10,079 |
$10,037 |
6/18 |
$9,828 |
$10,087 |
$10,051 |
7/18 |
$9,856 |
$10,112 |
$10,068 |
8/18 |
$9,862 |
$10,138 |
$10,085 |
9/18 |
$9,813 |
$10,072 |
$10,025 |
10/18 |
$9,742 |
$10,010 |
$9,974 |
11/18 |
$9,838 |
$10,121 |
$10,083 |
12/18 |
$9,954 |
$10,242 |
$10,191 |
1/19 |
$10,027 |
$10,319 |
$10,267 |
2/19 |
$10,067 |
$10,375 |
$10,317 |
3/19 |
$10,183 |
$10,539 |
$10,459 |
4/19 |
$10,199 |
$10,578 |
$10,495 |
5/19 |
$10,303 |
$10,724 |
$10,634 |
6/19 |
$10,340 |
$10,764 |
$10,678 |
7/19 |
$10,400 |
$10,850 |
$10,759 |
8/19 |
$10,536 |
$11,022 |
$10,916 |
9/19 |
$10,450 |
$10,933 |
$10,812 |
10/19 |
$10,442 |
$10,953 |
$10,837 |
11/19 |
$10,446 |
$10,980 |
$10,867 |
12/19 |
$10,471 |
$11,014 |
$10,902 |
1/20 |
$10,631 |
$11,212 |
$11,090 |
2/20 |
$10,735 |
$11,356 |
$11,234 |
3/20 |
$10,431 |
$10,944 |
$10,826 |
4/20 |
$10,296 |
$10,807 |
$10,723 |
5/20 |
$10,603 |
$11,151 |
$11,058 |
6/20 |
$10,650 |
$11,242 |
$11,168 |
7/20 |
$10,786 |
$11,432 |
$11,341 |
8/20 |
$10,729 |
$11,378 |
$11,312 |
9/20 |
$10,740 |
$11,381 |
$11,329 |
10/20 |
$10,705 |
$11,346 |
$11,303 |
11/20 |
$10,841 |
$11,518 |
$11,449 |
12/20 |
$10,885 |
$11,588 |
$11,489 |
1/21 |
$10,916 |
$11,662 |
$11,547 |
2/21 |
$10,754 |
$11,476 |
$11,373 |
3/21 |
$10,796 |
$11,547 |
$11,440 |
4/21 |
$10,874 |
$11,644 |
$11,517 |
5/21 |
$10,882 |
$11,679 |
$11,537 |
6/21 |
$10,900 |
$11,711 |
$11,558 |
7/21 |
$10,963 |
$11,808 |
$11,648 |
8/21 |
$10,924 |
$11,765 |
$11,611 |
9/21 |
$10,838 |
$11,680 |
$11,534 |
10/21 |
$10,810 |
$11,645 |
$11,494 |
11/21 |
$10,886 |
$11,745 |
$11,592 |
12/21 |
$10,881 |
$11,764 |
$11,605 |
1/22 |
$10,599 |
$11,442 |
$11,307 |
2/22 |
$10,539 |
$11,401 |
$11,269 |
3/22 |
$10,257 |
$11,031 |
$10,909 |
4/22 |
$10,000 |
$10,726 |
$10,630 |
5/22 |
$10,114 |
$10,885 |
$10,764 |
6/22 |
$9,974 |
$10,707 |
$10,608 |
7/22 |
$10,181 |
$10,990 |
$10,869 |
8/22 |
$9,970 |
$10,749 |
$10,633 |
9/22 |
$9,634 |
$10,336 |
$10,220 |
10/22 |
$9,565 |
$10,250 |
$10,120 |
11/22 |
$9,952 |
$10,730 |
$10,585 |
12/22 |
$9,953 |
$10,761 |
$10,600 |
1/23 |
$10,200 |
$11,070 |
$10,902 |
2/23 |
$9,982 |
$10,819 |
$10,660 |
3/23 |
$10,161 |
$11,059 |
$10,877 |
4/23 |
$10,165 |
$11,034 |
$10,878 |
5/23 |
$10,063 |
$10,939 |
$10,773 |
6/23 |
$10,127 |
$11,048 |
$10,872 |
7/23 |
$10,144 |
$11,092 |
$10,912 |
8/23 |
$10,031 |
$10,932 |
$10,779 |
9/23 |
$9,753 |
$10,612 |
$10,472 |
10/23 |
$9,606 |
$10,521 |
$10,399 |
11/23 |
$10,195 |
$11,189 |
$11,027 |
12/23 |
$10,439 |
$11,449 |
$11,280 |
1/24 |
$10,422 |
$11,391 |
$11,214 |
2/24 |
$10,406 |
$11,406 |
$11,238 |
3/24 |
$10,401 |
$11,405 |
$11,258 |
4/24 |
$10,289 |
$11,264 |
$11,136 |
5/24 |
$10,273 |
$11,231 |
$11,112 |
6/24 |
$10,413 |
$11,403 |
$11,271 |
7/24 |
$10,493 |
$11,507 |
$11,399 |
8/24 |
$10,524 |
$11,598 |
$11,482 |
9/24 |
$10,630 |
$11,712 |
$11,605 |
10/24 |
$10,481 |
$11,542 |
$11,460 |
11/24 |
$10,636 |
$11,741 |
$11,622 |
12/24 |
$10,486 |
$11,570 |
$11,455 |
1/25 |
$10,519 |
$11,628 |
$11,540 |
2/25 |
$10,613 |
$11,743 |
$11,639 |
3/25 |
$10,414 |
$11,544 |
$11,496 |
4/25 |
$10,363 |
$11,451 |
$11,413 |
5/25 |
$10,323 |
$11,459 |
$11,445 |
6/25 |
$10,382 |
$11,530 |
$11,529 |
7/25 |
$10,330 |
$11,507 |
$11,529 |
8/25 |
$10,416 |
$11,607 |
$11,638 |
9/25 |
$10,675 |
$11,876 |
$11,857 |
10/25 |
$10,822 |
$12,023 |
$11,972 |
11/25 |
$10,846 |
$12,050 |
$12,004 |
12/25 |
$10,856 |
$12,061 |
$12,006 |
1/26 |
$10,930 |
$12,174 |
$12,116 |
2/26 |
$11,079 |
$12,326 |
$12,264 |
3/26 |
$10,825 |
$12,040 |
$11,998 |
4/26 |
$10,950 |
$12,178 |
$12,128 |
5/26 |
$11,011 |
$12,223 |
$12,175 |
6/26 |
$11,110 |
$12,341 |
$12,281 |
7/26 |
$10,881 |
$12,113 |
$12,095 |
8/26 |
$10,840 |
$12,085 |
$12,081 |
|
| Average Annual Return [Table Text Block] |
Table Summary
Fund |
1 Year |
5 Years |
10 Years |
Class C, with conversion to Class A after 8 years |
4.08% |
(0.15)% |
0.81% |
Class C, with 1% Maximum Contingent Deferred Sales Charge and conversion to Class A after 8 years |
3.08% |
(0.15)% |
0.81% |
Bloomberg Municipal Bond Index |
4.12% |
0.54% |
1.91% |
Bloomberg Georgia Municipal Bond Index |
3.80% |
0.80% |
1.91% | |
| No Deduction of Taxes [Text Block] |
Performance does not reflect the deduction of taxes that a shareholder would pay on Fund distributions or redemption of Fund shares.
|
| Updated Performance Information Location [Text Block] |
For more recent performance information, visit www.eatonvance.com/performance.php.
|
| AssetsNet |
$ 139,523,719
|
| Holdings Count | Holding |
133
|
| Advisory Fees Paid, Amount |
$ 479,127
|
| InvestmentCompanyPortfolioTurnover |
37.00%
|
| Additional Fund Statistics [Text Block] |
Table Summary
Total Net Assets |
$139,523,719 |
# of Portfolio Holdings |
133 |
Portfolio Turnover Rate |
37% |
Total Advisory Fees Paid |
$479,127 | |
| Holdings [Text Block] |
Sector Allocation (% of total investments)
Table Summary
Value |
Value |
OtherFootnote Reference* |
5.1% |
Industrial Development Revenue |
3.3% |
Special Tax Revenue |
5.2% |
Other Revenue |
5.3% |
Electric Utilities |
6.2% |
Education |
10.3% |
Hospital |
10.5% |
Housing |
11.7% |
Transportation |
12.9% |
General Obligations |
13.2% |
Water and Sewer |
16.3% |
| Footnote |
Description |
Footnote* |
Sectors less than 3% each. | |
| Credit Quality Explanation [Text Block] |
Credit Quality (% of total investments)Footnote Referencea
Table Summary
Value |
Value |
NR |
7.1% |
BB |
1.0% |
BBB |
4.0% |
A |
21.5% |
AA |
57.3% |
AAA |
9.1% |
| Footnote |
Description |
Footnotea |
Ratings are based on Moody’s Investors Service, Inc. (“Moody’s”), S&P Global Ratings (“S&P”) or Fitch Ratings (“Fitch”). If securities are rated differently by the ratings agencies, the highest rating is applied. Moody's ratings are converted to the S&P and Fitch scale with ratings ranging from AAA, being the highest, to D, being the lowest. Ratings of BBB or higher are considered to be investment-grade quality. Holdings designated as “Not Rated” (if any) are not rated by the national ratings agencies stated above. | |
| Material Fund Change [Text Block] |
|
| Updated Prospectus Phone Number |
1-800-262-1122
|
| C000063956 |
|
| Shareholder Report [Line Items] |
|
| Fund Name |
Eaton Vance Georgia Municipal Income Fund
|
| Class Name |
Class I
|
| Trading Symbol |
EIGAX
|
| Annual or Semi-Annual Statement [Text Block] |
This annual shareholder report contains important information about the Eaton Vance Georgia Municipal Income Fund for the period of September 1, 2025 to August 31, 2026.
|
| Additional Information [Text Block] |
You can find additional information about the Fund at www.eatonvance.com/open-end-mutual-fund-documents.php. You can also request this information by contacting us at 1-800-262-1122.
|
| Additional Information Phone Number |
1-800-262-1122
|
| Additional Information Website |
<span style="box-sizing: border-box; color: rgb(0, 0, 0); display: inline; flex-wrap: nowrap; font-size: 10.6667px; font-weight: 400; grid-area: auto; line-height: 16px; margin: 0px; overflow: visible; text-align: left; text-align-last: auto; white-space-collapse: preserve-breaks;">www.eatonvance.com/open-end-mutual-fund-documents.php</span>
|
| Expenses [Text Block] |
What were the Fund costs for the last year?(based on a hypothetical $10,000 investment)
Table Summary
Class Name |
Costs of a $10,000 investment |
Costs paid as a percentage of a $10,000 investment |
Class I |
$54 |
0.53% | |
| Expenses Paid, Amount |
$ 54
|
| Expense Ratio, Percent |
0.53%
|
| Factors Affecting Performance [Text Block] |
How did the Fund perform last year and what affected its performance?Key contributors to (↑) and detractors from (↓) performance, relative to the Bloomberg Municipal Bond Index (the Index): ↑ Security selections in the transportation sector contributed to index-relative returns during the period ↑ An overweight exposure to and security selection in bonds with maturities of 17 to 22 years, contributed to relative performance ↑ An overweight exposure to and security selection in bonds with coupon rates between 4% and 4.99% also helped returns ↓ An out-of-index exposure to variable-rate demand notes (VRDNs) detracted from relative returns during the period ↓ An overweight position in industrial development revenue (IDR) bonds detracted from performance ↓ An overweight position in pre-refunded securities detracted from performance |
| Performance Past Does Not Indicate Future [Text] |
THE FUND'S PAST PERFORMANCE IS NO GUARANTEE OF FUTURE RESULTS.
|
| Line Graph [Table Text Block] |
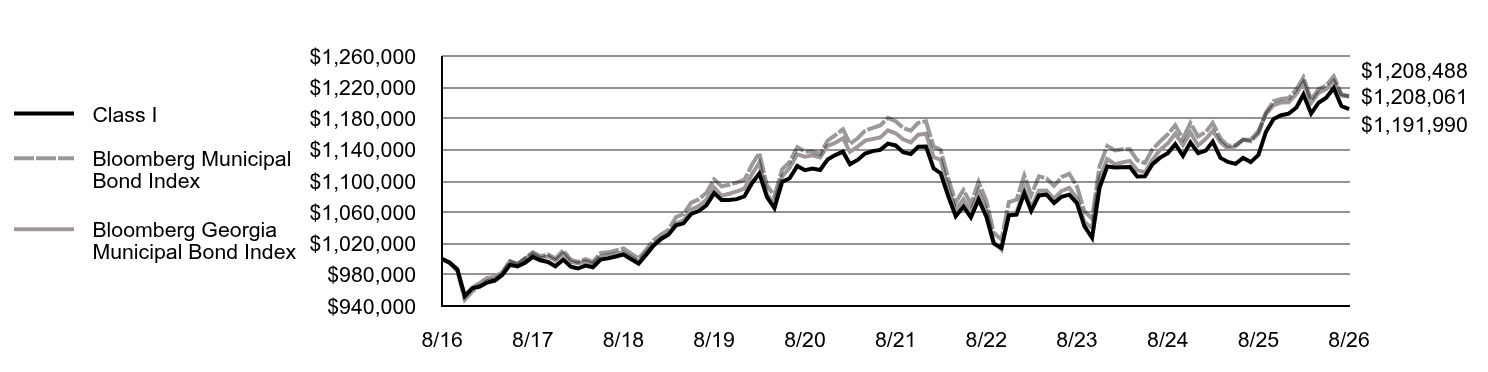
Table Summary
|
Class I |
Bloomberg Municipal Bond Index |
Bloomberg Georgia Municipal Bond Index |
8/16 |
$1,000,000 |
$1,000,000 |
$1,000,000 |
9/16 |
$995,811 |
$995,009 |
$995,059 |
10/16 |
$987,034 |
$984,570 |
$986,889 |
11/16 |
$952,297 |
$947,850 |
$953,943 |
12/16 |
$962,762 |
$958,978 |
$964,030 |
1/17 |
$965,217 |
$965,300 |
$969,899 |
2/17 |
$970,005 |
$972,003 |
$975,928 |
3/17 |
$972,567 |
$974,113 |
$977,068 |
4/17 |
$979,725 |
$981,182 |
$983,245 |
5/17 |
$992,636 |
$996,754 |
$997,297 |
6/17 |
$990,609 |
$993,179 |
$993,792 |
7/17 |
$995,434 |
$1,001,214 |
$1,000,300 |
8/17 |
$1,002,828 |
$1,008,833 |
$1,006,795 |
9/17 |
$998,477 |
$1,003,704 |
$1,001,319 |
10/17 |
$996,412 |
$1,006,154 |
$1,003,489 |
11/17 |
$990,877 |
$1,000,767 |
$998,098 |
12/17 |
$999,343 |
$1,011,227 |
$1,006,892 |
1/18 |
$990,170 |
$999,322 |
$996,363 |
2/18 |
$987,974 |
$996,336 |
$994,692 |
3/18 |
$991,743 |
$1,000,013 |
$997,040 |
4/18 |
$989,656 |
$996,445 |
$993,822 |
5/18 |
$999,390 |
$1,007,855 |
$1,003,650 |
6/18 |
$1,000,922 |
$1,008,715 |
$1,005,108 |
7/18 |
$1,003,420 |
$1,011,163 |
$1,006,808 |
8/18 |
$1,005,940 |
$1,013,760 |
$1,008,484 |
9/18 |
$1,000,133 |
$1,007,197 |
$1,002,463 |
10/18 |
$994,300 |
$1,000,994 |
$997,381 |
11/18 |
$1,005,363 |
$1,012,073 |
$1,008,285 |
12/18 |
$1,017,541 |
$1,024,191 |
$1,019,075 |
1/19 |
$1,026,163 |
$1,031,933 |
$1,026,666 |
2/19 |
$1,031,163 |
$1,037,459 |
$1,031,706 |
3/19 |
$1,043,352 |
$1,053,858 |
$1,045,851 |
4/19 |
$1,045,830 |
$1,057,819 |
$1,049,470 |
5/19 |
$1,057,958 |
$1,072,403 |
$1,063,412 |
6/19 |
$1,061,506 |
$1,076,362 |
$1,067,820 |
7/19 |
$1,068,753 |
$1,085,037 |
$1,075,861 |
8/19 |
$1,084,483 |
$1,102,152 |
$1,091,554 |
9/19 |
$1,075,768 |
$1,093,317 |
$1,081,220 |
10/19 |
$1,075,670 |
$1,095,276 |
$1,083,737 |
11/19 |
$1,076,814 |
$1,098,016 |
$1,086,650 |
12/19 |
$1,080,341 |
$1,101,368 |
$1,090,247 |
1/20 |
$1,097,508 |
$1,121,156 |
$1,108,961 |
2/20 |
$1,109,678 |
$1,135,614 |
$1,123,436 |
3/20 |
$1,079,463 |
$1,094,422 |
$1,082,641 |
4/20 |
$1,065,350 |
$1,080,687 |
$1,072,341 |
5/20 |
$1,098,816 |
$1,115,065 |
$1,105,814 |
6/20 |
$1,103,454 |
$1,124,242 |
$1,116,820 |
7/20 |
$1,119,349 |
$1,143,177 |
$1,134,149 |
8/20 |
$1,113,845 |
$1,137,813 |
$1,131,158 |
9/20 |
$1,115,874 |
$1,138,054 |
$1,132,892 |
10/20 |
$1,114,041 |
$1,134,636 |
$1,130,250 |
11/20 |
$1,127,443 |
$1,151,758 |
$1,144,857 |
12/20 |
$1,133,124 |
$1,158,774 |
$1,148,931 |
1/21 |
$1,137,515 |
$1,166,159 |
$1,154,668 |
2/21 |
$1,121,479 |
$1,147,630 |
$1,137,252 |
3/21 |
$1,127,011 |
$1,154,708 |
$1,144,046 |
4/21 |
$1,135,216 |
$1,164,393 |
$1,151,746 |
5/21 |
$1,138,242 |
$1,167,867 |
$1,153,741 |
6/21 |
$1,139,799 |
$1,171,074 |
$1,155,754 |
7/21 |
$1,147,781 |
$1,180,786 |
$1,164,795 |
8/21 |
$1,145,504 |
$1,176,453 |
$1,161,057 |
9/21 |
$1,136,818 |
$1,167,963 |
$1,153,436 |
10/21 |
$1,134,519 |
$1,164,548 |
$1,149,350 |
11/21 |
$1,143,884 |
$1,174,461 |
$1,159,193 |
12/21 |
$1,144,211 |
$1,176,356 |
$1,160,459 |
1/22 |
$1,116,048 |
$1,144,156 |
$1,130,685 |
2/22 |
$1,110,027 |
$1,140,057 |
$1,126,883 |
3/22 |
$1,080,502 |
$1,103,100 |
$1,090,892 |
4/22 |
$1,054,993 |
$1,072,589 |
$1,063,009 |
5/22 |
$1,067,222 |
$1,088,522 |
$1,076,423 |
6/22 |
$1,053,502 |
$1,070,693 |
$1,060,824 |
7/22 |
$1,076,331 |
$1,098,983 |
$1,086,878 |
8/22 |
$1,054,699 |
$1,074,897 |
$1,063,332 |
9/22 |
$1,020,108 |
$1,033,642 |
$1,021,972 |
10/22 |
$1,014,347 |
$1,025,046 |
$1,011,997 |
11/22 |
$1,056,129 |
$1,072,991 |
$1,058,520 |
12/22 |
$1,057,001 |
$1,076,063 |
$1,059,961 |
1/23 |
$1,084,428 |
$1,106,973 |
$1,090,247 |
2/23 |
$1,061,744 |
$1,081,942 |
$1,066,028 |
3/23 |
$1,081,490 |
$1,105,948 |
$1,087,672 |
4/23 |
$1,082,684 |
$1,103,421 |
$1,087,787 |
5/23 |
$1,071,867 |
$1,093,859 |
$1,077,275 |
6/23 |
$1,079,865 |
$1,104,817 |
$1,087,188 |
7/23 |
$1,082,499 |
$1,109,187 |
$1,091,242 |
8/23 |
$1,071,711 |
$1,093,219 |
$1,077,922 |
9/23 |
$1,042,117 |
$1,061,178 |
$1,047,232 |
10/23 |
$1,027,353 |
$1,052,148 |
$1,039,895 |
11/23 |
$1,091,231 |
$1,118,940 |
$1,102,728 |
12/23 |
$1,118,573 |
$1,144,946 |
$1,127,970 |
1/24 |
$1,117,350 |
$1,139,098 |
$1,121,422 |
2/24 |
$1,117,566 |
$1,140,561 |
$1,123,756 |
3/24 |
$1,117,772 |
$1,140,525 |
$1,125,772 |
4/24 |
$1,105,674 |
$1,126,400 |
$1,113,639 |
5/24 |
$1,105,900 |
$1,123,096 |
$1,111,226 |
6/24 |
$1,121,361 |
$1,140,311 |
$1,127,124 |
7/24 |
$1,129,918 |
$1,150,704 |
$1,139,902 |
8/24 |
$1,135,684 |
$1,159,779 |
$1,148,241 |
9/24 |
$1,147,201 |
$1,171,242 |
$1,160,505 |
10/24 |
$1,132,199 |
$1,154,164 |
$1,145,974 |
11/24 |
$1,149,362 |
$1,174,101 |
$1,162,222 |
12/24 |
$1,135,696 |
$1,157,008 |
$1,145,524 |
1/25 |
$1,138,884 |
$1,162,807 |
$1,154,043 |
2/25 |
$1,150,426 |
$1,174,336 |
$1,163,909 |
3/25 |
$1,129,580 |
$1,154,434 |
$1,149,641 |
4/25 |
$1,124,336 |
$1,145,133 |
$1,141,289 |
5/25 |
$1,121,886 |
$1,145,869 |
$1,144,464 |
6/25 |
$1,129,479 |
$1,153,002 |
$1,152,913 |
7/25 |
$1,124,190 |
$1,150,674 |
$1,152,888 |
8/25 |
$1,133,442 |
$1,160,675 |
$1,163,833 |
9/25 |
$1,162,830 |
$1,187,554 |
$1,185,714 |
10/25 |
$1,179,293 |
$1,202,283 |
$1,197,178 |
11/25 |
$1,184,232 |
$1,205,041 |
$1,200,361 |
12/25 |
$1,186,255 |
$1,206,125 |
$1,200,625 |
1/26 |
$1,194,108 |
$1,217,445 |
$1,211,638 |
2/26 |
$1,210,764 |
$1,232,618 |
$1,226,364 |
3/26 |
$1,186,371 |
$1,203,989 |
$1,199,761 |
4/26 |
$1,200,192 |
$1,217,775 |
$1,212,757 |
5/26 |
$1,206,619 |
$1,222,322 |
$1,217,539 |
6/26 |
$1,219,047 |
$1,234,103 |
$1,228,068 |
7/26 |
$1,195,982 |
$1,211,258 |
$1,209,452 |
8/26 |
$1,191,990 |
$1,208,488 |
$1,208,061 |
|
| Average Annual Return [Table Text Block] |
Table Summary
Fund |
1 Year |
5 Years |
10 Years |
Class I |
5.17% |
0.80% |
1.77% |
Bloomberg Municipal Bond Index |
4.12% |
0.54% |
1.91% |
Bloomberg Georgia Municipal Bond Index |
3.80% |
0.80% |
1.91% | |
| No Deduction of Taxes [Text Block] |
Performance does not reflect the deduction of taxes that a shareholder would pay on Fund distributions or redemption of Fund shares.
|
| Updated Performance Information Location [Text Block] |
For more recent performance information, visit www.eatonvance.com/performance.php.
|
| AssetsNet |
$ 139,523,719
|
| Holdings Count | Holding |
133
|
| Advisory Fees Paid, Amount |
$ 479,127
|
| InvestmentCompanyPortfolioTurnover |
37.00%
|
| Additional Fund Statistics [Text Block] |
Table Summary
Total Net Assets |
$139,523,719 |
# of Portfolio Holdings |
133 |
Portfolio Turnover Rate |
37% |
Total Advisory Fees Paid |
$479,127 | |
| Holdings [Text Block] |
Sector Allocation (% of total investments)
Table Summary
Value |
Value |
OtherFootnote Reference* |
5.1% |
Industrial Development Revenue |
3.3% |
Special Tax Revenue |
5.2% |
Other Revenue |
5.3% |
Electric Utilities |
6.2% |
Education |
10.3% |
Hospital |
10.5% |
Housing |
11.7% |
Transportation |
12.9% |
General Obligations |
13.2% |
Water and Sewer |
16.3% |
| Footnote |
Description |
Footnote* |
Sectors less than 3% each. | |
| Credit Quality Explanation [Text Block] |
Credit Quality (% of total investments)Footnote Referencea
Table Summary
Value |
Value |
NR |
7.1% |
BB |
1.0% |
BBB |
4.0% |
A |
21.5% |
AA |
57.3% |
AAA |
9.1% |
| Footnote |
Description |
Footnotea |
Ratings are based on Moody’s Investors Service, Inc. (“Moody’s”), S&P Global Ratings (“S&P”) or Fitch Ratings (“Fitch”). If securities are rated differently by the ratings agencies, the highest rating is applied. Moody's ratings are converted to the S&P and Fitch scale with ratings ranging from AAA, being the highest, to D, being the lowest. Ratings of BBB or higher are considered to be investment-grade quality. Holdings designated as “Not Rated” (if any) are not rated by the national ratings agencies stated above. | |
| Material Fund Change [Text Block] |
|
| Updated Prospectus Phone Number |
1-800-262-1122
|
| C000013104 |
|
| Shareholder Report [Line Items] |
|
| Fund Name |
Eaton Vance Maryland Municipal Income Fund
|
| Class Name |
Class A
|
| Trading Symbol |
ETMDX
|
| Annual or Semi-Annual Statement [Text Block] |
This annual shareholder report contains important information about the Eaton Vance Maryland Municipal Income Fund for the period of September 1, 2025 to August 31, 2026.
|
| Additional Information [Text Block] |
You can find additional information about the Fund at www.eatonvance.com/open-end-mutual-fund-documents.php. You can also request this information by contacting us at 1-800-262-1122.
|
| Additional Information Phone Number |
1-800-262-1122
|
| Additional Information Website |
<span style="box-sizing: border-box; color: rgb(0, 0, 0); display: inline; flex-wrap: nowrap; font-size: 10.6667px; font-weight: 400; grid-area: auto; line-height: 16px; margin: 0px; overflow: visible; text-align: left; text-align-last: auto; white-space-collapse: preserve-breaks;">www.eatonvance.com/open-end-mutual-fund-documents.php</span>
|
| Expenses [Text Block] |
What were the Fund costs for the last year?(based on a hypothetical $10,000 investment)
Table Summary
Class Name |
Costs of a $10,000 investment |
Costs paid as a percentage of a $10,000 investment |
Class A |
$80 |
0.78% | |
| Expenses Paid, Amount |
$ 80
|
| Expense Ratio, Percent |
0.78%
|
| Factors Affecting Performance [Text Block] |
How did the Fund perform last year and what affected its performance?Key contributors to (↑) and detractors from (↓) performance, relative to the Bloomberg Municipal Bond Index (the Index): ↑ An overweight exposure to and security selection in bonds with maturities of 17 to 22 years contributed to relative performance ↑ An overweight exposure to and security selection in bonds with coupon rates between 4% and 4.99% also helped returns ↑ An overweight exposure to BBB-rated and below bonds contributed to relative returns during the period ↓ An out-of-index allocation in defensive cash-like securities, variable-rate demand notes (VRDNs), detracted from returns during the period ↓ An allocation to taxable municipal bonds also detracted from relative returns during the period ↓ An underweight allocation to the transportation sector, which outperformed the index, detracted from relative performance during the period |
| Performance Past Does Not Indicate Future [Text] |
THE FUND'S PAST PERFORMANCE IS NO GUARANTEE OF FUTURE RESULTS.
|
| Line Graph [Table Text Block] |
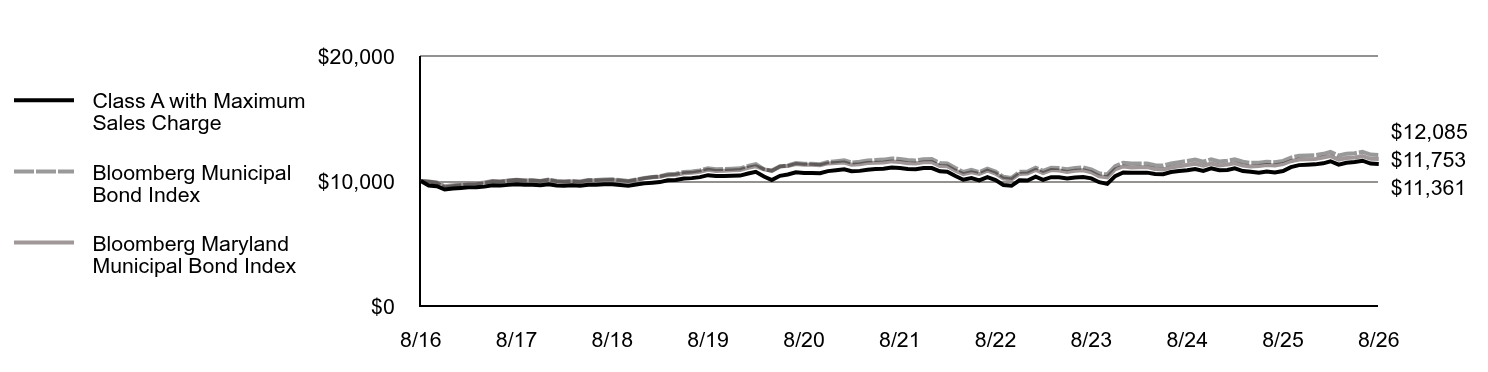
Table Summary
|
Class A with Maximum Sales Charge |
Bloomberg Municipal Bond Index |
Bloomberg Maryland Municipal Bond Index |
8/16 |
$10,000 |
$10,000 |
$10,000 |
9/16 |
$9,645 |
$9,950 |
$9,959 |
10/16 |
$9,584 |
$9,846 |
$9,882 |
11/16 |
$9,321 |
$9,479 |
$9,578 |
12/16 |
$9,398 |
$9,590 |
$9,668 |
1/17 |
$9,443 |
$9,653 |
$9,728 |
2/17 |
$9,490 |
$9,720 |
$9,792 |
3/17 |
$9,504 |
$9,741 |
$9,804 |
4/17 |
$9,550 |
$9,812 |
$9,874 |
5/17 |
$9,663 |
$9,968 |
$9,998 |
6/17 |
$9,635 |
$9,932 |
$9,966 |
7/17 |
$9,690 |
$10,012 |
$10,032 |
8/17 |
$9,745 |
$10,088 |
$10,092 |
9/17 |
$9,702 |
$10,037 |
$10,031 |
10/17 |
$9,702 |
$10,062 |
$10,047 |
11/17 |
$9,660 |
$10,008 |
$9,982 |
12/17 |
$9,738 |
$10,112 |
$10,076 |
1/18 |
$9,640 |
$9,993 |
$9,966 |
2/18 |
$9,617 |
$9,963 |
$9,941 |
3/18 |
$9,651 |
$10,000 |
$9,967 |
4/18 |
$9,618 |
$9,964 |
$9,930 |
5/18 |
$9,708 |
$10,079 |
$10,035 |
6/18 |
$9,709 |
$10,087 |
$10,043 |
7/18 |
$9,742 |
$10,112 |
$10,065 |
8/18 |
$9,743 |
$10,138 |
$10,080 |
9/18 |
$9,687 |
$10,072 |
$10,023 |
10/18 |
$9,630 |
$10,010 |
$9,965 |
11/18 |
$9,721 |
$10,121 |
$10,084 |
12/18 |
$9,810 |
$10,242 |
$10,209 |
1/19 |
$9,866 |
$10,319 |
$10,292 |
2/19 |
$9,912 |
$10,375 |
$10,336 |
3/19 |
$10,060 |
$10,539 |
$10,469 |
4/19 |
$10,083 |
$10,578 |
$10,493 |
5/19 |
$10,197 |
$10,724 |
$10,619 |
6/19 |
$10,230 |
$10,764 |
$10,651 |
7/19 |
$10,308 |
$10,850 |
$10,742 |
8/19 |
$10,467 |
$11,022 |
$10,891 |
9/19 |
$10,397 |
$10,933 |
$10,793 |
10/19 |
$10,393 |
$10,953 |
$10,826 |
11/19 |
$10,412 |
$10,980 |
$10,850 |
12/19 |
$10,431 |
$11,014 |
$10,883 |
1/20 |
$10,601 |
$11,212 |
$11,061 |
2/20 |
$10,737 |
$11,356 |
$11,177 |
3/20 |
$10,361 |
$10,944 |
$10,929 |
4/20 |
$10,078 |
$10,807 |
$10,834 |
5/20 |
$10,414 |
$11,151 |
$11,182 |
6/20 |
$10,518 |
$11,242 |
$11,193 |
7/20 |
$10,690 |
$11,432 |
$11,358 |
8/20 |
$10,639 |
$11,378 |
$11,292 |
9/20 |
$10,646 |
$11,381 |
$11,302 |
10/20 |
$10,617 |
$11,346 |
$11,259 |
11/20 |
$10,790 |
$11,518 |
$11,409 |
12/20 |
$10,867 |
$11,588 |
$11,442 |
1/21 |
$10,943 |
$11,662 |
$11,481 |
2/21 |
$10,782 |
$11,476 |
$11,308 |
3/21 |
$10,810 |
$11,547 |
$11,347 |
4/21 |
$10,896 |
$11,644 |
$11,437 |
5/21 |
$10,958 |
$11,679 |
$11,461 |
6/21 |
$10,984 |
$11,711 |
$11,475 |
7/21 |
$11,082 |
$11,808 |
$11,569 |
8/21 |
$11,048 |
$11,765 |
$11,526 |
9/21 |
$10,954 |
$11,680 |
$11,427 |
10/21 |
$10,932 |
$11,645 |
$11,405 |
11/21 |
$11,031 |
$11,745 |
$11,497 |
12/21 |
$11,032 |
$11,764 |
$11,512 |
1/22 |
$10,780 |
$11,442 |
$11,195 |
2/22 |
$10,735 |
$11,401 |
$11,172 |
3/22 |
$10,398 |
$11,031 |
$10,825 |
4/22 |
$10,099 |
$10,726 |
$10,549 |
5/22 |
$10,237 |
$10,885 |
$10,703 |
6/22 |
$10,048 |
$10,707 |
$10,560 |
7/22 |
$10,309 |
$10,990 |
$10,828 |
8/22 |
$10,069 |
$10,749 |
$10,599 |
9/22 |
$9,683 |
$10,336 |
$10,195 |
10/22 |
$9,616 |
$10,250 |
$10,127 |
11/22 |
$10,052 |
$10,730 |
$10,562 |
12/22 |
$10,035 |
$10,761 |
$10,601 |
1/23 |
$10,338 |
$11,070 |
$10,879 |
2/23 |
$10,088 |
$10,819 |
$10,635 |
3/23 |
$10,307 |
$11,059 |
$10,875 |
4/23 |
$10,292 |
$11,034 |
$10,843 |
5/23 |
$10,202 |
$10,939 |
$10,725 |
6/23 |
$10,287 |
$11,048 |
$10,820 |
7/23 |
$10,323 |
$11,092 |
$10,858 |
8/23 |
$10,213 |
$10,932 |
$10,703 |
9/23 |
$9,903 |
$10,612 |
$10,372 |
10/23 |
$9,766 |
$10,521 |
$10,297 |
11/23 |
$10,386 |
$11,189 |
$10,927 |
12/23 |
$10,678 |
$11,449 |
$11,164 |
1/24 |
$10,667 |
$11,391 |
$11,089 |
2/24 |
$10,668 |
$11,406 |
$11,105 |
3/24 |
$10,669 |
$11,405 |
$11,106 |
4/24 |
$10,556 |
$11,264 |
$10,962 |
5/24 |
$10,545 |
$11,231 |
$10,920 |
6/24 |
$10,714 |
$11,403 |
$11,078 |
7/24 |
$10,793 |
$11,507 |
$11,178 |
8/24 |
$10,860 |
$11,598 |
$11,276 |
9/24 |
$10,965 |
$11,712 |
$11,370 |
10/24 |
$10,812 |
$11,542 |
$11,226 |
11/24 |
$11,009 |
$11,741 |
$11,396 |
12/24 |
$10,855 |
$11,570 |
$11,242 |
1/25 |
$10,883 |
$11,628 |
$11,309 |
2/25 |
$11,014 |
$11,743 |
$11,422 |
3/25 |
$10,793 |
$11,544 |
$11,246 |
4/25 |
$10,743 |
$11,451 |
$11,167 |
5/25 |
$10,666 |
$11,459 |
$11,198 |
6/25 |
$10,762 |
$11,530 |
$11,274 |
7/25 |
$10,686 |
$11,507 |
$11,250 |
8/25 |
$10,796 |
$11,607 |
$11,355 |
9/25 |
$11,106 |
$11,876 |
$11,585 |
10/25 |
$11,270 |
$12,023 |
$11,711 |
11/25 |
$11,300 |
$12,050 |
$11,739 |
12/25 |
$11,331 |
$12,061 |
$11,750 |
1/26 |
$11,415 |
$12,174 |
$11,873 |
2/26 |
$11,580 |
$12,326 |
$11,993 |
3/26 |
$11,312 |
$12,040 |
$11,715 |
4/26 |
$11,452 |
$12,178 |
$11,842 |
5/26 |
$11,523 |
$12,223 |
$11,885 |
6/26 |
$11,622 |
$12,341 |
$11,987 |
7/26 |
$11,392 |
$12,113 |
$11,771 |
8/26 |
$11,361 |
$12,085 |
$11,753 |
|
| Average Annual Return [Table Text Block] |
Table Summary
Fund |
1 Year |
5 Years |
10 Years |
Class A |
5.28% |
0.57% |
1.62% |
Class A with 3.25% Maximum Sales Charge |
1.87% |
(0.10)% |
1.28% |
Bloomberg Municipal Bond Index |
4.12% |
0.54% |
1.91% |
Bloomberg Maryland Municipal Bond Index |
3.51% |
0.39% |
1.63% | |
| No Deduction of Taxes [Text Block] |
Performance does not reflect the deduction of taxes that a shareholder would pay on Fund distributions or redemption of Fund shares.
|
| Updated Performance Information Location [Text Block] |
For more recent performance information, visit www.eatonvance.com/performance.php.
|
| AssetsNet |
$ 88,031,624
|
| Holdings Count | Holding |
109
|
| Advisory Fees Paid, Amount |
$ 298,429
|
| InvestmentCompanyPortfolioTurnover |
71.00%
|
| Additional Fund Statistics [Text Block] |
Table Summary
Total Net Assets |
$88,031,624 |
# of Portfolio Holdings |
109 |
Portfolio Turnover Rate |
71% |
Total Advisory Fees Paid |
$298,429 | |
| Holdings [Text Block] |
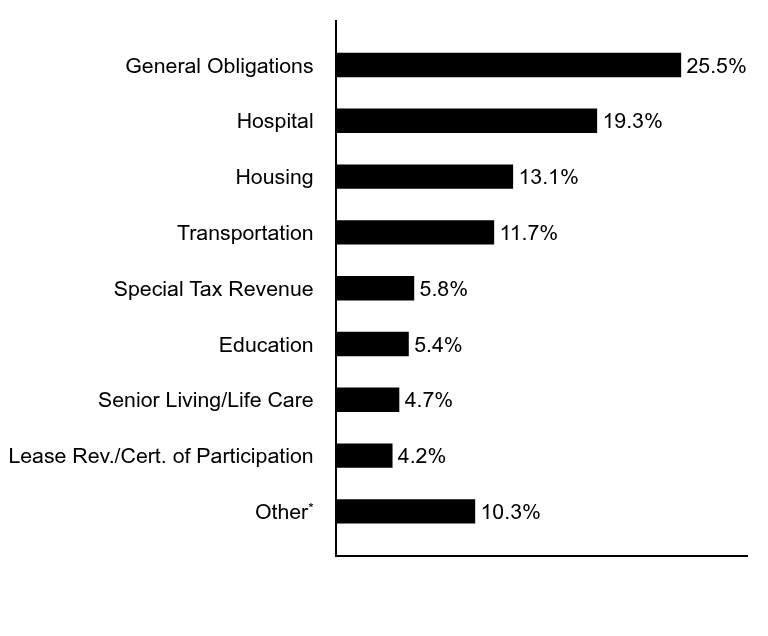
Sector Allocation (% of total investments)
Table Summary
Value |
Value |
OtherFootnote Reference* |
10.3% |
Lease Rev./Cert. of Participation |
4.2% |
Senior Living/Life Care |
4.7% |
Education |
5.4% |
Special Tax Revenue |
5.8% |
Transportation |
11.7% |
Housing |
13.1% |
Hospital |
19.3% |
General Obligations |
25.5% |
| Footnote |
Description |
Footnote* |
Sectors less than 3% each. | |
| Credit Quality Explanation [Text Block] |
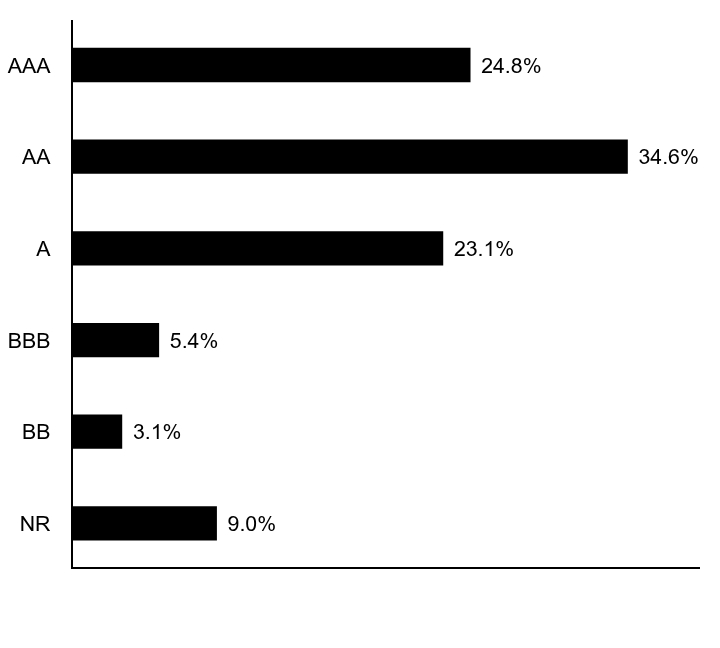
Credit Quality (% of total investments)Footnote Referencea
Table Summary
Value |
Value |
NR |
9.0% |
BB |
3.1% |
BBB |
5.4% |
A |
23.1% |
AA |
34.6% |
AAA |
24.8% |
| Footnote |
Description |
Footnotea |
Ratings are based on Moody’s Investors Service, Inc. (“Moody’s”), S&P Global Ratings (“S&P”) or Fitch Ratings (“Fitch”). If securities are rated differently by the ratings agencies, the highest rating is applied. Moody's ratings are converted to the S&P and Fitch scale with ratings ranging from AAA, being the highest, to D, being the lowest. Ratings of BBB or higher are considered to be investment-grade quality. Holdings designated as “Not Rated” (if any) are not rated by the national ratings agencies stated above. | |
| Material Fund Change [Text Block] |
|
| Updated Prospectus Phone Number |
1-800-262-1122
|
| C000013106 |
|
| Shareholder Report [Line Items] |
|
| Fund Name |
Eaton Vance Maryland Municipal Income Fund
|
| Class Name |
Class C
|
| Trading Symbol |
ECMDX
|
| Annual or Semi-Annual Statement [Text Block] |
This annual shareholder report contains important information about the Eaton Vance Maryland Municipal Income Fund for the period of September 1, 2025 to August 31, 2026.
|
| Additional Information [Text Block] |
You can find additional information about the Fund at www.eatonvance.com/open-end-mutual-fund-documents.php. You can also request this information by contacting us at 1-800-262-1122.
|
| Additional Information Phone Number |
1-800-262-1122
|
| Additional Information Website |
<span style="box-sizing: border-box; color: rgb(0, 0, 0); display: inline; flex-wrap: nowrap; font-size: 10.6667px; font-weight: 400; grid-area: auto; line-height: 16px; margin: 0px; overflow: visible; text-align: left; text-align-last: auto; white-space-collapse: preserve-breaks;">www.eatonvance.com/open-end-mutual-fund-documents.php</span>
|
| Expenses [Text Block] |
What were the Fund costs for the last year?(based on a hypothetical $10,000 investment)
Table Summary
Class Name |
Costs of a $10,000 investment |
Costs paid as a percentage of a $10,000 investment |
Class C |
$156 |
1.53% | |
| Expenses Paid, Amount |
$ 156
|
| Expense Ratio, Percent |
1.53%
|
| Factors Affecting Performance [Text Block] |
How did the Fund perform last year and what affected its performance?Key contributors to (↑) and detractors from (↓) performance, relative to the Bloomberg Municipal Bond Index (the Index): ↑ An overweight exposure to and security selection in bonds with maturities of 17 to 22 years contributed to relative performance ↑ An overweight exposure to and security selection in bonds with coupon rates between 4% and 4.99% also helped returns ↑ An overweight exposure to BBB-rated and below bonds contributed to relative returns during the period ↓ An out-of-index allocation in defensive cash-like securities, variable-rate demand notes (VRDNs), detracted from returns during the period ↓ An allocation to taxable municipal bonds also detracted from relative returns during the period ↓ An underweight allocation to the transportation sector, which outperformed the index, detracted from relative performance during the period |
| Performance Past Does Not Indicate Future [Text] |
THE FUND'S PAST PERFORMANCE IS NO GUARANTEE OF FUTURE RESULTS.
|
| Line Graph [Table Text Block] |
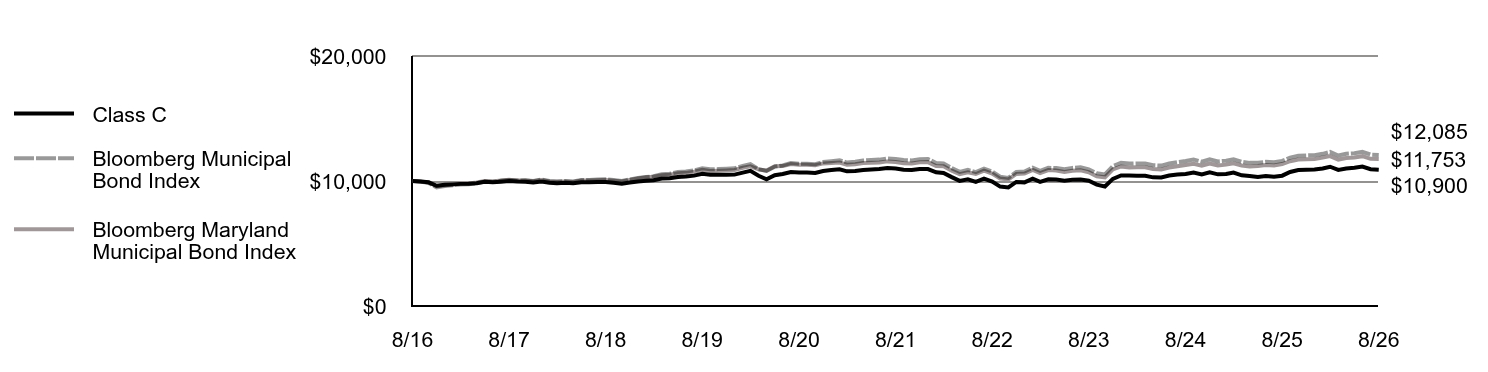
Table Summary
|
Class C |
Bloomberg Municipal Bond Index |
Bloomberg Maryland Municipal Bond Index |
8/16 |
$10,000 |
$10,000 |
$10,000 |
9/16 |
$9,958 |
$9,950 |
$9,959 |
10/16 |
$9,895 |
$9,846 |
$9,882 |
11/16 |
$9,622 |
$9,479 |
$9,578 |
12/16 |
$9,691 |
$9,590 |
$9,668 |
1/17 |
$9,730 |
$9,653 |
$9,728 |
2/17 |
$9,770 |
$9,720 |
$9,792 |
3/17 |
$9,779 |
$9,741 |
$9,804 |
4/17 |
$9,820 |
$9,812 |
$9,874 |
5/17 |
$9,932 |
$9,968 |
$9,998 |
6/17 |
$9,891 |
$9,932 |
$9,966 |
7/17 |
$9,949 |
$10,012 |
$10,032 |
8/17 |
$9,996 |
$10,088 |
$10,092 |
9/17 |
$9,952 |
$10,037 |
$10,031 |
10/17 |
$9,937 |
$10,062 |
$10,047 |
11/17 |
$9,883 |
$10,008 |
$9,982 |
12/17 |
$9,962 |
$10,112 |
$10,076 |
1/18 |
$9,866 |
$9,993 |
$9,966 |
2/18 |
$9,820 |
$9,963 |
$9,941 |
3/18 |
$9,857 |
$10,000 |
$9,967 |
4/18 |
$9,812 |
$9,964 |
$9,930 |
5/18 |
$9,902 |
$10,079 |
$10,035 |
6/18 |
$9,900 |
$10,087 |
$10,043 |
7/18 |
$9,926 |
$10,112 |
$10,065 |
8/18 |
$9,923 |
$10,138 |
$10,080 |
9/18 |
$9,856 |
$10,072 |
$10,023 |
10/18 |
$9,788 |
$10,010 |
$9,965 |
11/18 |
$9,878 |
$10,121 |
$10,084 |
12/18 |
$9,968 |
$10,242 |
$10,209 |
1/19 |
$10,016 |
$10,319 |
$10,292 |
2/19 |
$10,054 |
$10,375 |
$10,336 |
3/19 |
$10,198 |
$10,539 |
$10,469 |
4/19 |
$10,215 |
$10,578 |
$10,493 |
5/19 |
$10,326 |
$10,724 |
$10,619 |
6/19 |
$10,353 |
$10,764 |
$10,651 |
7/19 |
$10,431 |
$10,850 |
$10,742 |
8/19 |
$10,573 |
$11,022 |
$10,891 |
9/19 |
$10,504 |
$10,933 |
$10,793 |
10/19 |
$10,495 |
$10,953 |
$10,826 |
11/19 |
$10,497 |
$10,980 |
$10,850 |
12/19 |
$10,510 |
$11,014 |
$10,883 |
1/20 |
$10,672 |
$11,212 |
$11,061 |
2/20 |
$10,815 |
$11,356 |
$11,177 |
3/20 |
$10,420 |
$10,944 |
$10,929 |
4/20 |
$10,132 |
$10,807 |
$10,834 |
5/20 |
$10,459 |
$11,151 |
$11,182 |
6/20 |
$10,561 |
$11,242 |
$11,193 |
7/20 |
$10,725 |
$11,432 |
$11,358 |
8/20 |
$10,673 |
$11,378 |
$11,292 |
9/20 |
$10,675 |
$11,381 |
$11,302 |
10/20 |
$10,643 |
$11,346 |
$11,259 |
11/20 |
$10,796 |
$11,518 |
$11,409 |
12/20 |
$10,872 |
$11,588 |
$11,442 |
1/21 |
$10,937 |
$11,662 |
$11,481 |
2/21 |
$10,773 |
$11,476 |
$11,308 |
3/21 |
$10,793 |
$11,547 |
$11,347 |
4/21 |
$10,878 |
$11,644 |
$11,437 |
5/21 |
$10,928 |
$11,679 |
$11,461 |
6/21 |
$10,958 |
$11,711 |
$11,475 |
7/21 |
$11,041 |
$11,808 |
$11,569 |
8/21 |
$10,993 |
$11,765 |
$11,526 |
9/21 |
$10,902 |
$11,680 |
$11,427 |
10/21 |
$10,876 |
$11,645 |
$11,405 |
11/21 |
$10,961 |
$11,745 |
$11,497 |
12/21 |
$10,956 |
$11,764 |
$11,512 |
1/22 |
$10,699 |
$11,442 |
$11,195 |
2/22 |
$10,643 |
$11,401 |
$11,172 |
3/22 |
$10,308 |
$11,031 |
$10,825 |
4/22 |
$10,009 |
$10,726 |
$10,549 |
5/22 |
$10,130 |
$10,885 |
$10,703 |
6/22 |
$9,932 |
$10,707 |
$10,560 |
7/22 |
$10,196 |
$10,990 |
$10,828 |
8/22 |
$9,952 |
$10,749 |
$10,599 |
9/22 |
$9,554 |
$10,336 |
$10,195 |
10/22 |
$9,488 |
$10,250 |
$10,127 |
11/22 |
$9,923 |
$10,730 |
$10,562 |
12/22 |
$9,891 |
$10,761 |
$10,601 |
1/23 |
$10,183 |
$11,070 |
$10,879 |
2/23 |
$9,931 |
$10,819 |
$10,635 |
3/23 |
$10,134 |
$11,059 |
$10,875 |
4/23 |
$10,116 |
$11,034 |
$10,843 |
5/23 |
$10,031 |
$10,939 |
$10,725 |
6/23 |
$10,104 |
$11,048 |
$10,820 |
7/23 |
$10,119 |
$11,092 |
$10,858 |
8/23 |
$10,016 |
$10,932 |
$10,703 |
9/23 |
$9,712 |
$10,612 |
$10,372 |
10/23 |
$9,562 |
$10,521 |
$10,297 |
11/23 |
$10,171 |
$11,189 |
$10,927 |
12/23 |
$10,441 |
$11,449 |
$11,164 |
1/24 |
$10,437 |
$11,391 |
$11,089 |
2/24 |
$10,423 |
$11,406 |
$11,105 |
3/24 |
$10,420 |
$11,405 |
$11,106 |
4/24 |
$10,291 |
$11,264 |
$10,962 |
5/24 |
$10,277 |
$11,231 |
$10,920 |
6/24 |
$10,435 |
$11,403 |
$11,078 |
7/24 |
$10,513 |
$11,507 |
$11,178 |
8/24 |
$10,568 |
$11,598 |
$11,276 |
9/24 |
$10,670 |
$11,712 |
$11,370 |
10/24 |
$10,517 |
$11,542 |
$11,226 |
11/24 |
$10,688 |
$11,741 |
$11,396 |
12/24 |
$10,534 |
$11,570 |
$11,242 |
1/25 |
$10,555 |
$11,628 |
$11,309 |
2/25 |
$10,679 |
$11,743 |
$11,422 |
3/25 |
$10,455 |
$11,544 |
$11,246 |
4/25 |
$10,407 |
$11,451 |
$11,167 |
5/25 |
$10,323 |
$11,459 |
$11,198 |
6/25 |
$10,404 |
$11,530 |
$11,274 |
7/25 |
$10,332 |
$11,507 |
$11,250 |
8/25 |
$10,425 |
$11,607 |
$11,355 |
9/25 |
$10,720 |
$11,876 |
$11,585 |
10/25 |
$10,872 |
$12,023 |
$11,711 |
11/25 |
$10,894 |
$12,050 |
$11,739 |
12/25 |
$10,917 |
$12,061 |
$11,750 |
1/26 |
$10,999 |
$12,174 |
$11,873 |
2/26 |
$11,141 |
$12,326 |
$11,993 |
3/26 |
$10,887 |
$12,040 |
$11,715 |
4/26 |
$11,006 |
$12,178 |
$11,842 |
5/26 |
$11,065 |
$12,223 |
$11,885 |
6/26 |
$11,160 |
$12,341 |
$11,987 |
7/26 |
$10,940 |
$12,113 |
$11,771 |
8/26 |
$10,900 |
$12,085 |
$11,753 |
|
| Average Annual Return [Table Text Block] |
Table Summary
Fund |
1 Year |
5 Years |
10 Years |
Class C, with conversion to Class A after 8 years |
4.56% |
(0.17)% |
0.87% |
Class C, with 1% Maximum Contingent Deferred Sales Charge and conversion to Class A after 8 years |
3.56% |
(0.17)% |
0.87% |
Bloomberg Municipal Bond Index |
4.12% |
0.54% |
1.91% |
Bloomberg Maryland Municipal Bond Index |
3.51% |
0.39% |
1.63% | |
| No Deduction of Taxes [Text Block] |
Performance does not reflect the deduction of taxes that a shareholder would pay on Fund distributions or redemption of Fund shares.
|
| Updated Performance Information Location [Text Block] |
For more recent performance information, visit www.eatonvance.com/performance.php.
|
| AssetsNet |
$ 88,031,624
|
| Holdings Count | Holding |
109
|
| Advisory Fees Paid, Amount |
$ 298,429
|
| InvestmentCompanyPortfolioTurnover |
71.00%
|
| Additional Fund Statistics [Text Block] |
Table Summary
Total Net Assets |
$88,031,624 |
# of Portfolio Holdings |
109 |
Portfolio Turnover Rate |
71% |
Total Advisory Fees Paid |
$298,429 | |
| Holdings [Text Block] |
Sector Allocation (% of total investments)
Table Summary
Value |
Value |
OtherFootnote Reference* |
10.3% |
Lease Rev./Cert. of Participation |
4.2% |
Senior Living/Life Care |
4.7% |
Education |
5.4% |
Special Tax Revenue |
5.8% |
Transportation |
11.7% |
Housing |
13.1% |
Hospital |
19.3% |
General Obligations |
25.5% |
| Footnote |
Description |
Footnote* |
Sectors less than 3% each. | |
| Credit Quality Explanation [Text Block] |
Credit Quality (% of total investments)Footnote Referencea
Table Summary
Value |
Value |
NR |
9.0% |
BB |
3.1% |
BBB |
5.4% |
A |
23.1% |
AA |
34.6% |
AAA |
24.8% |
| Footnote |
Description |
Footnotea |
Ratings are based on Moody’s Investors Service, Inc. (“Moody’s”), S&P Global Ratings (“S&P”) or Fitch Ratings (“Fitch”). If securities are rated differently by the ratings agencies, the highest rating is applied. Moody's ratings are converted to the S&P and Fitch scale with ratings ranging from AAA, being the highest, to D, being the lowest. Ratings of BBB or higher are considered to be investment-grade quality. Holdings designated as “Not Rated” (if any) are not rated by the national ratings agencies stated above. | |
| Material Fund Change [Text Block] |
|
| Updated Prospectus Phone Number |
1-800-262-1122
|
| C000063947 |
|
| Shareholder Report [Line Items] |
|
| Fund Name |
Eaton Vance Maryland Municipal Income Fund
|
| Class Name |
Class I
|
| Trading Symbol |
EIMDX
|
| Annual or Semi-Annual Statement [Text Block] |
This annual shareholder report contains important information about the Eaton Vance Maryland Municipal Income Fund for the period of September 1, 2025 to August 31, 2026.
|
| Additional Information [Text Block] |
You can find additional information about the Fund at www.eatonvance.com/open-end-mutual-fund-documents.php. You can also request this information by contacting us at 1-800-262-1122.
|
| Additional Information Phone Number |
1-800-262-1122
|
| Additional Information Website |
<span style="box-sizing: border-box; color: rgb(0, 0, 0); display: inline; flex-wrap: nowrap; font-size: 10.6667px; font-weight: 400; grid-area: auto; line-height: 16px; margin: 0px; overflow: visible; text-align: left; text-align-last: auto; white-space-collapse: preserve-breaks;">www.eatonvance.com/open-end-mutual-fund-documents.php</span>
|
| Expenses [Text Block] |
What were the Fund costs for the last year?(based on a hypothetical $10,000 investment)
Table Summary
Class Name |
Costs of a $10,000 investment |
Costs paid as a percentage of a $10,000 investment |
Class I |
$60 |
0.58% | |
| Expenses Paid, Amount |
$ 60
|
| Expense Ratio, Percent |
0.58%
|
| Factors Affecting Performance [Text Block] |
How did the Fund perform last year and what affected its performance?Key contributors to (↑) and detractors from (↓) performance, relative to the Bloomberg Municipal Bond Index (the Index): ↑ An overweight exposure to and security selection in bonds with maturities of 17 to 22 years contributed to relative performance ↑ An overweight exposure to and security selection in bonds with coupon rates between 4% and 4.99% also helped returns ↑ An overweight exposure to BBB-rated and below bonds contributed to relative returns during the period ↓ An out-of-index allocation in defensive cash-like securities, variable-rate demand notes (VRDNs), detracted from returns during the period ↓ An allocation to taxable municipal bonds also detracted from relative returns during the period ↓ An underweight allocation to the transportation sector, which outperformed the index, detracted from relative performance during the period |
| Performance Past Does Not Indicate Future [Text] |
THE FUND'S PAST PERFORMANCE IS NO GUARANTEE OF FUTURE RESULTS.
|
| Line Graph [Table Text Block] |
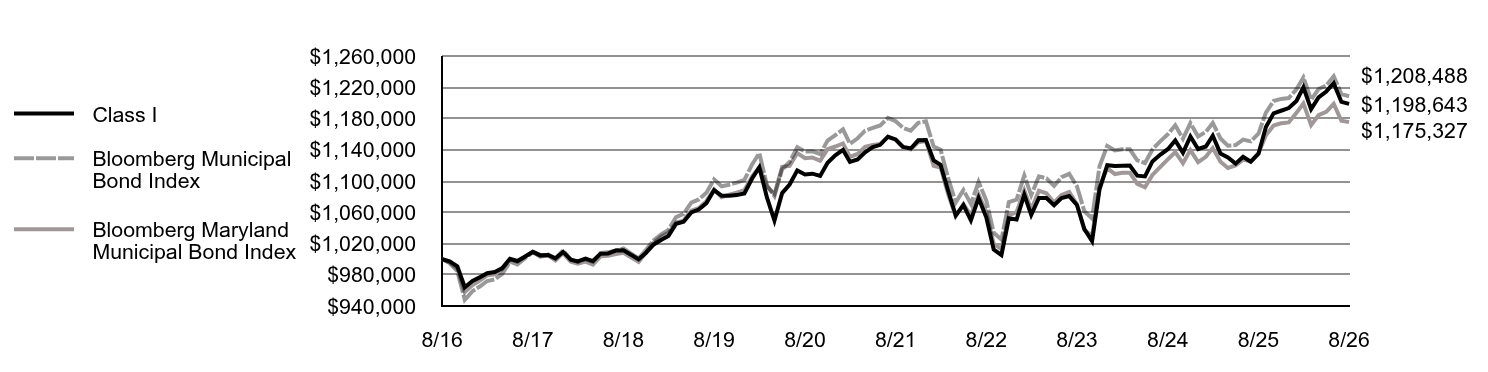
Table Summary
|
Class I |
Bloomberg Municipal Bond Index |
Bloomberg Maryland Municipal Bond Index |
8/16 |
$1,000,000 |
$1,000,000 |
$1,000,000 |
9/16 |
$997,104 |
$995,009 |
$995,875 |
10/16 |
$990,924 |
$984,570 |
$988,162 |
11/16 |
$963,964 |
$947,850 |
$957,836 |
12/16 |
$972,108 |
$958,978 |
$966,795 |
1/17 |
$976,978 |
$965,300 |
$972,802 |
2/17 |
$981,913 |
$972,003 |
$979,227 |
3/17 |
$983,544 |
$974,113 |
$980,412 |
4/17 |
$988,540 |
$981,182 |
$987,424 |
5/17 |
$1,000,366 |
$996,754 |
$999,824 |
6/17 |
$997,591 |
$993,179 |
$996,606 |
7/17 |
$1,003,446 |
$1,001,214 |
$1,003,214 |
8/17 |
$1,009,293 |
$1,008,833 |
$1,009,223 |
9/17 |
$1,005,035 |
$1,003,704 |
$1,003,062 |
10/17 |
$1,005,244 |
$1,006,154 |
$1,004,720 |
11/17 |
$1,001,011 |
$1,000,767 |
$998,234 |
12/17 |
$1,009,284 |
$1,011,227 |
$1,007,623 |
1/18 |
$999,290 |
$999,322 |
$996,592 |
2/18 |
$997,115 |
$996,336 |
$994,130 |
3/18 |
$1,000,752 |
$1,000,013 |
$996,749 |
4/18 |
$997,544 |
$996,445 |
$992,956 |
5/18 |
$1,006,985 |
$1,007,855 |
$1,003,527 |
6/18 |
$1,007,327 |
$1,008,715 |
$1,004,282 |
7/18 |
$1,010,935 |
$1,011,163 |
$1,006,496 |
8/18 |
$1,011,193 |
$1,013,760 |
$1,007,985 |
9/18 |
$1,005,564 |
$1,007,197 |
$1,002,258 |
10/18 |
$999,844 |
$1,000,994 |
$996,454 |
11/18 |
$1,008,204 |
$1,012,073 |
$1,008,426 |
12/18 |
$1,018,818 |
$1,024,191 |
$1,020,941 |
1/19 |
$1,024,834 |
$1,031,933 |
$1,029,159 |
2/19 |
$1,029,731 |
$1,037,459 |
$1,033,635 |
3/19 |
$1,045,265 |
$1,053,858 |
$1,046,858 |
4/19 |
$1,047,815 |
$1,057,819 |
$1,049,318 |
5/19 |
$1,059,763 |
$1,072,403 |
$1,061,934 |
6/19 |
$1,063,407 |
$1,076,362 |
$1,065,095 |
7/19 |
$1,071,661 |
$1,085,037 |
$1,074,223 |
8/19 |
$1,088,348 |
$1,102,152 |
$1,089,077 |
9/19 |
$1,081,237 |
$1,093,317 |
$1,079,319 |
10/19 |
$1,081,048 |
$1,095,276 |
$1,082,649 |
11/19 |
$1,081,973 |
$1,098,016 |
$1,084,986 |
12/19 |
$1,084,141 |
$1,101,368 |
$1,088,284 |
1/20 |
$1,103,192 |
$1,121,156 |
$1,106,080 |
2/20 |
$1,117,501 |
$1,135,614 |
$1,117,659 |
3/20 |
$1,078,619 |
$1,094,422 |
$1,092,867 |
4/20 |
$1,049,375 |
$1,080,687 |
$1,083,427 |
5/20 |
$1,084,545 |
$1,115,065 |
$1,118,179 |
6/20 |
$1,095,472 |
$1,124,242 |
$1,119,334 |
7/20 |
$1,113,588 |
$1,143,177 |
$1,135,798 |
8/20 |
$1,108,450 |
$1,137,813 |
$1,129,183 |
9/20 |
$1,109,400 |
$1,138,054 |
$1,130,175 |
10/20 |
$1,106,562 |
$1,134,636 |
$1,125,932 |
11/20 |
$1,123,443 |
$1,151,758 |
$1,140,850 |
12/20 |
$1,132,882 |
$1,158,774 |
$1,144,158 |
1/21 |
$1,139,816 |
$1,166,159 |
$1,148,081 |
2/21 |
$1,124,467 |
$1,147,630 |
$1,130,751 |
3/21 |
$1,127,530 |
$1,154,708 |
$1,134,662 |
4/21 |
$1,136,725 |
$1,164,393 |
$1,143,734 |
5/21 |
$1,143,348 |
$1,167,867 |
$1,146,141 |
6/21 |
$1,146,273 |
$1,171,074 |
$1,147,456 |
7/21 |
$1,156,645 |
$1,180,786 |
$1,156,936 |
8/21 |
$1,153,282 |
$1,176,453 |
$1,152,569 |
9/21 |
$1,143,705 |
$1,167,963 |
$1,142,701 |
10/21 |
$1,141,607 |
$1,164,548 |
$1,140,531 |
11/21 |
$1,152,095 |
$1,174,461 |
$1,149,688 |
12/21 |
$1,152,448 |
$1,176,356 |
$1,151,217 |
1/22 |
$1,126,373 |
$1,144,156 |
$1,119,511 |
2/22 |
$1,120,628 |
$1,140,057 |
$1,117,186 |
3/22 |
$1,086,935 |
$1,103,100 |
$1,082,543 |
4/22 |
$1,055,866 |
$1,072,589 |
$1,054,897 |
5/22 |
$1,069,182 |
$1,088,522 |
$1,070,263 |
6/22 |
$1,049,684 |
$1,070,693 |
$1,056,042 |
7/22 |
$1,078,317 |
$1,098,983 |
$1,082,839 |
8/22 |
$1,053,461 |
$1,074,897 |
$1,059,925 |
9/22 |
$1,012,126 |
$1,033,642 |
$1,019,492 |
10/22 |
$1,005,264 |
$1,025,046 |
$1,012,683 |
11/22 |
$1,052,312 |
$1,072,991 |
$1,056,193 |
12/22 |
$1,050,649 |
$1,076,063 |
$1,060,059 |
1/23 |
$1,082,535 |
$1,106,973 |
$1,087,896 |
2/23 |
$1,056,557 |
$1,081,942 |
$1,063,504 |
3/23 |
$1,078,307 |
$1,105,948 |
$1,087,499 |
4/23 |
$1,078,192 |
$1,103,421 |
$1,084,281 |
5/23 |
$1,068,977 |
$1,093,859 |
$1,072,515 |
6/23 |
$1,078,123 |
$1,104,817 |
$1,082,014 |
7/23 |
$1,080,694 |
$1,109,187 |
$1,085,828 |
8/23 |
$1,069,385 |
$1,093,219 |
$1,070,283 |
9/23 |
$1,038,479 |
$1,061,178 |
$1,037,244 |
10/23 |
$1,023,044 |
$1,052,148 |
$1,029,673 |
11/23 |
$1,089,373 |
$1,118,940 |
$1,092,726 |
12/23 |
$1,120,151 |
$1,144,946 |
$1,116,409 |
1/24 |
$1,119,131 |
$1,139,098 |
$1,108,863 |
2/24 |
$1,119,460 |
$1,140,561 |
$1,110,469 |
3/24 |
$1,119,797 |
$1,140,525 |
$1,110,561 |
4/24 |
$1,106,799 |
$1,126,400 |
$1,096,242 |
5/24 |
$1,105,827 |
$1,123,096 |
$1,092,030 |
6/24 |
$1,125,068 |
$1,140,311 |
$1,107,815 |
7/24 |
$1,133,544 |
$1,150,704 |
$1,117,790 |
8/24 |
$1,140,730 |
$1,159,779 |
$1,127,605 |
9/24 |
$1,152,007 |
$1,171,242 |
$1,136,958 |
10/24 |
$1,136,092 |
$1,154,164 |
$1,122,621 |
11/24 |
$1,156,954 |
$1,174,101 |
$1,139,588 |
12/24 |
$1,140,971 |
$1,157,008 |
$1,124,190 |
1/25 |
$1,144,145 |
$1,162,807 |
$1,130,936 |
2/25 |
$1,158,058 |
$1,174,336 |
$1,142,236 |
3/25 |
$1,135,070 |
$1,154,434 |
$1,124,559 |
4/25 |
$1,130,043 |
$1,145,133 |
$1,116,710 |
5/25 |
$1,122,202 |
$1,145,869 |
$1,119,811 |
6/25 |
$1,131,064 |
$1,153,002 |
$1,127,364 |
7/25 |
$1,124,628 |
$1,150,674 |
$1,124,982 |
8/25 |
$1,134,976 |
$1,160,675 |
$1,135,477 |
9/25 |
$1,169,180 |
$1,187,554 |
$1,158,527 |
10/25 |
$1,186,574 |
$1,202,283 |
$1,171,073 |
11/25 |
$1,189,932 |
$1,205,041 |
$1,173,881 |
12/25 |
$1,193,361 |
$1,206,125 |
$1,174,982 |
1/26 |
$1,202,412 |
$1,217,445 |
$1,187,269 |
2/26 |
$1,220,011 |
$1,232,618 |
$1,199,273 |
3/26 |
$1,191,997 |
$1,203,989 |
$1,171,451 |
4/26 |
$1,206,902 |
$1,217,775 |
$1,184,177 |
5/26 |
$1,214,617 |
$1,222,322 |
$1,188,496 |
6/26 |
$1,225,245 |
$1,234,103 |
$1,198,704 |
7/26 |
$1,201,259 |
$1,211,258 |
$1,177,091 |
8/26 |
$1,198,643 |
$1,208,488 |
$1,175,327 |
|
| Average Annual Return [Table Text Block] |
Table Summary
Fund |
1 Year |
5 Years |
10 Years |
Class I |
5.61% |
0.77% |
1.83% |
Bloomberg Municipal Bond Index |
4.12% |
0.54% |
1.91% |
Bloomberg Maryland Municipal Bond Index |
3.51% |
0.39% |
1.63% | |
| No Deduction of Taxes [Text Block] |
Performance does not reflect the deduction of taxes that a shareholder would pay on Fund distributions or redemption of Fund shares.
|
| Updated Performance Information Location [Text Block] |
For more recent performance information, visit www.eatonvance.com/performance.php.
|
| AssetsNet |
$ 88,031,624
|
| Holdings Count | Holding |
109
|
| Advisory Fees Paid, Amount |
$ 298,429
|
| InvestmentCompanyPortfolioTurnover |
71.00%
|
| Additional Fund Statistics [Text Block] |
Table Summary
Total Net Assets |
$88,031,624 |
# of Portfolio Holdings |
109 |
Portfolio Turnover Rate |
71% |
Total Advisory Fees Paid |
$298,429 | |
| Holdings [Text Block] |
Sector Allocation (% of total investments)
Table Summary
Value |
Value |
OtherFootnote Reference* |
10.3% |
Lease Rev./Cert. of Participation |
4.2% |
Senior Living/Life Care |
4.7% |
Education |
5.4% |
Special Tax Revenue |
5.8% |
Transportation |
11.7% |
Housing |
13.1% |
Hospital |
19.3% |
General Obligations |
25.5% |
| Footnote |
Description |
Footnote* |
Sectors less than 3% each. | |
| Credit Quality Explanation [Text Block] |
Credit Quality (% of total investments)Footnote Referencea
Table Summary
Value |
Value |
NR |
9.0% |
BB |
3.1% |
BBB |
5.4% |
A |
23.1% |
AA |
34.6% |
AAA |
24.8% |
| Footnote |
Description |
Footnotea |
Ratings are based on Moody’s Investors Service, Inc. (“Moody’s”), S&P Global Ratings (“S&P”) or Fitch Ratings (“Fitch”). If securities are rated differently by the ratings agencies, the highest rating is applied. Moody's ratings are converted to the S&P and Fitch scale with ratings ranging from AAA, being the highest, to D, being the lowest. Ratings of BBB or higher are considered to be investment-grade quality. Holdings designated as “Not Rated” (if any) are not rated by the national ratings agencies stated above. | |
| Material Fund Change [Text Block] |
|
| Updated Prospectus Phone Number |
1-800-262-1122
|
| C000013120 |
|
| Shareholder Report [Line Items] |
|
| Fund Name |
Eaton Vance Missouri Municipal Income Fund
|
| Class Name |
Class A
|
| Trading Symbol |
ETMOX
|
| Annual or Semi-Annual Statement [Text Block] |
This annual shareholder report contains important information about the Eaton Vance Missouri Municipal Income Fund for the period of September 1, 2025 to August 31, 2026.
|
| Additional Information [Text Block] |
You can find additional information about the Fund at www.eatonvance.com/open-end-mutual-fund-documents.php. You can also request this information by contacting us at 1-800-262-1122.
|
| Additional Information Phone Number |
1-800-262-1122
|
| Additional Information Website |
<span style="box-sizing: border-box; color: rgb(0, 0, 0); display: inline; flex-wrap: nowrap; font-size: 10.6667px; font-weight: 400; grid-area: auto; line-height: 16px; margin: 0px; overflow: visible; text-align: left; text-align-last: auto; white-space-collapse: preserve-breaks;">www.eatonvance.com/open-end-mutual-fund-documents.php</span>
|
| Expenses [Text Block] |
What were the Fund costs for the last year?(based on a hypothetical $10,000 investment)
Table Summary
Class Name |
Costs of a $10,000 investment |
Costs paid as a percentage of a $10,000 investment |
Class A |
$76 |
0.74% | |
| Expenses Paid, Amount |
$ 76
|
| Expense Ratio, Percent |
0.74%
|
| Factors Affecting Performance [Text Block] |
How did the Fund perform last year and what affected its performance?Key contributors to (↑) and detractors from (↓) performance, relative to the Bloomberg Municipal Bond Index (the Index): ↑ An overweight exposure to and security selection in bonds with coupon rates between 4% and 4.99% helped returns ↑ An overweight exposure to and security selections in the hospital sector, which outperformed the index, contributed to returns during the period ↑ Security selections in bonds with 22+ years to maturity also helped relative performance ↓ An out-of-index allocation to variable-rate demand notes (VRDNs)—typically considered a defensive investment—detracted from returns during the period ↓ Security selections in bonds with maturities of 8 to 12 years detracted from performance ↓ Security selections in the leasing sector also detracted from fund performance during the period |
| Performance Past Does Not Indicate Future [Text] |
THE FUND'S PAST PERFORMANCE IS NO GUARANTEE OF FUTURE RESULTS.
|
| Line Graph [Table Text Block] |
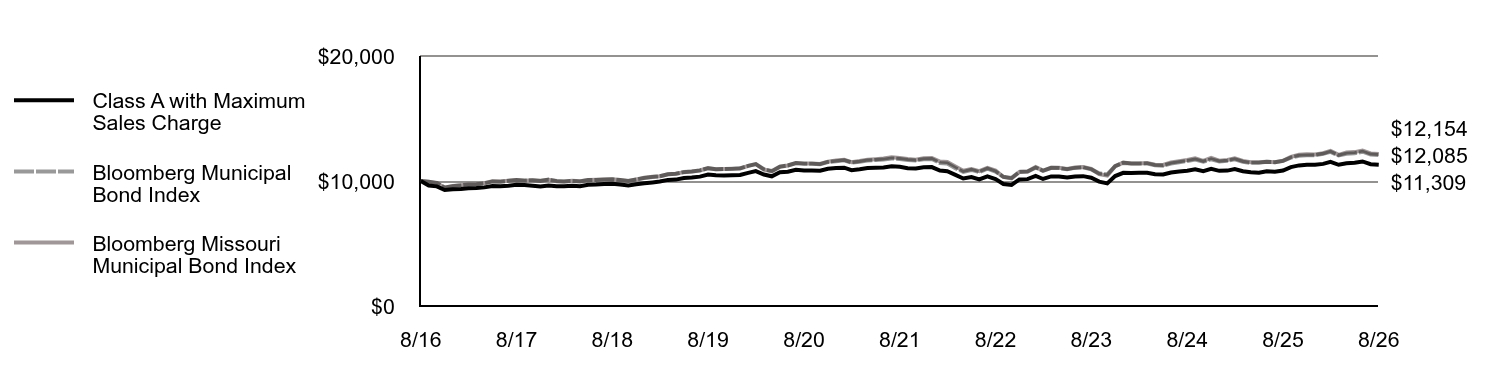
Table Summary
|
Class A with Maximum Sales Charge |
Bloomberg Municipal Bond Index |
Bloomberg Missouri Municipal Bond Index |
8/16 |
$10,000 |
$10,000 |
$10,000 |
9/16 |
$9,643 |
$9,950 |
$9,944 |
10/16 |
$9,571 |
$9,846 |
$9,836 |
11/16 |
$9,282 |
$9,479 |
$9,460 |
12/16 |
$9,348 |
$9,590 |
$9,593 |
1/17 |
$9,366 |
$9,653 |
$9,655 |
2/17 |
$9,414 |
$9,720 |
$9,729 |
3/17 |
$9,431 |
$9,741 |
$9,751 |
4/17 |
$9,489 |
$9,812 |
$9,822 |
5/17 |
$9,607 |
$9,968 |
$9,972 |
6/17 |
$9,575 |
$9,932 |
$9,955 |
7/17 |
$9,623 |
$10,012 |
$10,025 |
8/17 |
$9,692 |
$10,088 |
$10,089 |
9/17 |
$9,679 |
$10,037 |
$10,028 |
10/17 |
$9,625 |
$10,062 |
$10,069 |
11/17 |
$9,570 |
$10,008 |
$10,013 |
12/17 |
$9,639 |
$10,112 |
$10,107 |
1/18 |
$9,573 |
$9,993 |
$9,989 |
2/18 |
$9,578 |
$9,963 |
$9,966 |
3/18 |
$9,615 |
$10,000 |
$10,010 |
4/18 |
$9,589 |
$9,964 |
$9,977 |
5/18 |
$9,699 |
$10,079 |
$10,082 |
6/18 |
$9,715 |
$10,087 |
$10,092 |
7/18 |
$9,751 |
$10,112 |
$10,112 |
8/18 |
$9,777 |
$10,138 |
$10,137 |
9/18 |
$9,718 |
$10,072 |
$10,071 |
10/18 |
$9,650 |
$10,010 |
$10,006 |
11/18 |
$9,739 |
$10,121 |
$10,127 |
12/18 |
$9,818 |
$10,242 |
$10,253 |
1/19 |
$9,886 |
$10,319 |
$10,334 |
2/19 |
$9,955 |
$10,375 |
$10,382 |
3/19 |
$10,087 |
$10,539 |
$10,540 |
4/19 |
$10,112 |
$10,578 |
$10,581 |
5/19 |
$10,244 |
$10,724 |
$10,709 |
6/19 |
$10,280 |
$10,764 |
$10,755 |
7/19 |
$10,349 |
$10,850 |
$10,842 |
8/19 |
$10,517 |
$11,022 |
$11,027 |
9/19 |
$10,454 |
$10,933 |
$10,939 |
10/19 |
$10,445 |
$10,953 |
$10,951 |
11/19 |
$10,459 |
$10,980 |
$10,970 |
12/19 |
$10,484 |
$11,014 |
$11,007 |
1/20 |
$10,652 |
$11,212 |
$11,206 |
2/20 |
$10,787 |
$11,356 |
$11,357 |
3/20 |
$10,515 |
$10,944 |
$10,917 |
4/20 |
$10,374 |
$10,807 |
$10,762 |
5/20 |
$10,699 |
$11,151 |
$11,144 |
6/20 |
$10,746 |
$11,242 |
$11,245 |
7/20 |
$10,892 |
$11,432 |
$11,439 |
8/20 |
$10,837 |
$11,378 |
$11,393 |
9/20 |
$10,844 |
$11,381 |
$11,395 |
10/20 |
$10,817 |
$11,346 |
$11,360 |
11/20 |
$10,982 |
$11,518 |
$11,544 |
12/20 |
$11,034 |
$11,588 |
$11,637 |
1/21 |
$11,063 |
$11,662 |
$11,699 |
2/21 |
$10,868 |
$11,476 |
$11,509 |
3/21 |
$10,942 |
$11,547 |
$11,600 |
4/21 |
$11,039 |
$11,644 |
$11,709 |
5/21 |
$11,056 |
$11,679 |
$11,749 |
6/21 |
$11,074 |
$11,711 |
$11,797 |
7/21 |
$11,170 |
$11,808 |
$11,898 |
8/21 |
$11,132 |
$11,765 |
$11,842 |
9/21 |
$11,024 |
$11,680 |
$11,760 |
10/21 |
$11,008 |
$11,645 |
$11,709 |
11/21 |
$11,095 |
$11,745 |
$11,824 |
12/21 |
$11,113 |
$11,764 |
$11,842 |
1/22 |
$10,832 |
$11,442 |
$11,551 |
2/22 |
$10,783 |
$11,401 |
$11,513 |
3/22 |
$10,490 |
$11,031 |
$11,154 |
4/22 |
$10,198 |
$10,726 |
$10,819 |
5/22 |
$10,321 |
$10,885 |
$10,965 |
6/22 |
$10,122 |
$10,707 |
$10,790 |
7/22 |
$10,375 |
$10,990 |
$11,052 |
8/22 |
$10,150 |
$10,749 |
$10,830 |
9/22 |
$9,764 |
$10,336 |
$10,321 |
10/22 |
$9,681 |
$10,250 |
$10,202 |
11/22 |
$10,126 |
$10,730 |
$10,726 |
12/22 |
$10,149 |
$10,761 |
$10,756 |
1/23 |
$10,407 |
$11,070 |
$11,113 |
2/23 |
$10,162 |
$10,819 |
$10,835 |
3/23 |
$10,365 |
$11,059 |
$11,059 |
4/23 |
$10,356 |
$11,034 |
$11,056 |
5/23 |
$10,276 |
$10,939 |
$10,964 |
6/23 |
$10,362 |
$11,048 |
$11,079 |
7/23 |
$10,389 |
$11,092 |
$11,122 |
8/23 |
$10,260 |
$10,932 |
$10,966 |
9/23 |
$9,952 |
$10,612 |
$10,555 |
10/23 |
$9,811 |
$10,521 |
$10,429 |
11/23 |
$10,394 |
$11,189 |
$11,182 |
12/23 |
$10,654 |
$11,449 |
$11,472 |
1/24 |
$10,646 |
$11,391 |
$11,400 |
2/24 |
$10,652 |
$11,406 |
$11,403 |
3/24 |
$10,657 |
$11,405 |
$11,448 |
4/24 |
$10,541 |
$11,264 |
$11,305 |
5/24 |
$10,523 |
$11,231 |
$11,282 |
6/24 |
$10,677 |
$11,403 |
$11,481 |
7/24 |
$10,757 |
$11,507 |
$11,585 |
8/24 |
$10,827 |
$11,598 |
$11,674 |
9/24 |
$10,945 |
$11,712 |
$11,806 |
10/24 |
$10,789 |
$11,542 |
$11,615 |
11/24 |
$10,971 |
$11,741 |
$11,845 |
12/24 |
$10,814 |
$11,570 |
$11,630 |
1/25 |
$10,832 |
$11,628 |
$11,683 |
2/25 |
$10,963 |
$11,743 |
$11,813 |
3/25 |
$10,779 |
$11,544 |
$11,604 |
4/25 |
$10,697 |
$11,451 |
$11,497 |
5/25 |
$10,665 |
$11,459 |
$11,498 |
6/25 |
$10,786 |
$11,530 |
$11,545 |
7/25 |
$10,741 |
$11,507 |
$11,509 |
8/25 |
$10,837 |
$11,607 |
$11,619 |
9/25 |
$11,113 |
$11,876 |
$11,930 |
10/25 |
$11,247 |
$12,023 |
$12,093 |
11/25 |
$11,291 |
$12,050 |
$12,138 |
12/25 |
$11,298 |
$12,061 |
$12,130 |
1/26 |
$11,368 |
$12,174 |
$12,219 |
2/26 |
$11,529 |
$12,326 |
$12,405 |
3/26 |
$11,298 |
$12,040 |
$12,088 |
4/26 |
$11,421 |
$12,178 |
$12,276 |
5/26 |
$11,466 |
$12,223 |
$12,313 |
6/26 |
$11,564 |
$12,341 |
$12,444 |
7/26 |
$11,345 |
$12,113 |
$12,204 |
8/26 |
$11,309 |
$12,085 |
$12,154 |
|
| Average Annual Return [Table Text Block] |
Table Summary
Fund |
1 Year |
5 Years |
10 Years |
Class A |
4.36% |
0.32% |
1.57% |
Class A with 3.25% Maximum Sales Charge |
1.00% |
(0.35)% |
1.24% |
Bloomberg Municipal Bond Index |
4.12% |
0.54% |
1.91% |
Bloomberg Missouri Municipal Bond Index |
4.60% |
0.52% |
1.97% | |
| No Deduction of Taxes [Text Block] |
Performance does not reflect the deduction of taxes that a shareholder would pay on Fund distributions or redemption of Fund shares.
|
| Updated Performance Information Location [Text Block] |
For more recent performance information, visit www.eatonvance.com/performance.php.
|
| AssetsNet |
$ 96,280,389
|
| Holdings Count | Holding |
106
|
| Advisory Fees Paid, Amount |
$ 312,115
|
| InvestmentCompanyPortfolioTurnover |
55.00%
|
| Additional Fund Statistics [Text Block] |
Table Summary
Total Net Assets |
$96,280,389 |
# of Portfolio Holdings |
106 |
Portfolio Turnover Rate |
55% |
Total Advisory Fees Paid |
$312,115 | |
| Holdings [Text Block] |
Sector Allocation (% of total investments)
Table Summary
Value |
Value |
OtherFootnote Reference* |
6.2% |
Education |
3.3% |
Housing |
4.5% |
Senior Living/Life Care |
5.0% |
Special Tax Revenue |
5.0% |
Water and Sewer |
6.5% |
Transportation |
6.9% |
Hospital |
10.9% |
Lease Rev./Cert. of Participation |
14.9% |
General Obligations |
36.8% |
| Footnote |
Description |
Footnote* |
Sectors less than 3% each. | |
| Credit Quality Explanation [Text Block] |
Credit Quality (% of total investments)Footnote Referencea
Table Summary
Value |
Value |
NR |
5.8% |
BB |
0.4% |
BBB |
5.6% |
A |
17.4% |
AA |
63.1% |
AAA |
7.7% |
| Footnote |
Description |
Footnotea |
Ratings are based on Moody’s Investors Service, Inc. (“Moody’s”), S&P Global Ratings (“S&P”) or Fitch Ratings (“Fitch”). If securities are rated differently by the ratings agencies, the highest rating is applied. Moody's ratings are converted to the S&P and Fitch scale with ratings ranging from AAA, being the highest, to D, being the lowest. Ratings of BBB or higher are considered to be investment-grade quality. Holdings designated as “Not Rated” (if any) are not rated by the national ratings agencies stated above. | |
| Material Fund Change [Text Block] |
|
| Updated Prospectus Phone Number |
1-800-262-1122
|
| C000013122 |
|
| Shareholder Report [Line Items] |
|
| Fund Name |
Eaton Vance Missouri Municipal Income Fund
|
| Class Name |
Class C
|
| Trading Symbol |
ECMOX
|
| Annual or Semi-Annual Statement [Text Block] |
This annual shareholder report contains important information about the Eaton Vance Missouri Municipal Income Fund for the period of September 1, 2025 to August 31, 2026.
|
| Additional Information [Text Block] |
You can find additional information about the Fund at www.eatonvance.com/open-end-mutual-fund-documents.php. You can also request this information by contacting us at 1-800-262-1122.
|
| Additional Information Phone Number |
1-800-262-1122
|
| Additional Information Website |
<span style="box-sizing: border-box; color: rgb(0, 0, 0); display: inline; flex-wrap: nowrap; font-size: 10.6667px; font-weight: 400; grid-area: auto; line-height: 16px; margin: 0px; overflow: visible; text-align: left; text-align-last: auto; white-space-collapse: preserve-breaks;">www.eatonvance.com/open-end-mutual-fund-documents.php</span>
|
| Expenses [Text Block] |
What were the Fund costs for the last year?(based on a hypothetical $10,000 investment)
Table Summary
Class Name |
Costs of a $10,000 investment |
Costs paid as a percentage of a $10,000 investment |
Class C |
$152 |
1.49% | |
| Expenses Paid, Amount |
$ 152
|
| Expense Ratio, Percent |
1.49%
|
| Factors Affecting Performance [Text Block] |
How did the Fund perform last year and what affected its performance?Key contributors to (↑) and detractors from (↓) performance, relative to the Bloomberg Municipal Bond Index (the Index): ↓ An out-of-index allocation to variable-rate demand notes (VRDNs)—typically considered a defensive investment—detracted from returns during the period ↓ Security selections in bonds with maturities of 8 to 12 years detracted from performance ↓ Security selections in the leasing sector also detracted from fund performance during the period ↑ An overweight exposure to and security selection in bonds with coupon rates between 4% and 4.99% helped returns ↑ An overweight exposure to and security selections in the hospital sector, which outperformed the index, contributed to returns during the period ↑ Security selections in bonds with 22+ years to maturity also helped relative performance |
| Performance Past Does Not Indicate Future [Text] |
THE FUND'S PAST PERFORMANCE IS NO GUARANTEE OF FUTURE RESULTS.
|
| Line Graph [Table Text Block] |
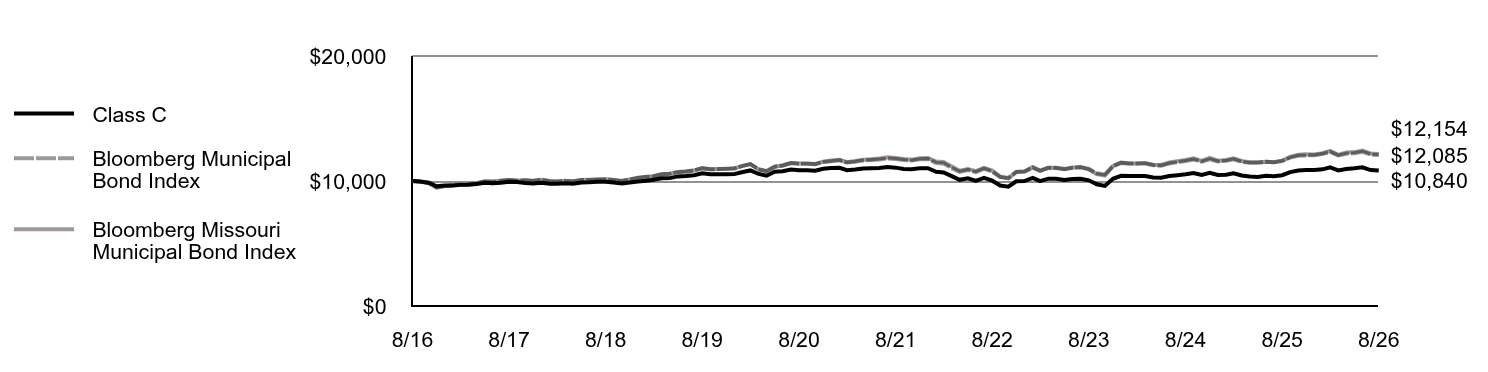
Table Summary
|
Class C |
Bloomberg Municipal Bond Index |
Bloomberg Missouri Municipal Bond Index |
8/16 |
$10,000 |
$10,000 |
$10,000 |
9/16 |
$9,957 |
$9,950 |
$9,944 |
10/16 |
$9,868 |
$9,846 |
$9,836 |
11/16 |
$9,576 |
$9,479 |
$9,460 |
12/16 |
$9,635 |
$9,590 |
$9,593 |
1/17 |
$9,648 |
$9,653 |
$9,655 |
2/17 |
$9,690 |
$9,720 |
$9,729 |
3/17 |
$9,702 |
$9,741 |
$9,751 |
4/17 |
$9,752 |
$9,812 |
$9,822 |
5/17 |
$9,859 |
$9,968 |
$9,972 |
6/17 |
$9,825 |
$9,932 |
$9,955 |
7/17 |
$9,867 |
$10,012 |
$10,025 |
8/17 |
$9,936 |
$10,088 |
$10,089 |
9/17 |
$9,921 |
$10,037 |
$10,028 |
10/17 |
$9,849 |
$10,062 |
$10,069 |
11/17 |
$9,794 |
$10,008 |
$10,013 |
12/17 |
$9,854 |
$10,112 |
$10,107 |
1/18 |
$9,780 |
$9,993 |
$9,989 |
2/18 |
$9,782 |
$9,963 |
$9,966 |
3/18 |
$9,812 |
$10,000 |
$10,010 |
4/18 |
$9,785 |
$9,964 |
$9,977 |
5/18 |
$9,882 |
$10,079 |
$10,082 |
6/18 |
$9,893 |
$10,087 |
$10,092 |
7/18 |
$9,932 |
$10,112 |
$10,112 |
8/18 |
$9,943 |
$10,138 |
$10,137 |
9/18 |
$9,876 |
$10,072 |
$10,071 |
10/18 |
$9,809 |
$10,010 |
$10,006 |
11/18 |
$9,888 |
$10,121 |
$10,127 |
12/18 |
$9,966 |
$10,242 |
$10,253 |
1/19 |
$10,025 |
$10,319 |
$10,334 |
2/19 |
$10,094 |
$10,375 |
$10,382 |
3/19 |
$10,211 |
$10,539 |
$10,540 |
4/19 |
$10,230 |
$10,578 |
$10,581 |
5/19 |
$10,367 |
$10,724 |
$10,709 |
6/19 |
$10,395 |
$10,764 |
$10,755 |
7/19 |
$10,465 |
$10,850 |
$10,842 |
8/19 |
$10,614 |
$11,022 |
$11,027 |
9/19 |
$10,542 |
$10,933 |
$10,939 |
10/19 |
$10,540 |
$10,953 |
$10,951 |
11/19 |
$10,538 |
$10,980 |
$10,970 |
12/19 |
$10,557 |
$11,014 |
$11,007 |
1/20 |
$10,716 |
$11,212 |
$11,206 |
2/20 |
$10,845 |
$11,356 |
$11,357 |
3/20 |
$10,563 |
$10,944 |
$10,917 |
4/20 |
$10,420 |
$10,807 |
$10,762 |
5/20 |
$10,741 |
$11,151 |
$11,144 |
6/20 |
$10,780 |
$11,242 |
$11,245 |
7/20 |
$10,918 |
$11,432 |
$11,439 |
8/20 |
$10,863 |
$11,378 |
$11,393 |
9/20 |
$10,854 |
$11,381 |
$11,395 |
10/20 |
$10,825 |
$11,346 |
$11,360 |
11/20 |
$10,980 |
$11,518 |
$11,544 |
12/20 |
$11,032 |
$11,588 |
$11,637 |
1/21 |
$11,053 |
$11,662 |
$11,699 |
2/21 |
$10,861 |
$11,476 |
$11,509 |
3/21 |
$10,923 |
$11,547 |
$11,600 |
4/21 |
$11,006 |
$11,644 |
$11,709 |
5/21 |
$11,026 |
$11,679 |
$11,749 |
6/21 |
$11,037 |
$11,711 |
$11,797 |
7/21 |
$11,119 |
$11,808 |
$11,898 |
8/21 |
$11,068 |
$11,765 |
$11,842 |
9/21 |
$10,966 |
$11,680 |
$11,760 |
10/21 |
$10,936 |
$11,645 |
$11,709 |
11/21 |
$11,019 |
$11,745 |
$11,824 |
12/21 |
$11,020 |
$11,764 |
$11,842 |
1/22 |
$10,742 |
$11,442 |
$11,551 |
2/22 |
$10,682 |
$11,401 |
$11,513 |
3/22 |
$10,394 |
$11,031 |
$11,154 |
4/22 |
$10,096 |
$10,726 |
$10,819 |
5/22 |
$10,213 |
$10,885 |
$10,965 |
6/22 |
$10,009 |
$10,707 |
$10,790 |
7/22 |
$10,252 |
$10,990 |
$11,052 |
8/22 |
$10,026 |
$10,749 |
$10,830 |
9/22 |
$9,634 |
$10,336 |
$10,321 |
10/22 |
$9,546 |
$10,250 |
$10,202 |
11/22 |
$9,981 |
$10,730 |
$10,726 |
12/22 |
$9,997 |
$10,761 |
$10,756 |
1/23 |
$10,244 |
$11,070 |
$11,113 |
2/23 |
$9,991 |
$10,819 |
$10,835 |
3/23 |
$10,189 |
$11,059 |
$11,059 |
4/23 |
$10,177 |
$11,034 |
$11,056 |
5/23 |
$10,091 |
$10,939 |
$10,964 |
6/23 |
$10,164 |
$11,048 |
$11,079 |
7/23 |
$10,184 |
$11,092 |
$11,122 |
8/23 |
$10,055 |
$10,932 |
$10,966 |
9/23 |
$9,735 |
$10,612 |
$10,555 |
10/23 |
$9,606 |
$10,521 |
$10,429 |
11/23 |
$10,174 |
$11,189 |
$11,182 |
12/23 |
$10,410 |
$11,449 |
$11,472 |
1/24 |
$10,400 |
$11,391 |
$11,400 |
2/24 |
$10,401 |
$11,406 |
$11,403 |
3/24 |
$10,391 |
$11,405 |
$11,448 |
4/24 |
$10,274 |
$11,264 |
$11,305 |
5/24 |
$10,254 |
$11,231 |
$11,282 |
6/24 |
$10,398 |
$11,403 |
$11,481 |
7/24 |
$10,465 |
$11,507 |
$11,585 |
8/24 |
$10,533 |
$11,598 |
$11,674 |
9/24 |
$10,645 |
$11,712 |
$11,806 |
10/24 |
$10,482 |
$11,542 |
$11,615 |
11/24 |
$10,649 |
$11,741 |
$11,845 |
12/24 |
$10,485 |
$11,570 |
$11,630 |
1/25 |
$10,508 |
$11,628 |
$11,683 |
2/25 |
$10,620 |
$11,743 |
$11,813 |
3/25 |
$10,443 |
$11,544 |
$11,604 |
4/25 |
$10,357 |
$11,451 |
$11,497 |
5/25 |
$10,314 |
$11,459 |
$11,498 |
6/25 |
$10,427 |
$11,530 |
$11,545 |
7/25 |
$10,373 |
$11,507 |
$11,509 |
8/25 |
$10,464 |
$11,607 |
$11,619 |
9/25 |
$10,713 |
$11,876 |
$11,930 |
10/25 |
$10,837 |
$12,023 |
$12,093 |
11/25 |
$10,873 |
$12,050 |
$12,138 |
12/25 |
$10,886 |
$12,061 |
$12,130 |
1/26 |
$10,931 |
$12,174 |
$12,219 |
2/26 |
$11,090 |
$12,326 |
$12,405 |
3/26 |
$10,851 |
$12,040 |
$12,088 |
4/26 |
$10,966 |
$12,178 |
$12,276 |
5/26 |
$11,012 |
$12,223 |
$12,313 |
6/26 |
$11,093 |
$12,341 |
$12,444 |
7/26 |
$10,876 |
$12,113 |
$12,204 |
8/26 |
$10,840 |
$12,085 |
$12,154 |
|
| Average Annual Return [Table Text Block] |
Table Summary
Fund |
1 Year |
5 Years |
10 Years |
Class C, with conversion to Class A after 8 years |
3.60% |
(0.41)% |
0.81% |
Class C, with 1% Maximum Contingent Deferred Sales Charge and conversion to Class A after 8 years |
2.60% |
(0.41)% |
0.81% |
Bloomberg Municipal Bond Index |
4.12% |
0.54% |
1.91% |
Bloomberg Missouri Municipal Bond Index |
4.60% |
0.52% |
1.97% | |
| No Deduction of Taxes [Text Block] |
Performance does not reflect the deduction of taxes that a shareholder would pay on Fund distributions or redemption of Fund shares.
|
| Updated Performance Information Location [Text Block] |
For more recent performance information, visit www.eatonvance.com/performance.php.
|
| AssetsNet |
$ 96,280,389
|
| Holdings Count | Holding |
106
|
| Advisory Fees Paid, Amount |
$ 312,115
|
| InvestmentCompanyPortfolioTurnover |
55.00%
|
| Additional Fund Statistics [Text Block] |
Table Summary
Total Net Assets |
$96,280,389 |
# of Portfolio Holdings |
106 |
Portfolio Turnover Rate |
55% |
Total Advisory Fees Paid |
$312,115 | |
| Holdings [Text Block] |
Sector Allocation (% of total investments)
Table Summary
Value |
Value |
OtherFootnote Reference* |
6.2% |
Education |
3.3% |
Housing |
4.5% |
Senior Living/Life Care |
5.0% |
Special Tax Revenue |
5.0% |
Water and Sewer |
6.5% |
Transportation |
6.9% |
Hospital |
10.9% |
Lease Rev./Cert. of Participation |
14.9% |
General Obligations |
36.8% |
| Footnote |
Description |
Footnote* |
Sectors less than 3% each. | |
| Credit Quality Explanation [Text Block] |
Credit Quality (% of total investments)Footnote Referencea
Table Summary
Value |
Value |
NR |
5.8% |
BB |
0.4% |
BBB |
5.6% |
A |
17.4% |
AA |
63.1% |
AAA |
7.7% |
| Footnote |
Description |
Footnotea |
Ratings are based on Moody’s Investors Service, Inc. (“Moody’s”), S&P Global Ratings (“S&P”) or Fitch Ratings (“Fitch”). If securities are rated differently by the ratings agencies, the highest rating is applied. Moody's ratings are converted to the S&P and Fitch scale with ratings ranging from AAA, being the highest, to D, being the lowest. Ratings of BBB or higher are considered to be investment-grade quality. Holdings designated as “Not Rated” (if any) are not rated by the national ratings agencies stated above. | |
| Material Fund Change [Text Block] |
|
| Updated Prospectus Phone Number |
1-800-262-1122
|
| C000092719 |
|
| Shareholder Report [Line Items] |
|
| Fund Name |
Eaton Vance Missouri Municipal Income Fund
|
| Class Name |
Class I
|
| Trading Symbol |
EIMOX
|
| Annual or Semi-Annual Statement [Text Block] |
This annual shareholder report contains important information about the Eaton Vance Missouri Municipal Income Fund for the period of September 1, 2025 to August 31, 2026.
|
| Additional Information [Text Block] |
You can find additional information about the Fund at www.eatonvance.com/open-end-mutual-fund-documents.php. You can also request this information by contacting us at 1-800-262-1122.
|
| Additional Information Phone Number |
1-800-262-1122
|
| Additional Information Website |
<span style="box-sizing: border-box; color: rgb(0, 0, 0); display: inline; flex-wrap: nowrap; font-size: 10.6667px; font-weight: 400; grid-area: auto; line-height: 16px; margin: 0px; overflow: visible; text-align: left; text-align-last: auto; white-space-collapse: preserve-breaks;">www.eatonvance.com/open-end-mutual-fund-documents.php</span>
|
| Expenses [Text Block] |
What were the Fund costs for the last year?(based on a hypothetical $10,000 investment)
Table Summary
Class Name |
Costs of a $10,000 investment |
Costs paid as a percentage of a $10,000 investment |
Class I |
$55 |
0.54% | |
| Expenses Paid, Amount |
$ 55
|
| Expense Ratio, Percent |
0.54%
|
| Factors Affecting Performance [Text Block] |
How did the Fund perform last year and what affected its performance?Key contributors to (↑) and detractors from (↓) performance, relative to the Bloomberg Municipal Bond Index (the Index): ↑ An overweight exposure to and security selection in bonds with coupon rates between 4% and 4.99% helped returns ↑ An overweight exposure to and security selections in the hospital sector, which outperformed the index, contributed to returns during the period ↑ Security selections in bonds with 22+ years to maturity also helped relative performance ↓ An out-of-index allocation to variable-rate demand notes (VRDNs)—typically considered a defensive investment—detracted from returns during the period ↓ Security selections in bonds with maturities of 8 to 12 years detracted from performance ↓ Security selections in the leasing sector also detracted from fund performance during the period |
| Performance Past Does Not Indicate Future [Text] |
THE FUND'S PAST PERFORMANCE IS NO GUARANTEE OF FUTURE RESULTS.
|
| Line Graph [Table Text Block] |
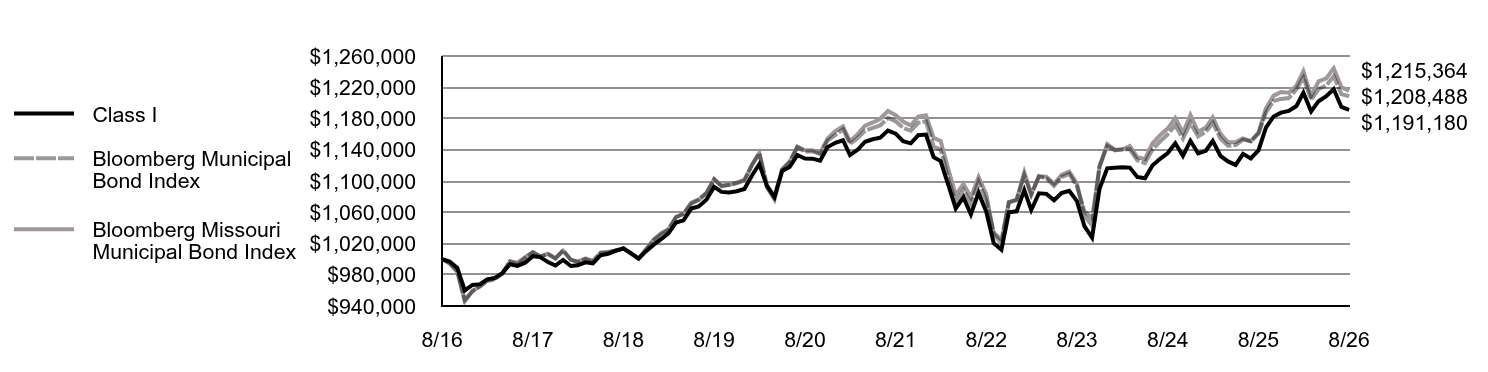
Table Summary
|
Class I |
Bloomberg Municipal Bond Index |
Bloomberg Missouri Municipal Bond Index |
8/16 |
$1,000,000 |
$1,000,000 |
$1,000,000 |
9/16 |
$996,865 |
$995,009 |
$994,447 |
10/16 |
$988,612 |
$984,570 |
$983,569 |
11/16 |
$959,918 |
$947,850 |
$945,987 |
12/16 |
$966,985 |
$958,978 |
$959,288 |
1/17 |
$967,966 |
$965,300 |
$965,465 |
2/17 |
$974,096 |
$972,003 |
$972,893 |
3/17 |
$976,033 |
$974,113 |
$975,105 |
4/17 |
$982,106 |
$981,182 |
$982,196 |
5/17 |
$993,472 |
$996,754 |
$997,228 |
6/17 |
$991,336 |
$993,179 |
$995,495 |
7/17 |
$995,472 |
$1,001,214 |
$1,002,471 |
8/17 |
$1,003,781 |
$1,008,833 |
$1,008,946 |
9/17 |
$1,002,602 |
$1,003,704 |
$1,002,798 |
10/17 |
$996,213 |
$1,006,154 |
$1,006,853 |
11/17 |
$991,768 |
$1,000,767 |
$1,001,262 |
12/17 |
$998,981 |
$1,011,227 |
$1,010,724 |
1/18 |
$991,264 |
$999,322 |
$998,931 |
2/18 |
$992,014 |
$996,336 |
$996,625 |
3/18 |
$995,967 |
$1,000,013 |
$1,001,028 |
4/18 |
$994,541 |
$996,445 |
$997,708 |
5/18 |
$1,004,970 |
$1,007,855 |
$1,008,177 |
6/18 |
$1,006,802 |
$1,008,715 |
$1,009,222 |
7/18 |
$1,010,699 |
$1,011,163 |
$1,011,214 |
8/18 |
$1,013,561 |
$1,013,760 |
$1,013,695 |
9/18 |
$1,007,716 |
$1,007,197 |
$1,007,056 |
10/18 |
$1,000,761 |
$1,000,994 |
$1,000,594 |
11/18 |
$1,010,229 |
$1,012,073 |
$1,012,726 |
12/18 |
$1,018,559 |
$1,024,191 |
$1,025,280 |
1/19 |
$1,025,781 |
$1,031,933 |
$1,033,430 |
2/19 |
$1,033,069 |
$1,037,459 |
$1,038,180 |
3/19 |
$1,046,928 |
$1,053,858 |
$1,053,967 |
4/19 |
$1,049,699 |
$1,057,819 |
$1,058,131 |
5/19 |
$1,064,733 |
$1,072,403 |
$1,070,893 |
6/19 |
$1,067,458 |
$1,076,362 |
$1,075,535 |
7/19 |
$1,076,003 |
$1,085,037 |
$1,084,182 |
8/19 |
$1,092,409 |
$1,102,152 |
$1,102,666 |
9/19 |
$1,086,082 |
$1,093,317 |
$1,093,897 |
10/19 |
$1,085,343 |
$1,095,276 |
$1,095,130 |
11/19 |
$1,086,960 |
$1,098,016 |
$1,096,963 |
12/19 |
$1,089,781 |
$1,101,368 |
$1,100,743 |
1/20 |
$1,107,368 |
$1,121,156 |
$1,120,615 |
2/20 |
$1,121,529 |
$1,135,614 |
$1,135,676 |
3/20 |
$1,093,451 |
$1,094,422 |
$1,091,666 |
4/20 |
$1,078,997 |
$1,080,687 |
$1,076,179 |
5/20 |
$1,112,826 |
$1,115,065 |
$1,114,398 |
6/20 |
$1,117,886 |
$1,124,242 |
$1,124,465 |
7/20 |
$1,133,221 |
$1,143,177 |
$1,143,900 |
8/20 |
$1,128,834 |
$1,137,813 |
$1,139,319 |
9/20 |
$1,128,592 |
$1,138,054 |
$1,139,457 |
10/20 |
$1,126,010 |
$1,134,636 |
$1,135,957 |
11/20 |
$1,143,367 |
$1,151,758 |
$1,154,376 |
12/20 |
$1,148,953 |
$1,158,774 |
$1,163,734 |
1/21 |
$1,152,180 |
$1,166,159 |
$1,169,851 |
2/21 |
$1,133,226 |
$1,147,630 |
$1,150,855 |
3/21 |
$1,139,992 |
$1,154,708 |
$1,159,984 |
4/21 |
$1,150,259 |
$1,164,393 |
$1,170,873 |
5/21 |
$1,153,440 |
$1,167,867 |
$1,174,925 |
6/21 |
$1,155,422 |
$1,171,074 |
$1,179,659 |
7/21 |
$1,164,534 |
$1,180,786 |
$1,189,751 |
8/21 |
$1,160,694 |
$1,176,453 |
$1,184,180 |
9/21 |
$1,150,903 |
$1,167,963 |
$1,176,019 |
10/21 |
$1,148,200 |
$1,164,548 |
$1,170,928 |
11/21 |
$1,158,641 |
$1,174,461 |
$1,182,429 |
12/21 |
$1,159,501 |
$1,176,356 |
$1,184,152 |
1/22 |
$1,130,472 |
$1,144,156 |
$1,155,102 |
2/22 |
$1,125,477 |
$1,140,057 |
$1,151,344 |
3/22 |
$1,095,155 |
$1,103,100 |
$1,115,447 |
4/22 |
$1,064,849 |
$1,072,589 |
$1,081,927 |
5/22 |
$1,079,104 |
$1,088,522 |
$1,096,509 |
6/22 |
$1,057,307 |
$1,070,693 |
$1,079,011 |
7/22 |
$1,085,111 |
$1,098,983 |
$1,105,202 |
8/22 |
$1,060,608 |
$1,074,897 |
$1,083,047 |
9/22 |
$1,020,449 |
$1,033,642 |
$1,032,073 |
10/22 |
$1,011,999 |
$1,025,046 |
$1,020,204 |
11/22 |
$1,059,819 |
$1,072,991 |
$1,072,592 |
12/22 |
$1,061,192 |
$1,076,063 |
$1,075,562 |
1/23 |
$1,088,278 |
$1,106,973 |
$1,111,302 |
2/23 |
$1,062,893 |
$1,081,942 |
$1,083,474 |
3/23 |
$1,084,311 |
$1,105,948 |
$1,105,927 |
4/23 |
$1,083,549 |
$1,103,421 |
$1,105,607 |
5/23 |
$1,075,348 |
$1,093,859 |
$1,096,398 |
6/23 |
$1,084,583 |
$1,104,817 |
$1,107,921 |
7/23 |
$1,087,561 |
$1,109,187 |
$1,112,184 |
8/23 |
$1,074,274 |
$1,093,219 |
$1,096,617 |
9/23 |
$1,042,212 |
$1,061,178 |
$1,055,466 |
10/23 |
$1,027,621 |
$1,052,148 |
$1,042,942 |
11/23 |
$1,090,128 |
$1,118,940 |
$1,118,153 |
12/23 |
$1,116,158 |
$1,144,946 |
$1,147,160 |
1/24 |
$1,116,866 |
$1,139,098 |
$1,140,048 |
2/24 |
$1,117,627 |
$1,140,561 |
$1,140,313 |
3/24 |
$1,117,124 |
$1,140,525 |
$1,144,805 |
4/24 |
$1,105,142 |
$1,126,400 |
$1,130,456 |
5/24 |
$1,103,410 |
$1,123,096 |
$1,128,205 |
6/24 |
$1,119,737 |
$1,140,311 |
$1,148,092 |
7/24 |
$1,128,361 |
$1,150,704 |
$1,158,509 |
8/24 |
$1,135,814 |
$1,159,779 |
$1,167,442 |
9/24 |
$1,148,410 |
$1,171,242 |
$1,180,585 |
10/24 |
$1,132,296 |
$1,154,164 |
$1,161,452 |
11/24 |
$1,151,494 |
$1,174,101 |
$1,184,548 |
12/24 |
$1,135,269 |
$1,157,008 |
$1,162,967 |
1/25 |
$1,138,693 |
$1,162,807 |
$1,168,340 |
2/25 |
$1,151,255 |
$1,174,336 |
$1,181,348 |
3/25 |
$1,132,194 |
$1,154,434 |
$1,160,416 |
4/25 |
$1,125,066 |
$1,145,133 |
$1,149,734 |
5/25 |
$1,120,577 |
$1,145,869 |
$1,149,769 |
6/25 |
$1,134,795 |
$1,153,002 |
$1,154,549 |
7/25 |
$1,128,921 |
$1,150,674 |
$1,150,881 |
8/25 |
$1,139,188 |
$1,160,675 |
$1,161,915 |
9/25 |
$1,168,382 |
$1,187,554 |
$1,193,048 |
10/25 |
$1,182,629 |
$1,202,283 |
$1,209,291 |
11/25 |
$1,187,520 |
$1,205,041 |
$1,213,775 |
12/25 |
$1,189,770 |
$1,206,125 |
$1,212,968 |
1/26 |
$1,195,951 |
$1,217,445 |
$1,221,938 |
2/26 |
$1,213,033 |
$1,232,618 |
$1,240,453 |
3/26 |
$1,188,961 |
$1,203,989 |
$1,208,778 |
4/26 |
$1,202,156 |
$1,217,775 |
$1,227,554 |
5/26 |
$1,208,434 |
$1,222,322 |
$1,231,281 |
6/26 |
$1,217,566 |
$1,234,103 |
$1,244,364 |
7/26 |
$1,194,746 |
$1,211,258 |
$1,220,386 |
8/26 |
$1,191,180 |
$1,208,488 |
$1,215,364 |
|
| Average Annual Return [Table Text Block] |
Table Summary
Fund |
1 Year |
5 Years |
10 Years |
Class I |
4.56% |
0.52% |
1.76% |
Bloomberg Municipal Bond Index |
4.12% |
0.54% |
1.91% |
Bloomberg Missouri Municipal Bond Index |
4.60% |
0.52% |
1.97% | |
| No Deduction of Taxes [Text Block] |
Performance does not reflect the deduction of taxes that a shareholder would pay on Fund distributions or redemption of Fund shares.
|
| Updated Performance Information Location [Text Block] |
For more recent performance information, visit www.eatonvance.com/performance.php.
|
| AssetsNet |
$ 96,280,389
|
| Holdings Count | Holding |
106
|
| Advisory Fees Paid, Amount |
$ 312,115
|
| InvestmentCompanyPortfolioTurnover |
55.00%
|
| Additional Fund Statistics [Text Block] |
Table Summary
Total Net Assets |
$96,280,389 |
# of Portfolio Holdings |
106 |
Portfolio Turnover Rate |
55% |
Total Advisory Fees Paid |
$312,115 | |
| Holdings [Text Block] |
Sector Allocation (% of total investments)
Table Summary
Value |
Value |
OtherFootnote Reference* |
6.2% |
Education |
3.3% |
Housing |
4.5% |
Senior Living/Life Care |
5.0% |
Special Tax Revenue |
5.0% |
Water and Sewer |
6.5% |
Transportation |
6.9% |
Hospital |
10.9% |
Lease Rev./Cert. of Participation |
14.9% |
General Obligations |
36.8% |
| Footnote |
Description |
Footnote* |
Sectors less than 3% each. | |
| Credit Quality Explanation [Text Block] |
Credit Quality (% of total investments)Footnote Referencea
Table Summary
Value |
Value |
NR |
5.8% |
BB |
0.4% |
BBB |
5.6% |
A |
17.4% |
AA |
63.1% |
AAA |
7.7% |
| Footnote |
Description |
Footnotea |
Ratings are based on Moody’s Investors Service, Inc. (“Moody’s”), S&P Global Ratings (“S&P”) or Fitch Ratings (“Fitch”). If securities are rated differently by the ratings agencies, the highest rating is applied. Moody's ratings are converted to the S&P and Fitch scale with ratings ranging from AAA, being the highest, to D, being the lowest. Ratings of BBB or higher are considered to be investment-grade quality. Holdings designated as “Not Rated” (if any) are not rated by the national ratings agencies stated above. | |
| Material Fund Change [Text Block] |
|
| Updated Prospectus Phone Number |
1-800-262-1122
|
| C000013136 |
|
| Shareholder Report [Line Items] |
|
| Fund Name |
Eaton Vance North Carolina Municipal Income Fund
|
| Class Name |
Class A
|
| Trading Symbol |
ETNCX
|
| Annual or Semi-Annual Statement [Text Block] |
This annual shareholder report contains important information about the Eaton Vance North Carolina Municipal Income Fund for the period of September 1, 2025 to August 31, 2026.
|
| Additional Information [Text Block] |
You can find additional information about the Fund at www.eatonvance.com/open-end-mutual-fund-documents.php. You can also request this information by contacting us at 1-800-262-1122.
|
| Additional Information Phone Number |
1-800-262-1122
|
| Additional Information Website |
<span style="box-sizing: border-box; color: rgb(0, 0, 0); display: inline; flex-wrap: nowrap; font-size: 10.6667px; font-weight: 400; grid-area: auto; line-height: 16px; margin: 0px; overflow: visible; text-align: left; text-align-last: auto; white-space-collapse: preserve-breaks;">www.eatonvance.com/open-end-mutual-fund-documents.php</span>
|
| Expenses [Text Block] |
What were the Fund costs for the last year?(based on a hypothetical $10,000 investment)
Table Summary
Class Name |
Costs of a $10,000 investment |
Costs paid as a percentage of a $10,000 investment |
Class A |
$73 |
0.71% | |
| Expenses Paid, Amount |
$ 73
|
| Expense Ratio, Percent |
0.71%
|
| Factors Affecting Performance [Text Block] |
How did the Fund perform last year and what affected its performance?Key contributors to (↑) and detractors from (↓) performance, relative to the Bloomberg Municipal Bond Index (the Index): ↑ An overweight exposure to and security selection in bonds with 22+ years to maturity contributed to performance ↑ An overweight exposure to and security selections in bonds with coupon rates between 4% and 4.99% helped returns ↑ Security selections in the water and sewer sectors also contributed to returns during the period ↓ An out-of-index allocation to variable-rate demand notes (VRDNs)—typically considered a defensive investment—detracted from returns ↓ Security selections in the leasing sector also detracted from fund performance during the period ↓ An underweight exposure to and security selections in A-rated bonds detracted from relative performance during the period |
| Performance Past Does Not Indicate Future [Text] |
THE FUND'S PAST PERFORMANCE IS NO GUARANTEE OF FUTURE RESULTS.
|
| Line Graph [Table Text Block] |
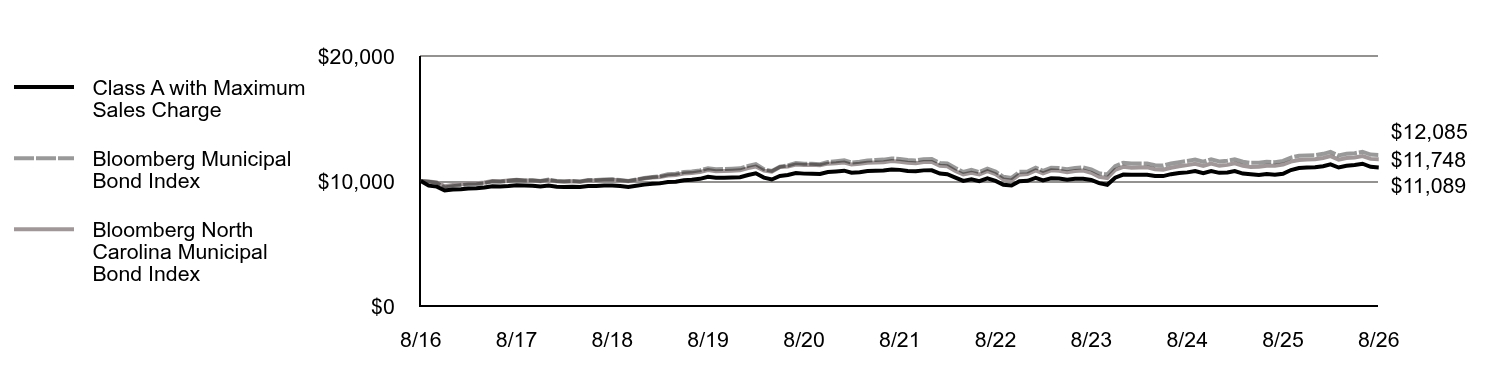
Table Summary
|
Class A with Maximum Sales Charge |
Bloomberg Municipal Bond Index |
Bloomberg North Carolina Municipal Bond Index |
8/16 |
$10,000 |
$10,000 |
$10,000 |
9/16 |
$9,628 |
$9,950 |
$9,954 |
10/16 |
$9,549 |
$9,846 |
$9,882 |
11/16 |
$9,243 |
$9,479 |
$9,575 |
12/16 |
$9,319 |
$9,590 |
$9,674 |
1/17 |
$9,345 |
$9,653 |
$9,734 |
2/17 |
$9,392 |
$9,720 |
$9,802 |
3/17 |
$9,417 |
$9,741 |
$9,820 |
4/17 |
$9,474 |
$9,812 |
$9,883 |
5/17 |
$9,583 |
$9,968 |
$10,006 |
6/17 |
$9,566 |
$9,932 |
$9,976 |
7/17 |
$9,602 |
$10,012 |
$10,042 |
8/17 |
$9,669 |
$10,088 |
$10,101 |
9/17 |
$9,641 |
$10,037 |
$10,031 |
10/17 |
$9,623 |
$10,062 |
$10,048 |
11/17 |
$9,562 |
$10,008 |
$9,985 |
12/17 |
$9,641 |
$10,112 |
$10,067 |
1/18 |
$9,547 |
$9,993 |
$9,982 |
2/18 |
$9,519 |
$9,963 |
$9,962 |
3/18 |
$9,533 |
$10,000 |
$9,979 |
4/18 |
$9,514 |
$9,964 |
$9,948 |
5/18 |
$9,592 |
$10,079 |
$10,043 |
6/18 |
$9,607 |
$10,087 |
$10,048 |
7/18 |
$9,631 |
$10,112 |
$10,072 |
8/18 |
$9,645 |
$10,138 |
$10,090 |
9/18 |
$9,593 |
$10,072 |
$10,033 |
10/18 |
$9,529 |
$10,010 |
$9,987 |
11/18 |
$9,620 |
$10,121 |
$10,092 |
12/18 |
$9,711 |
$10,242 |
$10,199 |
1/19 |
$9,777 |
$10,319 |
$10,282 |
2/19 |
$9,810 |
$10,375 |
$10,325 |
3/19 |
$9,921 |
$10,539 |
$10,445 |
4/19 |
$9,942 |
$10,578 |
$10,476 |
5/19 |
$10,063 |
$10,724 |
$10,592 |
6/19 |
$10,106 |
$10,764 |
$10,631 |
7/19 |
$10,171 |
$10,850 |
$10,720 |
8/19 |
$10,338 |
$11,022 |
$10,869 |
9/19 |
$10,268 |
$10,933 |
$10,774 |
10/19 |
$10,266 |
$10,953 |
$10,801 |
11/19 |
$10,276 |
$10,980 |
$10,828 |
12/19 |
$10,297 |
$11,014 |
$10,855 |
1/20 |
$10,477 |
$11,212 |
$11,031 |
2/20 |
$10,613 |
$11,356 |
$11,158 |
3/20 |
$10,270 |
$10,944 |
$10,826 |
4/20 |
$10,121 |
$10,807 |
$10,753 |
5/20 |
$10,405 |
$11,151 |
$11,113 |
6/20 |
$10,483 |
$11,242 |
$11,163 |
7/20 |
$10,640 |
$11,432 |
$11,322 |
8/20 |
$10,590 |
$11,378 |
$11,279 |
9/20 |
$10,586 |
$11,381 |
$11,296 |
10/20 |
$10,557 |
$11,346 |
$11,257 |
11/20 |
$10,712 |
$11,518 |
$11,389 |
12/20 |
$10,763 |
$11,588 |
$11,418 |
1/21 |
$10,826 |
$11,662 |
$11,473 |
2/21 |
$10,658 |
$11,476 |
$11,314 |
3/21 |
$10,698 |
$11,547 |
$11,377 |
4/21 |
$10,796 |
$11,644 |
$11,455 |
5/21 |
$10,811 |
$11,679 |
$11,473 |
6/21 |
$10,838 |
$11,711 |
$11,496 |
7/21 |
$10,922 |
$11,808 |
$11,591 |
8/21 |
$10,890 |
$11,765 |
$11,537 |
9/21 |
$10,798 |
$11,680 |
$11,452 |
10/21 |
$10,777 |
$11,645 |
$11,421 |
11/21 |
$10,850 |
$11,745 |
$11,511 |
12/21 |
$10,852 |
$11,764 |
$11,524 |
1/22 |
$10,594 |
$11,442 |
$11,221 |
2/22 |
$10,538 |
$11,401 |
$11,182 |
3/22 |
$10,268 |
$11,031 |
$10,800 |
4/22 |
$10,010 |
$10,726 |
$10,519 |
5/22 |
$10,130 |
$10,885 |
$10,656 |
6/22 |
$9,990 |
$10,707 |
$10,520 |
7/22 |
$10,220 |
$10,990 |
$10,794 |
8/22 |
$10,008 |
$10,749 |
$10,545 |
9/22 |
$9,691 |
$10,336 |
$10,121 |
10/22 |
$9,636 |
$10,250 |
$10,045 |
11/22 |
$9,989 |
$10,730 |
$10,509 |
12/22 |
$10,018 |
$10,761 |
$10,548 |
1/23 |
$10,252 |
$11,070 |
$10,850 |
2/23 |
$10,044 |
$10,819 |
$10,612 |
3/23 |
$10,220 |
$11,059 |
$10,857 |
4/23 |
$10,205 |
$11,034 |
$10,818 |
5/23 |
$10,093 |
$10,939 |
$10,704 |
6/23 |
$10,175 |
$11,048 |
$10,805 |
7/23 |
$10,185 |
$11,092 |
$10,843 |
8/23 |
$10,086 |
$10,932 |
$10,653 |
9/23 |
$9,830 |
$10,612 |
$10,329 |
10/23 |
$9,696 |
$10,521 |
$10,234 |
11/23 |
$10,262 |
$11,189 |
$10,890 |
12/23 |
$10,510 |
$11,449 |
$11,139 |
1/24 |
$10,499 |
$11,391 |
$11,064 |
2/24 |
$10,500 |
$11,406 |
$11,079 |
3/24 |
$10,502 |
$11,405 |
$11,091 |
4/24 |
$10,404 |
$11,264 |
$10,948 |
5/24 |
$10,394 |
$11,231 |
$10,902 |
6/24 |
$10,546 |
$11,403 |
$11,064 |
7/24 |
$10,636 |
$11,507 |
$11,177 |
8/24 |
$10,689 |
$11,598 |
$11,269 |
9/24 |
$10,793 |
$11,712 |
$11,377 |
10/24 |
$10,619 |
$11,542 |
$11,199 |
11/24 |
$10,800 |
$11,741 |
$11,385 |
12/24 |
$10,651 |
$11,570 |
$11,214 |
1/25 |
$10,680 |
$11,628 |
$11,289 |
2/25 |
$10,797 |
$11,743 |
$11,412 |
3/25 |
$10,596 |
$11,544 |
$11,221 |
4/25 |
$10,536 |
$11,451 |
$11,123 |
5/25 |
$10,487 |
$11,459 |
$11,146 |
6/25 |
$10,556 |
$11,530 |
$11,226 |
7/25 |
$10,494 |
$11,507 |
$11,218 |
8/25 |
$10,575 |
$11,607 |
$11,314 |
9/25 |
$10,878 |
$11,876 |
$11,551 |
10/25 |
$11,037 |
$12,023 |
$11,679 |
11/25 |
$11,080 |
$12,050 |
$11,720 |
12/25 |
$11,098 |
$12,061 |
$11,739 |
1/26 |
$11,179 |
$12,174 |
$11,837 |
2/26 |
$11,327 |
$12,326 |
$11,987 |
3/26 |
$11,078 |
$12,040 |
$11,711 |
4/26 |
$11,214 |
$12,178 |
$11,846 |
5/26 |
$11,284 |
$12,223 |
$11,889 |
6/26 |
$11,381 |
$12,341 |
$11,997 |
7/26 |
$11,131 |
$12,113 |
$11,770 |
8/26 |
$11,089 |
$12,085 |
$11,748 |
|
| Average Annual Return [Table Text Block] |
Table Summary
Fund |
1 Year |
5 Years |
10 Years |
Class A |
4.90% |
0.37% |
1.38% |
Class A with 3.25% Maximum Sales Charge |
1.53% |
(0.29)% |
1.04% |
Bloomberg Municipal Bond Index |
4.12% |
0.54% |
1.91% |
Bloomberg North Carolina Municipal Bond Index |
3.84% |
0.36% |
1.62% | |
| No Deduction of Taxes [Text Block] |
Performance does not reflect the deduction of taxes that a shareholder would pay on Fund distributions or redemption of Fund shares.
|
| Updated Performance Information Location [Text Block] |
For more recent performance information, visit www.eatonvance.com/performance.php.
|
| AssetsNet |
$ 273,604,238
|
| Holdings Count | Holding |
234
|
| Advisory Fees Paid, Amount |
$ 985,064
|
| InvestmentCompanyPortfolioTurnover |
68.00%
|
| Additional Fund Statistics [Text Block] |
Table Summary
Total Net Assets |
$273,604,238 |
# of Portfolio Holdings |
234 |
Portfolio Turnover Rate |
68% |
Total Advisory Fees Paid |
$985,064 | |
| Holdings [Text Block] |
Sector Allocation (% of total investments)
Table Summary
Value |
Value |
OtherFootnote Reference* |
4.7% |
Electric Utilities |
3.6% |
Short-Term Investments |
4.2% |
General Obligations |
7.0% |
Housing |
8.2% |
Senior Living/Life Care |
8.3% |
Transportation |
10.7% |
Education |
10.9% |
Hospital |
12.7% |
Lease Rev./Cert. of Participation |
14.5% |
Water and Sewer |
15.2% |
| Footnote |
Description |
Footnote* |
Sectors less than 3% each. | |
| Credit Quality Explanation [Text Block] |
Credit Quality (% of total investments)Footnote Referencea
Table Summary
Value |
Value |
NR |
5.2% |
BB |
0.2% |
BBB |
6.8% |
A |
5.1% |
AA |
64.1% |
AAA |
18.6% |
| Footnote |
Description |
Footnotea |
Ratings are based on Moody’s Investors Service, Inc. (“Moody’s”), S&P Global Ratings (“S&P”) or Fitch Ratings (“Fitch”). If securities are rated differently by the ratings agencies, the highest rating is applied. Moody's ratings are converted to the S&P and Fitch scale with ratings ranging from AAA, being the highest, to D, being the lowest. Ratings of BBB or higher are considered to be investment-grade quality. Holdings designated as “Not Rated” (if any) are not rated by the national ratings agencies stated above. | |
| Material Fund Change [Text Block] |
|
| Updated Prospectus Phone Number |
1-800-262-1122
|
| C000013138 |
|
| Shareholder Report [Line Items] |
|
| Fund Name |
Eaton Vance North Carolina Municipal Income Fund
|
| Class Name |
Class C
|
| Trading Symbol |
ECNCX
|
| Annual or Semi-Annual Statement [Text Block] |
This annual shareholder report contains important information about the Eaton Vance North Carolina Municipal Income Fund for the period of September 1, 2025 to August 31, 2026.
|
| Additional Information [Text Block] |
You can find additional information about the Fund at www.eatonvance.com/open-end-mutual-fund-documents.php. You can also request this information by contacting us at 1-800-262-1122.
|
| Additional Information Phone Number |
1-800-262-1122
|
| Additional Information Website |
<span style="box-sizing: border-box; color: rgb(0, 0, 0); display: inline; flex-wrap: nowrap; font-size: 10.6667px; font-weight: 400; grid-area: auto; line-height: 16px; margin: 0px; overflow: visible; text-align: left; text-align-last: auto; white-space-collapse: preserve-breaks;">www.eatonvance.com/open-end-mutual-fund-documents.php</span>
|
| Expenses [Text Block] |
What were the Fund costs for the last year?(based on a hypothetical $10,000 investment)
Table Summary
Class Name |
Costs of a $10,000 investment |
Costs paid as a percentage of a $10,000 investment |
Class C |
$149 |
1.46% | |
| Expenses Paid, Amount |
$ 149
|
| Expense Ratio, Percent |
1.46%
|
| Factors Affecting Performance [Text Block] |
How did the Fund perform last year and what affected its performance?Key contributors to (↑) and detractors from (↓) performance, relative to the Bloomberg Municipal Bond Index (the Index): ↑ An overweight exposure to and security selection in bonds with 22+ years to maturity contributed to performance ↑ An overweight exposure to and security selections in bonds with coupon rates between 4% and 4.99% helped returns ↑ Security selections in the water and sewer sectors also contributed to returns during the period ↓ An out-of-index allocation to variable-rate demand notes (VRDNs)—typically considered a defensive investment—detracted from returns ↓ Security selections in the leasing sector also detracted from fund performance during the period ↓ An underweight exposure to and security selections in A-rated bonds detracted from relative performance during the period |
| Performance Past Does Not Indicate Future [Text] |
THE FUND'S PAST PERFORMANCE IS NO GUARANTEE OF FUTURE RESULTS.
|
| Line Graph [Table Text Block] |
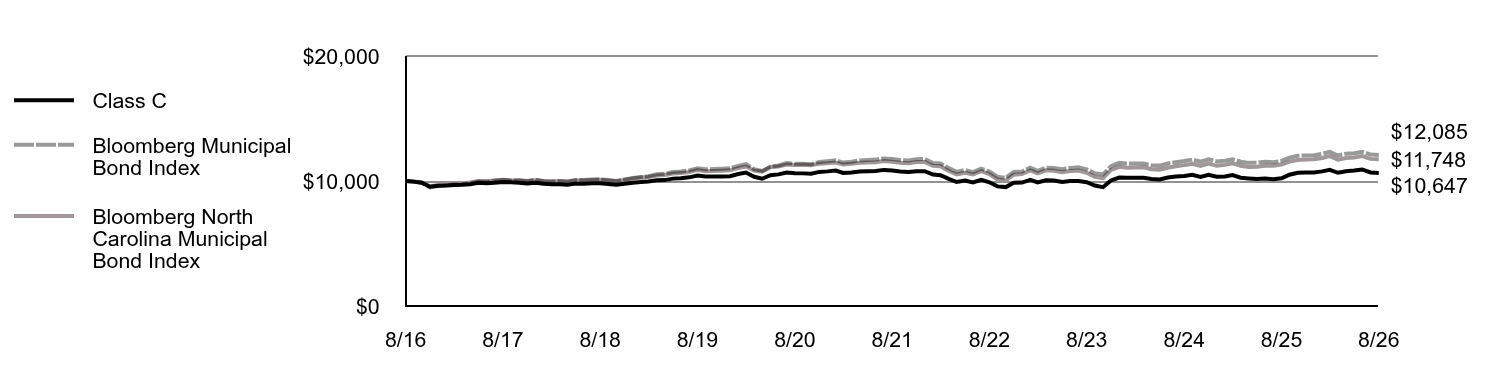
Table Summary
|
Class C |
Bloomberg Municipal Bond Index |
Bloomberg North Carolina Municipal Bond Index |
8/16 |
$10,000 |
$10,000 |
$10,000 |
9/16 |
$9,950 |
$9,950 |
$9,954 |
10/16 |
$9,860 |
$9,846 |
$9,882 |
11/16 |
$9,542 |
$9,479 |
$9,575 |
12/16 |
$9,611 |
$9,590 |
$9,674 |
1/17 |
$9,632 |
$9,653 |
$9,734 |
2/17 |
$9,673 |
$9,720 |
$9,802 |
3/17 |
$9,693 |
$9,741 |
$9,820 |
4/17 |
$9,743 |
$9,812 |
$9,883 |
5/17 |
$9,853 |
$9,968 |
$10,006 |
6/17 |
$9,823 |
$9,932 |
$9,976 |
7/17 |
$9,852 |
$10,012 |
$10,042 |
8/17 |
$9,922 |
$10,088 |
$10,101 |
9/17 |
$9,891 |
$10,037 |
$10,031 |
10/17 |
$9,859 |
$10,062 |
$10,048 |
11/17 |
$9,797 |
$10,008 |
$9,985 |
12/17 |
$9,867 |
$10,112 |
$10,067 |
1/18 |
$9,774 |
$9,993 |
$9,982 |
2/18 |
$9,733 |
$9,963 |
$9,962 |
3/18 |
$9,741 |
$10,000 |
$9,979 |
4/18 |
$9,709 |
$9,964 |
$9,948 |
5/18 |
$9,789 |
$10,079 |
$10,043 |
6/18 |
$9,788 |
$10,087 |
$10,048 |
7/18 |
$9,817 |
$10,112 |
$10,072 |
8/18 |
$9,826 |
$10,138 |
$10,090 |
9/18 |
$9,762 |
$10,072 |
$10,033 |
10/18 |
$9,697 |
$10,010 |
$9,987 |
11/18 |
$9,779 |
$10,121 |
$10,092 |
12/18 |
$9,860 |
$10,242 |
$10,199 |
1/19 |
$9,918 |
$10,319 |
$10,282 |
2/19 |
$9,956 |
$10,375 |
$10,325 |
3/19 |
$10,055 |
$10,539 |
$10,445 |
4/19 |
$10,071 |
$10,578 |
$10,476 |
5/19 |
$10,190 |
$10,724 |
$10,592 |
6/19 |
$10,225 |
$10,764 |
$10,631 |
7/19 |
$10,293 |
$10,850 |
$10,720 |
8/19 |
$10,444 |
$11,022 |
$10,869 |
9/19 |
$10,363 |
$10,933 |
$10,774 |
10/19 |
$10,366 |
$10,953 |
$10,801 |
11/19 |
$10,360 |
$10,980 |
$10,828 |
12/19 |
$10,386 |
$11,014 |
$10,855 |
1/20 |
$10,560 |
$11,212 |
$11,031 |
2/20 |
$10,682 |
$11,356 |
$11,158 |
3/20 |
$10,335 |
$10,944 |
$10,826 |
4/20 |
$10,180 |
$10,807 |
$10,753 |
5/20 |
$10,462 |
$11,151 |
$11,113 |
6/20 |
$10,530 |
$11,242 |
$11,163 |
7/20 |
$10,682 |
$11,432 |
$11,322 |
8/20 |
$10,620 |
$11,378 |
$11,279 |
9/20 |
$10,610 |
$11,381 |
$11,296 |
10/20 |
$10,578 |
$11,346 |
$11,257 |
11/20 |
$10,728 |
$11,518 |
$11,389 |
12/20 |
$10,770 |
$11,588 |
$11,418 |
1/21 |
$10,833 |
$11,662 |
$11,473 |
2/21 |
$10,650 |
$11,476 |
$11,314 |
3/21 |
$10,682 |
$11,547 |
$11,377 |
4/21 |
$10,768 |
$11,644 |
$11,455 |
5/21 |
$10,787 |
$11,679 |
$11,473 |
6/21 |
$10,806 |
$11,711 |
$11,496 |
7/21 |
$10,889 |
$11,808 |
$11,591 |
8/21 |
$10,842 |
$11,765 |
$11,537 |
9/21 |
$10,752 |
$11,680 |
$11,452 |
10/21 |
$10,715 |
$11,645 |
$11,421 |
11/21 |
$10,788 |
$11,745 |
$11,511 |
12/21 |
$10,784 |
$11,764 |
$11,524 |
1/22 |
$10,518 |
$11,442 |
$11,221 |
2/22 |
$10,462 |
$11,401 |
$11,182 |
3/22 |
$10,174 |
$11,031 |
$10,800 |
4/22 |
$9,920 |
$10,726 |
$10,519 |
5/22 |
$10,036 |
$10,885 |
$10,656 |
6/22 |
$9,881 |
$10,707 |
$10,520 |
7/22 |
$10,097 |
$10,990 |
$10,794 |
8/22 |
$9,898 |
$10,749 |
$10,545 |
9/22 |
$9,569 |
$10,336 |
$10,121 |
10/22 |
$9,513 |
$10,250 |
$10,045 |
11/22 |
$9,854 |
$10,730 |
$10,509 |
12/22 |
$9,876 |
$10,761 |
$10,548 |
1/23 |
$10,096 |
$11,070 |
$10,850 |
2/23 |
$9,890 |
$10,819 |
$10,612 |
3/23 |
$10,057 |
$11,059 |
$10,857 |
4/23 |
$10,038 |
$11,034 |
$10,818 |
5/23 |
$9,920 |
$10,939 |
$10,704 |
6/23 |
$9,991 |
$11,048 |
$10,805 |
7/23 |
$9,995 |
$11,092 |
$10,843 |
8/23 |
$9,900 |
$10,932 |
$10,653 |
9/23 |
$9,640 |
$10,612 |
$10,329 |
10/23 |
$9,503 |
$10,521 |
$10,234 |
11/23 |
$10,047 |
$11,189 |
$10,890 |
12/23 |
$10,279 |
$11,449 |
$11,139 |
1/24 |
$10,264 |
$11,391 |
$11,064 |
2/24 |
$10,262 |
$11,406 |
$11,079 |
3/24 |
$10,258 |
$11,405 |
$11,091 |
4/24 |
$10,154 |
$11,264 |
$10,948 |
5/24 |
$10,128 |
$11,231 |
$10,902 |
6/24 |
$10,285 |
$11,403 |
$11,064 |
7/24 |
$10,362 |
$11,507 |
$11,177 |
8/24 |
$10,405 |
$11,598 |
$11,269 |
9/24 |
$10,495 |
$11,712 |
$11,377 |
10/24 |
$10,333 |
$11,542 |
$11,199 |
11/24 |
$10,503 |
$11,741 |
$11,385 |
12/24 |
$10,341 |
$11,570 |
$11,214 |
1/25 |
$10,362 |
$11,628 |
$11,289 |
2/25 |
$10,476 |
$11,743 |
$11,412 |
3/25 |
$10,266 |
$11,544 |
$11,221 |
4/25 |
$10,208 |
$11,451 |
$11,123 |
5/25 |
$10,160 |
$11,459 |
$11,146 |
6/25 |
$10,205 |
$11,530 |
$11,226 |
7/25 |
$10,146 |
$11,507 |
$11,218 |
8/25 |
$10,214 |
$11,607 |
$11,314 |
9/25 |
$10,505 |
$11,876 |
$11,551 |
10/25 |
$10,655 |
$12,023 |
$11,679 |
11/25 |
$10,689 |
$12,050 |
$11,720 |
12/25 |
$10,688 |
$12,061 |
$11,739 |
1/26 |
$10,768 |
$12,174 |
$11,837 |
2/26 |
$10,896 |
$12,326 |
$11,987 |
3/26 |
$10,656 |
$12,040 |
$11,711 |
4/26 |
$10,786 |
$12,178 |
$11,846 |
5/26 |
$10,843 |
$12,223 |
$11,889 |
6/26 |
$10,925 |
$12,341 |
$11,997 |
7/26 |
$10,685 |
$12,113 |
$11,770 |
8/26 |
$10,647 |
$12,085 |
$11,748 |
|
| Average Annual Return [Table Text Block] |
Table Summary
Fund |
1 Year |
5 Years |
10 Years |
Class C, with conversion to Class A after 8 years |
4.24% |
(0.36)% |
0.63% |
Class C, with 1% Maximum Contingent Deferred Sales Charge and conversion to Class A after 8 years |
3.24% |
(0.36)% |
0.63% |
Bloomberg Municipal Bond Index |
4.12% |
0.54% |
1.91% |
Bloomberg North Carolina Municipal Bond Index |
3.84% |
0.36% |
1.62% | |
| No Deduction of Taxes [Text Block] |
Performance does not reflect the deduction of taxes that a shareholder would pay on Fund distributions or redemption of Fund shares.
|
| Updated Performance Information Location [Text Block] |
For more recent performance information, visit www.eatonvance.com/performance.php.
|
| AssetsNet |
$ 273,604,238
|
| Holdings Count | Holding |
234
|
| Advisory Fees Paid, Amount |
$ 985,064
|
| InvestmentCompanyPortfolioTurnover |
68.00%
|
| Additional Fund Statistics [Text Block] |
Table Summary
Total Net Assets |
$273,604,238 |
# of Portfolio Holdings |
234 |
Portfolio Turnover Rate |
68% |
Total Advisory Fees Paid |
$985,064 | |
| Holdings [Text Block] |
Sector Allocation (% of total investments)
Table Summary
Value |
Value |
OtherFootnote Reference* |
4.7% |
Electric Utilities |
3.6% |
Short-Term Investments |
4.2% |
General Obligations |
7.0% |
Housing |
8.2% |
Senior Living/Life Care |
8.3% |
Transportation |
10.7% |
Education |
10.9% |
Hospital |
12.7% |
Lease Rev./Cert. of Participation |
14.5% |
Water and Sewer |
15.2% |
| Footnote |
Description |
Footnote* |
Sectors less than 3% each. | |
| Credit Quality Explanation [Text Block] |
Credit Quality (% of total investments)Footnote Referencea
Table Summary
Value |
Value |
NR |
5.2% |
BB |
0.2% |
BBB |
6.8% |
A |
5.1% |
AA |
64.1% |
AAA |
18.6% |
| Footnote |
Description |
Footnotea |
Ratings are based on Moody’s Investors Service, Inc. (“Moody’s”), S&P Global Ratings (“S&P”) or Fitch Ratings (“Fitch”). If securities are rated differently by the ratings agencies, the highest rating is applied. Moody's ratings are converted to the S&P and Fitch scale with ratings ranging from AAA, being the highest, to D, being the lowest. Ratings of BBB or higher are considered to be investment-grade quality. Holdings designated as “Not Rated” (if any) are not rated by the national ratings agencies stated above. | |
| Material Fund Change [Text Block] |
|
| Updated Prospectus Phone Number |
1-800-262-1122
|
| C000063950 |
|
| Shareholder Report [Line Items] |
|
| Fund Name |
Eaton Vance North Carolina Municipal Income Fund
|
| Class Name |
Class I
|
| Trading Symbol |
EINCX
|
| Annual or Semi-Annual Statement [Text Block] |
This annual shareholder report contains important information about the Eaton Vance North Carolina Municipal Income Fund for the period of September 1, 2025 to August 31, 2026.
|
| Additional Information [Text Block] |
You can find additional information about the Fund at www.eatonvance.com/open-end-mutual-fund-documents.php. You can also request this information by contacting us at 1-800-262-1122.
|
| Additional Information Phone Number |
1-800-262-1122
|
| Additional Information Website |
<span style="box-sizing: border-box; color: rgb(0, 0, 0); display: inline; flex-wrap: nowrap; font-size: 10.6667px; font-weight: 400; grid-area: auto; line-height: 16px; margin: 0px; overflow: visible; text-align: left; text-align-last: auto; white-space-collapse: preserve-breaks;">www.eatonvance.com/open-end-mutual-fund-documents.php</span>
|
| Expenses [Text Block] |
What were the Fund costs for the last year?(based on a hypothetical $10,000 investment)
Table Summary
Class Name |
Costs of a $10,000 investment |
Costs paid as a percentage of a $10,000 investment |
Class I |
$52 |
0.51% | |
| Expenses Paid, Amount |
$ 52
|
| Expense Ratio, Percent |
0.51%
|
| Factors Affecting Performance [Text Block] |
How did the Fund perform last year and what affected its performance?Key contributors to (↑) and detractors from (↓) performance, relative to the Bloomberg Municipal Bond Index (the Index): ↑ An overweight exposure to and security selection in bonds with 22+ years to maturity contributed to performance ↑ An overweight exposure to and security selections in bonds with coupon rates between 4% and 4.99% helped returns ↑ Security selections in the water and sewer sectors also contributed to returns during the period ↓ An out-of-index allocation to variable-rate demand notes (VRDNs)—typically considered a defensive investment—detracted from returns ↓ Security selections in the leasing sector also detracted from fund performance during the period ↓ An underweight exposure to and security selections in A-rated bonds detracted from relative performance during the period |
| Performance Past Does Not Indicate Future [Text] |
THE FUND'S PAST PERFORMANCE IS NO GUARANTEE OF FUTURE RESULTS.
|
| Line Graph [Table Text Block] |
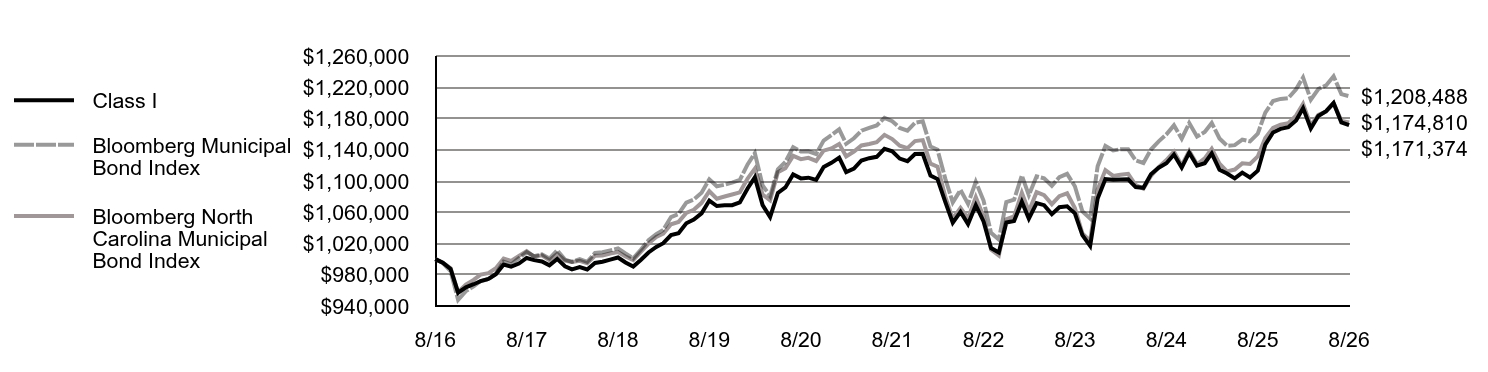
Table Summary
|
Class I |
Bloomberg Municipal Bond Index |
Bloomberg North Carolina Municipal Bond Index |
8/16 |
$1,000,000 |
$1,000,000 |
$1,000,000 |
9/16 |
$995,288 |
$995,009 |
$995,374 |
10/16 |
$987,340 |
$984,570 |
$988,191 |
11/16 |
$956,991 |
$947,850 |
$957,544 |
12/16 |
$963,981 |
$958,978 |
$967,367 |
1/17 |
$967,864 |
$965,300 |
$973,396 |
2/17 |
$971,767 |
$972,003 |
$980,249 |
3/17 |
$974,557 |
$974,113 |
$981,985 |
4/17 |
$980,609 |
$981,182 |
$988,349 |
5/17 |
$993,135 |
$996,754 |
$1,000,636 |
6/17 |
$990,477 |
$993,179 |
$997,596 |
7/17 |
$994,345 |
$1,001,214 |
$1,004,165 |
8/17 |
$1,001,455 |
$1,008,833 |
$1,010,095 |
9/17 |
$998,729 |
$1,003,704 |
$1,003,146 |
10/17 |
$997,012 |
$1,006,154 |
$1,004,849 |
11/17 |
$992,046 |
$1,000,767 |
$998,497 |
12/17 |
$1,000,297 |
$1,011,227 |
$1,006,700 |
1/18 |
$990,834 |
$999,322 |
$998,190 |
2/18 |
$986,937 |
$996,336 |
$996,228 |
3/18 |
$989,669 |
$1,000,013 |
$997,884 |
4/18 |
$986,752 |
$996,445 |
$994,839 |
5/18 |
$995,062 |
$1,007,855 |
$1,004,333 |
6/18 |
$996,694 |
$1,008,715 |
$1,004,751 |
7/18 |
$999,406 |
$1,011,163 |
$1,007,218 |
8/18 |
$1,002,119 |
$1,013,760 |
$1,008,988 |
9/18 |
$995,770 |
$1,007,197 |
$1,003,298 |
10/18 |
$990,517 |
$1,000,994 |
$998,653 |
11/18 |
$998,985 |
$1,012,073 |
$1,009,173 |
12/18 |
$1,008,548 |
$1,024,191 |
$1,019,918 |
1/19 |
$1,015,604 |
$1,031,933 |
$1,028,245 |
2/19 |
$1,020,348 |
$1,037,459 |
$1,032,503 |
3/19 |
$1,030,816 |
$1,053,858 |
$1,044,517 |
4/19 |
$1,033,199 |
$1,057,819 |
$1,047,629 |
5/19 |
$1,045,945 |
$1,072,403 |
$1,059,240 |
6/19 |
$1,050,508 |
$1,076,362 |
$1,063,093 |
7/19 |
$1,058,661 |
$1,085,037 |
$1,072,023 |
8/19 |
$1,074,973 |
$1,102,152 |
$1,086,884 |
9/19 |
$1,067,953 |
$1,093,317 |
$1,077,382 |
10/19 |
$1,069,044 |
$1,095,276 |
$1,080,117 |
11/19 |
$1,069,088 |
$1,098,016 |
$1,082,759 |
12/19 |
$1,072,659 |
$1,101,368 |
$1,085,501 |
1/20 |
$1,090,384 |
$1,121,156 |
$1,103,092 |
2/20 |
$1,104,604 |
$1,135,614 |
$1,115,776 |
3/20 |
$1,069,160 |
$1,094,422 |
$1,082,550 |
4/20 |
$1,053,836 |
$1,080,687 |
$1,075,315 |
5/20 |
$1,084,743 |
$1,115,065 |
$1,111,297 |
6/20 |
$1,091,799 |
$1,124,242 |
$1,116,276 |
7/20 |
$1,108,347 |
$1,143,177 |
$1,132,186 |
8/20 |
$1,103,355 |
$1,137,813 |
$1,127,934 |
9/20 |
$1,104,256 |
$1,138,054 |
$1,129,627 |
10/20 |
$1,101,459 |
$1,134,636 |
$1,125,661 |
11/20 |
$1,117,793 |
$1,151,758 |
$1,138,852 |
12/20 |
$1,123,257 |
$1,158,774 |
$1,141,762 |
1/21 |
$1,129,976 |
$1,166,159 |
$1,147,282 |
2/21 |
$1,111,464 |
$1,147,630 |
$1,131,375 |
3/21 |
$1,115,819 |
$1,154,708 |
$1,137,728 |
4/21 |
$1,126,264 |
$1,164,393 |
$1,145,518 |
5/21 |
$1,129,203 |
$1,167,867 |
$1,147,320 |
6/21 |
$1,130,983 |
$1,171,074 |
$1,149,562 |
7/21 |
$1,141,175 |
$1,180,786 |
$1,159,083 |
8/21 |
$1,137,975 |
$1,176,453 |
$1,153,727 |
9/21 |
$1,128,653 |
$1,167,963 |
$1,145,221 |
10/21 |
$1,125,407 |
$1,164,548 |
$1,142,105 |
11/21 |
$1,134,447 |
$1,174,461 |
$1,151,080 |
12/21 |
$1,134,840 |
$1,176,356 |
$1,152,378 |
1/22 |
$1,106,935 |
$1,144,156 |
$1,122,144 |
2/22 |
$1,102,488 |
$1,140,057 |
$1,118,222 |
3/22 |
$1,073,244 |
$1,103,100 |
$1,080,029 |
4/22 |
$1,046,509 |
$1,072,589 |
$1,051,886 |
5/22 |
$1,060,489 |
$1,088,522 |
$1,065,600 |
6/22 |
$1,044,875 |
$1,070,693 |
$1,052,004 |
7/22 |
$1,068,971 |
$1,098,983 |
$1,079,415 |
8/22 |
$1,048,357 |
$1,074,897 |
$1,054,498 |
9/22 |
$1,014,163 |
$1,033,642 |
$1,012,146 |
10/22 |
$1,008,591 |
$1,025,046 |
$1,004,535 |
11/22 |
$1,046,841 |
$1,072,991 |
$1,050,947 |
12/22 |
$1,048,847 |
$1,076,063 |
$1,054,802 |
1/23 |
$1,073,488 |
$1,106,973 |
$1,085,037 |
2/23 |
$1,051,864 |
$1,081,942 |
$1,061,234 |
3/23 |
$1,071,738 |
$1,105,948 |
$1,085,690 |
4/23 |
$1,069,042 |
$1,103,421 |
$1,081,827 |
5/23 |
$1,057,529 |
$1,093,859 |
$1,070,357 |
6/23 |
$1,066,362 |
$1,104,817 |
$1,080,549 |
7/23 |
$1,067,551 |
$1,109,187 |
$1,084,282 |
8/23 |
$1,058,675 |
$1,093,219 |
$1,065,316 |
9/23 |
$1,030,818 |
$1,061,178 |
$1,032,896 |
10/23 |
$1,016,988 |
$1,052,148 |
$1,023,371 |
11/23 |
$1,077,620 |
$1,118,940 |
$1,088,982 |
12/23 |
$1,102,444 |
$1,144,946 |
$1,113,942 |
1/24 |
$1,101,503 |
$1,139,098 |
$1,106,449 |
2/24 |
$1,101,856 |
$1,140,561 |
$1,107,899 |
3/24 |
$1,102,196 |
$1,140,525 |
$1,109,131 |
4/24 |
$1,092,180 |
$1,126,400 |
$1,094,788 |
5/24 |
$1,091,263 |
$1,123,096 |
$1,090,187 |
6/24 |
$1,108,717 |
$1,140,311 |
$1,106,383 |
7/24 |
$1,117,016 |
$1,150,704 |
$1,117,722 |
8/24 |
$1,122,782 |
$1,159,779 |
$1,126,876 |
9/24 |
$1,133,856 |
$1,171,242 |
$1,137,663 |
10/24 |
$1,117,182 |
$1,154,164 |
$1,119,909 |
11/24 |
$1,136,305 |
$1,174,101 |
$1,138,549 |
12/24 |
$1,119,558 |
$1,157,008 |
$1,121,404 |
1/25 |
$1,122,791 |
$1,162,807 |
$1,128,878 |
2/25 |
$1,135,277 |
$1,174,336 |
$1,141,235 |
3/25 |
$1,114,344 |
$1,154,434 |
$1,122,057 |
4/25 |
$1,109,555 |
$1,145,133 |
$1,112,279 |
5/25 |
$1,103,328 |
$1,145,869 |
$1,114,637 |
6/25 |
$1,110,703 |
$1,153,002 |
$1,122,607 |
7/25 |
$1,104,432 |
$1,150,674 |
$1,121,846 |
8/25 |
$1,113,146 |
$1,160,675 |
$1,131,395 |
9/25 |
$1,146,519 |
$1,187,554 |
$1,155,093 |
10/25 |
$1,162,081 |
$1,202,283 |
$1,167,880 |
11/25 |
$1,166,747 |
$1,205,041 |
$1,171,978 |
12/25 |
$1,168,855 |
$1,206,125 |
$1,173,887 |
1/26 |
$1,177,538 |
$1,217,445 |
$1,183,678 |
2/26 |
$1,193,263 |
$1,232,618 |
$1,198,717 |
3/26 |
$1,167,349 |
$1,203,989 |
$1,171,057 |
4/26 |
$1,183,284 |
$1,217,775 |
$1,184,635 |
5/26 |
$1,189,425 |
$1,222,322 |
$1,188,928 |
6/26 |
$1,199,806 |
$1,234,103 |
$1,199,696 |
7/26 |
$1,175,109 |
$1,211,258 |
$1,177,005 |
8/26 |
$1,171,374 |
$1,208,488 |
$1,174,810 |
|
| Average Annual Return [Table Text Block] |
Table Summary
Fund |
1 Year |
5 Years |
10 Years |
Class I |
5.23% |
0.58% |
1.59% |
Bloomberg Municipal Bond Index |
4.12% |
0.54% |
1.91% |
Bloomberg North Carolina Municipal Bond Index |
3.84% |
0.36% |
1.62% | |
| No Deduction of Taxes [Text Block] |
Performance does not reflect the deduction of taxes that a shareholder would pay on Fund distributions or redemption of Fund shares.
|
| Updated Performance Information Location [Text Block] |
For more recent performance information, visit www.eatonvance.com/performance.php.
|
| AssetsNet |
$ 273,604,238
|
| Holdings Count | Holding |
234
|
| Advisory Fees Paid, Amount |
$ 985,064
|
| InvestmentCompanyPortfolioTurnover |
68.00%
|
| Additional Fund Statistics [Text Block] |
Table Summary
Total Net Assets |
$273,604,238 |
# of Portfolio Holdings |
234 |
Portfolio Turnover Rate |
68% |
Total Advisory Fees Paid |
$985,064 | |
| Holdings [Text Block] |
Sector Allocation (% of total investments)
Table Summary
Value |
Value |
OtherFootnote Reference* |
4.7% |
Electric Utilities |
3.6% |
Short-Term Investments |
4.2% |
General Obligations |
7.0% |
Housing |
8.2% |
Senior Living/Life Care |
8.3% |
Transportation |
10.7% |
Education |
10.9% |
Hospital |
12.7% |
Lease Rev./Cert. of Participation |
14.5% |
Water and Sewer |
15.2% |
| Footnote |
Description |
Footnote* |
Sectors less than 3% each. | |
| Credit Quality Explanation [Text Block] |
Credit Quality (% of total investments)Footnote Referencea
Table Summary
Value |
Value |
NR |
5.2% |
BB |
0.2% |
BBB |
6.8% |
A |
5.1% |
AA |
64.1% |
AAA |
18.6% |
| Footnote |
Description |
Footnotea |
Ratings are based on Moody’s Investors Service, Inc. (“Moody’s”), S&P Global Ratings (“S&P”) or Fitch Ratings (“Fitch”). If securities are rated differently by the ratings agencies, the highest rating is applied. Moody's ratings are converted to the S&P and Fitch scale with ratings ranging from AAA, being the highest, to D, being the lowest. Ratings of BBB or higher are considered to be investment-grade quality. Holdings designated as “Not Rated” (if any) are not rated by the national ratings agencies stated above. | |
| Material Fund Change [Text Block] |
|
| Updated Prospectus Phone Number |
1-800-262-1122
|
| C000013142 |
|
| Shareholder Report [Line Items] |
|
| Fund Name |
Eaton Vance Oregon Municipal Income Fund
|
| Class Name |
Class A
|
| Trading Symbol |
ETORX
|
| Annual or Semi-Annual Statement [Text Block] |
This annual shareholder report contains important information about the Eaton Vance Oregon Municipal Income Fund for the period of September 1, 2025 to August 31, 2026.
|
| Additional Information [Text Block] |
You can find additional information about the Fund at www.eatonvance.com/open-end-mutual-fund-documents.php. You can also request this information by contacting us at 1-800-262-1122.
|
| Additional Information Phone Number |
1-800-262-1122
|
| Additional Information Website |
<span style="box-sizing: border-box; color: rgb(0, 0, 0); display: inline; flex-wrap: nowrap; font-size: 10.6667px; font-weight: 400; grid-area: auto; line-height: 16px; margin: 0px; overflow: visible; text-align: left; text-align-last: auto; white-space-collapse: preserve-breaks;">www.eatonvance.com/open-end-mutual-fund-documents.php</span>
|
| Expenses [Text Block] |
What were the Fund costs for the last year?(based on a hypothetical $10,000 investment)
Table Summary
Class Name |
Costs of a $10,000 investment |
Costs paid as a percentage of a $10,000 investment |
Class A |
$73 |
0.71% | |
| Expenses Paid, Amount |
$ 73
|
| Expense Ratio, Percent |
0.71%
|
| Factors Affecting Performance [Text Block] |
How did the Fund perform last year and what affected its performance?Key contributors to (↑) and detractors from (↓) performance, relative to the Bloomberg Municipal Bond Index (the Index): ↑ An overweight exposure to and security selection in bonds with maturities of 17 to 22 years contributed to index-relative returns during the period ↑ Security selections in the local general obligation (GO) sector also contributed to returns during the period ↑ Security selections in AA-rated bonds contributed to relative performance ↓ An out-of-index allocation to variable-rate demand notes (VRDNs)—typically considered a defensive investment—detracted from returns during the period ↓ An underweight allocation to the transportation sector, which outperformed the index, also detracted from returns ↓ An underweight exposure to and security selection in bonds with coupon rates between 4% and 4.99% detracted from performance during the period |
| Performance Past Does Not Indicate Future [Text] |
THE FUND'S PAST PERFORMANCE IS NO GUARANTEE OF FUTURE RESULTS.
|
| Line Graph [Table Text Block] |
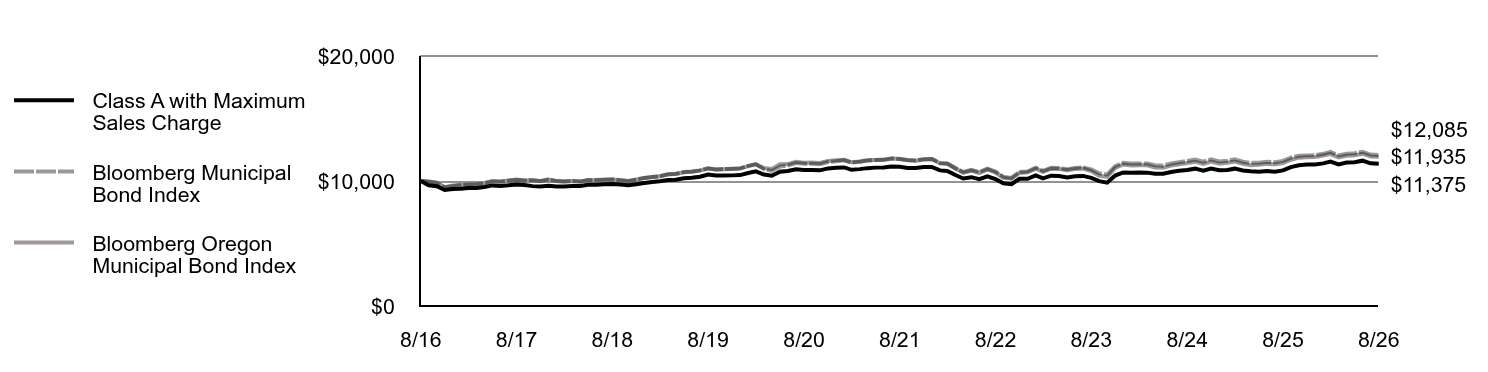
Table Summary
|
Class A with Maximum Sales Charge |
Bloomberg Municipal Bond Index |
Bloomberg Oregon Municipal Bond Index |
8/16 |
$10,000 |
$10,000 |
$10,000 |
9/16 |
$9,659 |
$9,950 |
$9,960 |
10/16 |
$9,579 |
$9,846 |
$9,873 |
11/16 |
$9,282 |
$9,479 |
$9,509 |
12/16 |
$9,353 |
$9,590 |
$9,637 |
1/17 |
$9,381 |
$9,653 |
$9,698 |
2/17 |
$9,432 |
$9,720 |
$9,757 |
3/17 |
$9,449 |
$9,741 |
$9,776 |
4/17 |
$9,521 |
$9,812 |
$9,845 |
5/17 |
$9,648 |
$9,968 |
$9,997 |
6/17 |
$9,610 |
$9,932 |
$9,963 |
7/17 |
$9,651 |
$10,012 |
$10,047 |
8/17 |
$9,712 |
$10,088 |
$10,111 |
9/17 |
$9,685 |
$10,037 |
$10,044 |
10/17 |
$9,590 |
$10,062 |
$10,065 |
11/17 |
$9,563 |
$10,008 |
$9,989 |
12/17 |
$9,615 |
$10,112 |
$10,109 |
1/18 |
$9,564 |
$9,993 |
$9,992 |
2/18 |
$9,559 |
$9,963 |
$9,952 |
3/18 |
$9,600 |
$10,000 |
$9,990 |
4/18 |
$9,594 |
$9,964 |
$9,952 |
5/18 |
$9,692 |
$10,079 |
$10,056 |
6/18 |
$9,698 |
$10,087 |
$10,070 |
7/18 |
$9,748 |
$10,112 |
$10,087 |
8/18 |
$9,753 |
$10,138 |
$10,114 |
9/18 |
$9,711 |
$10,072 |
$10,046 |
10/18 |
$9,658 |
$10,010 |
$9,984 |
11/18 |
$9,743 |
$10,121 |
$10,109 |
12/18 |
$9,839 |
$10,242 |
$10,240 |
1/19 |
$9,924 |
$10,319 |
$10,324 |
2/19 |
$9,974 |
$10,375 |
$10,375 |
3/19 |
$10,080 |
$10,539 |
$10,526 |
4/19 |
$10,104 |
$10,578 |
$10,560 |
5/19 |
$10,222 |
$10,724 |
$10,700 |
6/19 |
$10,256 |
$10,764 |
$10,744 |
7/19 |
$10,337 |
$10,850 |
$10,828 |
8/19 |
$10,513 |
$11,022 |
$11,006 |
9/19 |
$10,441 |
$10,933 |
$10,904 |
10/19 |
$10,439 |
$10,953 |
$10,931 |
11/19 |
$10,450 |
$10,980 |
$10,964 |
12/19 |
$10,474 |
$11,014 |
$10,990 |
1/20 |
$10,641 |
$11,212 |
$11,190 |
2/20 |
$10,774 |
$11,356 |
$11,328 |
3/20 |
$10,520 |
$10,944 |
$11,032 |
4/20 |
$10,423 |
$10,807 |
$10,961 |
5/20 |
$10,737 |
$11,151 |
$11,334 |
6/20 |
$10,797 |
$11,242 |
$11,351 |
7/20 |
$10,940 |
$11,432 |
$11,535 |
8/20 |
$10,888 |
$11,378 |
$11,469 |
9/20 |
$10,883 |
$11,381 |
$11,472 |
10/20 |
$10,853 |
$11,346 |
$11,441 |
11/20 |
$11,007 |
$11,518 |
$11,605 |
12/20 |
$11,060 |
$11,588 |
$11,652 |
1/21 |
$11,088 |
$11,662 |
$11,699 |
2/21 |
$10,896 |
$11,476 |
$11,495 |
3/21 |
$10,950 |
$11,547 |
$11,561 |
4/21 |
$11,029 |
$11,644 |
$11,652 |
5/21 |
$11,070 |
$11,679 |
$11,684 |
6/21 |
$11,086 |
$11,711 |
$11,687 |
7/21 |
$11,164 |
$11,808 |
$11,798 |
8/21 |
$11,131 |
$11,765 |
$11,763 |
9/21 |
$11,049 |
$11,680 |
$11,655 |
10/21 |
$11,040 |
$11,645 |
$11,625 |
11/21 |
$11,118 |
$11,745 |
$11,723 |
12/21 |
$11,122 |
$11,764 |
$11,752 |
1/22 |
$10,850 |
$11,442 |
$11,410 |
2/22 |
$10,805 |
$11,401 |
$11,377 |
3/22 |
$10,482 |
$11,031 |
$10,994 |
4/22 |
$10,199 |
$10,726 |
$10,656 |
5/22 |
$10,306 |
$10,885 |
$10,827 |
6/22 |
$10,148 |
$10,707 |
$10,639 |
7/22 |
$10,369 |
$10,990 |
$10,931 |
8/22 |
$10,147 |
$10,749 |
$10,680 |
9/22 |
$9,811 |
$10,336 |
$10,261 |
10/22 |
$9,744 |
$10,250 |
$10,183 |
11/22 |
$10,177 |
$10,730 |
$10,647 |
12/22 |
$10,178 |
$10,761 |
$10,701 |
1/23 |
$10,448 |
$11,070 |
$10,990 |
2/23 |
$10,206 |
$10,819 |
$10,741 |
3/23 |
$10,426 |
$11,059 |
$10,986 |
4/23 |
$10,402 |
$11,034 |
$10,969 |
5/23 |
$10,286 |
$10,939 |
$10,857 |
6/23 |
$10,378 |
$11,048 |
$10,960 |
7/23 |
$10,406 |
$11,092 |
$10,990 |
8/23 |
$10,251 |
$10,932 |
$10,789 |
9/23 |
$9,992 |
$10,612 |
$10,418 |
10/23 |
$9,863 |
$10,521 |
$10,327 |
11/23 |
$10,433 |
$11,189 |
$11,047 |
12/23 |
$10,687 |
$11,449 |
$11,320 |
1/24 |
$10,663 |
$11,391 |
$11,250 |
2/24 |
$10,679 |
$11,406 |
$11,260 |
3/24 |
$10,669 |
$11,405 |
$11,263 |
4/24 |
$10,578 |
$11,264 |
$11,088 |
5/24 |
$10,581 |
$11,231 |
$11,065 |
6/24 |
$10,719 |
$11,403 |
$11,231 |
7/24 |
$10,817 |
$11,507 |
$11,337 |
8/24 |
$10,874 |
$11,598 |
$11,434 |
9/24 |
$10,987 |
$11,712 |
$11,545 |
10/24 |
$10,827 |
$11,542 |
$11,359 |
11/24 |
$10,994 |
$11,741 |
$11,557 |
12/24 |
$10,861 |
$11,570 |
$11,376 |
1/25 |
$10,877 |
$11,628 |
$11,453 |
2/25 |
$10,987 |
$11,743 |
$11,560 |
3/25 |
$10,839 |
$11,544 |
$11,378 |
4/25 |
$10,788 |
$11,451 |
$11,265 |
5/25 |
$10,750 |
$11,459 |
$11,294 |
6/25 |
$10,809 |
$11,530 |
$11,369 |
7/25 |
$10,743 |
$11,507 |
$11,333 |
8/25 |
$10,845 |
$11,607 |
$11,431 |
9/25 |
$11,115 |
$11,876 |
$11,704 |
10/25 |
$11,259 |
$12,023 |
$11,866 |
11/25 |
$11,319 |
$12,050 |
$11,900 |
12/25 |
$11,323 |
$12,061 |
$11,918 |
1/26 |
$11,409 |
$12,174 |
$12,038 |
2/26 |
$11,555 |
$12,326 |
$12,169 |
3/26 |
$11,329 |
$12,040 |
$11,887 |
4/26 |
$11,476 |
$12,178 |
$12,020 |
5/26 |
$11,507 |
$12,223 |
$12,064 |
6/26 |
$11,626 |
$12,341 |
$12,183 |
7/26 |
$11,414 |
$12,113 |
$11,963 |
8/26 |
$11,375 |
$12,085 |
$11,935 |
|
| Average Annual Return [Table Text Block] |
Table Summary
Fund |
1 Year |
5 Years |
10 Years |
Class A |
4.86% |
0.43% |
1.63% |
Class A with 3.25% Maximum Sales Charge |
1.45% |
(0.23)% |
1.30% |
Bloomberg Municipal Bond Index |
4.12% |
0.54% |
1.91% |
Bloomberg Oregon Municipal Bond Index |
4.41% |
0.29% |
1.78% | |
| No Deduction of Taxes [Text Block] |
Performance does not reflect the deduction of taxes that a shareholder would pay on Fund distributions or redemption of Fund shares.
|
| Updated Performance Information Location [Text Block] |
For more recent performance information, visit www.eatonvance.com/performance.php.
|
| AssetsNet |
$ 285,047,186
|
| Holdings Count | Holding |
197
|
| Advisory Fees Paid, Amount |
$ 986,453
|
| InvestmentCompanyPortfolioTurnover |
42.00%
|
| Additional Fund Statistics [Text Block] |
Table Summary
Total Net Assets |
$285,047,186 |
# of Portfolio Holdings |
197 |
Portfolio Turnover Rate |
42% |
Total Advisory Fees Paid |
$986,453 | |
| Holdings [Text Block] |
Sector Allocation (% of total investments)
Table Summary
Value |
Value |
OtherFootnote Reference* |
4.1% |
Housing |
4.7% |
Electric Utilities |
4.7% |
Special Tax Revenue |
4.8% |
Transportation |
5.0% |
Education |
6.4% |
Water and Sewer |
10.1% |
Hospital |
10.5% |
General Obligations |
49.7% |
| Footnote |
Description |
Footnote* |
Sectors less than 3% each. | |
| Credit Quality Explanation [Text Block] |
Credit Quality (% of total investments)Footnote Referencea
Table Summary
Value |
Value |
NR |
2.7% |
BB |
1.7% |
BBB |
3.1% |
A |
5.0% |
AA |
80.7% |
AAA |
6.8% |
| Footnote |
Description |
Footnotea |
Ratings are based on Moody’s Investors Service, Inc. (“Moody’s”), S&P Global Ratings (“S&P”) or Fitch Ratings (“Fitch”). If securities are rated differently by the ratings agencies, the highest rating is applied. Moody's ratings are converted to the S&P and Fitch scale with ratings ranging from AAA, being the highest, to D, being the lowest. Ratings of BBB or higher are considered to be investment-grade quality. Holdings designated as “Not Rated” (if any) are not rated by the national ratings agencies stated above. | |
| Material Fund Change [Text Block] |
|
| Updated Prospectus Phone Number |
1-800-262-1122
|
| C000013144 |
|
| Shareholder Report [Line Items] |
|
| Fund Name |
Eaton Vance Oregon Municipal Income Fund
|
| Class Name |
Class C
|
| Trading Symbol |
ECORX
|
| Annual or Semi-Annual Statement [Text Block] |
This annual shareholder report contains important information about the Eaton Vance Oregon Municipal Income Fund for the period of September 1, 2025 to August 31, 2026.
|
| Additional Information [Text Block] |
You can find additional information about the Fund at www.eatonvance.com/open-end-mutual-fund-documents.php. You can also request this information by contacting us at 1-800-262-1122.
|
| Additional Information Phone Number |
1-800-262-1122
|
| Additional Information Website |
<span style="box-sizing: border-box; color: rgb(0, 0, 0); display: inline; flex-wrap: nowrap; font-size: 10.6667px; font-weight: 400; grid-area: auto; line-height: 16px; margin: 0px; overflow: visible; text-align: left; text-align-last: auto; white-space-collapse: preserve-breaks;">www.eatonvance.com/open-end-mutual-fund-documents.php</span>
|
| Expenses [Text Block] |
What were the Fund costs for the last year?(based on a hypothetical $10,000 investment)
Table Summary
Class Name |
Costs of a $10,000 investment |
Costs paid as a percentage of a $10,000 investment |
Class C |
$149 |
1.46% | |
| Expenses Paid, Amount |
$ 149
|
| Expense Ratio, Percent |
1.46%
|
| Factors Affecting Performance [Text Block] |
How did the Fund perform last year and what affected its performance?Key contributors to (↑) and detractors from (↓) performance, relative to the Bloomberg Municipal Bond Index (the Index): ↓ An out-of-index allocation to variable-rate demand notes (VRDNs)—typically considered a defensive investment—detracted from returns during the period ↓ An underweight allocation to the transportation sector, which outperformed the index, also detracted from returns ↓ An underweight exposure to and security selection in bonds with coupon rates between 4% and 4.99% detracted from performance during the period ↑ An overweight exposure to and security selection in bonds with maturities of 17 to 22 years contributed to index-relative returns during the period ↑ Security selections in the local general obligation (GO) sector also contributed to returns during the period ↑ Security selections in AA-rated bonds contributed to relative performance |
| Performance Past Does Not Indicate Future [Text] |
THE FUND'S PAST PERFORMANCE IS NO GUARANTEE OF FUTURE RESULTS.
|
| Line Graph [Table Text Block] |
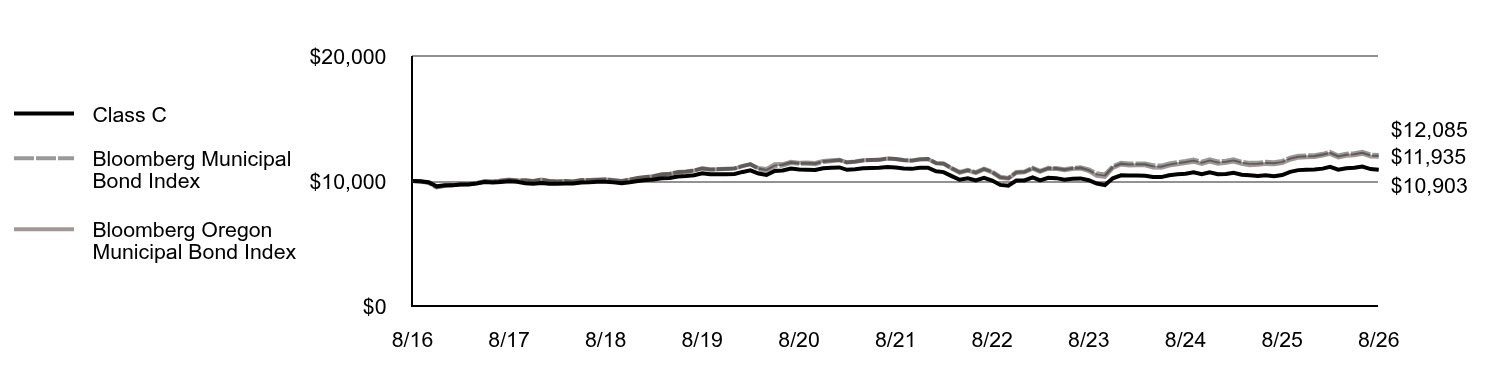
Table Summary
|
Class C |
Bloomberg Municipal Bond Index |
Bloomberg Oregon Municipal Bond Index |
8/16 |
$10,000 |
$10,000 |
$10,000 |
9/16 |
$9,982 |
$9,950 |
$9,960 |
10/16 |
$9,902 |
$9,846 |
$9,873 |
11/16 |
$9,577 |
$9,479 |
$9,509 |
12/16 |
$9,651 |
$9,590 |
$9,637 |
1/17 |
$9,664 |
$9,653 |
$9,698 |
2/17 |
$9,718 |
$9,720 |
$9,757 |
3/17 |
$9,721 |
$9,741 |
$9,776 |
4/17 |
$9,795 |
$9,812 |
$9,845 |
5/17 |
$9,911 |
$9,968 |
$9,997 |
6/17 |
$9,872 |
$9,932 |
$9,963 |
7/17 |
$9,918 |
$10,012 |
$10,047 |
8/17 |
$9,970 |
$10,088 |
$10,111 |
9/17 |
$9,931 |
$10,037 |
$10,044 |
10/17 |
$9,828 |
$10,062 |
$10,065 |
11/17 |
$9,788 |
$10,008 |
$9,989 |
12/17 |
$9,843 |
$10,112 |
$10,109 |
1/18 |
$9,782 |
$9,993 |
$9,992 |
2/18 |
$9,775 |
$9,963 |
$9,952 |
3/18 |
$9,808 |
$10,000 |
$9,990 |
4/18 |
$9,800 |
$9,964 |
$9,952 |
5/18 |
$9,887 |
$10,079 |
$10,056 |
6/18 |
$9,890 |
$10,087 |
$10,070 |
7/18 |
$9,932 |
$10,112 |
$10,087 |
8/18 |
$9,944 |
$10,138 |
$10,114 |
9/18 |
$9,890 |
$10,072 |
$10,046 |
10/18 |
$9,826 |
$10,010 |
$9,984 |
11/18 |
$9,901 |
$10,121 |
$10,109 |
12/18 |
$9,998 |
$10,242 |
$10,240 |
1/19 |
$10,073 |
$10,319 |
$10,324 |
2/19 |
$10,115 |
$10,375 |
$10,375 |
3/19 |
$10,220 |
$10,539 |
$10,526 |
4/19 |
$10,249 |
$10,578 |
$10,560 |
5/19 |
$10,353 |
$10,724 |
$10,700 |
6/19 |
$10,391 |
$10,764 |
$10,744 |
7/19 |
$10,462 |
$10,850 |
$10,828 |
8/19 |
$10,620 |
$11,022 |
$11,006 |
9/19 |
$10,537 |
$10,933 |
$10,904 |
10/19 |
$10,531 |
$10,953 |
$10,931 |
11/19 |
$10,537 |
$10,980 |
$10,964 |
12/19 |
$10,565 |
$11,014 |
$10,990 |
1/20 |
$10,726 |
$11,212 |
$11,190 |
2/20 |
$10,854 |
$11,356 |
$11,328 |
3/20 |
$10,594 |
$10,944 |
$11,032 |
4/20 |
$10,478 |
$10,807 |
$10,961 |
5/20 |
$10,795 |
$11,151 |
$11,334 |
6/20 |
$10,845 |
$11,242 |
$11,351 |
7/20 |
$10,994 |
$11,432 |
$11,535 |
8/20 |
$10,919 |
$11,378 |
$11,469 |
9/20 |
$10,909 |
$11,381 |
$11,472 |
10/20 |
$10,877 |
$11,346 |
$11,441 |
11/20 |
$11,023 |
$11,518 |
$11,605 |
12/20 |
$11,066 |
$11,588 |
$11,652 |
1/21 |
$11,087 |
$11,662 |
$11,699 |
2/21 |
$10,894 |
$11,476 |
$11,495 |
3/21 |
$10,938 |
$11,547 |
$11,561 |
4/21 |
$11,017 |
$11,644 |
$11,652 |
5/21 |
$11,048 |
$11,679 |
$11,684 |
6/21 |
$11,058 |
$11,711 |
$11,687 |
7/21 |
$11,123 |
$11,808 |
$11,798 |
8/21 |
$11,087 |
$11,765 |
$11,763 |
9/21 |
$10,996 |
$11,680 |
$11,655 |
10/21 |
$10,971 |
$11,645 |
$11,625 |
11/21 |
$11,059 |
$11,745 |
$11,723 |
12/21 |
$11,057 |
$11,764 |
$11,752 |
1/22 |
$10,771 |
$11,442 |
$11,410 |
2/22 |
$10,713 |
$11,401 |
$11,377 |
3/22 |
$10,393 |
$11,031 |
$10,994 |
4/22 |
$10,098 |
$10,726 |
$10,656 |
5/22 |
$10,213 |
$10,885 |
$10,827 |
6/22 |
$10,043 |
$10,707 |
$10,639 |
7/22 |
$10,249 |
$10,990 |
$10,931 |
8/22 |
$10,031 |
$10,749 |
$10,680 |
9/22 |
$9,689 |
$10,336 |
$10,261 |
10/22 |
$9,625 |
$10,250 |
$10,183 |
11/22 |
$10,035 |
$10,730 |
$10,647 |
12/22 |
$10,043 |
$10,761 |
$10,701 |
1/23 |
$10,293 |
$11,070 |
$10,990 |
2/23 |
$10,049 |
$10,819 |
$10,741 |
3/23 |
$10,254 |
$11,059 |
$10,986 |
4/23 |
$10,228 |
$11,034 |
$10,969 |
5/23 |
$10,108 |
$10,939 |
$10,857 |
6/23 |
$10,187 |
$11,048 |
$10,960 |
7/23 |
$10,208 |
$11,092 |
$10,990 |
8/23 |
$10,065 |
$10,932 |
$10,789 |
9/23 |
$9,794 |
$10,612 |
$10,418 |
10/23 |
$9,675 |
$10,521 |
$10,327 |
11/23 |
$10,216 |
$11,189 |
$11,047 |
12/23 |
$10,451 |
$11,449 |
$11,320 |
1/24 |
$10,438 |
$11,391 |
$11,250 |
2/24 |
$10,436 |
$11,406 |
$11,260 |
3/24 |
$10,423 |
$11,405 |
$11,263 |
4/24 |
$10,327 |
$11,264 |
$11,088 |
5/24 |
$10,313 |
$11,231 |
$11,065 |
6/24 |
$10,456 |
$11,403 |
$11,231 |
7/24 |
$10,539 |
$11,507 |
$11,337 |
8/24 |
$10,586 |
$11,598 |
$11,434 |
9/24 |
$10,694 |
$11,712 |
$11,545 |
10/24 |
$10,536 |
$11,542 |
$11,359 |
11/24 |
$10,693 |
$11,741 |
$11,557 |
12/24 |
$10,546 |
$11,570 |
$11,376 |
1/25 |
$10,556 |
$11,628 |
$11,453 |
2/25 |
$10,662 |
$11,743 |
$11,560 |
3/25 |
$10,502 |
$11,544 |
$11,378 |
4/25 |
$10,453 |
$11,451 |
$11,265 |
5/25 |
$10,403 |
$11,459 |
$11,294 |
6/25 |
$10,452 |
$11,530 |
$11,369 |
7/25 |
$10,389 |
$11,507 |
$11,333 |
8/25 |
$10,476 |
$11,607 |
$11,431 |
9/25 |
$10,735 |
$11,876 |
$11,704 |
10/25 |
$10,870 |
$12,023 |
$11,866 |
11/25 |
$10,906 |
$12,050 |
$11,900 |
12/25 |
$10,918 |
$12,061 |
$11,918 |
1/26 |
$10,990 |
$12,174 |
$12,038 |
2/26 |
$11,126 |
$12,326 |
$12,169 |
3/26 |
$10,899 |
$12,040 |
$11,887 |
4/26 |
$11,023 |
$12,178 |
$12,020 |
5/26 |
$11,059 |
$12,223 |
$12,064 |
6/26 |
$11,159 |
$12,341 |
$12,183 |
7/26 |
$10,956 |
$12,113 |
$11,963 |
8/26 |
$10,903 |
$12,085 |
$11,935 |
|
| Average Annual Return [Table Text Block] |
Table Summary
Fund |
1 Year |
5 Years |
10 Years |
Class C, with conversion to Class A after 8 years |
4.08% |
(0.33)% |
0.87% |
Class C, with 1% Maximum Contingent Deferred Sales Charge and conversion to Class A after 8 years |
3.08% |
(0.33)% |
0.87% |
Bloomberg Municipal Bond Index |
4.12% |
0.54% |
1.91% |
Bloomberg Oregon Municipal Bond Index |
4.41% |
0.29% |
1.78% | |
| No Deduction of Taxes [Text Block] |
Performance does not reflect the deduction of taxes that a shareholder would pay on Fund distributions or redemption of Fund shares.
|
| Updated Performance Information Location [Text Block] |
For more recent performance information, visit www.eatonvance.com/performance.php.
|
| AssetsNet |
$ 285,047,186
|
| Holdings Count | Holding |
197
|
| Advisory Fees Paid, Amount |
$ 986,453
|
| InvestmentCompanyPortfolioTurnover |
42.00%
|
| Additional Fund Statistics [Text Block] |
Table Summary
Total Net Assets |
$285,047,186 |
# of Portfolio Holdings |
197 |
Portfolio Turnover Rate |
42% |
Total Advisory Fees Paid |
$986,453 | |
| Holdings [Text Block] |
Sector Allocation (% of total investments)
Table Summary
Value |
Value |
OtherFootnote Reference* |
4.1% |
Housing |
4.7% |
Electric Utilities |
4.7% |
Special Tax Revenue |
4.8% |
Transportation |
5.0% |
Education |
6.4% |
Water and Sewer |
10.1% |
Hospital |
10.5% |
General Obligations |
49.7% |
| Footnote |
Description |
Footnote* |
Sectors less than 3% each. | |
| Credit Quality Explanation [Text Block] |
Credit Quality (% of total investments)Footnote Referencea
Table Summary
Value |
Value |
NR |
2.7% |
BB |
1.7% |
BBB |
3.1% |
A |
5.0% |
AA |
80.7% |
AAA |
6.8% |
| Footnote |
Description |
Footnotea |
Ratings are based on Moody’s Investors Service, Inc. (“Moody’s”), S&P Global Ratings (“S&P”) or Fitch Ratings (“Fitch”). If securities are rated differently by the ratings agencies, the highest rating is applied. Moody's ratings are converted to the S&P and Fitch scale with ratings ranging from AAA, being the highest, to D, being the lowest. Ratings of BBB or higher are considered to be investment-grade quality. Holdings designated as “Not Rated” (if any) are not rated by the national ratings agencies stated above. | |
| Material Fund Change [Text Block] |
|
| Updated Prospectus Phone Number |
1-800-262-1122
|
| C000092722 |
|
| Shareholder Report [Line Items] |
|
| Fund Name |
Eaton Vance Oregon Municipal Income Fund
|
| Class Name |
Class I
|
| Trading Symbol |
EIORX
|
| Annual or Semi-Annual Statement [Text Block] |
This annual shareholder report contains important information about the Eaton Vance Oregon Municipal Income Fund for the period of September 1, 2025 to August 31, 2026.
|
| Additional Information [Text Block] |
You can find additional information about the Fund at www.eatonvance.com/open-end-mutual-fund-documents.php. You can also request this information by contacting us at 1-800-262-1122.
|
| Additional Information Phone Number |
1-800-262-1122
|
| Additional Information Website |
<span style="box-sizing: border-box; color: rgb(0, 0, 0); display: inline; flex-wrap: nowrap; font-size: 10.6667px; font-weight: 400; grid-area: auto; line-height: 16px; margin: 0px; overflow: visible; text-align: left; text-align-last: auto; white-space-collapse: preserve-breaks;">www.eatonvance.com/open-end-mutual-fund-documents.php</span>
|
| Expenses [Text Block] |
What were the Fund costs for the last year?(based on a hypothetical $10,000 investment)
Table Summary
Class Name |
Costs of a $10,000 investment |
Costs paid as a percentage of a $10,000 investment |
Class I |
$52 |
0.51% | |
| Expenses Paid, Amount |
$ 52
|
| Expense Ratio, Percent |
0.51%
|
| Factors Affecting Performance [Text Block] |
How did the Fund perform last year and what affected its performance?Key contributors to (↑) and detractors from (↓) performance, relative to the Bloomberg Municipal Bond Index (the Index): ↑ An overweight exposure to and security selection in bonds with maturities of 17 to 22 years contributed to index-relative returns during the period ↑ Security selections in the local general obligation (GO) sector also contributed to returns during the period ↑ Security selections in AA-rated bonds contributed to relative performance ↓ An out-of-index allocation to variable-rate demand notes (VRDNs)—typically considered a defensive investment—detracted from returns during the period ↓ An underweight allocation to the transportation sector, which outperformed the index, also detracted from returns ↓ An underweight exposure to and security selection in bonds with coupon rates between 4% and 4.99% detracted from performance during the period |
| Performance Past Does Not Indicate Future [Text] |
THE FUND'S PAST PERFORMANCE IS NO GUARANTEE OF FUTURE RESULTS.
|
| Line Graph [Table Text Block] |
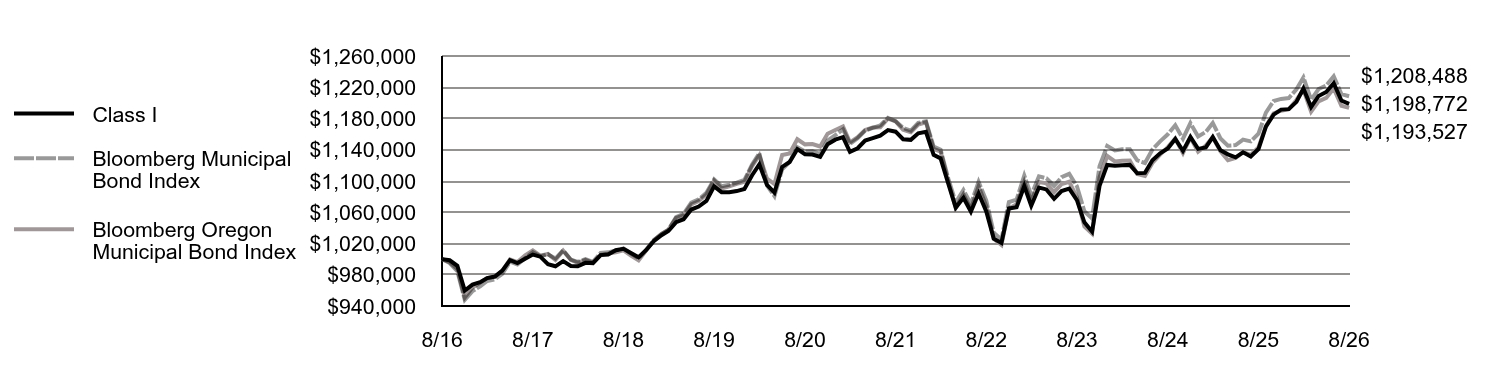
Table Summary
|
Class I |
Bloomberg Municipal Bond Index |
Bloomberg Oregon Municipal Bond Index |
8/16 |
$1,000,000 |
$1,000,000 |
$1,000,000 |
9/16 |
$998,547 |
$995,009 |
$996,043 |
10/16 |
$991,478 |
$984,570 |
$987,286 |
11/16 |
$959,767 |
$947,850 |
$950,907 |
12/16 |
$967,304 |
$958,978 |
$963,740 |
1/17 |
$970,386 |
$965,300 |
$969,843 |
2/17 |
$975,748 |
$972,003 |
$975,683 |
3/17 |
$977,717 |
$974,113 |
$977,639 |
4/17 |
$985,347 |
$981,182 |
$984,536 |
5/17 |
$998,709 |
$996,754 |
$999,700 |
6/17 |
$994,935 |
$993,179 |
$996,301 |
7/17 |
$1,000,432 |
$1,001,214 |
$1,004,674 |
8/17 |
$1,005,812 |
$1,008,833 |
$1,011,067 |
9/17 |
$1,003,140 |
$1,003,704 |
$1,004,390 |
10/17 |
$993,501 |
$1,006,154 |
$1,006,535 |
11/17 |
$990,834 |
$1,000,767 |
$998,947 |
12/17 |
$997,520 |
$1,011,227 |
$1,010,875 |
1/18 |
$991,295 |
$999,322 |
$999,194 |
2/18 |
$990,937 |
$996,336 |
$995,176 |
3/18 |
$995,277 |
$1,000,013 |
$999,041 |
4/18 |
$994,887 |
$996,445 |
$995,173 |
5/18 |
$1,005,190 |
$1,007,855 |
$1,005,564 |
6/18 |
$1,006,015 |
$1,008,715 |
$1,007,007 |
7/18 |
$1,011,355 |
$1,011,163 |
$1,008,744 |
8/18 |
$1,013,227 |
$1,013,760 |
$1,011,352 |
9/18 |
$1,007,860 |
$1,007,197 |
$1,004,611 |
10/18 |
$1,002,437 |
$1,000,994 |
$998,371 |
11/18 |
$1,011,431 |
$1,012,073 |
$1,010,924 |
12/18 |
$1,022,880 |
$1,024,191 |
$1,024,027 |
1/19 |
$1,030,656 |
$1,031,933 |
$1,032,384 |
2/19 |
$1,035,943 |
$1,037,459 |
$1,037,544 |
3/19 |
$1,047,230 |
$1,053,858 |
$1,052,626 |
4/19 |
$1,051,067 |
$1,057,819 |
$1,055,983 |
5/19 |
$1,063,479 |
$1,072,403 |
$1,070,005 |
6/19 |
$1,067,217 |
$1,076,362 |
$1,074,436 |
7/19 |
$1,074,613 |
$1,085,037 |
$1,082,760 |
8/19 |
$1,093,160 |
$1,102,152 |
$1,100,620 |
9/19 |
$1,085,754 |
$1,093,317 |
$1,090,413 |
10/19 |
$1,085,744 |
$1,095,276 |
$1,093,076 |
11/19 |
$1,087,100 |
$1,098,016 |
$1,096,402 |
12/19 |
$1,089,738 |
$1,101,368 |
$1,099,028 |
1/20 |
$1,107,383 |
$1,121,156 |
$1,119,041 |
2/20 |
$1,121,297 |
$1,135,614 |
$1,132,824 |
3/20 |
$1,095,070 |
$1,094,422 |
$1,103,176 |
4/20 |
$1,085,132 |
$1,080,687 |
$1,096,109 |
5/20 |
$1,118,007 |
$1,115,065 |
$1,133,380 |
6/20 |
$1,124,354 |
$1,124,242 |
$1,135,140 |
7/20 |
$1,140,772 |
$1,143,177 |
$1,153,473 |
8/20 |
$1,134,234 |
$1,137,813 |
$1,146,893 |
9/20 |
$1,133,874 |
$1,138,054 |
$1,147,214 |
10/20 |
$1,130,960 |
$1,134,636 |
$1,144,129 |
11/20 |
$1,147,137 |
$1,151,758 |
$1,160,456 |
12/20 |
$1,152,865 |
$1,158,774 |
$1,165,224 |
1/21 |
$1,156,046 |
$1,166,159 |
$1,169,882 |
2/21 |
$1,137,389 |
$1,147,630 |
$1,149,517 |
3/21 |
$1,141,941 |
$1,154,708 |
$1,156,059 |
4/21 |
$1,151,742 |
$1,164,393 |
$1,165,178 |
5/21 |
$1,154,902 |
$1,167,867 |
$1,168,369 |
6/21 |
$1,158,099 |
$1,171,074 |
$1,168,724 |
7/21 |
$1,165,152 |
$1,180,786 |
$1,179,760 |
8/21 |
$1,163,144 |
$1,176,453 |
$1,176,311 |
9/21 |
$1,153,452 |
$1,167,963 |
$1,165,476 |
10/21 |
$1,152,711 |
$1,164,548 |
$1,162,536 |
11/21 |
$1,161,114 |
$1,174,461 |
$1,172,293 |
12/21 |
$1,162,991 |
$1,176,356 |
$1,175,178 |
1/22 |
$1,133,437 |
$1,144,156 |
$1,140,996 |
2/22 |
$1,128,860 |
$1,140,057 |
$1,137,667 |
3/22 |
$1,096,655 |
$1,103,100 |
$1,099,422 |
4/22 |
$1,065,904 |
$1,072,589 |
$1,065,606 |
5/22 |
$1,078,587 |
$1,088,522 |
$1,082,686 |
6/22 |
$1,060,918 |
$1,070,693 |
$1,063,883 |
7/22 |
$1,084,223 |
$1,098,983 |
$1,093,050 |
8/22 |
$1,061,090 |
$1,074,897 |
$1,068,027 |
9/22 |
$1,026,091 |
$1,033,642 |
$1,026,067 |
10/22 |
$1,020,583 |
$1,025,046 |
$1,018,327 |
11/22 |
$1,064,829 |
$1,072,991 |
$1,064,671 |
12/22 |
$1,066,423 |
$1,076,063 |
$1,070,122 |
1/23 |
$1,093,583 |
$1,106,973 |
$1,098,963 |
2/23 |
$1,068,347 |
$1,081,942 |
$1,074,147 |
3/23 |
$1,091,605 |
$1,105,948 |
$1,098,630 |
4/23 |
$1,089,207 |
$1,103,421 |
$1,096,936 |
5/23 |
$1,077,253 |
$1,093,859 |
$1,085,666 |
6/23 |
$1,087,107 |
$1,104,817 |
$1,095,988 |
7/23 |
$1,090,180 |
$1,109,187 |
$1,099,041 |
8/23 |
$1,075,479 |
$1,093,219 |
$1,078,850 |
9/23 |
$1,047,075 |
$1,061,178 |
$1,041,784 |
10/23 |
$1,035,140 |
$1,052,148 |
$1,032,651 |
11/23 |
$1,093,706 |
$1,118,940 |
$1,104,710 |
12/23 |
$1,120,575 |
$1,144,946 |
$1,131,978 |
1/24 |
$1,119,650 |
$1,139,098 |
$1,125,015 |
2/24 |
$1,120,086 |
$1,140,561 |
$1,125,966 |
3/24 |
$1,120,594 |
$1,140,525 |
$1,126,277 |
4/24 |
$1,109,876 |
$1,126,400 |
$1,108,808 |
5/24 |
$1,110,384 |
$1,123,096 |
$1,106,531 |
6/24 |
$1,126,491 |
$1,140,311 |
$1,123,109 |
7/24 |
$1,135,520 |
$1,150,704 |
$1,133,737 |
8/24 |
$1,141,760 |
$1,159,779 |
$1,143,403 |
9/24 |
$1,153,739 |
$1,171,242 |
$1,154,468 |
10/24 |
$1,138,589 |
$1,154,164 |
$1,135,873 |
11/24 |
$1,156,332 |
$1,174,101 |
$1,155,651 |
12/24 |
$1,141,124 |
$1,157,008 |
$1,137,586 |
1/25 |
$1,142,960 |
$1,162,807 |
$1,145,261 |
2/25 |
$1,156,206 |
$1,174,336 |
$1,155,996 |
3/25 |
$1,139,348 |
$1,154,434 |
$1,137,840 |
4/25 |
$1,134,107 |
$1,145,133 |
$1,126,538 |
5/25 |
$1,130,306 |
$1,145,869 |
$1,129,400 |
6/25 |
$1,136,742 |
$1,153,002 |
$1,136,883 |
7/25 |
$1,131,423 |
$1,150,674 |
$1,133,281 |
8/25 |
$1,140,884 |
$1,160,675 |
$1,143,083 |
9/25 |
$1,169,524 |
$1,187,554 |
$1,170,357 |
10/25 |
$1,184,882 |
$1,202,283 |
$1,186,560 |
11/25 |
$1,191,404 |
$1,205,041 |
$1,190,009 |
12/25 |
$1,191,977 |
$1,206,125 |
$1,191,848 |
1/26 |
$1,201,339 |
$1,217,445 |
$1,203,811 |
2/26 |
$1,218,322 |
$1,232,618 |
$1,216,862 |
3/26 |
$1,194,755 |
$1,203,989 |
$1,188,657 |
4/26 |
$1,208,891 |
$1,217,775 |
$1,202,017 |
5/26 |
$1,213,911 |
$1,222,322 |
$1,206,358 |
6/26 |
$1,225,147 |
$1,234,103 |
$1,218,344 |
7/26 |
$1,202,941 |
$1,211,258 |
$1,196,270 |
8/26 |
$1,198,772 |
$1,208,488 |
$1,193,527 |
|
| Average Annual Return [Table Text Block] |
Table Summary
Fund |
1 Year |
5 Years |
10 Years |
Class I |
5.07% |
0.60% |
1.83% |
Bloomberg Municipal Bond Index |
4.12% |
0.54% |
1.91% |
Bloomberg Oregon Municipal Bond Index |
4.41% |
0.29% |
1.78% | |
| No Deduction of Taxes [Text Block] |
Performance does not reflect the deduction of taxes that a shareholder would pay on Fund distributions or redemption of Fund shares.
|
| Updated Performance Information Location [Text Block] |
For more recent performance information, visit www.eatonvance.com/performance.php.
|
| AssetsNet |
$ 285,047,186
|
| Holdings Count | Holding |
197
|
| Advisory Fees Paid, Amount |
$ 986,453
|
| InvestmentCompanyPortfolioTurnover |
42.00%
|
| Additional Fund Statistics [Text Block] |
Table Summary
Total Net Assets |
$285,047,186 |
# of Portfolio Holdings |
197 |
Portfolio Turnover Rate |
42% |
Total Advisory Fees Paid |
$986,453 | |
| Holdings [Text Block] |
Sector Allocation (% of total investments)
Table Summary
Value |
Value |
OtherFootnote Reference* |
4.1% |
Housing |
4.7% |
Electric Utilities |
4.7% |
Special Tax Revenue |
4.8% |
Transportation |
5.0% |
Education |
6.4% |
Water and Sewer |
10.1% |
Hospital |
10.5% |
General Obligations |
49.7% |
| Footnote |
Description |
Footnote* |
Sectors less than 3% each. | |
| Credit Quality Explanation [Text Block] |
Credit Quality (% of total investments)Footnote Referencea
Table Summary
Value |
Value |
NR |
2.7% |
BB |
1.7% |
BBB |
3.1% |
A |
5.0% |
AA |
80.7% |
AAA |
6.8% |
| Footnote |
Description |
Footnotea |
Ratings are based on Moody’s Investors Service, Inc. (“Moody’s”), S&P Global Ratings (“S&P”) or Fitch Ratings (“Fitch”). If securities are rated differently by the ratings agencies, the highest rating is applied. Moody's ratings are converted to the S&P and Fitch scale with ratings ranging from AAA, being the highest, to D, being the lowest. Ratings of BBB or higher are considered to be investment-grade quality. Holdings designated as “Not Rated” (if any) are not rated by the national ratings agencies stated above. | |
| Material Fund Change [Text Block] |
|
| Updated Prospectus Phone Number |
1-800-262-1122
|
| C000013151 |
|
| Shareholder Report [Line Items] |
|
| Fund Name |
Eaton Vance South Carolina Municipal Income Fund
|
| Class Name |
Class A
|
| Trading Symbol |
EASCX
|
| Annual or Semi-Annual Statement [Text Block] |
This annual shareholder report contains important information about the Eaton Vance South Carolina Municipal Income Fund for the period of September 1, 2025 to August 31, 2026.
|
| Additional Information [Text Block] |
You can find additional information about the Fund at www.eatonvance.com/open-end-mutual-fund-documents.php. You can also request this information by contacting us at 1-800-262-1122.
|
| Additional Information Phone Number |
1-800-262-1122
|
| Additional Information Website |
<span style="box-sizing: border-box; color: rgb(0, 0, 0); display: inline; flex-wrap: nowrap; font-size: 10.6667px; font-weight: 400; grid-area: auto; line-height: 16px; margin: 0px; overflow: visible; text-align: left; text-align-last: auto; white-space-collapse: preserve-breaks;">www.eatonvance.com/open-end-mutual-fund-documents.php</span>
|
| Expenses [Text Block] |
What were the Fund costs for the last year?(based on a hypothetical $10,000 investment)
Table Summary
Class Name |
Costs of a $10,000 investment |
Costs paid as a percentage of a $10,000 investment |
Class A |
$74 |
0.72% | |
| Expenses Paid, Amount |
$ 74
|
| Expense Ratio, Percent |
0.72%
|
| Factors Affecting Performance [Text Block] |
How did the Fund perform last year and what affected its performance?Key contributors to (↑) and detractors from (↓) performance, relative to the Bloomberg Municipal Bond Index (the Index): ↑ An overweight exposure to and security selection in bonds with maturities of 17 to 22 years, contributed to relative performance ↑ An overweight exposure to and security selection in bonds with coupon rates between 4% and 4.99% also helped returns ↑ Security selections in the education sector contributed to fund performance during the period ↓ An out-of-index exposure to variable-rate demand notes (VRDNs)—typically considered a defensive investment—detracted from returns ↓ An underweight allocation to the transportation sector, which outperformed the index, detracted from returns |
| Performance Past Does Not Indicate Future [Text] |
THE FUND'S PAST PERFORMANCE IS NO GUARANTEE OF FUTURE RESULTS.
|
| Line Graph [Table Text Block] |
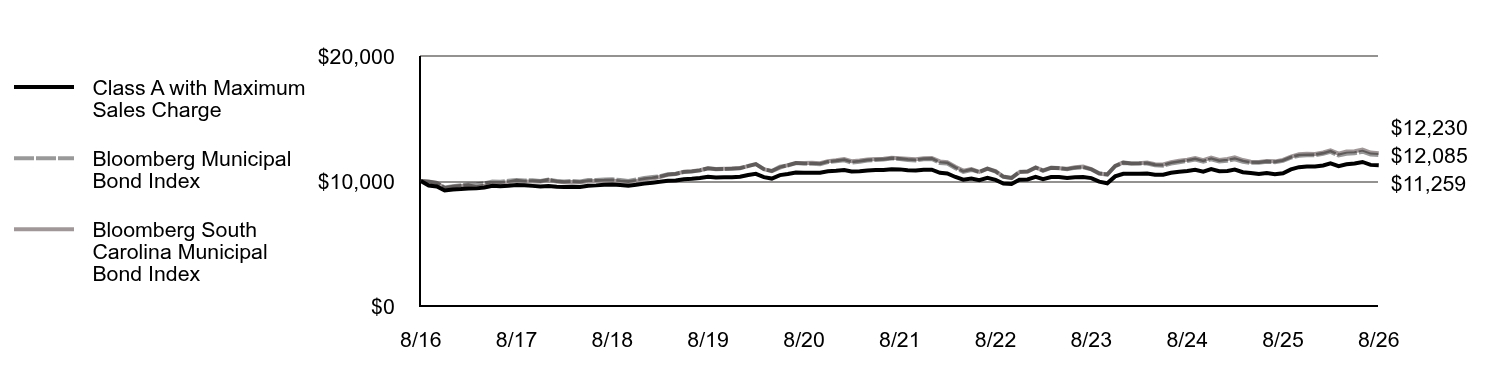
Table Summary
|
Class A with Maximum Sales Charge |
Bloomberg Municipal Bond Index |
Bloomberg South Carolina Municipal Bond Index |
8/16 |
$10,000 |
$10,000 |
$10,000 |
9/16 |
$9,639 |
$9,950 |
$9,952 |
10/16 |
$9,562 |
$9,846 |
$9,840 |
11/16 |
$9,243 |
$9,479 |
$9,426 |
12/16 |
$9,328 |
$9,590 |
$9,545 |
1/17 |
$9,352 |
$9,653 |
$9,609 |
2/17 |
$9,397 |
$9,720 |
$9,652 |
3/17 |
$9,410 |
$9,741 |
$9,511 |
4/17 |
$9,486 |
$9,812 |
$9,625 |
5/17 |
$9,623 |
$9,968 |
$9,812 |
6/17 |
$9,585 |
$9,932 |
$9,824 |
7/17 |
$9,620 |
$10,012 |
$9,892 |
8/17 |
$9,685 |
$10,088 |
$10,009 |
9/17 |
$9,668 |
$10,037 |
$9,933 |
10/17 |
$9,610 |
$10,062 |
$9,979 |
11/17 |
$9,551 |
$10,008 |
$9,964 |
12/17 |
$9,596 |
$10,112 |
$10,086 |
1/18 |
$9,546 |
$9,993 |
$9,951 |
2/18 |
$9,518 |
$9,963 |
$9,893 |
3/18 |
$9,543 |
$10,000 |
$9,922 |
4/18 |
$9,525 |
$9,964 |
$9,896 |
5/18 |
$9,624 |
$10,079 |
$9,975 |
6/18 |
$9,650 |
$10,087 |
$10,006 |
7/18 |
$9,707 |
$10,112 |
$10,012 |
8/18 |
$9,722 |
$10,138 |
$10,033 |
9/18 |
$9,675 |
$10,072 |
$9,959 |
10/18 |
$9,627 |
$10,010 |
$9,923 |
11/18 |
$9,693 |
$10,121 |
$10,010 |
12/18 |
$9,790 |
$10,242 |
$10,132 |
1/19 |
$9,866 |
$10,319 |
$10,207 |
2/19 |
$9,932 |
$10,375 |
$10,321 |
3/19 |
$10,022 |
$10,539 |
$10,502 |
4/19 |
$10,036 |
$10,578 |
$10,557 |
5/19 |
$10,145 |
$10,724 |
$10,748 |
6/19 |
$10,179 |
$10,764 |
$10,785 |
7/19 |
$10,235 |
$10,850 |
$10,858 |
8/19 |
$10,345 |
$11,022 |
$11,023 |
9/19 |
$10,290 |
$10,933 |
$10,954 |
10/19 |
$10,299 |
$10,953 |
$10,974 |
11/19 |
$10,309 |
$10,980 |
$10,997 |
12/19 |
$10,343 |
$11,014 |
$11,036 |
1/20 |
$10,475 |
$11,212 |
$11,190 |
2/20 |
$10,574 |
$11,356 |
$11,352 |
3/20 |
$10,306 |
$10,944 |
$10,946 |
4/20 |
$10,193 |
$10,807 |
$10,789 |
5/20 |
$10,471 |
$11,151 |
$11,070 |
6/20 |
$10,559 |
$11,242 |
$11,273 |
7/20 |
$10,679 |
$11,432 |
$11,444 |
8/20 |
$10,652 |
$11,378 |
$11,445 |
9/20 |
$10,660 |
$11,381 |
$11,451 |
10/20 |
$10,668 |
$11,346 |
$11,420 |
11/20 |
$10,778 |
$11,518 |
$11,588 |
12/20 |
$10,819 |
$11,588 |
$11,658 |
1/21 |
$10,881 |
$11,662 |
$11,760 |
2/21 |
$10,761 |
$11,476 |
$11,582 |
3/21 |
$10,788 |
$11,547 |
$11,640 |
4/21 |
$10,848 |
$11,644 |
$11,725 |
5/21 |
$10,873 |
$11,679 |
$11,753 |
6/21 |
$10,888 |
$11,711 |
$11,778 |
7/21 |
$10,948 |
$11,808 |
$11,861 |
8/21 |
$10,929 |
$11,765 |
$11,829 |
9/21 |
$10,852 |
$11,680 |
$11,789 |
10/21 |
$10,832 |
$11,645 |
$11,740 |
11/21 |
$10,904 |
$11,745 |
$11,820 |
12/21 |
$10,908 |
$11,764 |
$11,843 |
1/22 |
$10,657 |
$11,442 |
$11,567 |
2/22 |
$10,605 |
$11,401 |
$11,510 |
3/22 |
$10,320 |
$11,031 |
$11,137 |
4/22 |
$10,105 |
$10,726 |
$10,831 |
5/22 |
$10,191 |
$10,885 |
$10,951 |
6/22 |
$10,068 |
$10,707 |
$10,724 |
7/22 |
$10,248 |
$10,990 |
$10,990 |
8/22 |
$10,088 |
$10,749 |
$10,790 |
9/22 |
$9,802 |
$10,336 |
$10,354 |
10/22 |
$9,761 |
$10,250 |
$10,236 |
11/22 |
$10,097 |
$10,730 |
$10,713 |
12/22 |
$10,127 |
$10,761 |
$10,765 |
1/23 |
$10,333 |
$11,070 |
$11,088 |
2/23 |
$10,153 |
$10,819 |
$10,854 |
3/23 |
$10,314 |
$11,059 |
$11,064 |
4/23 |
$10,311 |
$11,034 |
$11,021 |
5/23 |
$10,238 |
$10,939 |
$10,982 |
6/23 |
$10,295 |
$11,048 |
$11,105 |
7/23 |
$10,317 |
$11,092 |
$11,157 |
8/23 |
$10,233 |
$10,932 |
$10,954 |
9/23 |
$9,949 |
$10,612 |
$10,592 |
10/23 |
$9,821 |
$10,521 |
$10,517 |
11/23 |
$10,369 |
$11,189 |
$11,202 |
12/23 |
$10,579 |
$11,449 |
$11,486 |
1/24 |
$10,583 |
$11,391 |
$11,407 |
2/24 |
$10,588 |
$11,406 |
$11,422 |
3/24 |
$10,593 |
$11,405 |
$11,478 |
4/24 |
$10,501 |
$11,264 |
$11,335 |
5/24 |
$10,507 |
$11,231 |
$11,321 |
6/24 |
$10,660 |
$11,403 |
$11,510 |
7/24 |
$10,740 |
$11,507 |
$11,617 |
8/24 |
$10,797 |
$11,598 |
$11,707 |
9/24 |
$10,903 |
$11,712 |
$11,829 |
10/24 |
$10,748 |
$11,542 |
$11,663 |
11/24 |
$10,954 |
$11,741 |
$11,875 |
12/24 |
$10,786 |
$11,570 |
$11,689 |
1/25 |
$10,804 |
$11,628 |
$11,765 |
2/25 |
$10,911 |
$11,743 |
$11,885 |
3/25 |
$10,703 |
$11,544 |
$11,674 |
4/25 |
$10,635 |
$11,451 |
$11,534 |
5/25 |
$10,565 |
$11,459 |
$11,528 |
6/25 |
$10,636 |
$11,530 |
$11,604 |
7/25 |
$10,537 |
$11,507 |
$11,572 |
8/25 |
$10,619 |
$11,607 |
$11,690 |
9/25 |
$10,933 |
$11,876 |
$11,956 |
10/25 |
$11,108 |
$12,023 |
$12,142 |
11/25 |
$11,154 |
$12,050 |
$12,172 |
12/25 |
$11,161 |
$12,061 |
$12,167 |
1/26 |
$11,246 |
$12,174 |
$12,284 |
2/26 |
$11,408 |
$12,326 |
$12,452 |
3/26 |
$11,190 |
$12,040 |
$12,185 |
4/26 |
$11,340 |
$12,178 |
$12,354 |
5/26 |
$11,398 |
$12,223 |
$12,375 |
6/26 |
$11,523 |
$12,341 |
$12,512 |
7/26 |
$11,290 |
$12,113 |
$12,277 |
8/26 |
$11,259 |
$12,085 |
$12,230 |
|
| Average Annual Return [Table Text Block] |
Table Summary
Fund |
1 Year |
5 Years |
10 Years |
Class A |
6.00% |
0.59% |
1.52% |
Class A with 3.25% Maximum Sales Charge |
2.53% |
(0.07)% |
1.19% |
Bloomberg Municipal Bond Index |
4.12% |
0.54% |
1.91% |
Bloomberg South Carolina Municipal Bond Index |
4.62% |
0.67% |
2.03% | |
| No Deduction of Taxes [Text Block] |
Performance does not reflect the deduction of taxes that a shareholder would pay on Fund distributions or redemption of Fund shares.
|
| Updated Performance Information Location [Text Block] |
For more recent performance information, visit www.eatonvance.com/performance.php.
|
| AssetsNet |
$ 225,098,235
|
| Holdings Count | Holding |
162
|
| Advisory Fees Paid, Amount |
$ 858,115
|
| InvestmentCompanyPortfolioTurnover |
71.00%
|
| Additional Fund Statistics [Text Block] |
Table Summary
Total Net Assets |
$225,098,235 |
# of Portfolio Holdings |
162 |
Portfolio Turnover Rate |
71% |
Total Advisory Fees Paid |
$858,115 | |
| Holdings [Text Block] |
Sector Allocation (% of total investments)
Table Summary
Value |
Value |
OtherFootnote Reference* |
4.3% |
Senior Living/Life Care |
4.2% |
Transportation |
5.3% |
Short-Term Investments |
5.9% |
Lease Rev./Cert. of Participation |
6.9% |
Education |
8.5% |
Electric Utilities |
8.5% |
Housing |
8.7% |
Water and Sewer |
11.5% |
General Obligations |
15.5% |
Hospital |
20.7% |
| Footnote |
Description |
Footnote* |
Sectors less than 3% each. | |
| Credit Quality Explanation [Text Block] |
Credit Quality (% of total investments)Footnote Referencea
Table Summary
Value |
Value |
NR |
6.2% |
BB |
2.4% |
BBB |
3.4% |
A |
21.5% |
AA |
49.9% |
AAA |
16.6% |
| Footnote |
Description |
Footnotea |
Ratings are based on Moody’s Investors Service, Inc. (“Moody’s”), S&P Global Ratings (“S&P”) or Fitch Ratings (“Fitch”). If securities are rated differently by the ratings agencies, the highest rating is applied. Moody's ratings are converted to the S&P and Fitch scale with ratings ranging from AAA, being the highest, to D, being the lowest. Ratings of BBB or higher are considered to be investment-grade quality. Holdings designated as “Not Rated” (if any) are not rated by the national ratings agencies stated above. | |
| Material Fund Change [Text Block] |
|
| Updated Prospectus Phone Number |
1-800-262-1122
|
| C000013153 |
|
| Shareholder Report [Line Items] |
|
| Fund Name |
Eaton Vance South Carolina Municipal Income Fund
|
| Class Name |
Class C
|
| Trading Symbol |
ECSCX
|
| Annual or Semi-Annual Statement [Text Block] |
This annual shareholder report contains important information about the Eaton Vance South Carolina Municipal Income Fund for the period of September 1, 2025 to August 31, 2026.
|
| Additional Information [Text Block] |
You can find additional information about the Fund at www.eatonvance.com/open-end-mutual-fund-documents.php. You can also request this information by contacting us at 1-800-262-1122.
|
| Additional Information Phone Number |
1-800-262-1122
|
| Additional Information Website |
<span style="box-sizing: border-box; color: rgb(0, 0, 0); display: inline; flex-wrap: nowrap; font-size: 10.6667px; font-weight: 400; grid-area: auto; line-height: 16px; margin: 0px; overflow: visible; text-align: left; text-align-last: auto; white-space-collapse: preserve-breaks;">www.eatonvance.com/open-end-mutual-fund-documents.php</span>
|
| Expenses [Text Block] |
What were the Fund costs for the last year?(based on a hypothetical $10,000 investment)
Table Summary
Class Name |
Costs of a $10,000 investment |
Costs paid as a percentage of a $10,000 investment |
Class C |
$151 |
1.47% | |
| Expenses Paid, Amount |
$ 151
|
| Expense Ratio, Percent |
1.47%
|
| Factors Affecting Performance [Text Block] |
How did the Fund perform last year and what affected its performance?Key contributors to (↑) and detractors from (↓) performance, relative to the Bloomberg Municipal Bond Index (the Index): ↑ An overweight exposure to and security selection in bonds with maturities of 17 to 22 years, contributed to relative performance ↑ An overweight exposure to and security selection in bonds with coupon rates between 4% and 4.99% also helped returns ↑ Security selections in the education sector contributed to fund performance during the period ↓ An out-of-index exposure to variable-rate demand notes (VRDNs)—typically considered a defensive investment—detracted from returns ↓ An underweight allocation to the transportation sector, which outperformed the index, detracted from returns |
| Performance Past Does Not Indicate Future [Text] |
THE FUND'S PAST PERFORMANCE IS NO GUARANTEE OF FUTURE RESULTS.
|
| Line Graph [Table Text Block] |
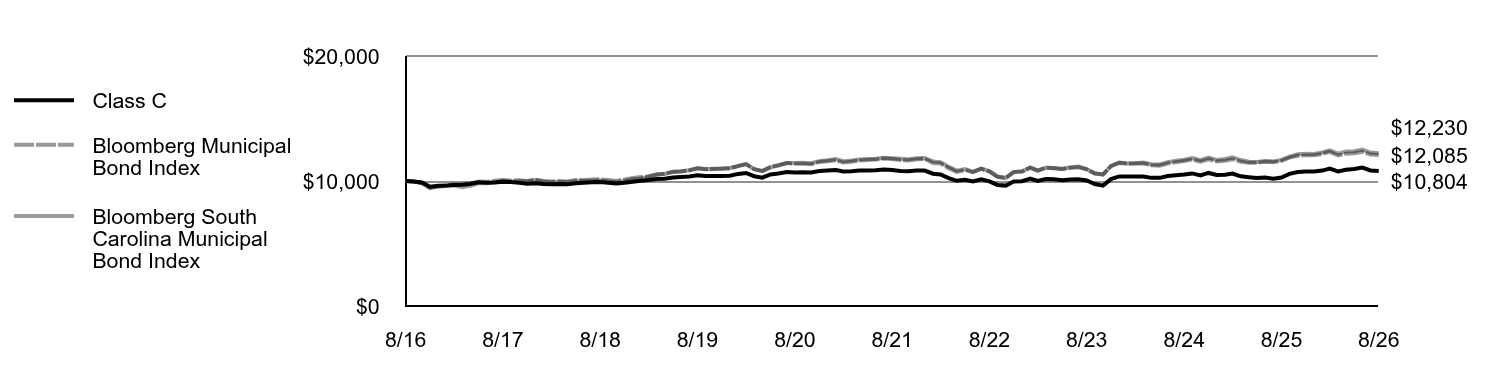
Table Summary
|
Class C |
Bloomberg Municipal Bond Index |
Bloomberg South Carolina Municipal Bond Index |
8/16 |
$10,000 |
$10,000 |
$10,000 |
9/16 |
$9,960 |
$9,950 |
$9,952 |
10/16 |
$9,880 |
$9,846 |
$9,840 |
11/16 |
$9,545 |
$9,479 |
$9,426 |
12/16 |
$9,623 |
$9,590 |
$9,545 |
1/17 |
$9,642 |
$9,653 |
$9,609 |
2/17 |
$9,681 |
$9,720 |
$9,652 |
3/17 |
$9,690 |
$9,741 |
$9,511 |
4/17 |
$9,759 |
$9,812 |
$9,625 |
5/17 |
$9,897 |
$9,968 |
$9,812 |
6/17 |
$9,856 |
$9,932 |
$9,824 |
7/17 |
$9,884 |
$10,012 |
$9,892 |
8/17 |
$9,943 |
$10,088 |
$10,009 |
9/17 |
$9,912 |
$10,037 |
$9,933 |
10/17 |
$9,850 |
$10,062 |
$9,979 |
11/17 |
$9,789 |
$10,008 |
$9,964 |
12/17 |
$9,817 |
$10,112 |
$10,086 |
1/18 |
$9,765 |
$9,993 |
$9,951 |
2/18 |
$9,733 |
$9,963 |
$9,893 |
3/18 |
$9,752 |
$10,000 |
$9,922 |
4/18 |
$9,731 |
$9,964 |
$9,896 |
5/18 |
$9,821 |
$10,079 |
$9,975 |
6/18 |
$9,852 |
$10,087 |
$10,006 |
7/18 |
$9,892 |
$10,112 |
$10,012 |
8/18 |
$9,911 |
$10,138 |
$10,033 |
9/18 |
$9,851 |
$10,072 |
$9,959 |
10/18 |
$9,800 |
$10,010 |
$9,923 |
11/18 |
$9,860 |
$10,121 |
$10,010 |
12/18 |
$9,948 |
$10,242 |
$10,132 |
1/19 |
$10,015 |
$10,319 |
$10,207 |
2/19 |
$10,074 |
$10,375 |
$10,321 |
3/19 |
$10,165 |
$10,539 |
$10,502 |
4/19 |
$10,174 |
$10,578 |
$10,557 |
5/19 |
$10,273 |
$10,724 |
$10,748 |
6/19 |
$10,311 |
$10,764 |
$10,785 |
7/19 |
$10,359 |
$10,850 |
$10,858 |
8/19 |
$10,459 |
$11,022 |
$11,023 |
9/19 |
$10,401 |
$10,933 |
$10,954 |
10/19 |
$10,393 |
$10,953 |
$10,974 |
11/19 |
$10,409 |
$10,980 |
$10,997 |
12/19 |
$10,425 |
$11,014 |
$11,036 |
1/20 |
$10,567 |
$11,212 |
$11,190 |
2/20 |
$10,645 |
$11,356 |
$11,352 |
3/20 |
$10,384 |
$10,944 |
$10,946 |
4/20 |
$10,262 |
$10,807 |
$10,789 |
5/20 |
$10,520 |
$11,151 |
$11,070 |
6/20 |
$10,608 |
$11,242 |
$11,273 |
7/20 |
$10,716 |
$11,432 |
$11,444 |
8/20 |
$10,685 |
$11,378 |
$11,445 |
9/20 |
$10,698 |
$11,381 |
$11,451 |
10/20 |
$10,689 |
$11,346 |
$11,420 |
11/20 |
$10,798 |
$11,518 |
$11,588 |
12/20 |
$10,842 |
$11,588 |
$11,658 |
1/21 |
$10,883 |
$11,662 |
$11,760 |
2/21 |
$10,754 |
$11,476 |
$11,582 |
3/21 |
$10,784 |
$11,547 |
$11,640 |
4/21 |
$10,835 |
$11,644 |
$11,725 |
5/21 |
$10,842 |
$11,679 |
$11,753 |
6/21 |
$10,861 |
$11,711 |
$11,778 |
7/21 |
$10,912 |
$11,808 |
$11,861 |
8/21 |
$10,887 |
$11,765 |
$11,829 |
9/21 |
$10,809 |
$11,680 |
$11,789 |
10/21 |
$10,784 |
$11,645 |
$11,740 |
11/21 |
$10,846 |
$11,745 |
$11,820 |
12/21 |
$10,833 |
$11,764 |
$11,843 |
1/22 |
$10,581 |
$11,442 |
$11,567 |
2/22 |
$10,527 |
$11,401 |
$11,510 |
3/22 |
$10,233 |
$11,031 |
$11,137 |
4/22 |
$10,016 |
$10,726 |
$10,831 |
5/22 |
$10,091 |
$10,885 |
$10,951 |
6/22 |
$9,971 |
$10,707 |
$10,724 |
7/22 |
$10,144 |
$10,990 |
$10,990 |
8/22 |
$9,968 |
$10,749 |
$10,790 |
9/22 |
$9,685 |
$10,336 |
$10,354 |
10/22 |
$9,631 |
$10,250 |
$10,236 |
11/22 |
$9,961 |
$10,730 |
$10,713 |
12/22 |
$9,983 |
$10,761 |
$10,765 |
1/23 |
$10,192 |
$11,070 |
$11,088 |
2/23 |
$9,998 |
$10,819 |
$10,854 |
3/23 |
$10,152 |
$11,059 |
$11,064 |
4/23 |
$10,134 |
$11,034 |
$11,021 |
5/23 |
$10,061 |
$10,939 |
$10,982 |
6/23 |
$10,120 |
$11,048 |
$11,105 |
7/23 |
$10,135 |
$11,092 |
$11,157 |
8/23 |
$10,041 |
$10,932 |
$10,954 |
9/23 |
$9,763 |
$10,612 |
$10,592 |
10/23 |
$9,629 |
$10,521 |
$10,517 |
11/23 |
$10,152 |
$11,189 |
$11,202 |
12/23 |
$10,364 |
$11,449 |
$11,486 |
1/24 |
$10,363 |
$11,391 |
$11,407 |
2/24 |
$10,352 |
$11,406 |
$11,422 |
3/24 |
$10,351 |
$11,405 |
$11,478 |
4/24 |
$10,251 |
$11,264 |
$11,335 |
5/24 |
$10,251 |
$11,231 |
$11,321 |
6/24 |
$10,399 |
$11,403 |
$11,510 |
7/24 |
$10,467 |
$11,507 |
$11,617 |
8/24 |
$10,515 |
$11,598 |
$11,707 |
9/24 |
$10,607 |
$11,712 |
$11,829 |
10/24 |
$10,449 |
$11,542 |
$11,663 |
11/24 |
$10,645 |
$11,741 |
$11,875 |
12/24 |
$10,485 |
$11,570 |
$11,689 |
1/25 |
$10,498 |
$11,628 |
$11,765 |
2/25 |
$10,591 |
$11,743 |
$11,885 |
3/25 |
$10,373 |
$11,544 |
$11,674 |
4/25 |
$10,306 |
$11,451 |
$11,534 |
5/25 |
$10,238 |
$11,459 |
$11,528 |
6/25 |
$10,286 |
$11,530 |
$11,604 |
7/25 |
$10,190 |
$11,507 |
$11,572 |
8/25 |
$10,272 |
$11,607 |
$11,690 |
9/25 |
$10,566 |
$11,876 |
$11,956 |
10/25 |
$10,719 |
$12,023 |
$12,142 |
11/25 |
$10,757 |
$12,050 |
$12,172 |
12/25 |
$10,759 |
$12,061 |
$12,167 |
1/26 |
$10,831 |
$12,174 |
$12,284 |
2/26 |
$10,985 |
$12,326 |
$12,452 |
3/26 |
$10,770 |
$12,040 |
$12,185 |
4/26 |
$10,901 |
$12,178 |
$12,354 |
5/26 |
$10,960 |
$12,223 |
$12,375 |
6/26 |
$11,068 |
$12,341 |
$12,512 |
7/26 |
$10,841 |
$12,113 |
$12,277 |
8/26 |
$10,804 |
$12,085 |
$12,230 |
|
| Average Annual Return [Table Text Block] |
Table Summary
Fund |
1 Year |
5 Years |
10 Years |
Class C, with conversion to Class A after 8 years |
5.18% |
(0.15)% |
0.78% |
Class C, with 1% Maximum Contingent Deferred Sales Charge and conversion to Class A after 8 years |
4.18% |
(0.15)% |
0.78% |
Bloomberg Municipal Bond Index |
4.12% |
0.54% |
1.91% |
Bloomberg South Carolina Municipal Bond Index |
4.62% |
0.67% |
2.03% | |
| No Deduction of Taxes [Text Block] |
Performance does not reflect the deduction of taxes that a shareholder would pay on Fund distributions or redemption of Fund shares.
|
| Updated Performance Information Location [Text Block] |
For more recent performance information, visit www.eatonvance.com/performance.php.
|
| AssetsNet |
$ 225,098,235
|
| Holdings Count | Holding |
162
|
| Advisory Fees Paid, Amount |
$ 858,115
|
| InvestmentCompanyPortfolioTurnover |
71.00%
|
| Additional Fund Statistics [Text Block] |
Table Summary
Total Net Assets |
$225,098,235 |
# of Portfolio Holdings |
162 |
Portfolio Turnover Rate |
71% |
Total Advisory Fees Paid |
$858,115 | |
| Holdings [Text Block] |
Sector Allocation (% of total investments)
Table Summary
Value |
Value |
OtherFootnote Reference* |
4.3% |
Senior Living/Life Care |
4.2% |
Transportation |
5.3% |
Short-Term Investments |
5.9% |
Lease Rev./Cert. of Participation |
6.9% |
Education |
8.5% |
Electric Utilities |
8.5% |
Housing |
8.7% |
Water and Sewer |
11.5% |
General Obligations |
15.5% |
Hospital |
20.7% |
| Footnote |
Description |
Footnote* |
Sectors less than 3% each. | |
| Credit Quality Explanation [Text Block] |
Credit Quality (% of total investments)Footnote Referencea
Table Summary
Value |
Value |
NR |
6.2% |
BB |
2.4% |
BBB |
3.4% |
A |
21.5% |
AA |
49.9% |
AAA |
16.6% |
| Footnote |
Description |
Footnotea |
Ratings are based on Moody’s Investors Service, Inc. (“Moody’s”), S&P Global Ratings (“S&P”) or Fitch Ratings (“Fitch”). If securities are rated differently by the ratings agencies, the highest rating is applied. Moody's ratings are converted to the S&P and Fitch scale with ratings ranging from AAA, being the highest, to D, being the lowest. Ratings of BBB or higher are considered to be investment-grade quality. Holdings designated as “Not Rated” (if any) are not rated by the national ratings agencies stated above. | |
| Material Fund Change [Text Block] |
|
| Updated Prospectus Phone Number |
1-800-262-1122
|
| C000063952 |
|
| Shareholder Report [Line Items] |
|
| Fund Name |
Eaton Vance South Carolina Municipal Income Fund
|
| Class Name |
Class I
|
| Trading Symbol |
EISCX
|
| Annual or Semi-Annual Statement [Text Block] |
This annual shareholder report contains important information about the Eaton Vance South Carolina Municipal Income Fund for the period of September 1, 2025 to August 31, 2026.
|
| Additional Information [Text Block] |
You can find additional information about the Fund at www.eatonvance.com/open-end-mutual-fund-documents.php. You can also request this information by contacting us at 1-800-262-1122.
|
| Additional Information Phone Number |
1-800-262-1122
|
| Additional Information Website |
<span style="box-sizing: border-box; color: rgb(0, 0, 0); display: inline; flex-wrap: nowrap; font-size: 10.6667px; font-weight: 400; grid-area: auto; line-height: 16px; margin: 0px; overflow: visible; text-align: left; text-align-last: auto; white-space-collapse: preserve-breaks;">www.eatonvance.com/open-end-mutual-fund-documents.php</span>
|
| Expenses [Text Block] |
What were the Fund costs for the last year?(based on a hypothetical $10,000 investment)
Table Summary
Class Name |
Costs of a $10,000 investment |
Costs paid as a percentage of a $10,000 investment |
Class I |
$54 |
0.52% | |
| Expenses Paid, Amount |
$ 54
|
| Expense Ratio, Percent |
0.52%
|
| Factors Affecting Performance [Text Block] |
How did the Fund perform last year and what affected its performance?Key contributors to (↑) and detractors from (↓) performance, relative to the Bloomberg Municipal Bond Index (the Index): ↑ An overweight exposure to and security selection in bonds with maturities of 17 to 22 years, contributed to relative performance ↑ An overweight exposure to and security selection in bonds with coupon rates between 4% and 4.99% also helped returns ↑ Security selections in the education sector contributed to fund performance during the period ↓ An out-of-index exposure to variable-rate demand notes (VRDNs)—typically considered a defensive investment—detracted from returns ↓ An underweight allocation to the transportation sector, which outperformed the index, detracted from returns |
| Performance Past Does Not Indicate Future [Text] |
THE FUND'S PAST PERFORMANCE IS NO GUARANTEE OF FUTURE RESULTS.
|
| Line Graph [Table Text Block] |
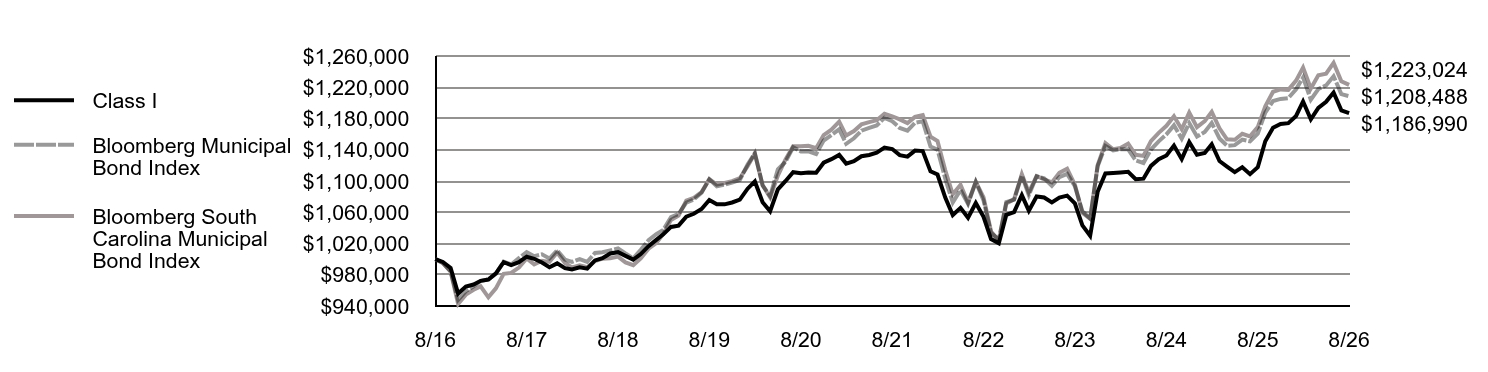
Table Summary
|
Class I |
Bloomberg Municipal Bond Index |
Bloomberg South Carolina Municipal Bond Index |
8/16 |
$1,000,000 |
$1,000,000 |
$1,000,000 |
9/16 |
$996,444 |
$995,009 |
$995,159 |
10/16 |
$988,682 |
$984,570 |
$983,990 |
11/16 |
$955,877 |
$947,850 |
$942,641 |
12/16 |
$964,789 |
$958,978 |
$954,518 |
1/17 |
$967,452 |
$965,300 |
$960,857 |
2/17 |
$972,226 |
$972,003 |
$965,173 |
3/17 |
$973,834 |
$974,113 |
$951,097 |
4/17 |
$981,777 |
$981,182 |
$962,519 |
5/17 |
$996,100 |
$996,754 |
$981,161 |
6/17 |
$992,410 |
$993,179 |
$982,400 |
7/17 |
$996,139 |
$1,001,214 |
$989,202 |
8/17 |
$1,003,098 |
$1,008,833 |
$1,000,854 |
9/17 |
$1,000,436 |
$1,003,704 |
$993,336 |
10/17 |
$995,606 |
$1,006,154 |
$997,927 |
11/17 |
$989,696 |
$1,000,767 |
$996,389 |
12/17 |
$994,540 |
$1,011,227 |
$1,008,550 |
1/18 |
$988,474 |
$999,322 |
$995,123 |
2/18 |
$986,817 |
$996,336 |
$989,334 |
3/18 |
$989,518 |
$1,000,013 |
$992,188 |
4/18 |
$987,855 |
$996,445 |
$989,579 |
5/18 |
$998,302 |
$1,007,855 |
$997,452 |
6/18 |
$1,001,151 |
$1,008,715 |
$1,000,610 |
7/18 |
$1,007,242 |
$1,011,163 |
$1,001,222 |
8/18 |
$1,008,916 |
$1,013,760 |
$1,003,255 |
9/18 |
$1,004,189 |
$1,007,197 |
$995,870 |
10/18 |
$999,385 |
$1,000,994 |
$992,316 |
11/18 |
$1,006,481 |
$1,012,073 |
$1,000,981 |
12/18 |
$1,016,607 |
$1,024,191 |
$1,013,249 |
1/19 |
$1,024,691 |
$1,031,933 |
$1,020,723 |
2/19 |
$1,031,746 |
$1,037,459 |
$1,032,138 |
3/19 |
$1,041,215 |
$1,053,858 |
$1,050,199 |
4/19 |
$1,042,835 |
$1,057,819 |
$1,055,666 |
5/19 |
$1,054,400 |
$1,072,403 |
$1,074,828 |
6/19 |
$1,058,045 |
$1,076,362 |
$1,078,490 |
7/19 |
$1,064,072 |
$1,085,037 |
$1,085,841 |
8/19 |
$1,075,705 |
$1,102,152 |
$1,102,308 |
9/19 |
$1,070,115 |
$1,093,317 |
$1,095,430 |
10/19 |
$1,070,096 |
$1,095,276 |
$1,097,371 |
11/19 |
$1,072,503 |
$1,098,016 |
$1,099,741 |
12/19 |
$1,076,146 |
$1,101,368 |
$1,103,572 |
1/20 |
$1,090,133 |
$1,121,156 |
$1,119,022 |
2/20 |
$1,099,413 |
$1,135,614 |
$1,135,224 |
3/20 |
$1,072,860 |
$1,094,422 |
$1,094,605 |
4/20 |
$1,061,325 |
$1,080,687 |
$1,078,912 |
5/20 |
$1,089,226 |
$1,115,065 |
$1,107,016 |
6/20 |
$1,099,715 |
$1,124,242 |
$1,127,257 |
7/20 |
$1,111,238 |
$1,143,177 |
$1,144,432 |
8/20 |
$1,109,822 |
$1,137,813 |
$1,144,515 |
9/20 |
$1,110,833 |
$1,138,054 |
$1,145,069 |
10/20 |
$1,110,637 |
$1,134,636 |
$1,141,990 |
11/20 |
$1,123,438 |
$1,151,758 |
$1,158,796 |
12/20 |
$1,127,917 |
$1,158,774 |
$1,165,780 |
1/21 |
$1,133,372 |
$1,166,159 |
$1,175,981 |
2/21 |
$1,122,238 |
$1,147,630 |
$1,158,193 |
3/21 |
$1,125,237 |
$1,154,708 |
$1,163,999 |
4/21 |
$1,131,694 |
$1,164,393 |
$1,172,452 |
5/21 |
$1,133,356 |
$1,167,867 |
$1,175,333 |
6/21 |
$1,136,283 |
$1,171,074 |
$1,177,833 |
7/21 |
$1,142,760 |
$1,180,786 |
$1,186,109 |
8/21 |
$1,140,883 |
$1,176,453 |
$1,182,862 |
9/21 |
$1,133,059 |
$1,167,963 |
$1,178,906 |
10/21 |
$1,131,147 |
$1,164,548 |
$1,174,042 |
11/21 |
$1,138,934 |
$1,174,461 |
$1,182,026 |
12/21 |
$1,138,273 |
$1,176,356 |
$1,184,291 |
1/22 |
$1,112,327 |
$1,144,156 |
$1,156,682 |
2/22 |
$1,108,280 |
$1,140,057 |
$1,151,025 |
3/22 |
$1,078,710 |
$1,103,100 |
$1,113,710 |
4/22 |
$1,056,430 |
$1,072,589 |
$1,083,058 |
5/22 |
$1,065,584 |
$1,088,522 |
$1,095,068 |
6/22 |
$1,052,907 |
$1,070,693 |
$1,072,378 |
7/22 |
$1,071,865 |
$1,098,983 |
$1,099,038 |
8/22 |
$1,054,142 |
$1,074,897 |
$1,078,975 |
9/22 |
$1,025,601 |
$1,033,642 |
$1,035,383 |
10/22 |
$1,020,316 |
$1,025,046 |
$1,023,557 |
11/22 |
$1,056,829 |
$1,072,991 |
$1,071,272 |
12/22 |
$1,060,111 |
$1,076,063 |
$1,076,507 |
1/23 |
$1,081,924 |
$1,106,973 |
$1,108,752 |
2/23 |
$1,062,021 |
$1,081,942 |
$1,085,350 |
3/23 |
$1,080,225 |
$1,105,948 |
$1,106,368 |
4/23 |
$1,078,927 |
$1,103,421 |
$1,102,115 |
5/23 |
$1,072,645 |
$1,093,859 |
$1,098,178 |
6/23 |
$1,078,792 |
$1,104,817 |
$1,110,468 |
7/23 |
$1,081,283 |
$1,109,187 |
$1,115,728 |
8/23 |
$1,071,476 |
$1,093,219 |
$1,095,371 |
9/23 |
$1,043,170 |
$1,061,178 |
$1,059,185 |
10/23 |
$1,029,938 |
$1,052,148 |
$1,051,671 |
11/23 |
$1,086,166 |
$1,118,940 |
$1,120,197 |
12/23 |
$1,109,632 |
$1,144,946 |
$1,148,646 |
1/24 |
$1,110,305 |
$1,139,098 |
$1,140,715 |
2/24 |
$1,110,998 |
$1,140,561 |
$1,142,159 |
3/24 |
$1,111,706 |
$1,140,525 |
$1,147,822 |
4/24 |
$1,102,217 |
$1,126,400 |
$1,133,468 |
5/24 |
$1,103,003 |
$1,123,096 |
$1,132,077 |
6/24 |
$1,119,298 |
$1,140,311 |
$1,151,027 |
7/24 |
$1,127,866 |
$1,150,704 |
$1,161,686 |
8/24 |
$1,132,711 |
$1,159,779 |
$1,170,704 |
9/24 |
$1,145,315 |
$1,171,242 |
$1,182,927 |
10/24 |
$1,127,960 |
$1,154,164 |
$1,166,252 |
11/24 |
$1,149,803 |
$1,174,101 |
$1,187,539 |
12/24 |
$1,133,647 |
$1,157,008 |
$1,168,929 |
1/25 |
$1,135,798 |
$1,162,807 |
$1,176,543 |
2/25 |
$1,147,134 |
$1,174,336 |
$1,188,532 |
3/25 |
$1,125,542 |
$1,154,434 |
$1,167,434 |
4/25 |
$1,118,545 |
$1,145,133 |
$1,153,377 |
5/25 |
$1,111,431 |
$1,145,869 |
$1,152,843 |
6/25 |
$1,117,677 |
$1,153,002 |
$1,160,447 |
7/25 |
$1,108,790 |
$1,150,674 |
$1,157,184 |
8/25 |
$1,117,610 |
$1,160,675 |
$1,168,988 |
9/25 |
$1,150,873 |
$1,187,554 |
$1,195,581 |
10/25 |
$1,168,040 |
$1,202,283 |
$1,214,241 |
11/25 |
$1,173,105 |
$1,205,041 |
$1,217,237 |
12/25 |
$1,174,088 |
$1,206,125 |
$1,216,658 |
1/26 |
$1,183,208 |
$1,217,445 |
$1,228,441 |
2/26 |
$1,201,764 |
$1,232,618 |
$1,245,237 |
3/26 |
$1,179,070 |
$1,203,989 |
$1,218,458 |
4/26 |
$1,193,702 |
$1,217,775 |
$1,235,449 |
5/26 |
$1,201,354 |
$1,222,322 |
$1,237,459 |
6/26 |
$1,213,285 |
$1,234,103 |
$1,251,208 |
7/26 |
$1,190,424 |
$1,211,258 |
$1,227,725 |
8/26 |
$1,186,990 |
$1,208,488 |
$1,223,024 |
|
| Average Annual Return [Table Text Block] |
Table Summary
Fund |
1 Year |
5 Years |
10 Years |
Class I |
6.21% |
0.80% |
1.73% |
Bloomberg Municipal Bond Index |
4.12% |
0.54% |
1.91% |
Bloomberg South Carolina Municipal Bond Index |
4.62% |
0.67% |
2.03% | |
| No Deduction of Taxes [Text Block] |
Performance does not reflect the deduction of taxes that a shareholder would pay on Fund distributions or redemption of Fund shares.
|
| Updated Performance Information Location [Text Block] |
For more recent performance information, visit www.eatonvance.com/performance.php.
|
| AssetsNet |
$ 225,098,235
|
| Holdings Count | Holding |
162
|
| Advisory Fees Paid, Amount |
$ 858,115
|
| InvestmentCompanyPortfolioTurnover |
71.00%
|
| Additional Fund Statistics [Text Block] |
Table Summary
Total Net Assets |
$225,098,235 |
# of Portfolio Holdings |
162 |
Portfolio Turnover Rate |
71% |
Total Advisory Fees Paid |
$858,115 | |
| Holdings [Text Block] |
Sector Allocation (% of total investments)
Table Summary
Value |
Value |
OtherFootnote Reference* |
4.3% |
Senior Living/Life Care |
4.2% |
Transportation |
5.3% |
Short-Term Investments |
5.9% |
Lease Rev./Cert. of Participation |
6.9% |
Education |
8.5% |
Electric Utilities |
8.5% |
Housing |
8.7% |
Water and Sewer |
11.5% |
General Obligations |
15.5% |
Hospital |
20.7% |
| Footnote |
Description |
Footnote* |
Sectors less than 3% each. | |
| Credit Quality Explanation [Text Block] |
Credit Quality (% of total investments)Footnote Referencea
Table Summary
Value |
Value |
NR |
6.2% |
BB |
2.4% |
BBB |
3.4% |
A |
21.5% |
AA |
49.9% |
AAA |
16.6% |
| Footnote |
Description |
Footnotea |
Ratings are based on Moody’s Investors Service, Inc. (“Moody’s”), S&P Global Ratings (“S&P”) or Fitch Ratings (“Fitch”). If securities are rated differently by the ratings agencies, the highest rating is applied. Moody's ratings are converted to the S&P and Fitch scale with ratings ranging from AAA, being the highest, to D, being the lowest. Ratings of BBB or higher are considered to be investment-grade quality. Holdings designated as “Not Rated” (if any) are not rated by the national ratings agencies stated above. | |
| Material Fund Change [Text Block] |
|
| Updated Prospectus Phone Number |
1-800-262-1122
|
| C000013157 |
|
| Shareholder Report [Line Items] |
|
| Fund Name |
Eaton Vance Virginia Municipal Income Fund
|
| Class Name |
Class A
|
| Trading Symbol |
ETVAX
|
| Annual or Semi-Annual Statement [Text Block] |
This annual shareholder report contains important information about the Eaton Vance Virginia Municipal Income Fund for the period of September 1, 2025 to August 31, 2026.
|
| Additional Information [Text Block] |
You can find additional information about the Fund at www.eatonvance.com/open-end-mutual-fund-documents.php. You can also request this information by contacting us at 1-800-262-1122.
|
| Additional Information Phone Number |
1-800-262-1122
|
| Additional Information Website |
<span style="box-sizing: border-box; color: rgb(0, 0, 0); display: inline; flex-wrap: nowrap; font-size: 10.6667px; font-weight: 400; grid-area: auto; line-height: 16px; margin: 0px; overflow: visible; text-align: left; text-align-last: auto; white-space-collapse: preserve-breaks;">www.eatonvance.com/open-end-mutual-fund-documents.php</span>
|
| Expenses [Text Block] |
What were the Fund costs for the last year?(based on a hypothetical $10,000 investment)
Table Summary
Class Name |
Costs of a $10,000 investment |
Costs paid as a percentage of a $10,000 investment |
Class A |
$78 |
0.76% | |
| Expenses Paid, Amount |
$ 78
|
| Expense Ratio, Percent |
0.76%
|
| Factors Affecting Performance [Text Block] |
How did the Fund perform last year and what affected its performance?Key contributors to (↑) and detractors from (↓) performance, relative to the Bloomberg Municipal Bond Index (the Index): ↑ Security selections in bonds with 22+ years remaining to maturity helped returns during the period ↑ An overweight exposure to and security selection in bonds with coupon rates between 4% and 4.99% also helped returns ↑ An overweight position and security selections in the hospital sector contributed to returns during the period ↓ An overweight position and security selections in the education sector detracted from returns during the period ↓ An out-of-index exposure to variable-rate demand notes (VRDNs)—typically considered a defensive investment—also detracted from returns during the period ↓ An overweight exposure to AAA-rated bonds also detracted from relative performance during the period |
| Performance Past Does Not Indicate Future [Text] |
THE FUND'S PAST PERFORMANCE IS NO GUARANTEE OF FUTURE RESULTS.
|
| Line Graph [Table Text Block] |
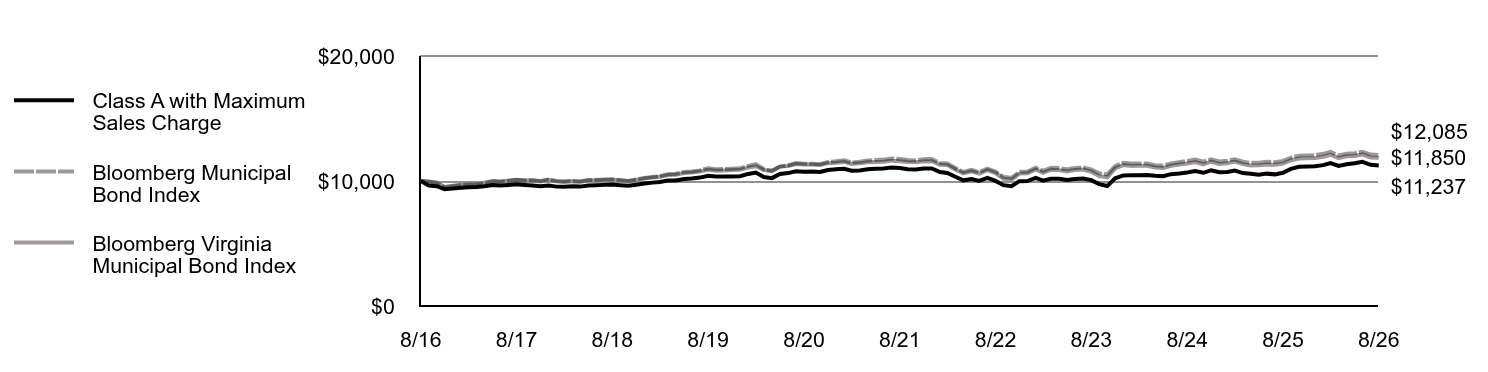
Table Summary
|
Class A with Maximum Sales Charge |
Bloomberg Municipal Bond Index |
Bloomberg Virginia Municipal Bond Index |
8/16 |
$10,000 |
$10,000 |
$10,000 |
9/16 |
$9,644 |
$9,950 |
$9,966 |
10/16 |
$9,589 |
$9,846 |
$9,871 |
11/16 |
$9,345 |
$9,479 |
$9,513 |
12/16 |
$9,408 |
$9,590 |
$9,631 |
1/17 |
$9,454 |
$9,653 |
$9,699 |
2/17 |
$9,505 |
$9,720 |
$9,761 |
3/17 |
$9,520 |
$9,741 |
$9,779 |
4/17 |
$9,584 |
$9,812 |
$9,856 |
5/17 |
$9,671 |
$9,968 |
$9,995 |
6/17 |
$9,649 |
$9,932 |
$9,964 |
7/17 |
$9,688 |
$10,012 |
$10,030 |
8/17 |
$9,739 |
$10,088 |
$10,097 |
9/17 |
$9,685 |
$10,037 |
$10,031 |
10/17 |
$9,642 |
$10,062 |
$10,039 |
11/17 |
$9,575 |
$10,008 |
$9,962 |
12/17 |
$9,632 |
$10,112 |
$10,083 |
1/18 |
$9,550 |
$9,993 |
$9,970 |
2/18 |
$9,531 |
$9,963 |
$9,937 |
3/18 |
$9,575 |
$10,000 |
$9,977 |
4/18 |
$9,551 |
$9,964 |
$9,936 |
5/18 |
$9,639 |
$10,079 |
$10,045 |
6/18 |
$9,666 |
$10,087 |
$10,054 |
7/18 |
$9,690 |
$10,112 |
$10,073 |
8/18 |
$9,719 |
$10,138 |
$10,096 |
9/18 |
$9,669 |
$10,072 |
$10,032 |
10/18 |
$9,618 |
$10,010 |
$9,981 |
11/18 |
$9,707 |
$10,121 |
$10,088 |
12/18 |
$9,795 |
$10,242 |
$10,205 |
1/19 |
$9,870 |
$10,319 |
$10,287 |
2/19 |
$9,921 |
$10,375 |
$10,340 |
3/19 |
$10,035 |
$10,539 |
$10,482 |
4/19 |
$10,048 |
$10,578 |
$10,507 |
5/19 |
$10,162 |
$10,724 |
$10,636 |
6/19 |
$10,198 |
$10,764 |
$10,675 |
7/19 |
$10,273 |
$10,850 |
$10,764 |
8/19 |
$10,424 |
$11,022 |
$10,901 |
9/19 |
$10,356 |
$10,933 |
$10,821 |
10/19 |
$10,351 |
$10,953 |
$10,846 |
11/19 |
$10,360 |
$10,980 |
$10,876 |
12/19 |
$10,385 |
$11,014 |
$10,901 |
1/20 |
$10,565 |
$11,212 |
$11,070 |
2/20 |
$10,681 |
$11,356 |
$11,179 |
3/20 |
$10,323 |
$10,944 |
$10,880 |
4/20 |
$10,228 |
$10,807 |
$10,813 |
5/20 |
$10,556 |
$11,151 |
$11,152 |
6/20 |
$10,633 |
$11,242 |
$11,199 |
7/20 |
$10,776 |
$11,432 |
$11,355 |
8/20 |
$10,746 |
$11,378 |
$11,320 |
9/20 |
$10,754 |
$11,381 |
$11,328 |
10/20 |
$10,721 |
$11,346 |
$11,287 |
11/20 |
$10,876 |
$11,518 |
$11,428 |
12/20 |
$10,937 |
$11,588 |
$11,467 |
1/21 |
$10,984 |
$11,662 |
$11,527 |
2/21 |
$10,830 |
$11,476 |
$11,367 |
3/21 |
$10,848 |
$11,547 |
$11,419 |
4/21 |
$10,934 |
$11,644 |
$11,496 |
5/21 |
$10,980 |
$11,679 |
$11,515 |
6/21 |
$10,998 |
$11,711 |
$11,544 |
7/21 |
$11,070 |
$11,808 |
$11,629 |
8/21 |
$11,033 |
$11,765 |
$11,586 |
9/21 |
$10,942 |
$11,680 |
$11,518 |
10/21 |
$10,919 |
$11,645 |
$11,494 |
11/21 |
$10,992 |
$11,745 |
$11,569 |
12/21 |
$10,997 |
$11,764 |
$11,586 |
1/22 |
$10,713 |
$11,442 |
$11,307 |
2/22 |
$10,637 |
$11,401 |
$11,272 |
3/22 |
$10,339 |
$11,031 |
$10,917 |
4/22 |
$10,055 |
$10,726 |
$10,614 |
5/22 |
$10,157 |
$10,885 |
$10,771 |
6/22 |
$10,011 |
$10,707 |
$10,592 |
7/22 |
$10,253 |
$10,990 |
$10,875 |
8/22 |
$10,007 |
$10,749 |
$10,629 |
9/22 |
$9,666 |
$10,336 |
$10,180 |
10/22 |
$9,588 |
$10,250 |
$10,113 |
11/22 |
$9,987 |
$10,730 |
$10,591 |
12/22 |
$9,993 |
$10,761 |
$10,615 |
1/23 |
$10,252 |
$11,070 |
$10,923 |
2/23 |
$10,022 |
$10,819 |
$10,654 |
3/23 |
$10,185 |
$11,059 |
$10,900 |
4/23 |
$10,179 |
$11,034 |
$10,870 |
5/23 |
$10,089 |
$10,939 |
$10,770 |
6/23 |
$10,163 |
$11,048 |
$10,884 |
7/23 |
$10,201 |
$11,092 |
$10,919 |
8/23 |
$10,070 |
$10,932 |
$10,743 |
9/23 |
$9,754 |
$10,612 |
$10,389 |
10/23 |
$9,595 |
$10,521 |
$10,293 |
11/23 |
$10,213 |
$11,189 |
$11,008 |
12/23 |
$10,443 |
$11,449 |
$11,274 |
1/24 |
$10,457 |
$11,391 |
$11,200 |
2/24 |
$10,456 |
$11,406 |
$11,217 |
3/24 |
$10,485 |
$11,405 |
$11,219 |
4/24 |
$10,412 |
$11,264 |
$11,077 |
5/24 |
$10,382 |
$11,231 |
$11,040 |
6/24 |
$10,546 |
$11,403 |
$11,219 |
7/24 |
$10,607 |
$11,507 |
$11,314 |
8/24 |
$10,686 |
$11,598 |
$11,393 |
9/24 |
$10,789 |
$11,712 |
$11,509 |
10/24 |
$10,656 |
$11,542 |
$11,336 |
11/24 |
$10,849 |
$11,741 |
$11,544 |
12/24 |
$10,700 |
$11,570 |
$11,366 |
1/25 |
$10,728 |
$11,628 |
$11,428 |
2/25 |
$10,830 |
$11,743 |
$11,547 |
3/25 |
$10,634 |
$11,544 |
$11,349 |
4/25 |
$10,574 |
$11,451 |
$11,243 |
5/25 |
$10,497 |
$11,459 |
$11,262 |
6/25 |
$10,589 |
$11,530 |
$11,322 |
7/25 |
$10,531 |
$11,507 |
$11,297 |
8/25 |
$10,660 |
$11,607 |
$11,387 |
9/25 |
$10,966 |
$11,876 |
$11,661 |
10/25 |
$11,134 |
$12,023 |
$11,795 |
11/25 |
$11,165 |
$12,050 |
$11,829 |
12/25 |
$11,179 |
$12,061 |
$11,836 |
1/26 |
$11,271 |
$12,174 |
$11,944 |
2/26 |
$11,440 |
$12,326 |
$12,101 |
3/26 |
$11,204 |
$12,040 |
$11,820 |
4/26 |
$11,343 |
$12,178 |
$11,979 |
5/26 |
$11,419 |
$12,223 |
$12,008 |
6/26 |
$11,529 |
$12,341 |
$12,129 |
7/26 |
$11,291 |
$12,113 |
$11,884 |
8/26 |
$11,237 |
$12,085 |
$11,850 |
|
| Average Annual Return [Table Text Block] |
Table Summary
Fund |
1 Year |
5 Years |
10 Years |
Class A |
5.46% |
0.37% |
1.51% |
Class A with 3.25% Maximum Sales Charge |
2.08% |
(0.28)% |
1.17% |
Bloomberg Municipal Bond Index |
4.12% |
0.54% |
1.91% |
Bloomberg Virginia Municipal Bond Index |
4.07% |
0.45% |
1.71% | |
| No Deduction of Taxes [Text Block] |
Performance does not reflect the deduction of taxes that a shareholder would pay on Fund distributions or redemption of Fund shares.
|
| Updated Performance Information Location [Text Block] |
For more recent performance information, visit www.eatonvance.com/performance.php.
|
| AssetsNet |
$ 82,907,450
|
| Holdings Count | Holding |
125
|
| Advisory Fees Paid, Amount |
$ 224,541
|
| InvestmentCompanyPortfolioTurnover |
92.00%
|
| Additional Fund Statistics [Text Block] |
Table Summary
Total Net Assets |
$82,907,450 |
# of Portfolio Holdings |
125 |
Portfolio Turnover Rate |
92% |
Total Advisory Fees Paid |
$224,541 | |
| Holdings [Text Block] |
Sector Allocation (% of total investments)
Table Summary
Value |
Value |
OtherFootnote Reference* |
11.7% |
Housing |
3.5% |
Bond Bank |
5.0% |
Hospital |
6.2% |
Senior Living/Life Care |
6.5% |
Education |
8.2% |
Lease Rev./Cert. of Participation |
9.1% |
Transportation |
11.4% |
Water and Sewer |
12.3% |
General Obligations |
26.1% |
| Footnote |
Description |
Footnote* |
Sectors less than 3% each. | |
| Credit Quality Explanation [Text Block] |
Credit Quality (% of total investments)Footnote Referencea
Table Summary
Value |
Value |
NR |
7.7% |
B |
0.9% |
BB |
2.5% |
BBB |
5.2% |
A |
4.9% |
AA |
44.1% |
AAA |
34.7% |
| Footnote |
Description |
Footnotea |
Ratings are based on Moody’s Investors Service, Inc. (“Moody’s”), S&P Global Ratings (“S&P”) or Fitch Ratings (“Fitch”). If securities are rated differently by the ratings agencies, the highest rating is applied. Moody's ratings are converted to the S&P and Fitch scale with ratings ranging from AAA, being the highest, to D, being the lowest. Ratings of BBB or higher are considered to be investment-grade quality. Holdings designated as “Not Rated” (if any) are not rated by the national ratings agencies stated above. | |
| Material Fund Change [Text Block] |
|
| Updated Prospectus Phone Number |
1-800-262-1122
|
| C000013159 |
|
| Shareholder Report [Line Items] |
|
| Fund Name |
Eaton Vance Virginia Municipal Income Fund
|
| Class Name |
Class C
|
| Trading Symbol |
ECVAX
|
| Annual or Semi-Annual Statement [Text Block] |
This annual shareholder report contains important information about the Eaton Vance Virginia Municipal Income Fund for the period of September 1, 2025 to August 31, 2026.
|
| Additional Information [Text Block] |
You can find additional information about the Fund at www.eatonvance.com/open-end-mutual-fund-documents.php. You can also request this information by contacting us at 1-800-262-1122.
|
| Additional Information Phone Number |
1-800-262-1122
|
| Additional Information Website |
<span style="box-sizing: border-box; color: rgb(0, 0, 0); display: inline; flex-wrap: nowrap; font-size: 10.6667px; font-weight: 400; grid-area: auto; line-height: 16px; margin: 0px; overflow: visible; text-align: left; text-align-last: auto; white-space-collapse: preserve-breaks;">www.eatonvance.com/open-end-mutual-fund-documents.php</span>
|
| Expenses [Text Block] |
What were the Fund costs for the last year?(based on a hypothetical $10,000 investment)
Table Summary
Class Name |
Costs of a $10,000 investment |
Costs paid as a percentage of a $10,000 investment |
Class C |
$155 |
1.51% | |
| Expenses Paid, Amount |
$ 155
|
| Expense Ratio, Percent |
1.51%
|
| Factors Affecting Performance [Text Block] |
How did the Fund perform last year and what affected its performance?Key contributors to (↑) and detractors from (↓) performance, relative to the Bloomberg Municipal Bond Index (the Index): ↑ Security selections in bonds with 22+ years remaining to maturity helped returns during the period ↑ An overweight exposure to and security selection in bonds with coupon rates between 4% and 4.99% also helped returns ↑ An overweight position and security selections in the hospital sector contributed to returns during the period ↓ An overweight position and security selections in the education sector detracted from returns during the period ↓ An out-of-index exposure to variable-rate demand notes (VRDNs)—typically considered a defensive investment—also detracted from returns during the period ↓ An overweight exposure to AAA-rated bonds also detracted from relative performance during the period |
| Performance Past Does Not Indicate Future [Text] |
THE FUND'S PAST PERFORMANCE IS NO GUARANTEE OF FUTURE RESULTS.
|
| Line Graph [Table Text Block] |
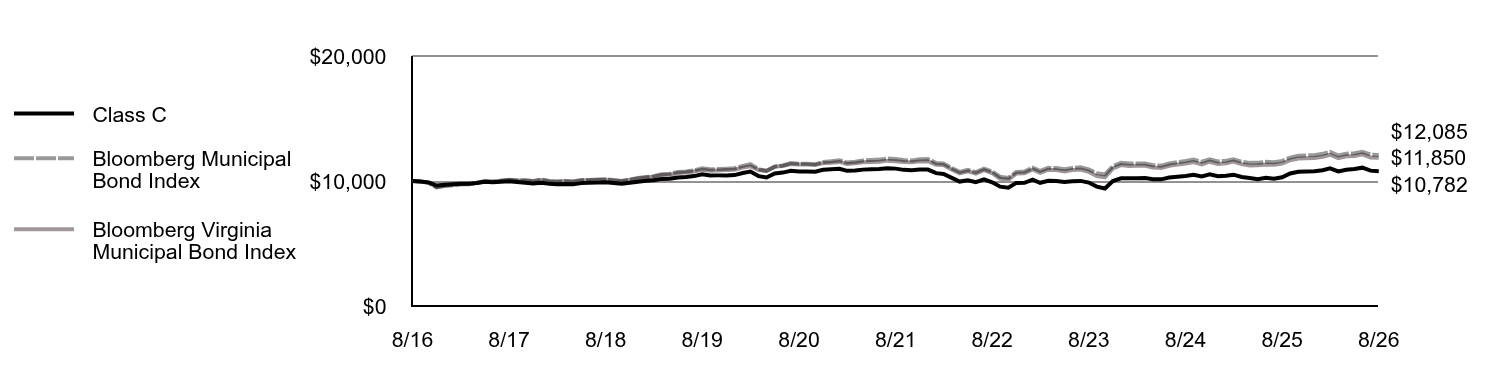
Table Summary
|
Class C |
Bloomberg Municipal Bond Index |
Bloomberg Virginia Municipal Bond Index |
8/16 |
$10,000 |
$10,000 |
$10,000 |
9/16 |
$9,957 |
$9,950 |
$9,966 |
10/16 |
$9,891 |
$9,846 |
$9,871 |
11/16 |
$9,638 |
$9,479 |
$9,513 |
12/16 |
$9,694 |
$9,590 |
$9,631 |
1/17 |
$9,745 |
$9,653 |
$9,699 |
2/17 |
$9,779 |
$9,720 |
$9,761 |
3/17 |
$9,789 |
$9,741 |
$9,779 |
4/17 |
$9,844 |
$9,812 |
$9,856 |
5/17 |
$9,944 |
$9,968 |
$9,995 |
6/17 |
$9,909 |
$9,932 |
$9,964 |
7/17 |
$9,942 |
$10,012 |
$10,030 |
8/17 |
$9,987 |
$10,088 |
$10,097 |
9/17 |
$9,922 |
$10,037 |
$10,031 |
10/17 |
$9,867 |
$10,062 |
$10,039 |
11/17 |
$9,802 |
$10,008 |
$9,962 |
12/17 |
$9,851 |
$10,112 |
$10,083 |
1/18 |
$9,771 |
$9,993 |
$9,970 |
2/18 |
$9,741 |
$9,963 |
$9,937 |
3/18 |
$9,766 |
$10,000 |
$9,977 |
4/18 |
$9,741 |
$9,964 |
$9,936 |
5/18 |
$9,830 |
$10,079 |
$10,045 |
6/18 |
$9,851 |
$10,087 |
$10,054 |
7/18 |
$9,870 |
$10,112 |
$10,073 |
8/18 |
$9,892 |
$10,138 |
$10,096 |
9/18 |
$9,843 |
$10,072 |
$10,032 |
10/18 |
$9,781 |
$10,010 |
$9,981 |
11/18 |
$9,860 |
$10,121 |
$10,088 |
12/18 |
$9,948 |
$10,242 |
$10,205 |
1/19 |
$10,012 |
$10,319 |
$10,287 |
2/19 |
$10,055 |
$10,375 |
$10,340 |
3/19 |
$10,168 |
$10,539 |
$10,482 |
4/19 |
$10,176 |
$10,578 |
$10,507 |
5/19 |
$10,287 |
$10,724 |
$10,636 |
6/19 |
$10,317 |
$10,764 |
$10,675 |
7/19 |
$10,392 |
$10,850 |
$10,764 |
8/19 |
$10,538 |
$11,022 |
$10,901 |
9/19 |
$10,447 |
$10,933 |
$10,821 |
10/19 |
$10,450 |
$10,953 |
$10,846 |
11/19 |
$10,443 |
$10,980 |
$10,876 |
12/19 |
$10,473 |
$11,014 |
$10,901 |
1/20 |
$10,644 |
$11,212 |
$11,070 |
2/20 |
$10,757 |
$11,356 |
$11,179 |
3/20 |
$10,392 |
$10,944 |
$10,880 |
4/20 |
$10,278 |
$10,807 |
$10,813 |
5/20 |
$10,607 |
$11,151 |
$11,152 |
6/20 |
$10,673 |
$11,242 |
$11,199 |
7/20 |
$10,822 |
$11,432 |
$11,355 |
8/20 |
$10,766 |
$11,378 |
$11,320 |
9/20 |
$10,769 |
$11,381 |
$11,328 |
10/20 |
$10,746 |
$11,346 |
$11,287 |
11/20 |
$10,894 |
$11,518 |
$11,428 |
12/20 |
$10,944 |
$11,588 |
$11,467 |
1/21 |
$10,981 |
$11,662 |
$11,527 |
2/21 |
$10,814 |
$11,476 |
$11,367 |
3/21 |
$10,837 |
$11,547 |
$11,419 |
4/21 |
$10,910 |
$11,644 |
$11,496 |
5/21 |
$10,946 |
$11,679 |
$11,515 |
6/21 |
$10,957 |
$11,711 |
$11,544 |
7/21 |
$11,016 |
$11,808 |
$11,629 |
8/21 |
$10,990 |
$11,765 |
$11,586 |
9/21 |
$10,891 |
$11,680 |
$11,518 |
10/21 |
$10,853 |
$11,645 |
$11,494 |
11/21 |
$10,914 |
$11,745 |
$11,569 |
12/21 |
$10,913 |
$11,764 |
$11,586 |
1/22 |
$10,629 |
$11,442 |
$11,307 |
2/22 |
$10,556 |
$11,401 |
$11,272 |
3/22 |
$10,248 |
$11,031 |
$10,917 |
4/22 |
$9,953 |
$10,726 |
$10,614 |
5/22 |
$10,052 |
$10,885 |
$10,771 |
6/22 |
$9,904 |
$10,707 |
$10,592 |
7/22 |
$10,129 |
$10,990 |
$10,875 |
8/22 |
$9,893 |
$10,749 |
$10,629 |
9/22 |
$9,547 |
$10,336 |
$10,180 |
10/22 |
$9,461 |
$10,250 |
$10,113 |
11/22 |
$9,849 |
$10,730 |
$10,591 |
12/22 |
$9,851 |
$10,761 |
$10,615 |
1/23 |
$10,102 |
$11,070 |
$10,923 |
2/23 |
$9,856 |
$10,819 |
$10,654 |
3/23 |
$10,022 |
$11,059 |
$10,900 |
4/23 |
$10,000 |
$11,034 |
$10,870 |
5/23 |
$9,916 |
$10,939 |
$10,770 |
6/23 |
$9,978 |
$11,048 |
$10,884 |
7/23 |
$10,008 |
$11,092 |
$10,919 |
8/23 |
$9,875 |
$10,932 |
$10,743 |
9/23 |
$9,554 |
$10,612 |
$10,389 |
10/23 |
$9,398 |
$10,521 |
$10,293 |
11/23 |
$9,992 |
$11,189 |
$11,008 |
12/23 |
$10,217 |
$11,449 |
$11,274 |
1/24 |
$10,212 |
$11,391 |
$11,200 |
2/24 |
$10,221 |
$11,406 |
$11,217 |
3/24 |
$10,243 |
$11,405 |
$11,219 |
4/24 |
$10,149 |
$11,264 |
$11,077 |
5/24 |
$10,132 |
$11,231 |
$11,040 |
6/24 |
$10,273 |
$11,403 |
$11,219 |
7/24 |
$10,336 |
$11,507 |
$11,314 |
8/24 |
$10,401 |
$11,598 |
$11,393 |
9/24 |
$10,489 |
$11,712 |
$11,509 |
10/24 |
$10,367 |
$11,542 |
$11,336 |
11/24 |
$10,533 |
$11,741 |
$11,544 |
12/24 |
$10,386 |
$11,570 |
$11,366 |
1/25 |
$10,420 |
$11,628 |
$11,428 |
2/25 |
$10,506 |
$11,743 |
$11,547 |
3/25 |
$10,317 |
$11,544 |
$11,349 |
4/25 |
$10,235 |
$11,451 |
$11,243 |
5/25 |
$10,151 |
$11,459 |
$11,262 |
6/25 |
$10,254 |
$11,530 |
$11,322 |
7/25 |
$10,174 |
$11,507 |
$11,297 |
8/25 |
$10,296 |
$11,607 |
$11,387 |
9/25 |
$10,600 |
$11,876 |
$11,661 |
10/25 |
$10,743 |
$12,023 |
$11,795 |
11/25 |
$10,765 |
$12,050 |
$11,829 |
12/25 |
$10,774 |
$12,061 |
$11,836 |
1/26 |
$10,863 |
$12,174 |
$11,944 |
2/26 |
$11,006 |
$12,326 |
$12,101 |
3/26 |
$10,770 |
$12,040 |
$11,820 |
4/26 |
$10,901 |
$12,178 |
$11,979 |
5/26 |
$10,963 |
$12,223 |
$12,008 |
6/26 |
$11,067 |
$12,341 |
$12,129 |
7/26 |
$10,830 |
$12,113 |
$11,884 |
8/26 |
$10,782 |
$12,085 |
$11,850 |
|
| Average Annual Return [Table Text Block] |
Table Summary
Fund |
1 Year |
5 Years |
10 Years |
Class C, with conversion to Class A after 8 years |
4.72% |
(0.38)% |
0.76% |
Class C, with 1% Maximum Contingent Deferred Sales Charge and conversion to Class A after 8 years |
3.72% |
(0.38)% |
0.76% |
Bloomberg Municipal Bond Index |
4.12% |
0.54% |
1.91% |
Bloomberg Virginia Municipal Bond Index |
4.07% |
0.45% |
1.71% | |
| No Deduction of Taxes [Text Block] |
Performance does not reflect the deduction of taxes that a shareholder would pay on Fund distributions or redemption of Fund shares.
|
| Updated Performance Information Location [Text Block] |
For more recent performance information, visit www.eatonvance.com/performance.php.
|
| AssetsNet |
$ 82,907,450
|
| Holdings Count | Holding |
125
|
| Advisory Fees Paid, Amount |
$ 224,541
|
| InvestmentCompanyPortfolioTurnover |
92.00%
|
| Additional Fund Statistics [Text Block] |
Table Summary
Total Net Assets |
$82,907,450 |
# of Portfolio Holdings |
125 |
Portfolio Turnover Rate |
92% |
Total Advisory Fees Paid |
$224,541 | |
| Holdings [Text Block] |
Sector Allocation (% of total investments)
Table Summary
Value |
Value |
OtherFootnote Reference* |
11.7% |
Housing |
3.5% |
Bond Bank |
5.0% |
Hospital |
6.2% |
Senior Living/Life Care |
6.5% |
Education |
8.2% |
Lease Rev./Cert. of Participation |
9.1% |
Transportation |
11.4% |
Water and Sewer |
12.3% |
General Obligations |
26.1% |
| Footnote |
Description |
Footnote* |
Sectors less than 3% each. | |
| Credit Quality Explanation [Text Block] |
Credit Quality (% of total investments)Footnote Referencea
Table Summary
Value |
Value |
NR |
7.7% |
B |
0.9% |
BB |
2.5% |
BBB |
5.2% |
A |
4.9% |
AA |
44.1% |
AAA |
34.7% |
| Footnote |
Description |
Footnotea |
Ratings are based on Moody’s Investors Service, Inc. (“Moody’s”), S&P Global Ratings (“S&P”) or Fitch Ratings (“Fitch”). If securities are rated differently by the ratings agencies, the highest rating is applied. Moody's ratings are converted to the S&P and Fitch scale with ratings ranging from AAA, being the highest, to D, being the lowest. Ratings of BBB or higher are considered to be investment-grade quality. Holdings designated as “Not Rated” (if any) are not rated by the national ratings agencies stated above. | |
| Material Fund Change [Text Block] |
|
| Updated Prospectus Phone Number |
1-800-262-1122
|
| C000063953 |
|
| Shareholder Report [Line Items] |
|
| Fund Name |
Eaton Vance Virginia Municipal Income Fund
|
| Class Name |
Class I
|
| Trading Symbol |
EVAIX
|
| Annual or Semi-Annual Statement [Text Block] |
This annual shareholder report contains important information about the Eaton Vance Virginia Municipal Income Fund for the period of September 1, 2025 to August 31, 2026.
|
| Additional Information [Text Block] |
You can find additional information about the Fund at www.eatonvance.com/open-end-mutual-fund-documents.php. You can also request this information by contacting us at 1-800-262-1122.
|
| Additional Information Phone Number |
1-800-262-1122
|
| Additional Information Website |
<span style="box-sizing: border-box; color: rgb(0, 0, 0); display: inline; flex-wrap: nowrap; font-size: 10.6667px; font-weight: 400; grid-area: auto; line-height: 16px; margin: 0px; overflow: visible; text-align: left; text-align-last: auto; white-space-collapse: preserve-breaks;">www.eatonvance.com/open-end-mutual-fund-documents.php</span>
|
| Expenses [Text Block] |
What were the Fund costs for the last year?(based on a hypothetical $10,000 investment)
Table Summary
Class Name |
Costs of a $10,000 investment |
Costs paid as a percentage of a $10,000 investment |
Class I |
$58 |
0.56% | |
| Expenses Paid, Amount |
$ 58
|
| Expense Ratio, Percent |
0.56%
|
| Factors Affecting Performance [Text Block] |
How did the Fund perform last year and what affected its performance?Key contributors to (↑) and detractors from (↓) performance, relative to the Bloomberg Municipal Bond Index (the Index): ↑ Security selections in bonds with 22+ years remaining to maturity helped returns during the period ↑ An overweight exposure to and security selection in bonds with coupon rates between 4% and 4.99% also helped returns ↑ An overweight position and security selections in the hospital sector contributed to returns during the period ↓ An overweight position and security selections in the education sector detracted from returns during the period ↓ An out-of-index exposure to variable-rate demand notes (VRDNs)—typically considered a defensive investment—also detracted from returns during the period ↓ An overweight exposure to AAA-rated bonds also detracted from relative performance during the period |
| Performance Past Does Not Indicate Future [Text] |
THE FUND'S PAST PERFORMANCE IS NO GUARANTEE OF FUTURE RESULTS.
|
| Line Graph [Table Text Block] |
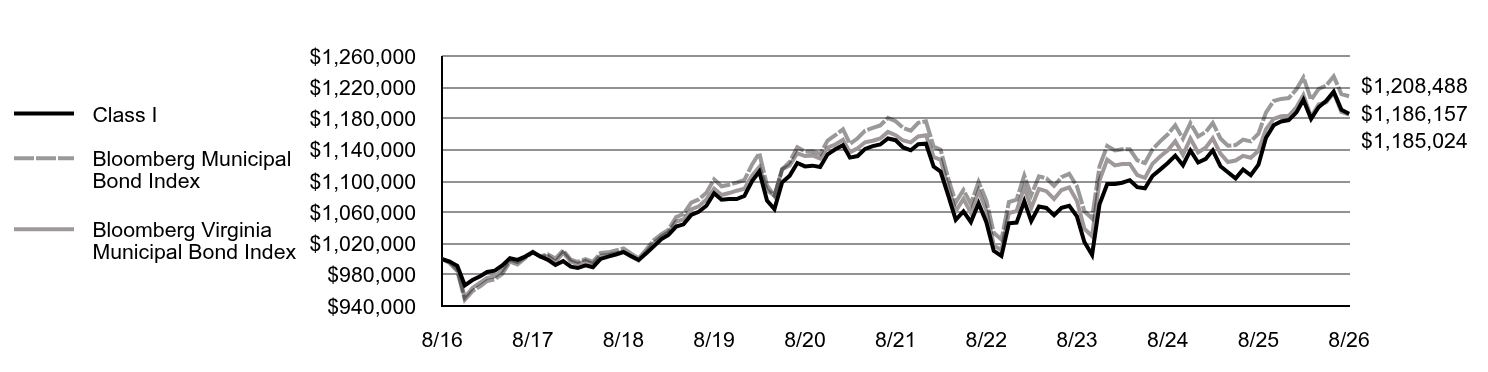
Table Summary
|
Class I |
Bloomberg Municipal Bond Index |
Bloomberg Virginia Municipal Bond Index |
8/16 |
$1,000,000 |
$1,000,000 |
$1,000,000 |
9/16 |
$996,976 |
$995,009 |
$996,630 |
10/16 |
$991,474 |
$984,570 |
$987,058 |
11/16 |
$966,483 |
$947,850 |
$951,252 |
12/16 |
$973,186 |
$958,978 |
$963,105 |
1/17 |
$978,062 |
$965,300 |
$969,947 |
2/17 |
$983,531 |
$972,003 |
$976,126 |
3/17 |
$985,252 |
$974,113 |
$977,945 |
4/17 |
$991,942 |
$981,182 |
$985,636 |
5/17 |
$1,001,099 |
$996,754 |
$999,461 |
6/17 |
$999,063 |
$993,179 |
$996,365 |
7/17 |
$1,003,246 |
$1,001,214 |
$1,003,040 |
8/17 |
$1,008,724 |
$1,008,833 |
$1,009,650 |
9/17 |
$1,003,297 |
$1,003,704 |
$1,003,075 |
10/17 |
$999,120 |
$1,006,154 |
$1,003,860 |
11/17 |
$992,468 |
$1,000,767 |
$996,249 |
12/17 |
$997,366 |
$1,011,227 |
$1,008,314 |
1/18 |
$990,321 |
$999,322 |
$997,041 |
2/18 |
$988,597 |
$996,336 |
$993,739 |
3/18 |
$991,967 |
$1,000,013 |
$997,654 |
4/18 |
$989,694 |
$996,445 |
$993,583 |
5/18 |
$1,000,296 |
$1,007,855 |
$1,004,526 |
6/18 |
$1,003,241 |
$1,008,715 |
$1,005,352 |
7/18 |
$1,005,927 |
$1,011,163 |
$1,007,256 |
8/18 |
$1,009,038 |
$1,013,760 |
$1,009,556 |
9/18 |
$1,004,061 |
$1,007,197 |
$1,003,237 |
10/18 |
$998,989 |
$1,000,994 |
$998,080 |
11/18 |
$1,007,075 |
$1,012,073 |
$1,008,848 |
12/18 |
$1,016,317 |
$1,024,191 |
$1,020,526 |
1/19 |
$1,025,594 |
$1,031,933 |
$1,028,713 |
2/19 |
$1,031,002 |
$1,037,459 |
$1,034,000 |
3/19 |
$1,041,698 |
$1,053,858 |
$1,048,189 |
4/19 |
$1,044,516 |
$1,057,819 |
$1,050,702 |
5/19 |
$1,056,517 |
$1,072,403 |
$1,063,611 |
6/19 |
$1,060,491 |
$1,076,362 |
$1,067,509 |
7/19 |
$1,068,394 |
$1,085,037 |
$1,076,389 |
8/19 |
$1,084,319 |
$1,102,152 |
$1,090,140 |
9/19 |
$1,076,023 |
$1,093,317 |
$1,082,146 |
10/19 |
$1,077,077 |
$1,095,276 |
$1,084,581 |
11/19 |
$1,076,905 |
$1,098,016 |
$1,087,593 |
12/19 |
$1,080,996 |
$1,101,368 |
$1,090,146 |
1/20 |
$1,099,910 |
$1,121,156 |
$1,106,977 |
2/20 |
$1,112,117 |
$1,135,614 |
$1,117,949 |
3/20 |
$1,075,085 |
$1,094,422 |
$1,087,997 |
4/20 |
$1,064,099 |
$1,080,687 |
$1,081,345 |
5/20 |
$1,098,368 |
$1,115,065 |
$1,115,154 |
6/20 |
$1,106,583 |
$1,124,242 |
$1,119,862 |
7/20 |
$1,122,998 |
$1,143,177 |
$1,135,528 |
8/20 |
$1,118,670 |
$1,137,813 |
$1,131,984 |
9/20 |
$1,119,639 |
$1,138,054 |
$1,132,777 |
10/20 |
$1,117,819 |
$1,134,636 |
$1,128,723 |
11/20 |
$1,134,144 |
$1,151,758 |
$1,142,831 |
12/20 |
$1,140,675 |
$1,158,774 |
$1,146,678 |
1/21 |
$1,145,724 |
$1,166,159 |
$1,152,654 |
2/21 |
$1,129,939 |
$1,147,630 |
$1,136,669 |
3/21 |
$1,131,949 |
$1,154,708 |
$1,141,855 |
4/21 |
$1,141,127 |
$1,164,393 |
$1,149,599 |
5/21 |
$1,144,658 |
$1,167,867 |
$1,151,489 |
6/21 |
$1,146,754 |
$1,171,074 |
$1,154,428 |
7/21 |
$1,154,442 |
$1,180,786 |
$1,162,850 |
8/21 |
$1,152,233 |
$1,176,453 |
$1,158,582 |
9/21 |
$1,142,959 |
$1,167,963 |
$1,151,816 |
10/21 |
$1,139,312 |
$1,164,548 |
$1,149,436 |
11/21 |
$1,147,096 |
$1,174,461 |
$1,156,948 |
12/21 |
$1,147,804 |
$1,176,356 |
$1,158,644 |
1/22 |
$1,118,445 |
$1,144,156 |
$1,130,692 |
2/22 |
$1,112,072 |
$1,140,057 |
$1,127,179 |
3/22 |
$1,081,221 |
$1,103,100 |
$1,091,680 |
4/22 |
$1,050,368 |
$1,072,589 |
$1,061,438 |
5/22 |
$1,061,180 |
$1,088,522 |
$1,077,115 |
6/22 |
$1,047,515 |
$1,070,693 |
$1,059,219 |
7/22 |
$1,071,516 |
$1,098,983 |
$1,087,452 |
8/22 |
$1,047,550 |
$1,074,897 |
$1,062,868 |
9/22 |
$1,010,649 |
$1,033,642 |
$1,018,035 |
10/22 |
$1,004,165 |
$1,025,046 |
$1,011,323 |
11/22 |
$1,045,926 |
$1,072,991 |
$1,059,066 |
12/22 |
$1,046,771 |
$1,076,063 |
$1,061,506 |
1/23 |
$1,074,067 |
$1,106,973 |
$1,092,312 |
2/23 |
$1,048,671 |
$1,081,942 |
$1,065,391 |
3/23 |
$1,067,355 |
$1,105,948 |
$1,089,966 |
4/23 |
$1,065,501 |
$1,103,421 |
$1,086,993 |
5/23 |
$1,056,214 |
$1,093,859 |
$1,077,000 |
6/23 |
$1,065,623 |
$1,104,817 |
$1,088,391 |
7/23 |
$1,068,325 |
$1,109,187 |
$1,091,850 |
8/23 |
$1,054,751 |
$1,093,219 |
$1,074,287 |
9/23 |
$1,021,904 |
$1,061,178 |
$1,038,943 |
10/23 |
$1,005,487 |
$1,052,148 |
$1,029,340 |
11/23 |
$1,070,303 |
$1,118,940 |
$1,100,846 |
12/23 |
$1,096,060 |
$1,144,946 |
$1,127,354 |
1/24 |
$1,096,189 |
$1,139,098 |
$1,120,023 |
2/24 |
$1,097,820 |
$1,140,561 |
$1,121,719 |
3/24 |
$1,101,016 |
$1,140,525 |
$1,121,878 |
4/24 |
$1,092,031 |
$1,126,400 |
$1,107,651 |
5/24 |
$1,090,649 |
$1,123,096 |
$1,104,011 |
6/24 |
$1,106,401 |
$1,140,311 |
$1,121,884 |
7/24 |
$1,114,574 |
$1,150,704 |
$1,131,354 |
8/24 |
$1,122,988 |
$1,159,779 |
$1,139,333 |
9/24 |
$1,132,493 |
$1,171,242 |
$1,150,895 |
10/24 |
$1,120,208 |
$1,154,164 |
$1,133,583 |
11/24 |
$1,139,119 |
$1,174,101 |
$1,154,372 |
12/24 |
$1,123,658 |
$1,157,008 |
$1,136,614 |
1/25 |
$1,128,419 |
$1,162,807 |
$1,142,812 |
2/25 |
$1,139,279 |
$1,174,336 |
$1,154,687 |
3/25 |
$1,118,925 |
$1,154,434 |
$1,134,939 |
4/25 |
$1,111,222 |
$1,145,133 |
$1,124,325 |
5/25 |
$1,103,386 |
$1,145,869 |
$1,126,240 |
6/25 |
$1,114,746 |
$1,153,002 |
$1,132,216 |
7/25 |
$1,107,328 |
$1,150,674 |
$1,129,729 |
8/25 |
$1,121,000 |
$1,160,675 |
$1,138,702 |
9/25 |
$1,154,990 |
$1,187,554 |
$1,166,095 |
10/25 |
$1,171,245 |
$1,202,283 |
$1,179,464 |
11/25 |
$1,176,244 |
$1,205,041 |
$1,182,881 |
12/25 |
$1,177,994 |
$1,206,125 |
$1,183,555 |
1/26 |
$1,187,851 |
$1,217,445 |
$1,194,406 |
2/26 |
$1,204,102 |
$1,232,618 |
$1,210,122 |
3/26 |
$1,179,570 |
$1,203,989 |
$1,182,007 |
4/26 |
$1,194,399 |
$1,217,775 |
$1,197,880 |
5/26 |
$1,202,621 |
$1,222,322 |
$1,200,801 |
6/26 |
$1,214,303 |
$1,234,103 |
$1,212,924 |
7/26 |
$1,191,201 |
$1,211,258 |
$1,188,376 |
8/26 |
$1,186,157 |
$1,208,488 |
$1,185,024 |
|
| Average Annual Return [Table Text Block] |
Table Summary
Fund |
1 Year |
5 Years |
10 Years |
Class I |
5.81% |
0.58% |
1.72% |
Bloomberg Municipal Bond Index |
4.12% |
0.54% |
1.91% |
Bloomberg Virginia Municipal Bond Index |
4.07% |
0.45% |
1.71% | |
| No Deduction of Taxes [Text Block] |
Performance does not reflect the deduction of taxes that a shareholder would pay on Fund distributions or redemption of Fund shares.
|
| Updated Performance Information Location [Text Block] |
For more recent performance information, visit www.eatonvance.com/performance.php.
|
| AssetsNet |
$ 82,907,450
|
| Holdings Count | Holding |
125
|
| Advisory Fees Paid, Amount |
$ 224,541
|
| InvestmentCompanyPortfolioTurnover |
92.00%
|
| Additional Fund Statistics [Text Block] |
Table Summary
Total Net Assets |
$82,907,450 |
# of Portfolio Holdings |
125 |
Portfolio Turnover Rate |
92% |
Total Advisory Fees Paid |
$224,541 | |
| Holdings [Text Block] |
Sector Allocation (% of total investments)
Table Summary
Value |
Value |
OtherFootnote Reference* |
11.7% |
Housing |
3.5% |
Bond Bank |
5.0% |
Hospital |
6.2% |
Senior Living/Life Care |
6.5% |
Education |
8.2% |
Lease Rev./Cert. of Participation |
9.1% |
Transportation |
11.4% |
Water and Sewer |
12.3% |
General Obligations |
26.1% |
| Footnote |
Description |
Footnote* |
Sectors less than 3% each. | |
| Credit Quality Explanation [Text Block] |
Credit Quality (% of total investments)Footnote Referencea
Table Summary
Value |
Value |
NR |
7.7% |
B |
0.9% |
BB |
2.5% |
BBB |
5.2% |
A |
4.9% |
AA |
44.1% |
AAA |
34.7% |
| Footnote |
Description |
Footnotea |
Ratings are based on Moody’s Investors Service, Inc. (“Moody’s”), S&P Global Ratings (“S&P”) or Fitch Ratings (“Fitch”). If securities are rated differently by the ratings agencies, the highest rating is applied. Moody's ratings are converted to the S&P and Fitch scale with ratings ranging from AAA, being the highest, to D, being the lowest. Ratings of BBB or higher are considered to be investment-grade quality. Holdings designated as “Not Rated” (if any) are not rated by the national ratings agencies stated above. | |
| Material Fund Change [Text Block] |
|
| Updated Prospectus Phone Number |
1-800-262-1122
|