Pay vs Performance Disclosure - USD ($)
Jun. 30, 2026
Jun. 30, 2025
Jun. 30, 2024
Jun. 30, 2023
Jun. 30, 2022
PAY VERSUS PERFORMANCE
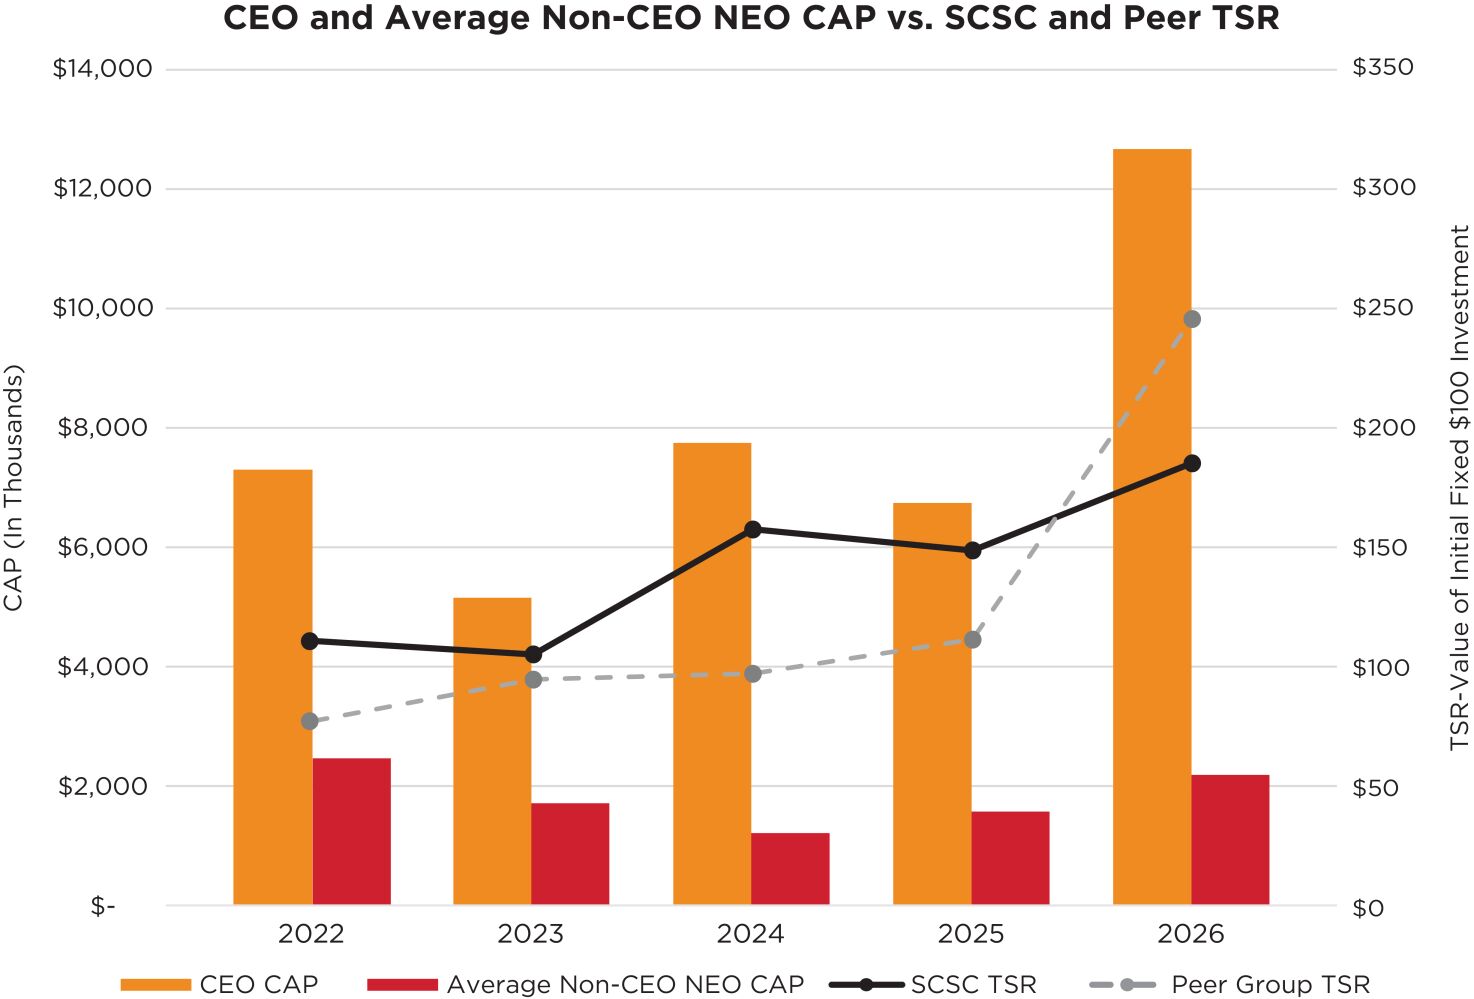
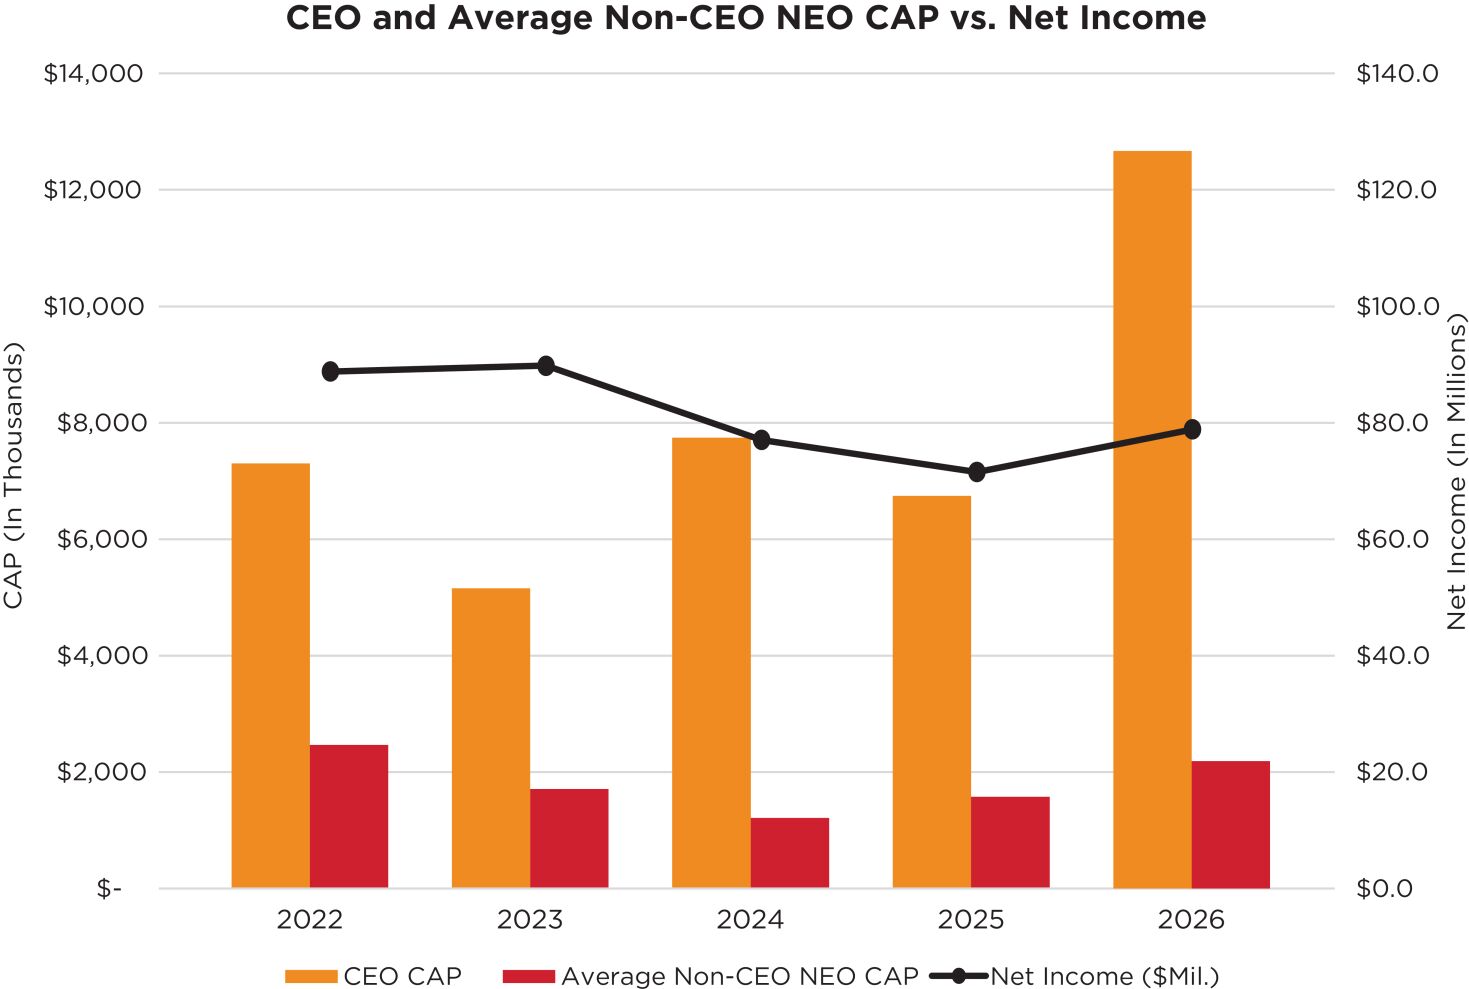
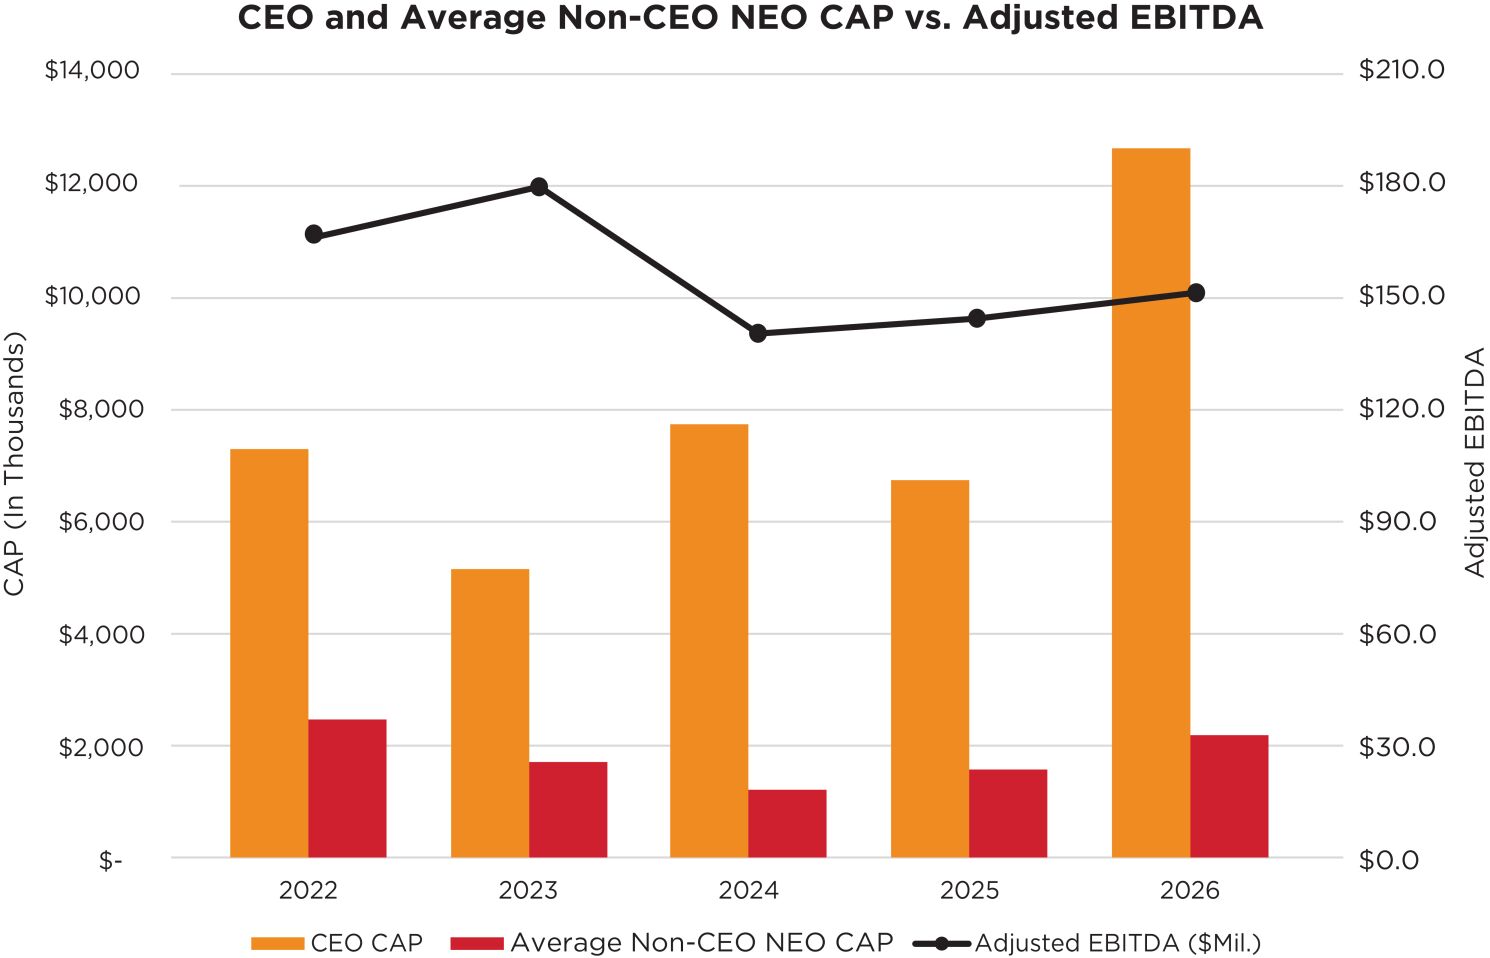
This section provides disclosure about the relationship between executive “compensation actually paid” (“CAP”) to our CEO and non-CEO NEOs and certain financial performance measures of the Company for the fiscal years listed below. This disclosure has been prepared in accordance with Item 402(v) of Regulation S-K under the Exchange Act (the “Pay Versus Performance Rules”). For further information concerning the Company’s variable pay-for-performance philosophy and how the Company aligns executive compensation with the Company’s performance, refer to “Executive Compensation — Compensation Discussion and Analysis.”
Value of Initial Fixed $100 Investment Based On: |
||||||||||||||||||||||||
| Year | Summary Compensation Table Total for Mike Baur ($) |
Compensation Actually Paid to CEO ($)(1)(2) |
Average Summary Compensation Table Total for Non-CEO NEOs ($)(3) |
Average Compensation Actually Paid to Non-CEO NEOs ($)(1)(2)(3) |
ScanSource, Inc. Total Shareholder Return ($) |
Peer Group Total Shareholder Return ($)(4) |
Net Income (in millions) ($) |
Adjusted EBITDA ($)(5) | ||||||||||||||||
2026 |
9,682,834 | 12,669,946 | 1,999,476 | 2,186,935 | 185 | 246 | 78.9 | 151.5 | ||||||||||||||||
2025 |
8,231,119 | 6,741,272 | 1,837,222 | 1,571,321 | 174 | 187 | 71.5 | 144.7 | ||||||||||||||||
2024 |
5,875,799 | 7,744,764 | 1,838,760 | 1,211,679 | 184 | 163 | 77.1 | 140.7 | ||||||||||||||||
2023 |
5,657,484 | 5,155,039 | 1,839,235 | 1,709,711 | 123 | 159 | 89.8 | 179.9 | ||||||||||||||||
2022 |
5,647,684 | 7,297,747 | 2,050,989 | 2,464,805 | 129 | 130 | 88.8 | 166.7 | ||||||||||||||||
| (1) | Deductions from, and additions to, total compensation in the Summary Compensation Table by year to calculate Compensation Actually Paid consist of: |
Chief Executive Officer |
||||||||||||||||||||
2026 ($) |
2025 ($) |
2024 ($) |
2023 ($) |
2022 ($) |
||||||||||||||||
Total Compensation from Summary Compensation Table |
9,682,834 | 8,231,119 | 5,875,799 | 5,657,484 | 5,647,684 | |||||||||||||||
Adjustments for Pension |
— | — | — | — | — | |||||||||||||||
Adjustment for Summary Compensation Table Pension |
0 | 0 | 0 | 0 | 0 | |||||||||||||||
Amount added for current year service cost |
0 | 0 | 0 | 0 | 0 | |||||||||||||||
Amount added for prior service cost impacting current year |
0 | 0 | 0 | 0 | 0 | |||||||||||||||
Total Adjustments for Pension |
0 | 0 | 0 | 0 | 0 | |||||||||||||||
Adjustments for Equity Awards |
||||||||||||||||||||
Adjustment for grant date values in the Summary Compensation Table |
(6,044,346 | ) | (5,118,784 | ) | (3,858,000 | ) | (3,229,036 | ) | (2,331,320 | ) | ||||||||||
Year-end fair value of unvested awards granted in the current year |
7,213,059 | 4,111,235 | 4,633,040 | 3,093,126 | 2,751,537 | |||||||||||||||
Year-over-year difference of year-end fair values for unvested awards granted in prior years |
1,666,035 | (833,381 | ) | 1,038,850 | (386,870 | ) | 614,269 | |||||||||||||
Fair values at vest date for awards granted and vested in current year |
0 | 0 | 0 | 0 | 0 | |||||||||||||||
Difference in fair values between prior year-end fair values and vest date fair values for awards granted in prior years |
152,364 | 351,084 | 55,075 | 20,335 | 615,578 | |||||||||||||||
Forfeitures during current year equal to prior year-end fair value |
0 | 0 | 0 | 0 | 0 | |||||||||||||||
Dividends or dividend equivalents not otherwise included in the total compensation |
0 | 0 | 0 | 0 | 0 | |||||||||||||||
Total Adjustments for Equity Awards |
2,987,111 | (1,489,847 | ) | 1,868,965 | (502,445 | ) | 1,650,063 | |||||||||||||
Compensation Actually Paid (as calculated) |
12,669,946 | 6,741,272 | 7,744,764 | 5,155,039 | 7,297,747 | |||||||||||||||
Average Non-CEO Named Executive Officers | ||||||||||
2026 ($) |
2025 ($) |
2024 ($) |
2023 ($) |
2022 ($) |
||||||||||||||||
Total Compensation from Summary Compensation Table |
1,999,476 | 1,837,222 | 1,838,760 | 1,839,235 | 2,050,989 | |||||||||||||||
Adjustments for Pension |
— | — | — | — | ||||||||||||||||
Adjustment for Summary Compensation Table Pension |
0 | 0 | 0 | 0 | 0 | |||||||||||||||
Amount added for current year service cost |
0 | 0 | 0 | 0 | 0 | |||||||||||||||
Amount added for prior service cost impacting current year |
0 | 0 | 0 | 0 | 0 | |||||||||||||||
Total Adjustments for Pension |
0 | 0 | 0 | 0 | 0 | |||||||||||||||
Adjustments for Equity Awards |
||||||||||||||||||||
Adjustment for grant date values in the Summary Compensation Table |
(668,919 | ) | (816,449 | ) | (902,401 | ) | (947,223 | ) | (824,430 | ) | ||||||||||
Year-end fair value of unvested awards granted in the current year |
690,776 | 655,741 | 620,364 | 914,109 | 986,537 | |||||||||||||||
Year-over-year difference of year-end fair values for unvested awards granted in prior years |
192,814 | (152,714 | ) | 175,851 | (92,141 | ) | 113,848 | |||||||||||||
Fair values at vest date for awards granted and vested in current year |
0 | 0 | 0 | 0 | 19,557 | |||||||||||||||
Difference in fair values between prior year-end fair values and vest date fair values for awards granted in prior years |
33,055 | 47,521 | 58,636 | (4,269 | ) | 118,304 | ||||||||||||||
Forfeitures during current year equal to prior year-end fair value |
(60,267 | ) | 0 | (579,531 | ) | 0 | 0 | |||||||||||||
Dividends or dividend equivalents not otherwise included in the total compensation |
0 | 0 | 0 | 0 | 0 | |||||||||||||||
Total Adjustments for Equity Awards |
187,459 | (265,901 | ) | (627,082 | ) | (129,524 | ) | 413,816 | ||||||||||||
Compensation Actually Paid (as calculated) |
2,186,935 | 1,571,321 | 1,211,679 | 1,709,711 | 2,464,805 | |||||||||||||||
| (2) | Equity valuations assumptions used to calculate Compensation Actually Paid were not materially different from grant date valuation assumptions. |
| (3) | Non-CEO NEOs reflect the average Summary Compensation Table total compensation and average Compensation Actually Paid for the following executives by year: |
2026: Stephen Jones, Shana Smith, Michael R. Webb (Former), Rachel Hayden (Former), Alexandre Conde (Former)
2025: Stephen Jones, Shana Smith, Rachel Hayden, Alexandre Conde
2024: Stephen Jones, John Eldh (Former), Shana Smith, Rachel Hayden, Alexandre Conde
2023: Stephen Jones, John Eldh (Former), Shana Smith, Rachel Hayden
2022: Stephen Jones, John Eldh, Rachel Hayden, Matthew Dean (Former)
| (4) | Total shareholder return (“TSR”) is calculated based on the value of an initial fixed investment of $100 on June 30, 2021. The selected peer group is the S&P 600 Technology Hardware & Equipment (Industry Group) Index, which is the peer group used by the Company for purposes of Item 201(e) of SEC Regulation S-K in the Annual Report. |
| (5) | We have determined that Adjusted EBITDA is the financial performance measure that, in the Company’s assessment, represents the most important financial performance measure used to link CAP to our NEOs to Company performance for fiscal 2026. “Adjusted EBITDA” starts with net income and adds back interest expense, income tax expense, depreciation expense, amortization or intangible assets, changes in fair value of contingent consideration, non-cash share-based compensation expense and other non-GAAP adjustments. Please refer to page 30 in the Annual Report for a reconciliation of net income to Adjusted EBITDA. |
| (3) | Non-CEO NEOs reflect the average Summary Compensation Table total compensation and average Compensation Actually Paid for the following executives by year: |
2026: Stephen Jones, Shana Smith, Michael R. Webb (Former), Rachel Hayden (Former), Alexandre Conde (Former)
2025: Stephen Jones, Shana Smith, Rachel Hayden, Alexandre Conde
2024: Stephen Jones, John Eldh (Former), Shana Smith, Rachel Hayden, Alexandre Conde
2023: Stephen Jones, John Eldh (Former), Shana Smith, Rachel Hayden
2022: Stephen Jones, John Eldh, Rachel Hayden, Matthew Dean (Former)
Chief Executive Officer |
||||||||||||||||||||
2026 ($) |
2025 ($) |
2024 ($) |
2023 ($) |
2022 ($) |
||||||||||||||||
Total Compensation from Summary Compensation Table |
9,682,834 | 8,231,119 | 5,875,799 | 5,657,484 | 5,647,684 | |||||||||||||||
Adjustments for Pension |
— | — | — | — | — | |||||||||||||||
Adjustment for Summary Compensation Table Pension |
0 | 0 | 0 | 0 | 0 | |||||||||||||||
Amount added for current year service cost |
0 | 0 | 0 | 0 | 0 | |||||||||||||||
Amount added for prior service cost impacting current year |
0 | 0 | 0 | 0 | 0 | |||||||||||||||
Total Adjustments for Pension |
0 | 0 | 0 | 0 | 0 | |||||||||||||||
Adjustments for Equity Awards |
||||||||||||||||||||
Adjustment for grant date values in the Summary Compensation Table |
(6,044,346 | ) | (5,118,784 | ) | (3,858,000 | ) | (3,229,036 | ) | (2,331,320 | ) | ||||||||||
Year-end fair value of unvested awards granted in the current year |
7,213,059 | 4,111,235 | 4,633,040 | 3,093,126 | 2,751,537 | |||||||||||||||
Year-over-year difference of year-end fair values for unvested awards granted in prior years |
1,666,035 | (833,381 | ) | 1,038,850 | (386,870 | ) | 614,269 | |||||||||||||
Fair values at vest date for awards granted and vested in current year |
0 | 0 | 0 | 0 | 0 | |||||||||||||||
Difference in fair values between prior year-end fair values and vest date fair values for awards granted in prior years |
152,364 | 351,084 | 55,075 | 20,335 | 615,578 | |||||||||||||||
Forfeitures during current year equal to prior year-end fair value |
0 | 0 | 0 | 0 | 0 | |||||||||||||||
Dividends or dividend equivalents not otherwise included in the total compensation |
0 | 0 | 0 | 0 | 0 | |||||||||||||||
Total Adjustments for Equity Awards |
2,987,111 | (1,489,847 | ) | 1,868,965 | (502,445 | ) | 1,650,063 | |||||||||||||
Compensation Actually Paid (as calculated) |
12,669,946 | 6,741,272 | 7,744,764 | 5,155,039 | 7,297,747 | |||||||||||||||
Average Non-CEO Named Executive Officers | ||||||||||
2026 ($) |
2025 ($) |
2024 ($) |
2023 ($) |
2022 ($) |
||||||||||||||||
Total Compensation from Summary Compensation Table |
1,999,476 | 1,837,222 | 1,838,760 | 1,839,235 | 2,050,989 | |||||||||||||||
Adjustments for Pension |
— | — | — | — | ||||||||||||||||
Adjustment for Summary Compensation Table Pension |
0 | 0 | 0 | 0 | 0 | |||||||||||||||
Amount added for current year service cost |
0 | 0 | 0 | 0 | 0 | |||||||||||||||
Amount added for prior service cost impacting current year |
0 | 0 | 0 | 0 | 0 | |||||||||||||||
Total Adjustments for Pension |
0 | 0 | 0 | 0 | 0 | |||||||||||||||
Adjustments for Equity Awards |
||||||||||||||||||||
Adjustment for grant date values in the Summary Compensation Table |
(668,919 | ) | (816,449 | ) | (902,401 | ) | (947,223 | ) | (824,430 | ) | ||||||||||
Year-end fair value of unvested awards granted in the current year |
690,776 | 655,741 | 620,364 | 914,109 | 986,537 | |||||||||||||||
Year-over-year difference of year-end fair values for unvested awards granted in prior years |
192,814 | (152,714 | ) | 175,851 | (92,141 | ) | 113,848 | |||||||||||||
Fair values at vest date for awards granted and vested in current year |
0 | 0 | 0 | 0 | 19,557 | |||||||||||||||
Difference in fair values between prior year-end fair values and vest date fair values for awards granted in prior years |
33,055 | 47,521 | 58,636 | (4,269 | ) | 118,304 | ||||||||||||||
Forfeitures during current year equal to prior year-end fair value |
(60,267 | ) | 0 | (579,531 | ) | 0 | 0 | |||||||||||||
Dividends or dividend equivalents not otherwise included in the total compensation |
0 | 0 | 0 | 0 | 0 | |||||||||||||||
Total Adjustments for Equity Awards |
187,459 | (265,901 | ) | (627,082 | ) | (129,524 | ) | 413,816 | ||||||||||||
Compensation Actually Paid (as calculated) |
2,186,935 | 1,571,321 | 1,211,679 | 1,709,711 | 2,464,805 | |||||||||||||||
Most Important Financial Performance Measures
In accordance with the Pay Versus Performance Rules, the following table lists the financial performance measures that, in the Company’s assessment, represent the most important financial performance measures used to link CAP to our NEOs for fiscal 2026 to Company performance:
| Most Important Financial Performance Measures |
Adjusted EBITDA |
FCF Conversion1 |
Return On Invested Capital |
Earnings Per Share |
| 1 | “FCF Conversion” is determined by dividing free cash flow by non-GAAP net income. For compensation purposes “free cash flow” means cash flow from operating activities less capital expenditures and “non-GAAP net income” starts with net income and excludes amortization of intangible assets related to acquisitions, acquisition and divestiture costs, restructuring costs, and other non-GAAP adjustments. For more information on our non-GAAP measures used for compensation purposes and reconciliations to GAAP measures, see Appendix A. |