The bar chart and performance table below show the variability of the Fund’s returns, which is some indication of the risks of investing in the Fund. The bar chart shows performance of Class I shares of the Fund for each full calendar year since the Fund’s inception. Returns for Class A and Class C shares, which are not presented, will vary from the returns for Class I shares. The performance table compares the performance of the Fund over time to the performance of a broad-based securities market index and a supplemental index. You should be aware that the Fund’s past performance (before and after taxes) may not be an indication of how the Fund will perform in the future. Updated performance information will be available at no cost by visiting www.donoghueforlinesfunds.com or by calling 1-877-779-7462.
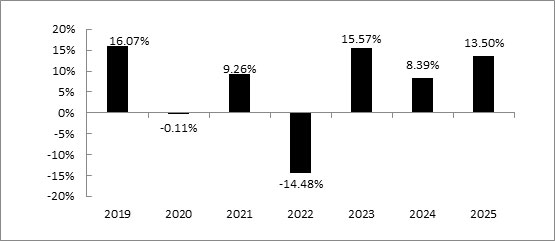
| Best Quarter: | 12/31/20 | 8.27% |
| Worst Quarter: | 3/31/20 | (15.77)% |
The year-to-date return as of the most recent calendar quarter, which ended September 30, 2026, was12.84%.
| One Year | Five Years | Since Inception (4/6/2018) | |
| Class I shares | |||
| Return before taxes | 13.50% | 5.84% | 4.47% |
| Return after taxes on distributions* | 10.92% | 4.57% | 3.47% |
| Return after taxes on distributions and sale of Fund shares* | 7.98% | 4.00% | 3.07% |
| Class A shares Return before taxes | 7.63% | 4.52% | 3.51% |
| Class C shares Return before taxes | 12.44% | 4.81% | 3.42% |
| MSCI
AC World Index** (reflects no deduction for fees, expenses, or taxes) |
22.34% | 11.19% | 11.38% |
| Dow Jones Moderately Conservative Index*** | 10.37% | 2.95% | 4.56% |
| * | After-tax returns were calculated using the historical highest individual federal marginal income tax rates and do not reflect the impact of state and local taxes. Actual after-tax returns depend on an investor’s tax situation and may differ from those shown, and after-tax returns shown are not relevant to investors who hold shares of the Fund through tax-deferred arrangements, such as 401(k) plans or individual retirement accounts. After tax returns for Class A and Class C shares, which are not shown, will vary from those of Class I shares. |
| ** | The MSCI AC World Index is designed to represent performance of the full opportunity set of large- and mid-cap stocks across 23 developed and 24 emerging markets. Index returns assume reinvestment of dividends. Investors may not invest in an Index directly. |
| *** | The Dow Jones Moderately Conservative Portfolio Index is a member of the Dow Jones Relative Risk Index Series and is designed to measure a total portfolio of stocks, bonds, and cash, allocated to represent an investor’s desired risk profile. The Dow Jones Moderately Conservative Portfolio Index risk level is set to 40% of the Dow Jones Global Stock CMAC Index’s downside risk (past 36 months). |
The bar chart and performance table below show the variability of the Fund’s returns, which is some indication of the risks of investing in the Fund. The bar chart shows performance of Class I shares of the Fund for each full calendar year since the Fund’s inception. Returns for Class A and Class C shares, which are not presented, will vary from the returns for Class I shares. The performance table compares the performance of the Fund over time to the performance of a broad-based securities market index. You should be aware that the Fund’s past performance (before and after taxes) may not be an indication of how the Fund will perform in the future. Updated performance information will be available at no cost by visiting www.donoghueforlinesfunds.com or by calling 1-877-779-7462.
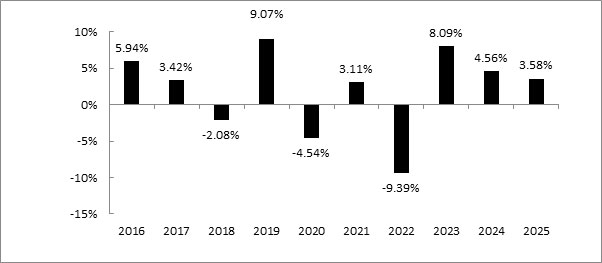
| Best Quarter: | 3/31/2019 | 4.68% |
| Worst Quarter: | 3/31/2020 | (9.50)% |
The year-to-date return as of the most recent calendar quarter, which ended September 30, 2026, was 0.09%.
| One Year | Five Years | Ten Years** |
Since Inception*** | |
| Class I shares | ||||
| Return before taxes | 3.58% | 1.81% | 2.02% | 2.10% |
| Return after taxes on distributions | 2.66% | 0.66% | 0.99% | 1.00% |
| Return after taxes on distributions and sale of Fund shares* | 2.11% | 0.89% | 1.11% | 1.15% |
| Class A Return before taxes | (1.80)% | 0.54% | 1.33% | 1.56% |
| Class C Return before taxes** | 2.51% | 0.81% | 1.01% | 0.60% |
| Bloomberg
Global Aggregate Bond Index**** (reflects no deduction for fees, expenses, or taxes) |
8.17% | (2.15)% | 1.26% | 1.16% |
| * | After-tax returns were calculated using the historical highest individual federal marginal income tax rates and do not reflect the impact of state and local taxes. Actual after-tax returns depend on an investor’s tax situation and may differ from those shown, and after-tax returns shown are not relevant to investors who hold shares of the Fund through tax-deferred arrangements, such as 401(k) plans or individual retirement accounts. After tax returns for Class A and Class C shares, which are not shown, will vary from those of Class I shares. |
| ** | Class C shares of the Fund commenced operations on November 25, 2014 |
| *** | The since inception date for Class A, Class I and the benchmark returns is September 14, 2010 |
| **** | The Bloomberg Global Aggregate Bond Index is composed of the U.S. Aggregate Index, the Pan-European Index and the Japanese component of the Global Treasury Index. All issues must be fixed rate, nonconvertible and have at least one year remaining to maturity. Securities from countries classified as emerging markets are excluded. The index is weighted according to each country’s market capitalization, except for Japan, which is weighted by the market capitalization of the 40 largest Japanese government bonds. |
The bar chart and performance table below show the variability of the Fund’s returns, which is some indication of the risks of investing in the Fund. The bar chart shows performance of Class I shares of the Fund for each full calendar year since the Fund’s inception. Returns for Class A and Class C shares, which are not presented, will vary from the returns for Class I shares. The performance table compares the performance of the Fund over time to the performance of a broad-based securities market index and two supplemental indices. You should be aware that the Fund’s past performance (before and after taxes) may not be an indication of how the Fund will perform in the future. Updated performance information will be available at no cost by visiting www.donoghueforlinesfunds.com or by calling 1-877-779-7462.
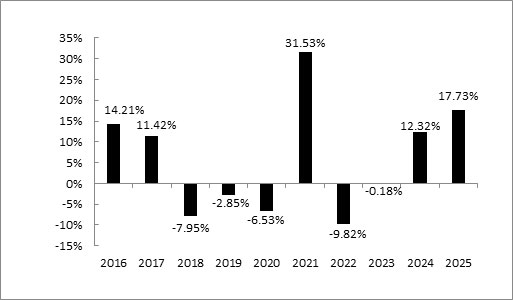
| Best Quarter: | 12/31/2020 | 16.61% |
| Worst Quarter: | 3/31/2020 | (23.28)% |
The year-to-date return as of the most recent calendar quarter, which ended September 30, 2026, was 11.71%.
| One Year | Five Years | Ten Years** | Since Inception (11/7/2013) | |
| Class I shares | ||||
| Return before taxes | 17.73% | 9.38% | 5.23% | 5.06% |
| Return after taxes on distributions | 17.11% | 8.87% | 4.00% | 3.91% |
| Return after taxes on distributions and sale of Fund shares* | 10.47% | 7.30% | 3.81% | 3.72% |
| Class A Return before taxes | 11.42% | 7.99% | 4.43% | 4.36% |
| Class C Return before taxes** | 16.53% | 8.27% | 4.18% | 2.99% |
| Syntax
US LargeCap 500 Index*** (reflects no deduction for Fees, expenses, or taxes) |
18.17% | 14.11% | 15.02% | 14.07% |
| Syntax US Net Value Index**** | 16.76% | 13.91% | 11.79% | 10.83% |
| * | After-tax returns were calculated using the historical highest individual federal marginal income tax rates and do not reflect the impact of state and local taxes. Actual after-tax returns depend on an investor’s tax situation and may differ from those shown, and after-tax returns shown are not relevant to investors who hold shares of the Fund through tax-deferred arrangements, such as 401(k) plans or individual retirement accounts. After tax returns for Class A and Class C shares, which are not shown, will vary from those of Class I shares. |
| ** | Class C Shares commenced operations on November 25, 2014. |
| *** | The Syntax US LargeCap 500 Index float market cap-weights the 500 largest public US companies as ranked by their float market caps, subject to rank buffers and liquidity screens. |
| **** | The Syntax US Net Value Index weights by score-modified float market cap the top 500 stocks in the Syntax US 1000 Index (SY1000) as ranked by their Syntax Net Value Scores, which subtract the stock’s Syntax Pure Growth Score from its Syntax Pure Value Score in order to measure the emphasis on value over growth characteristics. |
The bar chart and performance table below show the variability of the Fund’s returns, which is some indication of the risks of investing in the Fund. The bar chart shows performance of Class I shares of the Fund for each full calendar year since the Fund’s inception. Returns for Class A and Class C shares, which are not presented, will vary from the returns for Class I shares. The performance table compares the performance of the Fund over time to the performance of a broad-based securities market index and a supplemental index. You should be aware that the Fund’s past performance (before and after taxes) may not be an indication of how the Fund will perform in the future. Updated performance information will be available at no cost by visiting www.donoghueforlinesfunds.com or by calling 1-877-779-7462.
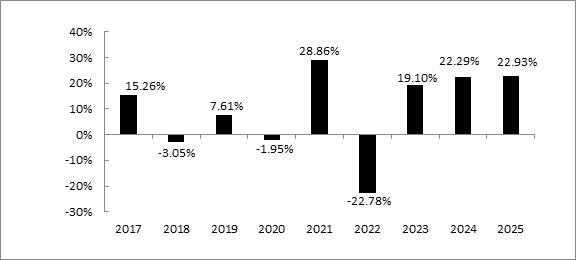
| Best Quarter: | 3/31/24 | 17.97% |
| Worst Quarter: | 3/31/20 | (25.66)% |
The year-to-date return as of the most recent calendar quarter, which ended September 30, 2026, was 34.85%.
| One Year | Five Years | Since Inception (12/23/2016) | |
| Class I shares | |||
| Return before taxes | 22.93% | 12.24% | 8.43% |
| Return after taxes on distributions | 12.83% | 10.23% | 6.68% |
| Return after taxes on distributions and sale of Fund shares* | 14.04% | 8.99% | 6.01% |
| Class A Return before taxes | 16.51 % | 10.82% | 7.54% |
| Class C Return before taxes | 21.75% | 11.14% | 7.36% |
| Syntax
US LargeCap 500 Index** (reflects no deduction for fees, expenses, or taxes) |
18.17% | 14.11% | 15.20% |
| * | After-tax returns were calculated using the historical highest individual federal marginal income tax rates and do not reflect the impact of state and local taxes. Actual after-tax returns depend on an investor’s tax situation and may differ from those shown, and after-tax returns shown are not relevant to investors who hold shares of the Fund through tax-deferred arrangements, such as 401(k) plans or individual retirement accounts. After tax returns for Class A and Class C shares, which are not shown, will vary from those of Class I shares. |
| ** | The Syntax US LargeCap 500 Index float market cap-weights the 500 largest public US companies as ranked by their float market caps, subject to rank buffers and liquidity screens. |
The bar chart and performance table below show the variability of the Fund’s returns, which is some indication of the risks of investing in the Fund. The bar chart shows performance of Class I shares of the Fund for each full calendar year since the Fund’s inception. Returns for Class A and Class C shares, which are not presented, will vary from the returns for Class I shares. The performance table compares the performance of the Fund over time to the performance of a broad-based securities market index. You should be aware that the Fund’s past performance (before and after taxes) may not be an indication of how the Fund will perform in the future. Updated performance information will be available at no cost by visiting www.donoghueforlinesfunds.com or by calling 1-877-779-7462.
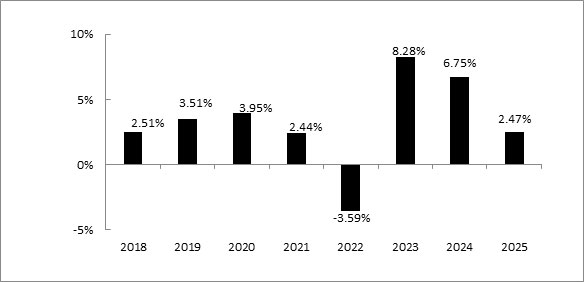
| Best Quarter: | 12/31/20 | 3.88% |
| Worst Quarter: | 3/31/20 | (3.11)% |
The year-to-date return as of the most recent calendar quarter, which ended September 30, 2026, was 0.47%.
| One Year | Five Years | Since
Inception (12/27/17) | |
| Class I shares | |||
| Return before taxes | 2.47% | 3.19% | 3.22% |
| Return after taxes on distributions | 0.12% | 1.23% | 1.51% |
| Return after taxes on distributions and sale of Fund shares* | 1.44% | 1.59% | 1.72% |
| Class A Return before taxes | (2.73)% | 2.50% | 2.64% |
| Class C Return before taxes | 1.37% | 2.17% | 2.21% |
| Bloomberg
U.S. Aggregate Bond Index** (reflects no deduction for fees, expenses, or taxes) |
7.30% | (0.36)% | 1.74% |
| * | After-tax returns were calculated using the historical highest individual federal marginal income tax rates and do not reflect the impact of state and local taxes. Actual after-tax returns depend on an investor’s tax situation and may differ from those shown, and after-tax returns shown are not relevant to investors who hold shares of the Fund through tax-deferred arrangements, such as 401(k) plans or individual retirement accounts. After tax returns for Class A and Class C shares, which are not shown, will vary from those of Class I shares. |
| ** | The Bloomberg U.S. Aggregate Bond Index is a benchmark that measures the performance of the U.S. investment-grade bond market. It’s a broad-based index that tracks a variety of bonds, including Treasuries, corporate securities, mortgage-backed securities, and asset-backed securities |