
3Q2026 Earnings Presentation October 26, 2026 FirstSun Capital Bancorp NASDAQ: FSUN
FirstSun Capital Bancorp | 2 Disclaimers Forward-Looking Statements This presentation contains forward-looking information and statements by FirstSun Capital Bancorp (“FirstSun” or the “Company”) within the meaning of the Private Securities Litigation Reform Act of 1995. Forward-looking statements are generally identifiable by the use of words such as “believe”, “expect”, “anticipate”, “plan”, “project”, “intend”, “estimate”, “may”, “will”, “would”, “could”, “should”, “assume”, “assumptions”, “view”, “continue”, “opportunity”, “strategic emphasis”, “seek to”, and “outlook” or other similar expressions, and in this presentation include statements regarding our strategy, our merger with First Foundation Inc. (“First Foundation”), our outlook regarding our loan portfolio, deposit mix, net interest income, noninterest income, noninterest expense, asset quality, liquidity and capital priorities, as well as statements on the slide entitled “Fourth Quarter 2026 Financial Outlook,” including our Q4 2026 outlook, key assumptions and further expectations. Forward-looking statements are subject to risks, uncertainties and assumptions that are difficult to predict with regard to timing, extent, likelihood and degree of occurrence, which could cause actual results to differ materially from anticipated results. Such risks, uncertainties and assumptions, include, among others, the following: changes in interest rates and their related impact on macroeconomic conditions, customer behavior, our funding costs and our loan and securities portfolios; the quality or composition of our loan or investment portfolios and changes therein; failure to maintain our mortgage production flow to secondary markets; the sufficiency of liquidity and changes in our capital position; the inability of our infrastructure initiatives to reduce expenses; increased deposit volatility; potential regulatory developments; U.S. and global trade policies and tensions, including changes in, or the imposition of, tariffs and/or trade barriers and the economic impacts, volatility and uncertainty resulting therefrom; ongoing geopolitical conflicts, including hostilities involving Iran and the Middle East, which may contribute to volatility in energy prices, inflation, financial markets, cybersecurity threats, and broader macroeconomic conditions, any of which could adversely affect our borrowers, deposit base, liquidity, capital and results of operations; the possibility that the anticipated benefits of the First Foundation merger, including anticipated cost savings and strategic gains, are not realized when expected or at all; the integration of the businesses and operations of FirstSun and First Foundation may take longer than anticipated or be more costly than anticipated or have unanticipated adverse results relating to the combined company’s business; the diversion of management’s attention from ongoing business operations and opportunities due to the integration of First Foundation merger, credit risk in our loan portfolio, and other factors, many of which are beyond our control. We caution readers that the foregoing list of factors is not exclusive, is not necessarily in order of importance and readers should not place undue reliance on any forward-looking statements. Additional information concerning additional factors that could materially affect the forward-looking statements in this presentation can be found in the cautionary language included under the headings “Cautionary Note Regarding Forward-Looking Statements” and “Risk Factors” in FirstSun’s Annual Report on Form 10-K for the year ended December 31, 2025 and other documents subsequently filed by FirstSun with the SEC. Further, any forward-looking statement speaks only as of the date on which it is made and we do not intend to and disclaim any obligation to update or revise any forward-looking statement to reflect events or circumstances after the date on which the statement is made or to reflect the occurrence of unanticipated events, except as required by law. Q4 2026 Outlook and 2027 Further Expectations - Basis and Limitations Our Q4 2026 Financial Outlook and 2027 Further Expectations reflect management’s current expectations regarding certain financial and operating metrics and related key assumptions and further expectations as of October 26, 2026. The outlook includes preliminary estimates of acquisition-related purchase accounting adjustments with respect to the First Foundation merger, which are subject to change. The outlook and further expectations are provided for convenience and should not be regarded as a guarantee of future results. Actual results, conditions or outcomes may differ materially. See “Forward‑Looking Statements” in the above heading. We undertake no obligation to update or affirm the outlook or further expectations, except as required by law. Forward‑looking non‑GAAP measures appearing in the Q4 2026 Financial Outlook should be read together with “Use of Non‑GAAP Measures.”
FirstSun Capital Bancorp | 3 Disclaimers (cont’d) Use of Non-GAAP Measures This presentation includes certain financial information determined by methods other than in accordance with accounting principles generally accepted in the United States (“GAAP”). These non-GAAP financial measures include certain operating performance measures that exclude merger-related and other charges that are not considered part of the Company’s recurring operations. The Company’s management uses these non-GAAP financial measures in their analysis of the Company’s performance and the efficiency of its operations. Management believes these non-GAAP measures provide a greater understanding of the Company’s ongoing operations, enhance comparability of results with prior periods and demonstrate the effects of significant items in the current period. The Company believes a meaningful analysis of its financial performance requires an understanding of the factors underlying that performance. The Company’s management believes investors may find these non-GAAP financial measures useful and that these non-GAAP financial measures provide useful supplemental information for evaluating the Company’s performance trends. Further, the Company’s management uses these measures in managing and evaluating the Company’s business and intends to refer to them in discussions about the Company’s operations and performance. These non-GAAP financial measures, however, should not be viewed as a substitute for financial measures determined in accordance with GAAP, nor are they necessarily comparable to non-GAAP performance measures that may be presented by other companies. These measures should be viewed in addition to, and not as an alternative to, or substitute for, measures that are determined in accordance with GAAP. Reconciliations of these non-GAAP measures to the most directly comparable GAAP measure are included in the Appendix to this presentation. Deposits Classification Previously, deposit amounts related to certain NOW accounts with limited monthly transaction activity were able to be reclassified to money market accounts to reduce reserve requirements at the Federal Reserve. As there is no longer any impact to reserve requirements across different deposit products, we have discontinued this product reclassification practice and have revised the presentation of those deposits to conform to the current presentation for periods prior to March 31, 2026. Certain insured reciprocal deposits acquired in the First Foundation acquisition were reclassified from savings deposits to money market deposits as of June 30, 2026, to conform to the current presentation. Additionally, in conjunction with the integration of First Foundation, certain deposit products were converted from money market accounts to interest bearing demand accounts in the third quarter of 2026. Market, Industry and Statistical Data Certain market and industry data used in this presentation are based on third‑party sources, publicly available information and internal estimates. We believe such information to be reliable, but we have not independently verified it and make no representation as to its accuracy or completeness.
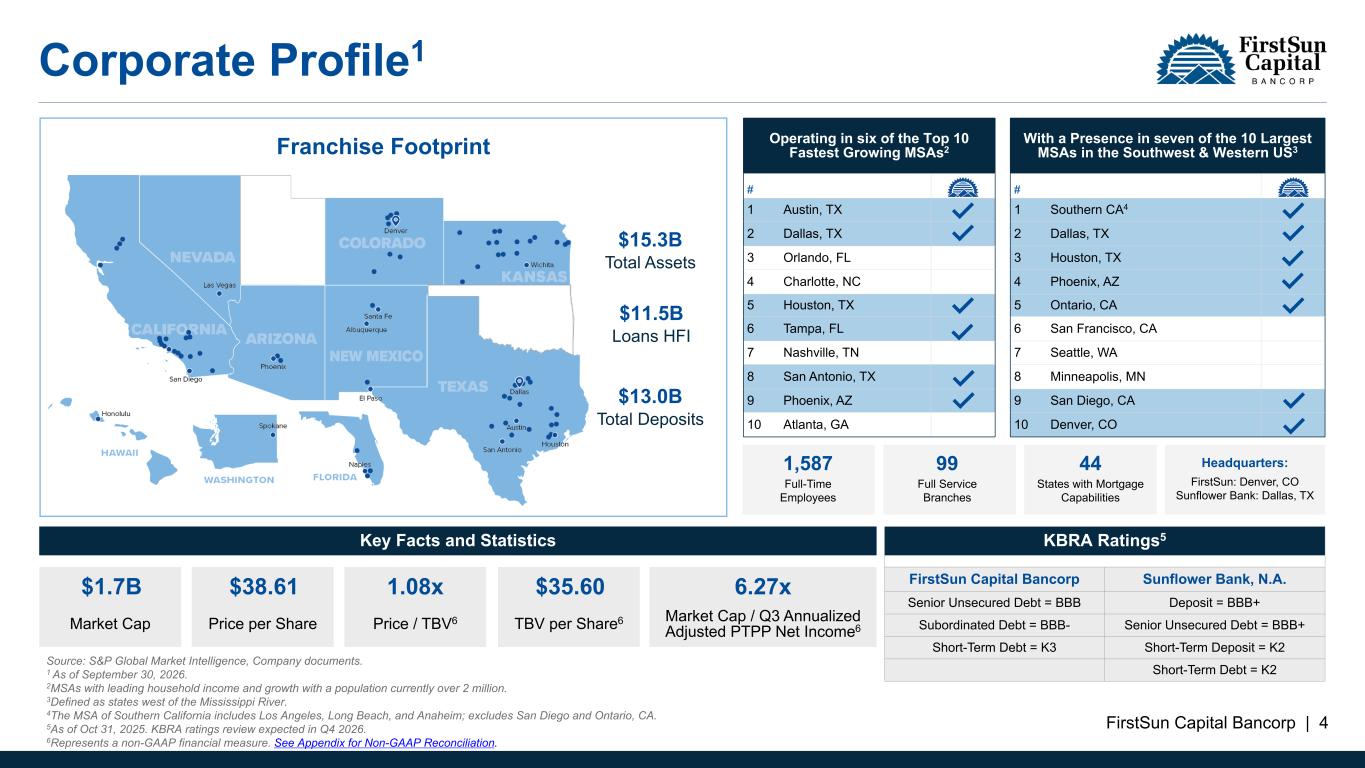
FirstSun Capital Bancorp | 4 Corporate Profile1 Operating in six of the Top 10 Fastest Growing MSAs2 # 1 Austin, TX 2 Dallas, TX 3 Orlando, FL 4 Charlotte, NC 5 Houston, TX 6 Tampa, FL 7 Nashville, TN 8 San Antonio, TX 9 Phoenix, AZ 10 Atlanta, GA With a Presence in seven of the 10 Largest MSAs in the Southwest & Western US3 # 1 Southern CA4 2 Dallas, TX 3 Houston, TX 4 Phoenix, AZ 5 Ontario, CA 6 San Francisco, CA 7 Seattle, WA 8 Minneapolis, MN 9 San Diego, CA 10 Denver, CO 1,587 Full-Time Employees 99 Full Service Branches 44 States with Mortgage Capabilities Headquarters: FirstSun: Denver, CO Sunflower Bank: Dallas, TX Key Facts and Statistics $1.7B $38.61 1.08x $35.60 11.81x Market Cap Price per Share Price / TBV5 TBV per Share5 Price / LTM Adjusted Diluted EPS5 KBRA Ratings5 FirstSun Capital Bancorp Sunflower Bank, N.A. Senior Unsecured Debt = BBB Deposit = BBB+ Subordinated Debt = BBB- Senior Unsecured Debt = BBB+ Short-Term Debt = K3 Short-Term Deposit = K2 Short-Term Debt = K2 Source: S&P Global Market Intelligence, Company documents. 1 As of September 30, 2026. 2MSAs with leading household income and growth with a population currently over 2 million. 3Defined as states west of the Mississippi River. 4The MSA of Southern California includes Los Angeles, Long Beach, and Anaheim; excludes San Diego and Ontario, CA. 5As of Oct 31, 2025. KBRA ratings review expected in Q4 2026. 6Represents a non-GAAP financial measure. See Appendix for Non-GAAP Reconciliation. $15.3B Total Assets $13.0B Total Deposits $11.5B Loans HFI Franchise Footprint Key Facts and Statistics $1.7B $38.61 1.08x $35.60 7.72x Market Cap Price per Share Price / TBV5 TBV per Share5 Market Cap / LTM Adjusted PTPP Net Income5 Key Facts and Statistics $1.7B $38.61 1.08x $35.60 6.27x Market Cap Price per Share Price / TBV6 TBV per Share6 Market Cap / Q3 Annualized Adjusted PTPP Net Income6
FirstSun Capital Bancorp | 5 Investment Thesis — Focused Strategy Mix of community and high growth metro markets with emphasis on Southwest and Western US C&I business focus with a disciplined and careful CRE exposure to core customers in our geography Vertical lending expertise provides true alternative to larger banks Core deposit funded franchise Consistently strong financial service income Tenured management team
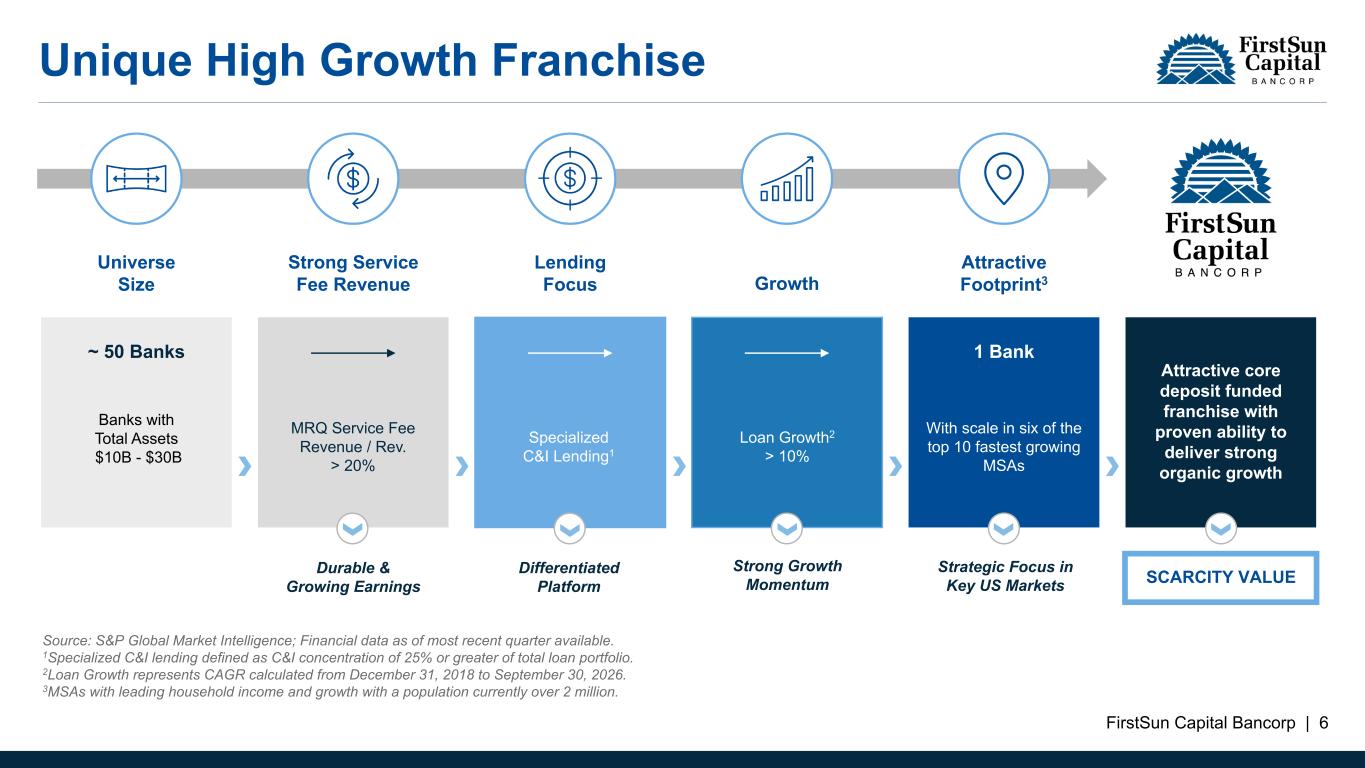
FirstSun Capital Bancorp | 6 Unique High Growth Franchise Universe Size Attractive Footprint3 Strong Service Fee Revenue Lending Focus Growth ~ 50 Banks 1 Bank Banks with Total Assets $10B - $30B MRQ Service Fee Revenue / Rev. > 20% Specialized C&I Lending1 Loan Growth2 > 10% With scale in six of the top 10 fastest growing MSAs Durable & Growing Earnings Differentiated Platform Strong Growth Momentum Strategic Focus in Key US Markets Attractive core deposit funded franchise with proven ability to deliver strong organic growth SCARCITY VALUE Source: S&P Global Market Intelligence; Financial data as of most recent quarter available. 1Specialized C&I lending defined as C&I concentration of 25% or greater of total loan portfolio. 2Loan Growth represents CAGR calculated from December 31, 2018 to September 30, 2026. 3MSAs with leading household income and growth with a population currently over 2 million.
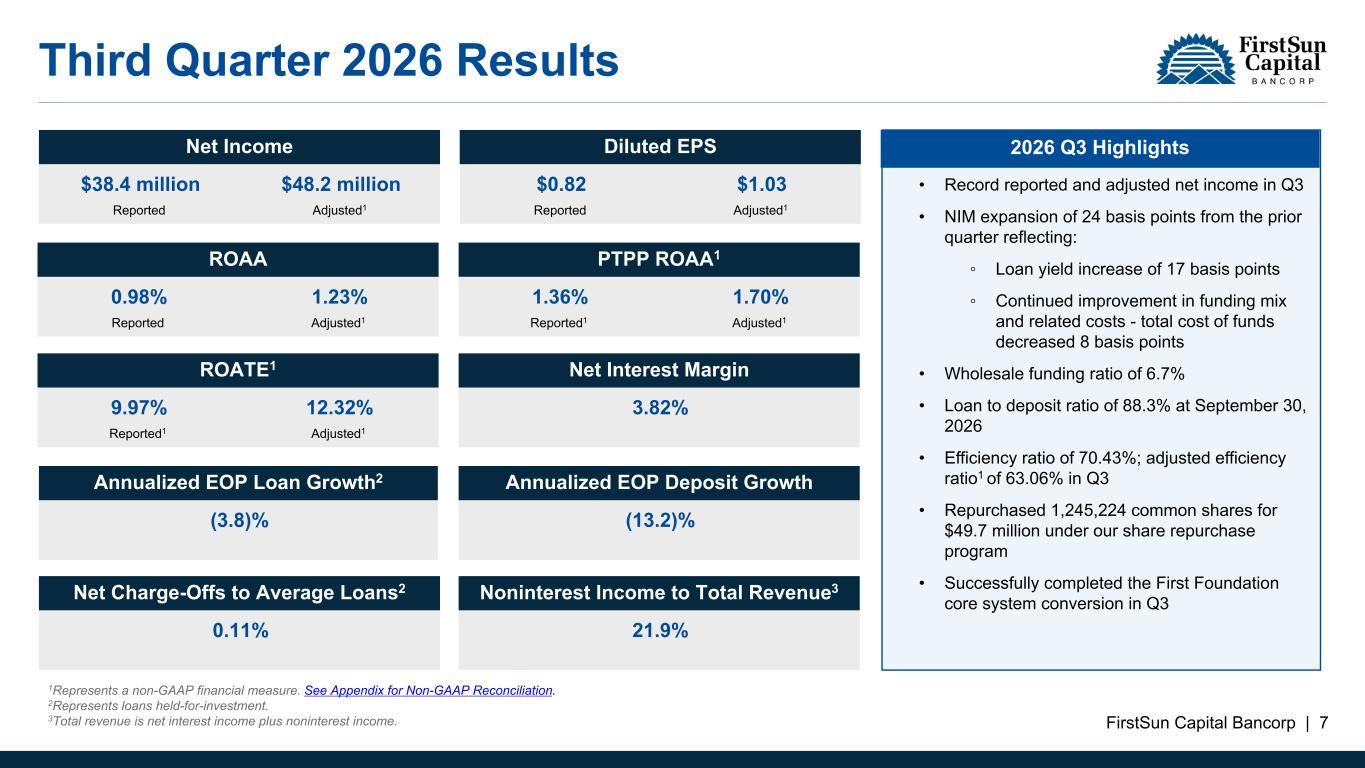
FirstSun Capital Bancorp | 7 Third Quarter 2026 Results Net Income $38.4 million $48.2 million Reported Adjusted1 Diluted EPS $0.82 $1.03 Reported Adjusted1 PTPP ROAA1 1.36% 1.70% Reported1 Adjusted1 Noninterest Income to Total Revenue3 21.9% ROAA 0.98% 1.23% Reported Adjusted1 Net Interest Margin 3.82% ROATE1 9.97% 12.32% Reported1 Adjusted1 Net Charge-Offs to Average Loans2 0.11% Annualized EOP Loan Growth2 (3.8)% Annualized EOP Deposit Growth (13.2)% • Record reported and adjusted net income in Q3 • NIM expansion of 24 basis points from the prior quarter reflecting: ◦ Loan yield increase of 17 basis points ◦ Continued improvement in funding mix and related costs - total cost of funds decreased 8 basis points • Wholesale funding ratio of 6.7% • Loan to deposit ratio of 88.3% at September 30, 2026 • Efficiency ratio of 70.43%; adjusted efficiency ratio1 of 63.06% in Q3 • Repurchased 1,245,224 common shares for $49.7 million under our share repurchase program • Successfully completed the First Foundation core system conversion in Q3 1Represents a non-GAAP financial measure. See Appendix for Non-GAAP Reconciliation. 2Represents loans held-for-investment. 3Total revenue is net interest income plus noninterest income. 2026 Q3 Highlights
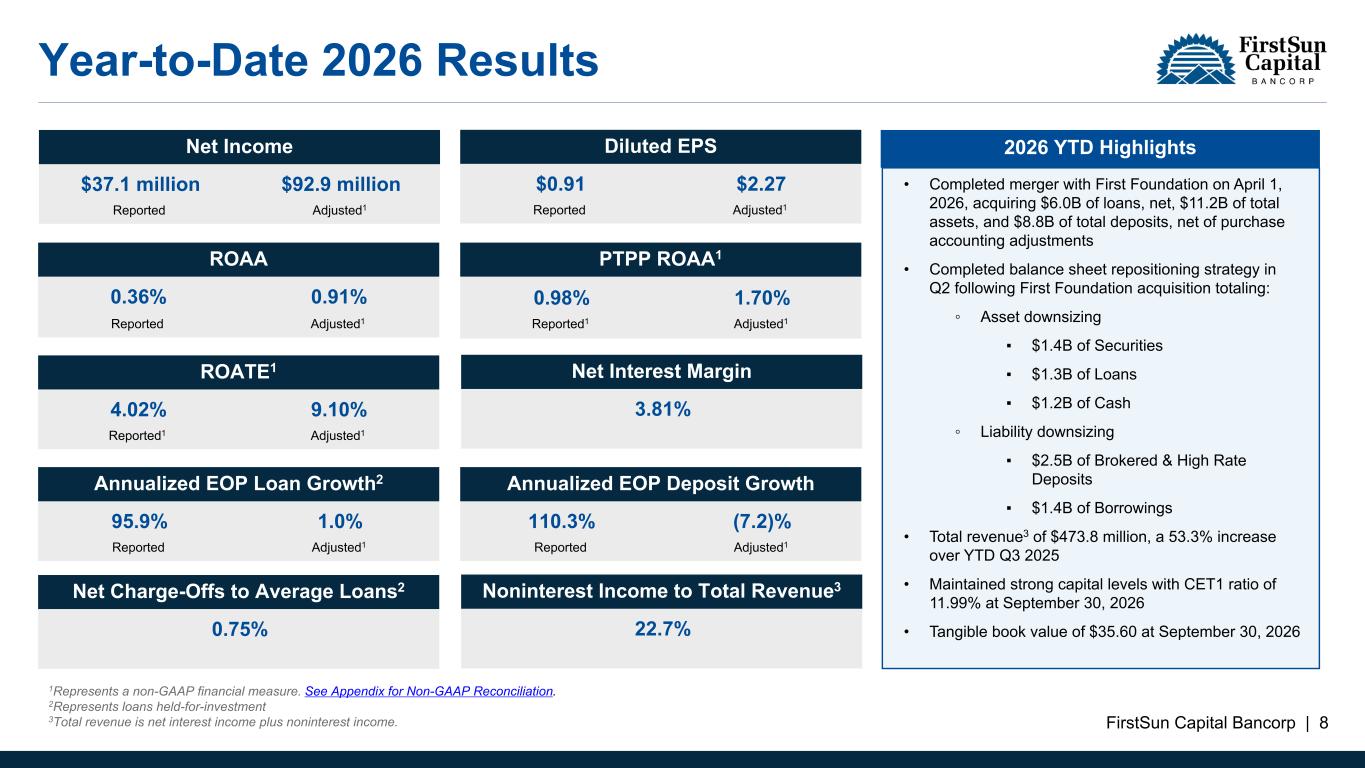
FirstSun Capital Bancorp | 8 Efficiency Ratio 78.86% 63.35% Reported Adjusted1 Year-to-Date 2026 Results Net Income $37.1 million $92.9 million Reported Adjusted1 Diluted EPS $0.91 $2.27 Reported Adjusted1 PTPP ROAA1 0.98% 1.70% Reported1 Adjusted1 Net Charge-Offs to Average Loans2 0.75% ROAA 0.36% 0.91% Reported Adjusted1 Noninterest Income to Total Revenue3 22.7% ROATE1 4.02% 9.10% Reported1 Adjusted1 CET1 11.99% Net Interest Margin 3.81% 1Represents a non-GAAP financial measure. See Appendix for Non-GAAP Reconciliation. 2Represents loans held-for-investment 3Total revenue is net interest income plus noninterest income. Annualized EOP Deposit Growth 110.3% (7.2)% Reported Adjusted1 • Completed merger with First Foundation on April 1, 2026, acquiring $6.0B of loans, net, $11.2B of total assets, and $8.8B of total deposits, net of purchase accounting adjustments • Completed balance sheet repositioning strategy in Q2 following First Foundation acquisition totaling: ◦ Asset downsizing ▪ $1.4B of Securities ▪ $1.3B of Loans ▪ $1.2B of Cash ◦ Liability downsizing ▪ $2.5B of Brokered & High Rate Deposits ▪ $1.4B of Borrowings • Total revenue3 of $473.8 million, a 53.3% increase over YTD Q3 2025 • Maintained strong capital levels with CET1 ratio of 11.99% at September 30, 2026 • Tangible book value of $35.60 at September 30, 2026 Annualized EOP Loan Growth2 95.9% 1.0% Reported Adjusted1 2026 YTD Highlights
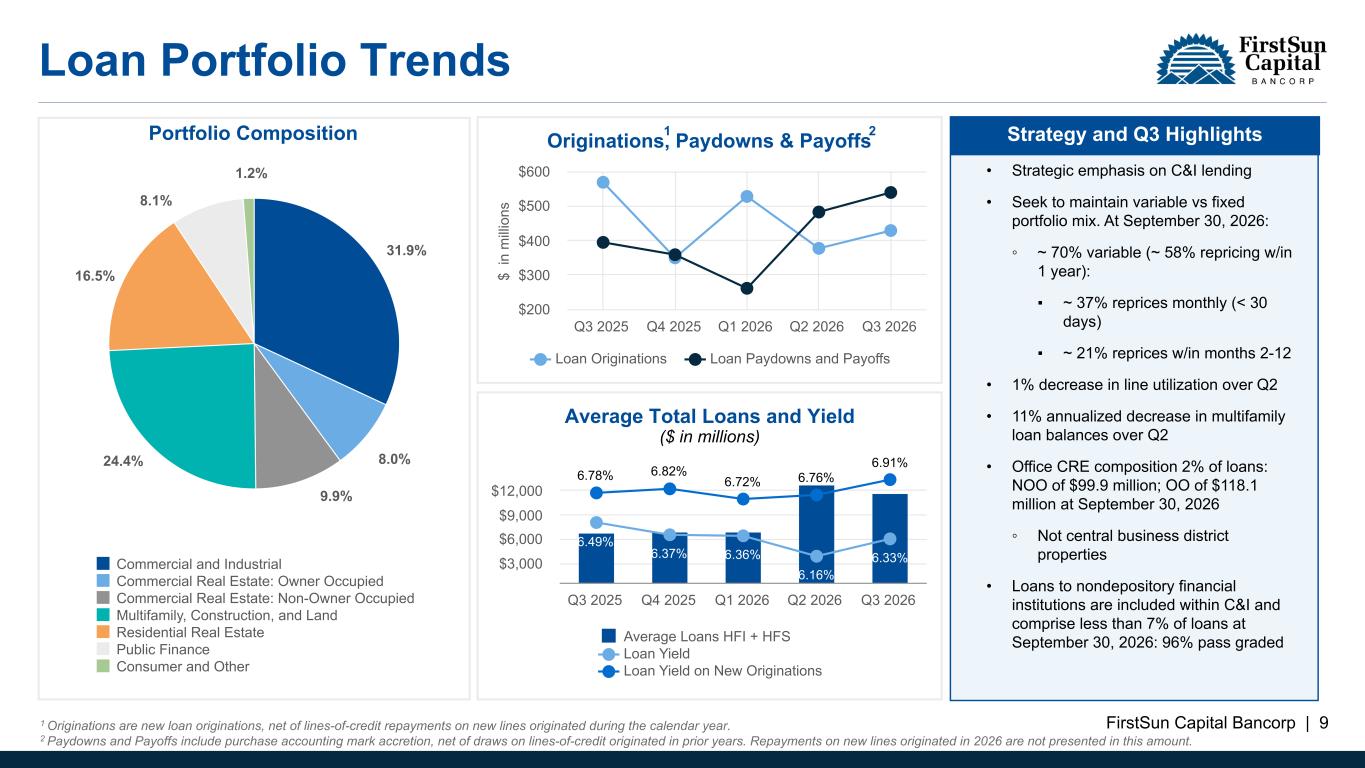
FirstSun Capital Bancorp | 9 Loan Portfolio Trends Portfolio Composition 31.9% 8.0% 9.9% 24.4% 16.5% 8.1% 1.2% Commercial and Industrial Commercial Real Estate: Owner Occupied Commercial Real Estate: Non-Owner Occupied Multifamily, Construction, and Land Residential Real Estate Public Finance Consumer and Other $ in m ill io ns Originations, Paydowns & Payoffs Loan Originations Loan Paydowns and Payoffs Q3 2025 Q4 2025 Q1 2026 Q2 2026 Q3 2026 $200 $300 $400 $500 $600 Average Total Loans and Yield 6.49% 6.37% 6.36% 6.16% 6.33% 6.78% 6.82% 6.72% 6.76% 6.91% Average Loans HFI + HFS Loan Yield Loan Yield on New Originations Q3 2025 Q4 2025 Q1 2026 Q2 2026 Q3 2026 $3,000 $6,000 $9,000 $12,000 1 Originations are new loan originations, net of lines-of-credit repayments on new lines originated during the calendar year. 2 Paydowns and Payoffs include purchase accounting mark accretion, net of draws on lines-of-credit originated in prior years. Repayments on new lines originated in 2026 are not presented in this amount. ($ in millions) • Strategic emphasis on C&I lending • Seek to maintain variable vs fixed portfolio mix. At September 30, 2026: ◦ ~ 70% variable (~ 58% repricing w/in 1 year): ▪ ~ 37% reprices monthly (< 30 days) ▪ ~ 21% reprices w/in months 2-12 • 1% decrease in line utilization over Q2 • 11% annualized decrease in multifamily loan balances over Q2 • Office CRE composition 2% of loans: NOO of $99.9 million; OO of $118.1 million at September 30, 2026 ◦ Not central business district properties • Loans to nondepository financial institutions are included within C&I and comprise less than 7% of loans at September 30, 2026: 96% pass graded Strategy and Q3 Highlights Q3 2026 Loan Balance Activity (in millions) Q2 2026 Ending Balance $ 6,834 Loan downsizing3 — Adjusted loan growth 4,623 Q3 2026 Ending Balances $ 11,458 QoQ Change $ 4,624 21
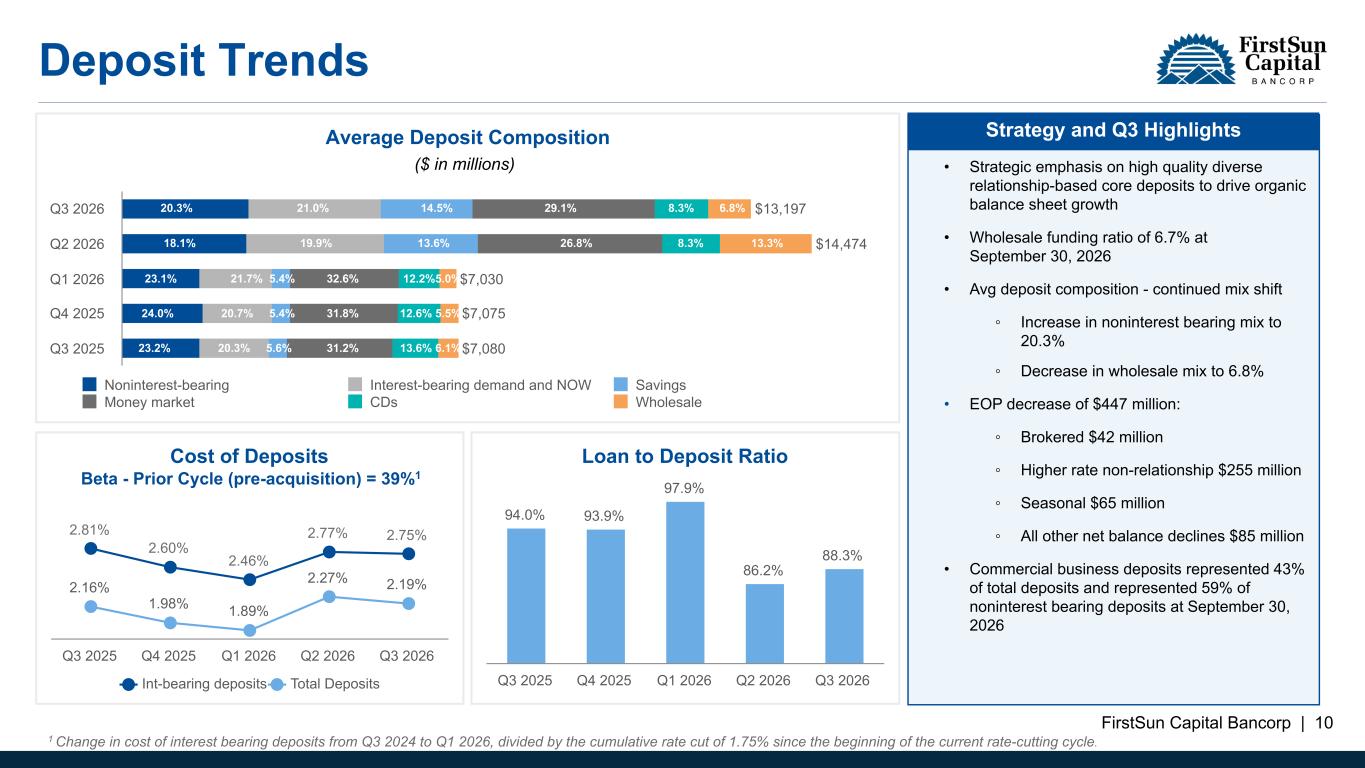
FirstSun Capital Bancorp | 10 Deposit Trends Average Deposit Composition $13,197 $14,474 $7,030 $7,075 $7,080 Noninterest-bearing Interest-bearing demand and NOW Savings Money market CDs Wholesale Q3 2026 Q2 2026 Q1 2026 Q4 2025 Q3 2025 Cost of Deposits 2.81% 2.60% 2.46% 2.77% 2.75% 2.16% 1.98% 1.89% 2.27% 2.19% Int-bearing deposits Total Deposits Q3 2025 Q4 2025 Q1 2026 Q2 2026 Q3 2026 Loan to Deposit Ratio 94.0% 93.9% 97.9% 86.2% 88.3% Q3 2025 Q4 2025 Q1 2026 Q2 2026 Q3 2026 ($ in millions) • Strategic emphasis on high quality diverse relationship-based core deposits to drive organic balance sheet growth • Wholesale funding ratio of 6.7% at September 30, 2026 • Avg deposit composition - continued mix shift ◦ Increase in noninterest bearing mix to 20.3% ◦ Decrease in wholesale mix to 6.8% • EOP decrease of $447 million: ◦ Brokered $42 million ◦ Higher rate non-relationship $255 million ◦ Seasonal $65 million ◦ All other net balance declines $85 million • Commercial business deposits represented 43% of total deposits and represented 59% of noninterest bearing deposits at September 30, 2026 Strategy and Q3 Highlights 18.1% 19.9% 13.6% 26.8% 8.3% 13.3% 23.1% 21.7% 5.4% 32.6% 12.2%5.0% 24.0% 20.7% 5.4% 31.8% 12.6% 5.5% 23.2% 20.3% 5.6% 31.2% 13.6% 6.1% 20.3% 21.0% 14.5% 29.1% 8.3% 6.8% Beta - Prior Cycle (pre-acquisition) = 39%1 1 Change in cost of interest bearing deposits from Q3 2024 to Q1 2026, divided by the cumulative rate cut of 1.75% since the beginning of the current rate-cutting cycle. Q2 2026 Deposit Balance Activity (in millions) Q1 2026 Ending Balance $ 7,171 First Foundation acquired deposits3 as of 4/1/26 — Deposit downsizing — Adjusted deposit growth 5,800 Q2 2026 Ending Balances $ 12,971 QoQ Change $ 5,800
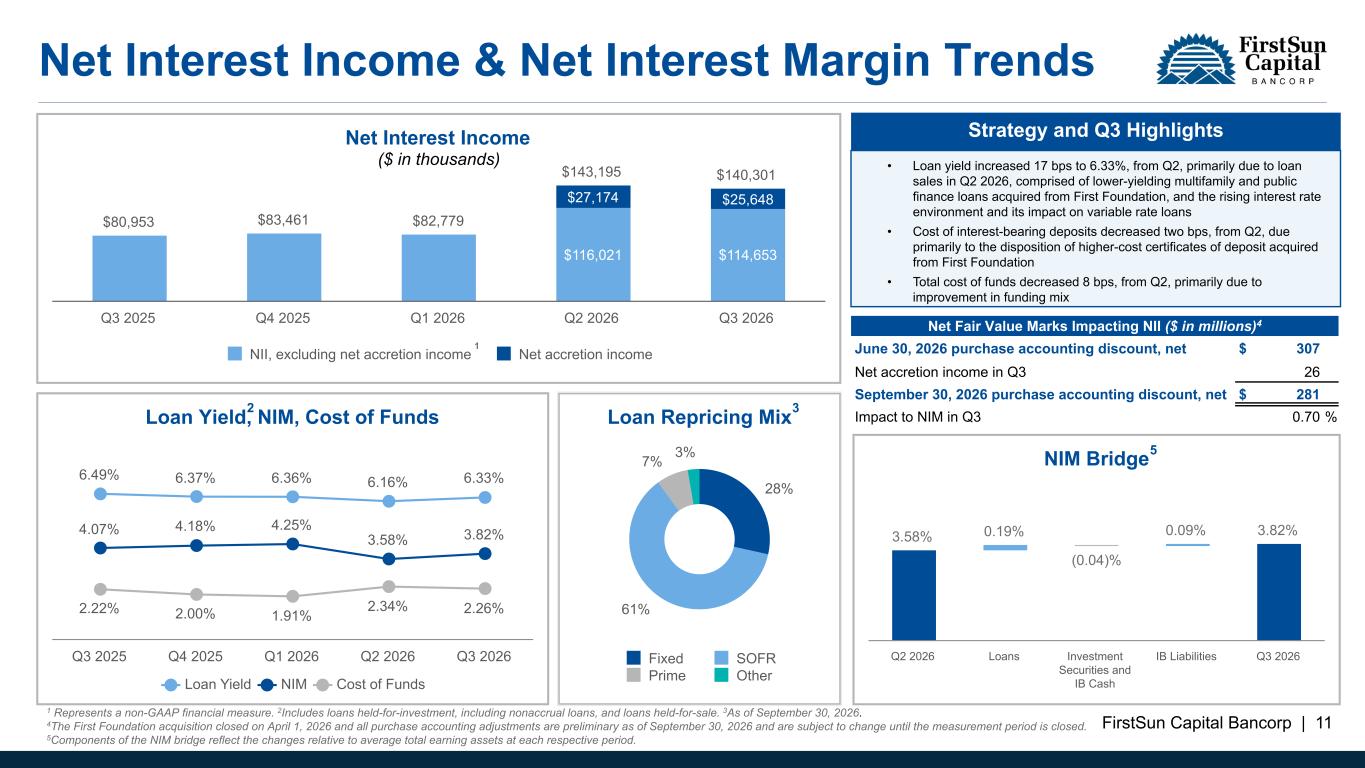
FirstSun Capital Bancorp | 11 NIM Bridge 3.58% (1.25)% 0.68% (0.10)% 3.82% Q2 2026 First Foundation Impact Purchase Accounting Adjustments Impact Legacy FirstSun Impact Q3 2026 Loan Yield, NIM, Cost of Funds 6.49% 6.37% 6.36% 6.16% 6.33% 4.07% 4.18% 4.25% 3.58% 3.82% 2.22% 2.00% 1.91% 2.34% 2.26% Loan Yield NIM Cost of Funds Q3 2025 Q4 2025 Q1 2026 Q2 2026 Q3 2026 Net Interest Income $80,953 $83,461 $82,779 $143,195 $140,301 Q3 2025 Q4 2025 Q1 2026 Q2 2026 Q3 2026 Loan Repricing Mix 28% 61% 7% 3% Fixed SOFR Prime Other Net Interest Income & Net Interest Margin Trends ($ in thousands) Strategy and Q3 Highlights 1 Represents a non-GAAP financial measure. 2Includes loans held-for-investment, including nonaccrual loans, and loans held-for-sale. 3As of September 30, 2026. 4The First Foundation acquisition closed on April 1, 2026 and all purchase accounting adjustments are preliminary as of September 30, 2026 and are subject to change until the measurement period is closed. 5Components of the NIM bridge reflect the changes relative to average total earning assets at each respective period. 5 2 Net Interest Income $80,953 $83,461 $82,779 $143,195 $140,301 $116,021 $114,653 $27,174 $25,648 NII, excluding net accretion income Net accretion income Q3 2025 Q4 2025 Q1 2026 Q2 2026 Q3 2026 • Loan yield increased 17 bps to 6.33%, from Q2, primarily due to loan sales in Q2 2026, comprised of lower-yielding multifamily and public finance loans acquired from First Foundation, and the rising interest rate environment and its impact on variable rate loans • Cost of interest-bearing deposits decreased two bps, from Q2, due primarily to the disposition of higher-cost certificates of deposit acquired from First Foundation • Total cost of funds decreased 8 bps, from Q2, primarily due to improvement in funding mix Net Fair Value Marks Impacting NII ($ in millions)4 June 30, 2026 purchase accounting discount, net $ 307 Net accretion income in Q3 26 September 30, 2026 purchase accounting discount, net $ 281 Impact to NIM in Q3 0.70 % 3 NIM Bridge 3.58% 0.19% (0.04)% 0.09% 3.82% Q2 2026 Loans Investment Securities and IB Cash IB Liabilities Q3 2026 1
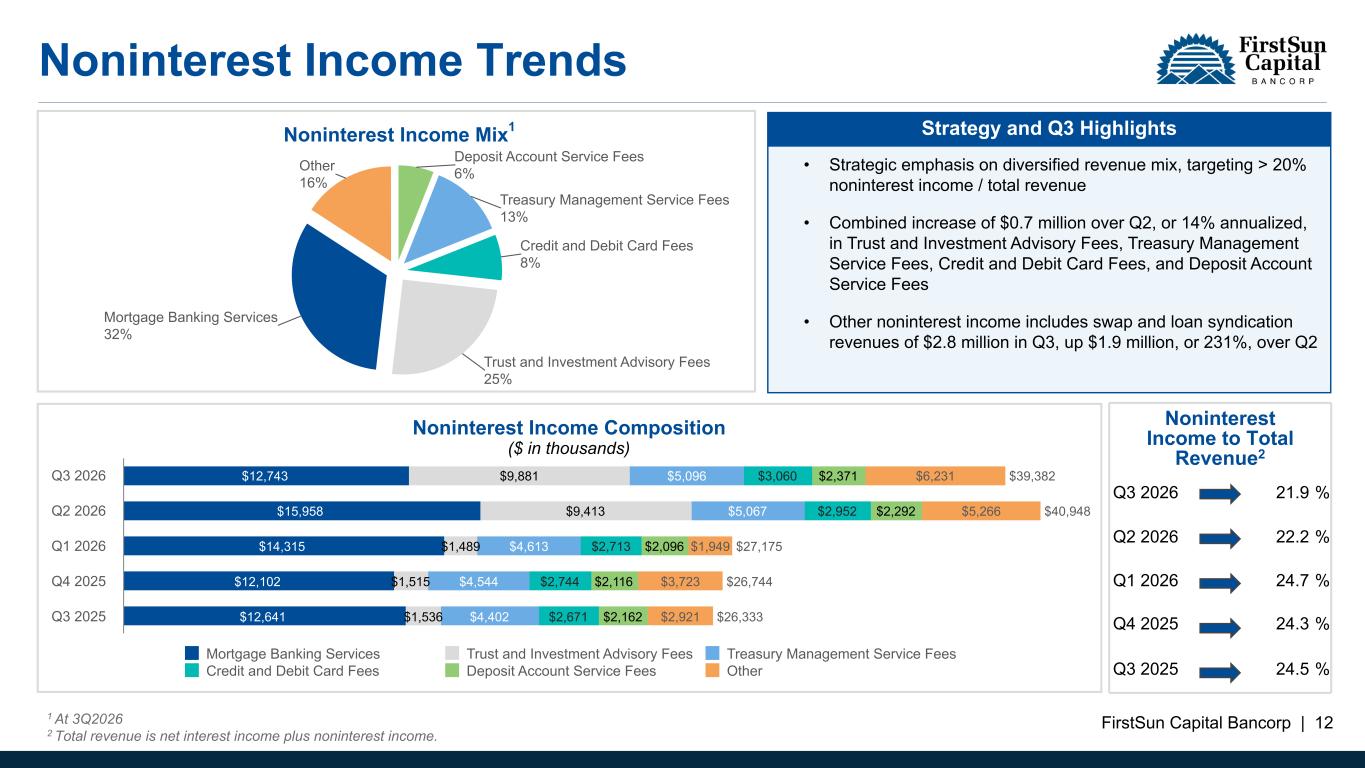
FirstSun Capital Bancorp | 12 Noninterest Income Trends Noninterest Income Composition $39,382 $40,948 $27,175 $26,744 $26,333 $12,743 $15,958 $14,315 $12,102 $12,641 $9,881 $9,413 $1,489 $1,515 $1,536 $5,096 $5,067 $4,613 $4,544 $4,402 $3,060 $2,952 $2,713 $2,744 $2,671 $2,371 $2,292 $2,096 $2,116 $2,162 $6,231 $5,266 $1,949 $3,723 $2,921 Mortgage Banking Services Trust and Investment Advisory Fees Treasury Management Service Fees Credit and Debit Card Fees Deposit Account Service Fees Other Q3 2026 Q2 2026 Q1 2026 Q4 2025 Q3 2025 ($ in thousands) Strategy and Q3 Highlights 1 At 3Q2026 2 Total revenue is net interest income plus noninterest income. • Strategic emphasis on diversified revenue mix, targeting > 20% noninterest income / total revenue • Combined increase of $0.7 million over Q2, or 14% annualized, in Trust and Investment Advisory Fees, Treasury Management Service Fees, Credit and Debit Card Fees, and Deposit Account Service Fees • Other noninterest income includes swap and loan syndication revenues of $2.8 million in Q3, up $1.9 million, or 231%, over Q2 Noninterest Income Mix Deposit Account Service Fees 6% Treasury Management Service Fees 13% Credit and Debit Card Fees 8% Trust and Investment Advisory Fees 25% Mortgage Banking Services 32% Other 16% 1 Noninterest Income to Total Revenue2 Q3 2026 21.9 % Q2 2026 22.2 % Q1 2026 24.7 % Q4 2025 24.3 % Q3 2025 24.5 %
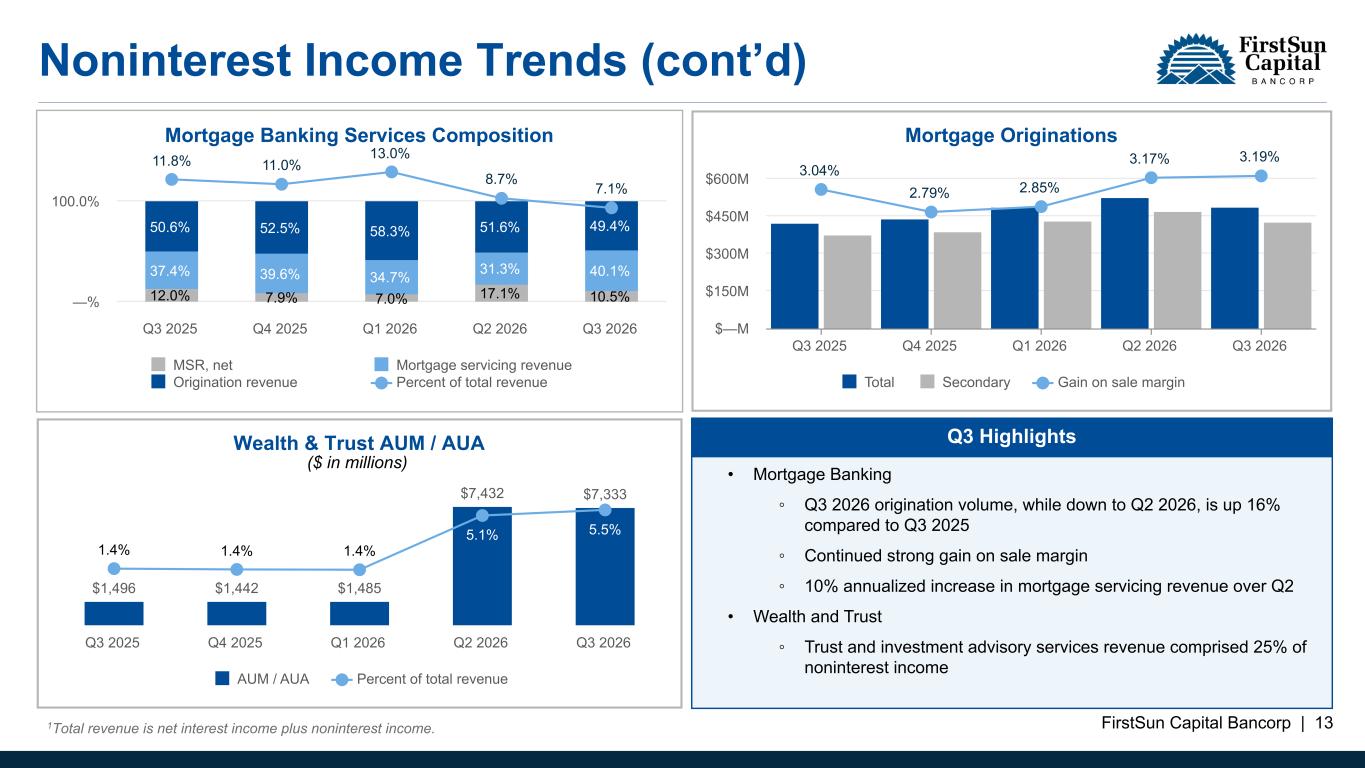
FirstSun Capital Bancorp | 13 Noninterest Income Trends (cont’d) Q3 Highlights 1Total revenue is net interest income plus noninterest income. • Mortgage Banking ◦ Q3 2026 origination volume, while down to Q2 2026, is up 16% compared to Q3 2025 ◦ Continued strong gain on sale margin ◦ 10% annualized increase in mortgage servicing revenue over Q2 • Wealth and Trust ◦ Trust and investment advisory services revenue comprised 25% of noninterest income Mortgage Banking Services Composition 12.0% 7.9% 7.0% 17.1% 10.5% 37.4% 39.6% 34.7% 31.3% 40.1% 50.6% 52.5% 58.3% 51.6% 49.4% 11.8% 11.0% 13.0% 8.7% 7.1% MSR, net Mortgage servicing revenue Origination revenue Percent of total revenue Q3 2025 Q4 2025 Q1 2026 Q2 2026 Q3 2026 —% 100.0% Mortgage Originations 3.04% 2.79% 2.85% 3.17% 3.19% Total Secondary Gain on sale margin Q3 2025 Q4 2025 Q1 2026 Q2 2026 Q3 2026 $—M $150M $300M $450M $600M Wealth & Trust AUM / AUA $1,496 $1,442 $1,485 $7,432 $7,333 1.4% 1.4% 1.4% 5.1% 5.5% AUM / AUA Percent of total revenue Q3 2025 Q4 2025 Q1 2026 Q2 2026 Q3 2026 ($ in millions)
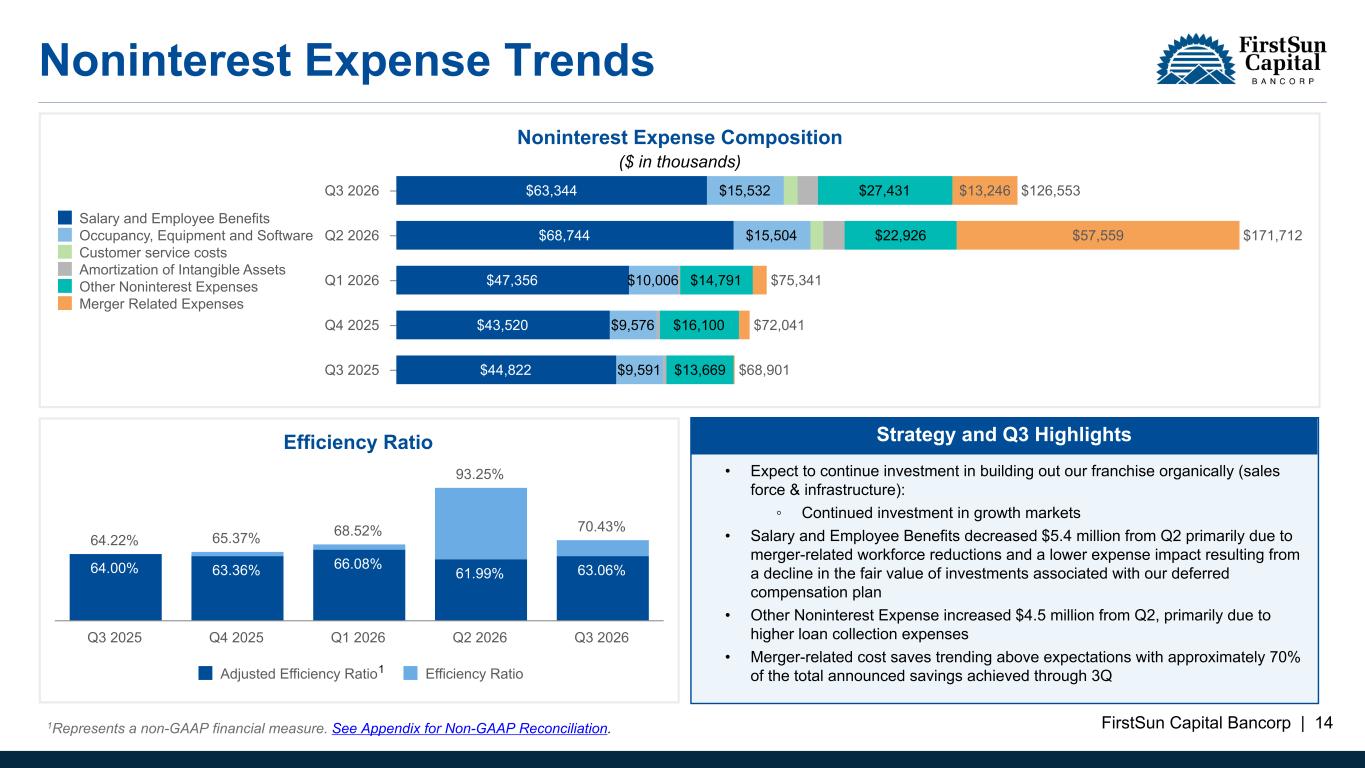
FirstSun Capital Bancorp | 14 Noninterest Expense Trends Noninterest Expense Composition $126,553 $171,712 $75,341 $72,041 $68,901 $63,344 $68,744 $47,356 $43,520 $44,822 $15,532 $15,504 $10,006 $9,576 $9,591 $27,431 $22,926 $14,791 $16,100 $13,669 $13,246 $57,559 Salary and Employee Benefits Occupancy, Equipment and Software Customer service costs Amortization of Intangible Assets Other Noninterest Expenses Merger Related Expenses Q3 2026 Q2 2026 Q1 2026 Q4 2025 Q3 2025 Efficiency Ratio 64.22% 65.37% 68.52% 93.25% 70.43% 64.00% 63.36% 66.08% 61.99% 63.06% Adjusted Efficiency Ratio Efficiency Ratio Q3 2025 Q4 2025 Q1 2026 Q2 2026 Q3 2026 ($ in thousands) 1Represents a non-GAAP financial measure. See Appendix for Non-GAAP Reconciliation. • Expect to continue investment in building out our franchise organically (sales force & infrastructure): ◦ Continued investment in growth markets • Salary and Employee Benefits decreased $5.4 million from Q2 primarily due to merger-related workforce reductions and a lower expense impact resulting from a decline in the fair value of investments associated with our deferred compensation plan • Other Noninterest Expense increased $4.5 million from Q2, primarily due to higher loan collection expenses • Merger-related cost saves trending above expectations with approximately 70% of the total announced savings achieved through 3Q Strategy and Q3 Highlights 1
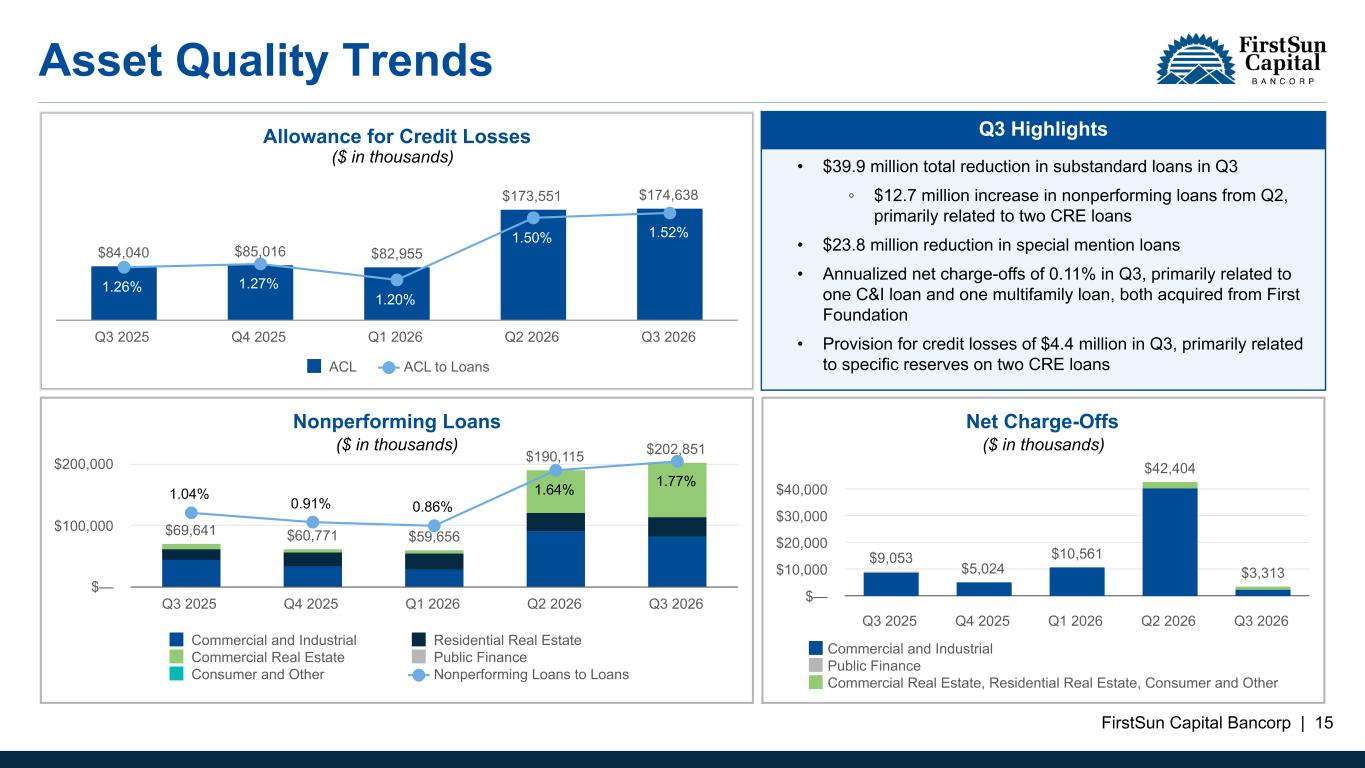
FirstSun Capital Bancorp | 15 Asset Quality Trends Net Charge-Offs $9,053 $5,024 $10,561 $42,404 $3,313 Commercial and Industrial Public Finance Commercial Real Estate, Residential Real Estate, Consumer and Other Q3 2025 Q4 2025 Q1 2026 Q2 2026 Q3 2026 $— $10,000 $20,000 $30,000 $40,000 Allowance for Credit Losses $84,040 $85,016 $82,955 $173,551 $174,638 1.26% 1.27% 1.20% 1.50% 1.52% ACL ACL to Loans Q3 2025 Q4 2025 Q1 2026 Q2 2026 Q3 2026 ($ in thousands) ($ in thousands)($ in thousands) • $39.9 million total reduction in substandard loans in Q3 ◦ $12.7 million increase in nonperforming loans from Q2, primarily related to two CRE loans • $23.8 million reduction in special mention loans • Annualized net charge-offs of 0.11% in Q3, primarily related to one C&I loan and one multifamily loan, both acquired from First Foundation • Provision for credit losses of $4.4 million in Q3, primarily related to specific reserves on two CRE loans Q3 Highlights Nonperforming Loans $69,641 $60,771 $59,656 $190,115 $202,851 1.04% 0.91% 0.86% 1.64% 1.77% Commercial and Industrial Residential Real Estate Commercial Real Estate Public Finance Consumer and Other Nonperforming Loans to Loans Q3 2025 Q4 2025 Q1 2026 Q2 2026 Q3 2026 $— $100,000 $200,000
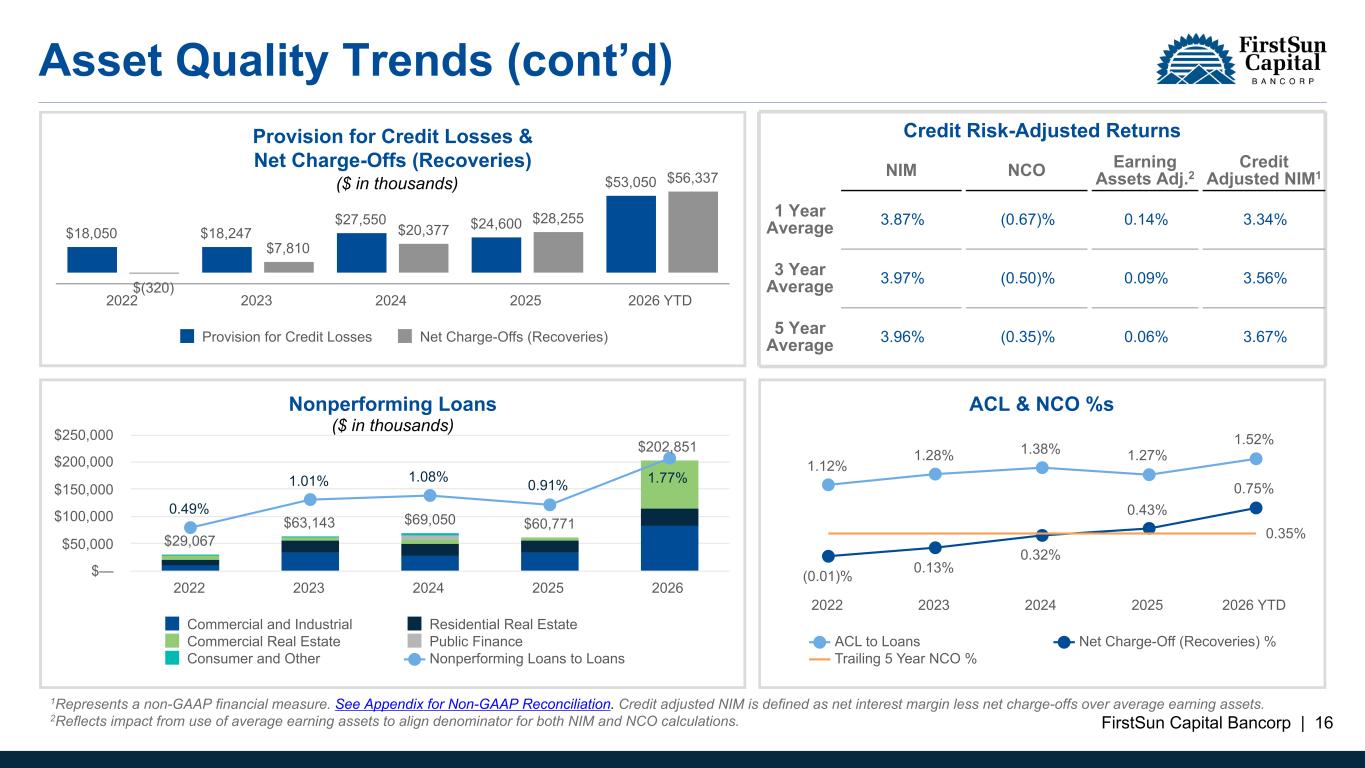
FirstSun Capital Bancorp | 16 Asset Quality Trends (cont’d) ($ in thousands) ($ in thousands) ACL & NCO %s 1.12% 1.28% 1.38% 1.27% 1.52% (0.01)% 0.13% 0.32% 0.43% 0.75% 0.35% ACL to Loans Net Charge-Off (Recoveries) % Trailing 5 Year NCO % 2022 2023 2024 2025 2026 YTD Provision for Credit Losses & Net Charge-Offs (Recoveries) $18,050 $18,247 $27,550 $24,600 $53,050 $(320) $7,810 $20,377 $28,255 $56,337 Provision for Credit Losses Net Charge-Offs (Recoveries) 2022 2023 2024 2025 2026 YTD Nonperforming Loans $29,067 $63,143 $69,050 $60,771 $202,851 0.49% 1.01% 1.08% 0.91% 1.77% Commercial and Industrial Residential Real Estate Commercial Real Estate Public Finance Consumer and Other Nonperforming Loans to Loans 2022 2023 2024 2025 2026 $— $50,000 $100,000 $150,000 $200,000 $250,000 Credit Risk-Adjusted Returns NIM NCO Earning Assets Adj.2 Credit Adjusted NIM1 1 Year Average 3.87% (0.67)% 0.14% 3.34% 3 Year Average 3.97% (0.50)% 0.09% 3.56% 5 Year Average 3.96% (0.35)% 0.06% 3.67% 1Represents a non-GAAP financial measure. See Appendix for Non-GAAP Reconciliation. Credit adjusted NIM is defined as net interest margin less net charge-offs over average earning assets. 2Reflects impact from use of average earning assets to align denominator for both NIM and NCO calculations.
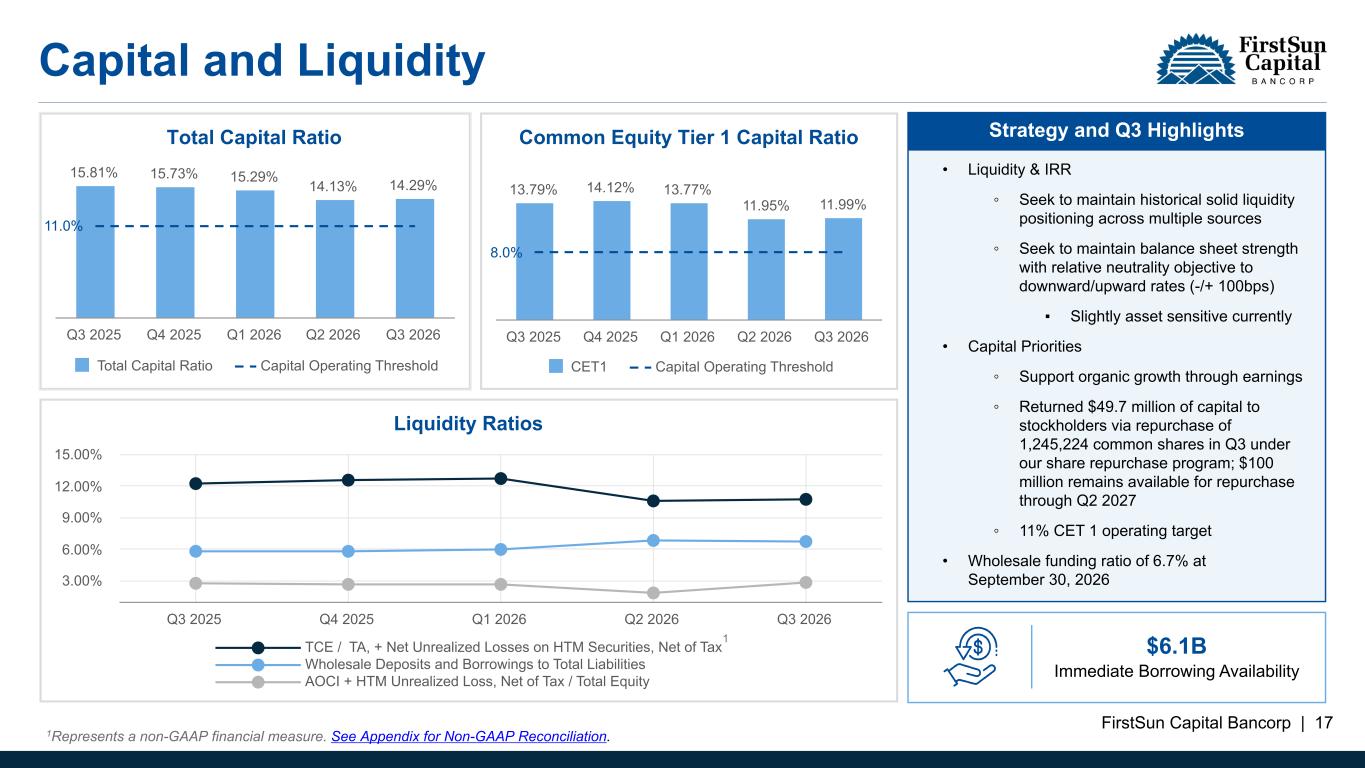
FirstSun Capital Bancorp | 17 Capital and Liquidity Total Capital Ratio 15.81% 15.73% 15.29% 14.13% 14.29% 11.0% Total Capital Ratio Capital Operating Threshold Q3 2025 Q4 2025 Q1 2026 Q2 2026 Q3 2026 Common Equity Tier 1 Capital Ratio 13.79% 14.12% 13.77% 11.95% 11.99% 8.0% CET1 Capital Operating Threshold Q3 2025 Q4 2025 Q1 2026 Q2 2026 Q3 2026 Liquidity Ratios TCE / TA, + Net Unrealized Losses on HTM Securities, Net of Tax Wholesale Deposits and Borrowings to Total Liabilities AOCI + HTM Unrealized Loss, Net of Tax / Total Equity Q3 2025 Q4 2025 Q1 2026 Q2 2026 Q3 2026 3.00% 6.00% 9.00% 12.00% 15.00% • Liquidity & IRR ◦ Seek to maintain historical solid liquidity positioning across multiple sources ◦ Seek to maintain balance sheet strength with relative neutrality objective to downward/upward rates (-/+ 100bps) ▪ Slightly asset sensitive currently • Capital Priorities ◦ Support organic growth through earnings ◦ Returned $49.7 million of capital to stockholders via repurchase of 1,245,224 common shares in Q3 under our share repurchase program; $100 million remains available for repurchase through Q2 2027 ◦ 11% CET 1 operating target • Wholesale funding ratio of 6.7% at September 30, 2026 Strategy and Q3 Highlights $6.1B Immediate Borrowing Availability 1Represents a non-GAAP financial measure. See Appendix for Non-GAAP Reconciliation. 1
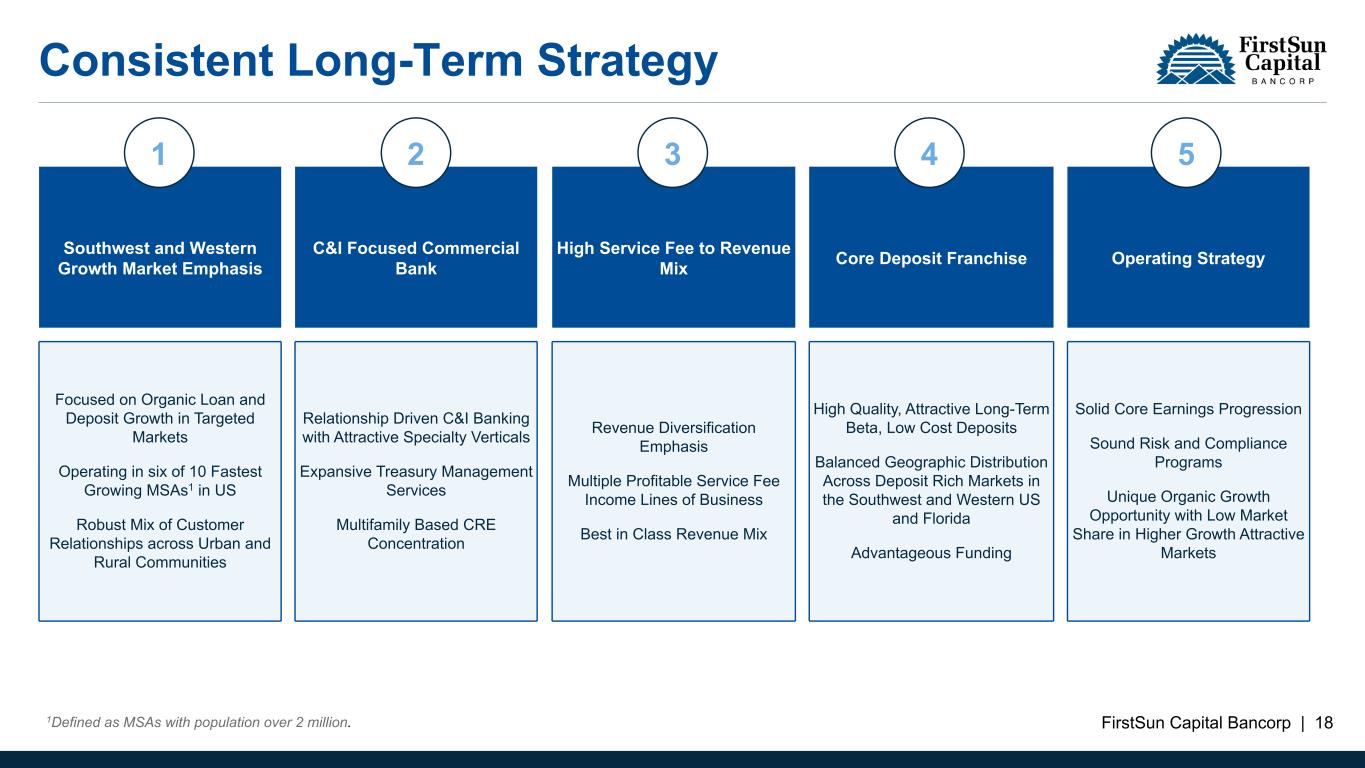
FirstSun Capital Bancorp | 18 Consistent Long-Term Strategy Southwest and Western Growth Market Emphasis C&I Focused Commercial Bank High Service Fee to Revenue Mix Core Deposit Franchise Operating Strategy Focused on Organic Loan and Deposit Growth in Targeted Markets Operating in six of 10 Fastest Growing MSAs1 in US Robust Mix of Customer Relationships across Urban and Rural Communities Relationship Driven C&I Banking with Attractive Specialty Verticals Expansive Treasury Management Services Multifamily Based CRE Concentration Revenue Diversification Emphasis Multiple Profitable Service Fee Income Lines of Business Best in Class Revenue Mix High Quality, Attractive Long-Term Beta, Low Cost Deposits Balanced Geographic Distribution Across Deposit Rich Markets in the Southwest and Western US and Florida Advantageous Funding Solid Core Earnings Progression Sound Risk and Compliance Programs Unique Organic Growth Opportunity with Low Market Share in Higher Growth Attractive Markets 1 2 3 4 5 1Defined as MSAs with population over 2 million.
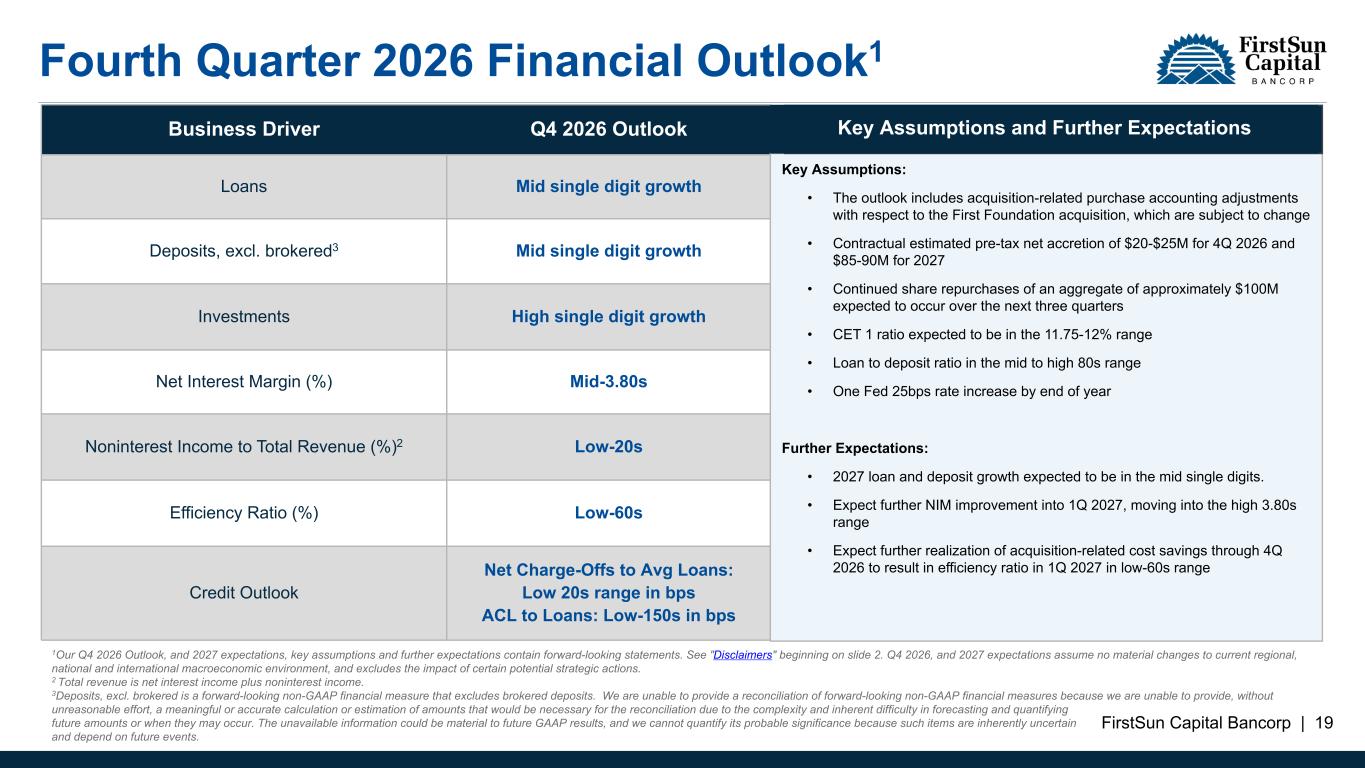
FirstSun Capital Bancorp | 19 Fourth Quarter 2026 Financial Outlook1 Business Driver Q4 2026 Outlook Loans Mid single digit growth Deposits, excl. brokered3 Mid single digit growth Investments High single digit growth Net Interest Margin (%) Mid-3.80s Noninterest Income to Total Revenue (%)2 Low-20s Efficiency Ratio (%) Low-60s Credit Outlook Net Charge-Offs to Avg Loans: Low 20s range in bps ACL to Loans: Low-150s in bps 1Our Q4 2026 Outlook, and 2027 expectations, key assumptions and further expectations contain forward-looking statements. See "Disclaimers" beginning on slide 2. Q4 2026, and 2027 expectations assume no material changes to current regional, national and international macroeconomic environment, and excludes the impact of certain potential strategic actions. 2 Total revenue is net interest income plus noninterest income. 3Deposits, excl. brokered is a forward-looking non-GAAP financial measure that excludes brokered deposits. We are unable to provide a reconciliation of forward-looking non-GAAP financial measures because we are unable to provide, without unreasonable effort, a meaningful or accurate calculation or estimation of amounts that would be necessary for the reconciliation due to the complexity and inherent difficulty in forecasting and quantifying future amounts or when they may occur. The unavailable information could be material to future GAAP results, and we cannot quantify its probable significance because such items are inherently uncertain and depend on future events. Key Assumptions: • The outlook includes acquisition-related purchase accounting adjustments with respect to the First Foundation acquisition, which are subject to change • Contractual estimated pre-tax net accretion of $20-$25M for 4Q 2026 and $85-90M for 2027 • Continued share repurchases of an aggregate of approximately $100M expected to occur over the next three quarters • CET 1 ratio expected to be in the 11.75-12% range • Loan to deposit ratio in the mid to high 80s range • One Fed 25bps rate increase by end of year Further Expectations: • 2027 loan and deposit growth expected to be in the mid single digits. • Expect further NIM improvement into 1Q 2027, moving into the high 3.80s range • Expect further realization of acquisition-related cost savings through 4Q 2026 to result in efficiency ratio in 1Q 2027 in low-60s range Key Assumptions and Further Expectations

FirstSun Capital Bancorp | 20 Appendix
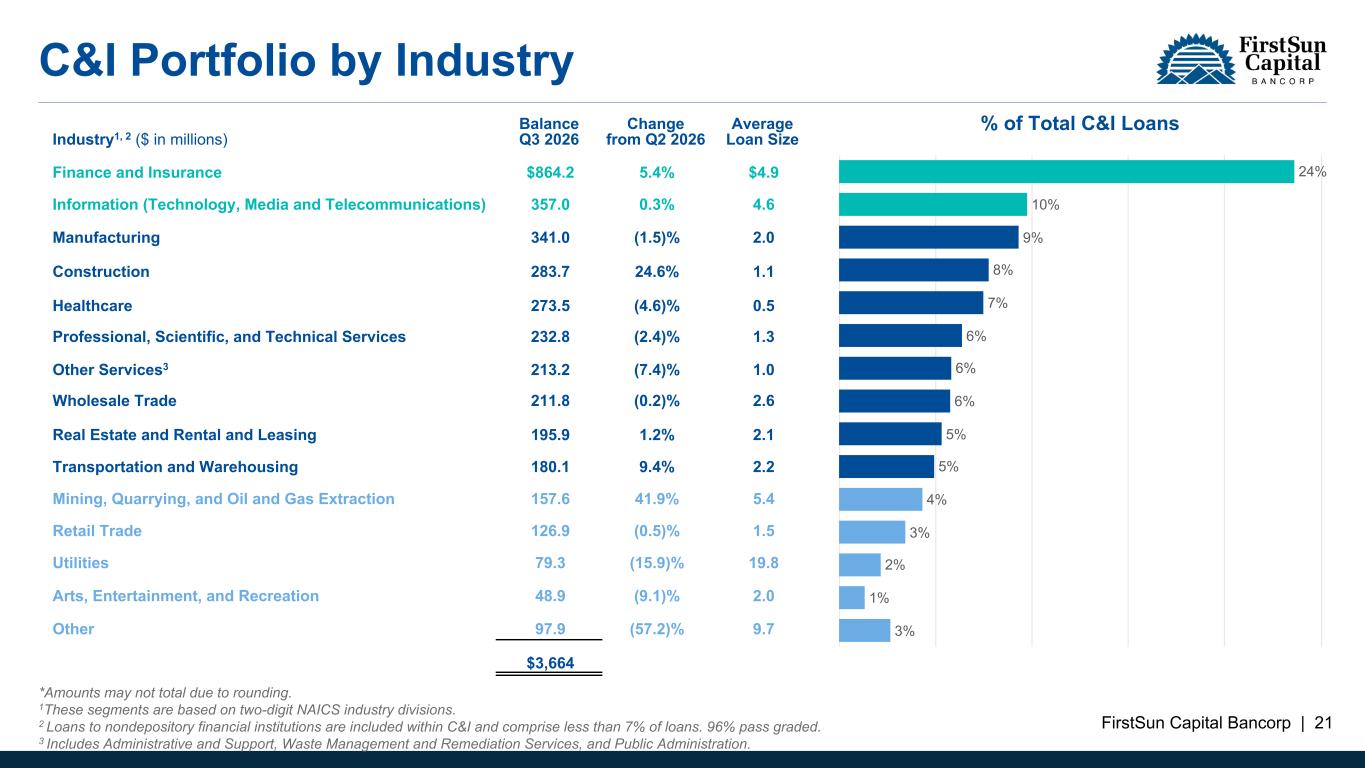
FirstSun Capital Bancorp | 21 C&I Portfolio by Industry Industry1, 2 ($ in millions) Balance Q3 2026 Change from Q2 2026 Average Loan Size Finance and Insurance $864.2 5.4% $4.9 Information (Technology, Media and Telecommunications) 357.0 0.3% 4.6 Manufacturing 341.0 (1.5)% 2.0 Construction 283.7 24.6% 1.1 Healthcare 273.5 (4.6)% 0.5 Professional, Scientific, and Technical Services 232.8 (2.4)% 1.3 Other Services3 213.2 (7.4)% 1.0 Wholesale Trade 211.8 (0.2)% 2.6 Real Estate and Rental and Leasing 195.9 1.2% 2.1 Transportation and Warehousing 180.1 9.4% 2.2 Mining, Quarrying, and Oil and Gas Extraction 157.6 41.9% 5.4 Retail Trade 126.9 (0.5)% 1.5 Utilities 79.3 (15.9)% 19.8 Arts, Entertainment, and Recreation 48.9 (9.1)% 2.0 Other 97.9 (57.2)% 9.7 $3,664 24% 10% 9% 8% 7% 6% 6% 6% 5% 5% 4% 3% 2% 1% 3% % of Total C&I Loans *Amounts may not total due to rounding. 1These segments are based on two-digit NAICS industry divisions. 2 Loans to nondepository financial institutions are included within C&I and comprise less than 7% of loans. 96% pass graded. 3 Includes Administrative and Support, Waste Management and Remediation Services, and Public Administration.
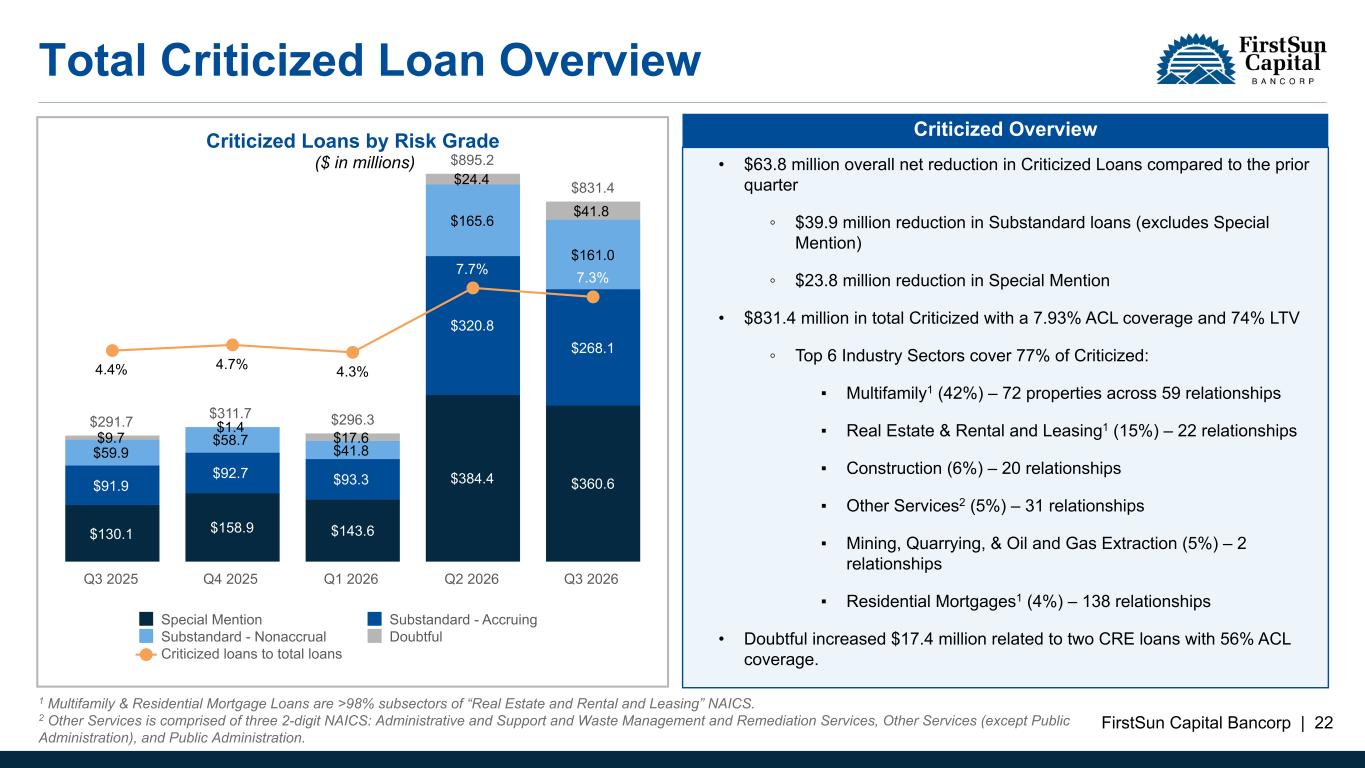
FirstSun Capital Bancorp | 22 Total Criticized Loan Overview * Amounts may not total due to rounding. 1 These segments are based on two-digit NAICS industry divisions. 2 Multifamily Real Estate is a component of Real Estate and Rental and Leasing within the two-digit NAICS industry divisions. Criticized Loans by Risk Grade $291.7 $311.7 $296.3 $895.2 $831.4 $130.1 $158.9 $143.6 $384.4 $360.6$91.9 $92.7 $93.3 $320.8 $268.1 $59.9 $58.7 $41.8 $165.6 $161.0 $9.7 $1.4 $17.6 $24.4 $41.8 4.4% 4.7% 4.3% 7.7% 7.3% Special Mention Substandard - Accruing Substandard - Nonaccrual Doubtful Criticized loans to total loans Q3 2025 Q4 2025 Q1 2026 Q2 2026 Q3 2026 Criticized Loans by Industry $350.9 $123.2 $43.9 $21.3 $41.7 $36.4 $24.7 $30.5 $28.9 $50.6 $20.7 $16.1 $0.6 $42.0 $364.0 $127.5 $57.6 $42.3 $41.8 $35.4 $30.8 $30.8 $28.2 $27.3 $24.0 $18.3 $1.9 $65.5 Q3 2026 Q2 2026 Multifamily Real Estate Real Estate and Rental and Leasing Other Services Transportation and Warehousing Mining, Quarrying, and Oil and Gas Extraction Residential Mortgage Information (Technology, Media and Telecommunications) Professional, Scientific, and Technical Services Manufacturing Construction Healthcare Finance and Insurance Education Services Other 1 ($ in millions) ($ in millions) 2 Q3 2026 Criticized Rollforward ($ in millions) Loan Activity ACL Coverage Q2 2026 Ending Balance $ 895.2 7.70 % Upgrades, net1 (267.0) 7.17 % Downgrades 203.3 7.94 % Q3 2026 Ending Balance $ 831.4 7.93 % QoQ Change $ (63.8) 0.23 % • $63.8 million overall net reduction in Criticized Loans compared to the prior quarter ◦ $39.9 million reduction in Substandard loans (excludes Special Mention) ◦ $23.8 million reduction in Special Mention • $831.4 million in total Criticized with a 7.93% ACL coverage and 74% LTV ◦ Top 6 Industry Sectors cover 77% of Criticized: ▪ Multifamily1 (42%) – 72 properties across 59 relationships ▪ Real Estate & Rental and Leasing1 (15%) – 22 relationships ▪ Construction (6%) – 20 relationships ▪ Other Services2 (5%) – 31 relationships ▪ Mining, Quarrying, & Oil and Gas Extraction (5%) – 2 relationships ▪ Residential Mortgages1 (4%) – 138 relationships • Doubtful increased $17.4 million related to two CRE loans with 56% ACL coverage. Criticized Overview 1 Multifamily & Residential Mortgage Loans are >98% subsectors of “Real Estate and Rental and Leasing” NAICS. 2 Other Services is comprised of three 2-digit NAICS: Administrative and Support and Waste Management and Remediation Services, Other Services (except Public Administration), and Public Administration. Nonperforming Loan Coverage Ratio 12.0% 9.0% 12.8% 9.5% 12.4% Nonperforming Loan ACL to Nonperforming Loans Q3 2025 Q4 2025 Q1 2026 Q2 2026 Q3 2026 8.0% 10.0% 12.0% 14.0%
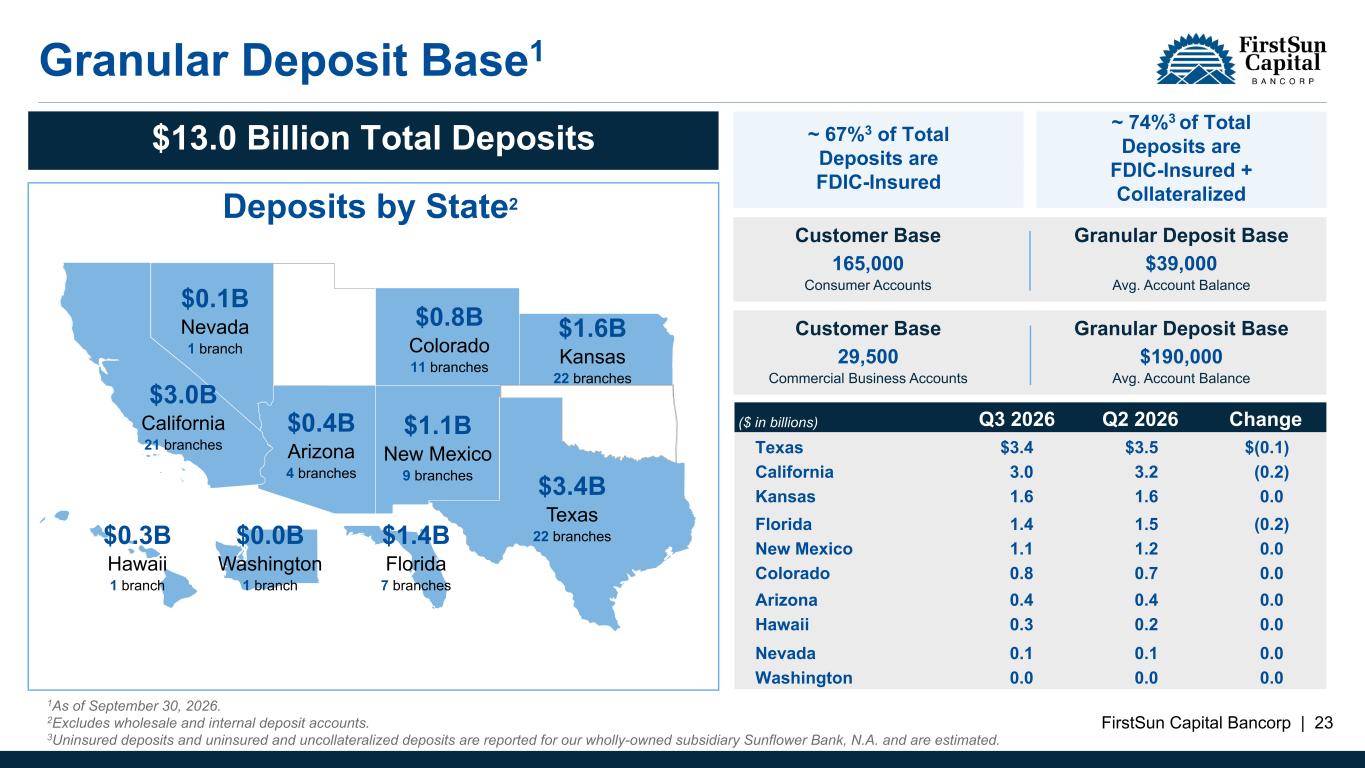
FirstSun Capital Bancorp | 23 ~ 67%3 of Total Deposits are FDIC-Insured Granular Deposit Base1 Customer Base 165,000 Consumer Accounts Granular Deposit Base $39,000 Avg. Account Balance Customer Base 29,500 Commercial Business Accounts Granular Deposit Base $190,000 Avg. Account Balance $13.0 Billion Total Deposits Deposits by State2 $3.4B Texas 22 branches $1.6B Kansas 22 branches $1.1B New Mexico 9 branches $0.8B Colorado 11 branches $0.4B Arizona 4 branches ~ 74%3 of Total Deposits are FDIC-Insured + Collateralized 1As of September 30, 2026. 2Excludes wholesale and internal deposit accounts. 3Uninsured deposits and uninsured and uncollateralized deposits are reported for our wholly-owned subsidiary Sunflower Bank, N.A. and are estimated. $3.0B California 21 branches $0.0B Washington 1 branch $1.4B Florida 7 branches $0.3B Hawaii 1 branch $0.1B Nevada 1 branch ($ in billions) Q3 2026 Q2 2026 Change Texas $3.4 $3.5 $(0.1) California 3.0 3.2 (0.2) Kansas 1.6 1.6 0.0 Florida 1.4 1.5 (0.2) New Mexico 1.1 1.2 0.0 Colorado 0.8 0.7 0.0 Arizona 0.4 0.4 0.0 Hawaii 0.3 0.2 0.0 Nevada 0.1 0.1 0.0 Washington 0.0 0.0 0.0
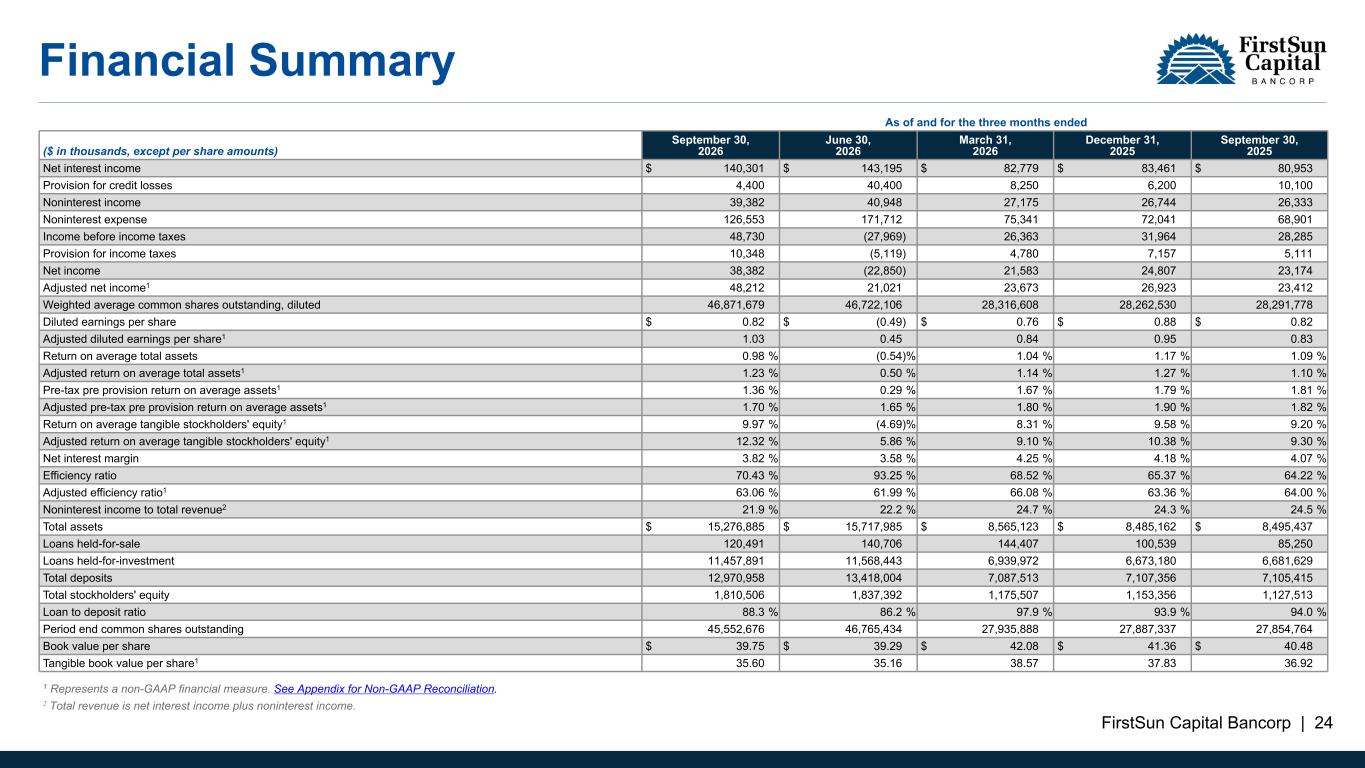
FirstSun Capital Bancorp | 24 Financial Summary As of and for the three months ended ($ in thousands, except per share amounts) September 30, 2026 June 30, 2026 March 31, 2026 December 31, 2025 September 30, 2025 Net interest income $ 140,301 $ 143,195 $ 82,779 $ 83,461 $ 80,953 Provision for credit losses 4,400 40,400 8,250 6,200 10,100 Noninterest income 39,382 40,948 27,175 26,744 26,333 Noninterest expense 126,553 171,712 75,341 72,041 68,901 Income before income taxes 48,730 (27,969) 26,363 31,964 28,285 Provision for income taxes 10,348 (5,119) 4,780 7,157 5,111 Net income 38,382 (22,850) 21,583 24,807 23,174 Adjusted net income1 48,212 21,021 23,673 26,923 23,412 Weighted average common shares outstanding, diluted 46,871,679 46,722,106 28,316,608 28,262,530 28,291,778 Diluted earnings per share $ 0.82 $ (0.49) $ 0.76 $ 0.88 $ 0.82 Adjusted diluted earnings per share1 1.03 0.45 0.84 0.95 0.83 Return on average total assets 0.98 % (0.54) % 1.04 % 1.17 % 1.09 % Adjusted return on average total assets1 1.23 % 0.50 % 1.14 % 1.27 % 1.10 % Pre-tax pre provision return on average assets1 1.36 % 0.29 % 1.67 % 1.79 % 1.81 % Adjusted pre-tax pre provision return on average assets1 1.70 % 1.65 % 1.80 % 1.90 % 1.82 % Return on average tangible stockholders' equity1 9.97 % (4.69) % 8.31 % 9.58 % 9.20 % Adjusted return on average tangible stockholders' equity1 12.32 % 5.86 % 9.10 % 10.38 % 9.30 % Net interest margin 3.82 % 3.58 % 4.25 % 4.18 % 4.07 % Efficiency ratio 70.43 % 93.25 % 68.52 % 65.37 % 64.22 % Adjusted efficiency ratio1 63.06 % 61.99 % 66.08 % 63.36 % 64.00 % Noninterest income to total revenue2 21.9 % 22.2 % 24.7 % 24.3 % 24.5 % Total assets $ 15,276,885 $ 15,717,985 $ 8,565,123 $ 8,485,162 $ 8,495,437 Loans held-for-sale 120,491 140,706 144,407 100,539 85,250 Loans held-for-investment 11,457,891 11,568,443 6,939,972 6,673,180 6,681,629 Total deposits 12,970,958 13,418,004 7,087,513 7,107,356 7,105,415 Total stockholders' equity 1,810,506 1,837,392 1,175,507 1,153,356 1,127,513 Loan to deposit ratio 88.3 % 86.2 % 97.9 % 93.9 % 94.0 % Period end common shares outstanding 45,552,676 46,765,434 27,935,888 27,887,337 27,854,764 Book value per share $ 39.75 $ 39.29 $ 42.08 $ 41.36 $ 40.48 Tangible book value per share1 35.60 35.16 38.57 37.83 36.92 1 Represents a non-GAAP financial measure. See Appendix for Non-GAAP Reconciliation. 2 Total revenue is net interest income plus noninterest income.
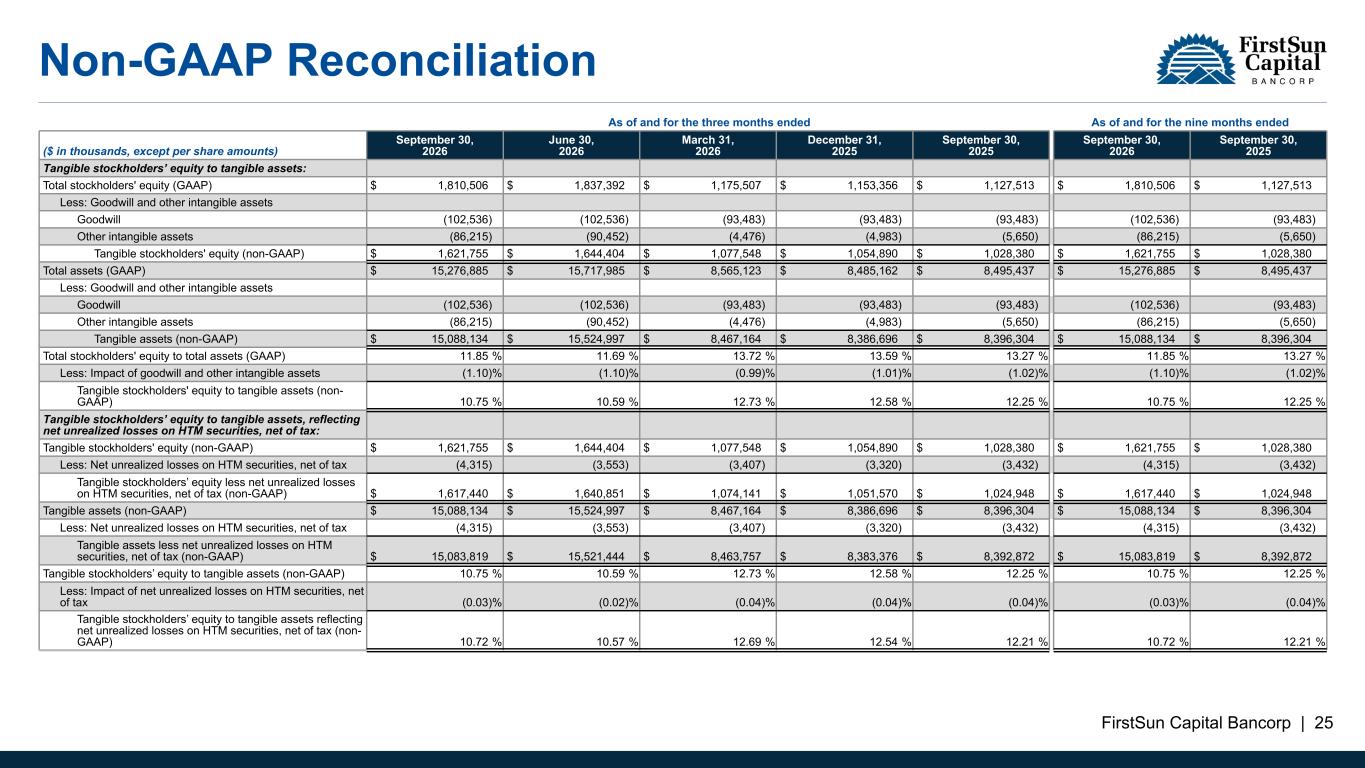
FirstSun Capital Bancorp | 25 Non-GAAP Reconciliation As of and for the three months ended As of and for the nine months ended ($ in thousands, except per share amounts) September 30, 2026 June 30, 2026 March 31, 2026 December 31, 2025 September 30, 2025 September 30, 2026 September 30, 2025 Tangible stockholders’ equity to tangible assets: Total stockholders' equity (GAAP) $ 1,810,506 $ 1,837,392 $ 1,175,507 $ 1,153,356 $ 1,127,513 $ 1,810,506 $ 1,127,513 Less: Goodwill and other intangible assets Goodwill (102,536) (102,536) (93,483) (93,483) (93,483) (102,536) (93,483) Other intangible assets (86,215) (90,452) (4,476) (4,983) (5,650) (86,215) (5,650) Tangible stockholders' equity (non-GAAP) $ 1,621,755 $ 1,644,404 $ 1,077,548 $ 1,054,890 $ 1,028,380 $ 1,621,755 $ 1,028,380 Total assets (GAAP) $ 15,276,885 $ 15,717,985 $ 8,565,123 $ 8,485,162 $ 8,495,437 $ 15,276,885 $ 8,495,437 Less: Goodwill and other intangible assets Goodwill (102,536) (102,536) (93,483) (93,483) (93,483) (102,536) (93,483) Other intangible assets (86,215) (90,452) (4,476) (4,983) (5,650) (86,215) (5,650) Tangible assets (non-GAAP) $ 15,088,134 $ 15,524,997 $ 8,467,164 $ 8,386,696 $ 8,396,304 $ 15,088,134 $ 8,396,304 Total stockholders' equity to total assets (GAAP) 11.85 % 11.69 % 13.72 % 13.59 % 13.27 % 11.85 % 13.27 % Less: Impact of goodwill and other intangible assets (1.10) % (1.10) % (0.99) % (1.01) % (1.02) % (1.10) % (1.02) % Tangible stockholders' equity to tangible assets (non- GAAP) 10.75 % 10.59 % 12.73 % 12.58 % 12.25 % 10.75 % 12.25 % Tangible stockholders’ equity to tangible assets, reflecting net unrealized losses on HTM securities, net of tax: Tangible stockholders' equity (non-GAAP) $ 1,621,755 $ 1,644,404 $ 1,077,548 $ 1,054,890 $ 1,028,380 $ 1,621,755 $ 1,028,380 Less: Net unrealized losses on HTM securities, net of tax (4,315) (3,553) (3,407) (3,320) (3,432) (4,315) (3,432) Tangible stockholders’ equity less net unrealized losses on HTM securities, net of tax (non-GAAP) $ 1,617,440 $ 1,640,851 $ 1,074,141 $ 1,051,570 $ 1,024,948 $ 1,617,440 $ 1,024,948 Tangible assets (non-GAAP) $ 15,088,134 $ 15,524,997 $ 8,467,164 $ 8,386,696 $ 8,396,304 $ 15,088,134 $ 8,396,304 Less: Net unrealized losses on HTM securities, net of tax (4,315) (3,553) (3,407) (3,320) (3,432) (4,315) (3,432) Tangible assets less net unrealized losses on HTM securities, net of tax (non-GAAP) $ 15,083,819 $ 15,521,444 $ 8,463,757 $ 8,383,376 $ 8,392,872 $ 15,083,819 $ 8,392,872 Tangible stockholders’ equity to tangible assets (non-GAAP) 10.75 % 10.59 % 12.73 % 12.58 % 12.25 % 10.75 % 12.25 % Less: Impact of net unrealized losses on HTM securities, net of tax (0.03) % (0.02) % (0.04) % (0.04) % (0.04) % (0.03) % (0.04) % Tangible stockholders’ equity to tangible assets reflecting net unrealized losses on HTM securities, net of tax (non- GAAP) 10.72 % 10.57 % 12.69 % 12.54 % 12.21 % 10.72 % 12.21 %
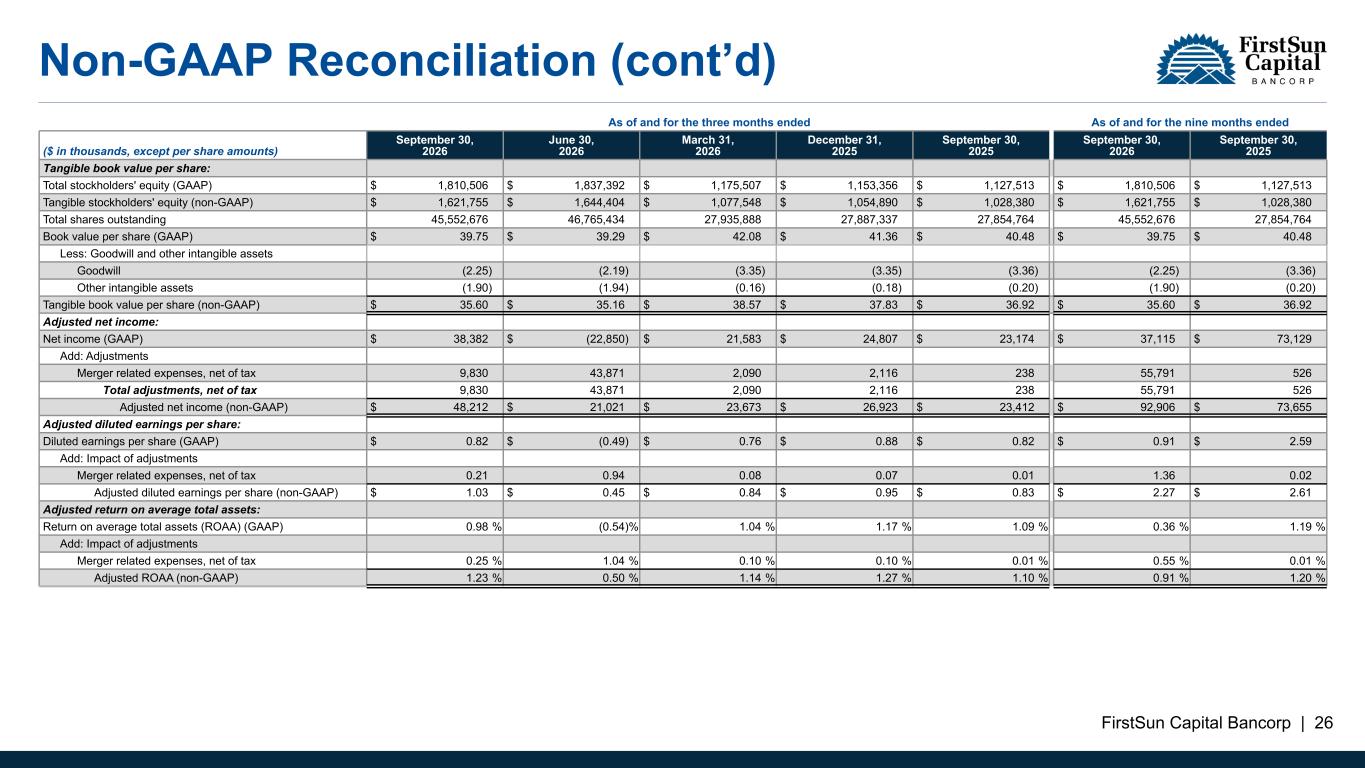
FirstSun Capital Bancorp | 26 Non-GAAP Reconciliation (cont’d) As of and for the three months ended As of and for the nine months ended ($ in thousands, except per share amounts) September 30, 2026 June 30, 2026 March 31, 2026 December 31, 2025 September 30, 2025 September 30, 2026 September 30, 2025 Tangible book value per share: Total stockholders' equity (GAAP) $ 1,810,506 $ 1,837,392 $ 1,175,507 $ 1,153,356 $ 1,127,513 $ 1,810,506 $ 1,127,513 Tangible stockholders' equity (non-GAAP) $ 1,621,755 $ 1,644,404 $ 1,077,548 $ 1,054,890 $ 1,028,380 $ 1,621,755 $ 1,028,380 Total shares outstanding 45,552,676 46,765,434 27,935,888 27,887,337 27,854,764 45,552,676 27,854,764 Book value per share (GAAP) $ 39.75 $ 39.29 $ 42.08 $ 41.36 $ 40.48 $ 39.75 $ 40.48 Less: Goodwill and other intangible assets Goodwill (2.25) (2.19) (3.35) (3.35) (3.36) (2.25) (3.36) Other intangible assets (1.90) (1.94) (0.16) (0.18) (0.20) (1.90) (0.20) Tangible book value per share (non-GAAP) $ 35.60 $ 35.16 $ 38.57 $ 37.83 $ 36.92 $ 35.60 $ 36.92 Adjusted net income: Net income (GAAP) $ 38,382 $ (22,850) $ 21,583 $ 24,807 $ 23,174 $ 37,115 $ 73,129 Add: Adjustments Merger related expenses, net of tax 9,830 43,871 2,090 2,116 238 55,791 526 Total adjustments, net of tax 9,830 43,871 2,090 2,116 238 55,791 526 Adjusted net income (non-GAAP) $ 48,212 $ 21,021 $ 23,673 $ 26,923 $ 23,412 $ 92,906 $ 73,655 Adjusted diluted earnings per share: Diluted earnings per share (GAAP) $ 0.82 $ (0.49) $ 0.76 $ 0.88 $ 0.82 $ 0.91 $ 2.59 Add: Impact of adjustments Merger related expenses, net of tax 0.21 0.94 0.08 0.07 0.01 1.36 0.02 Adjusted diluted earnings per share (non-GAAP) $ 1.03 $ 0.45 $ 0.84 $ 0.95 $ 0.83 $ 2.27 $ 2.61 Adjusted return on average total assets: Return on average total assets (ROAA) (GAAP) 0.98 % (0.54) % 1.04 % 1.17 % 1.09 % 0.36 % 1.19 % Add: Impact of adjustments Merger related expenses, net of tax 0.25 % 1.04 % 0.10 % 0.10 % 0.01 % 0.55 % 0.01 % Adjusted ROAA (non-GAAP) 1.23 % 0.50 % 1.14 % 1.27 % 1.10 % 0.91 % 1.20 %
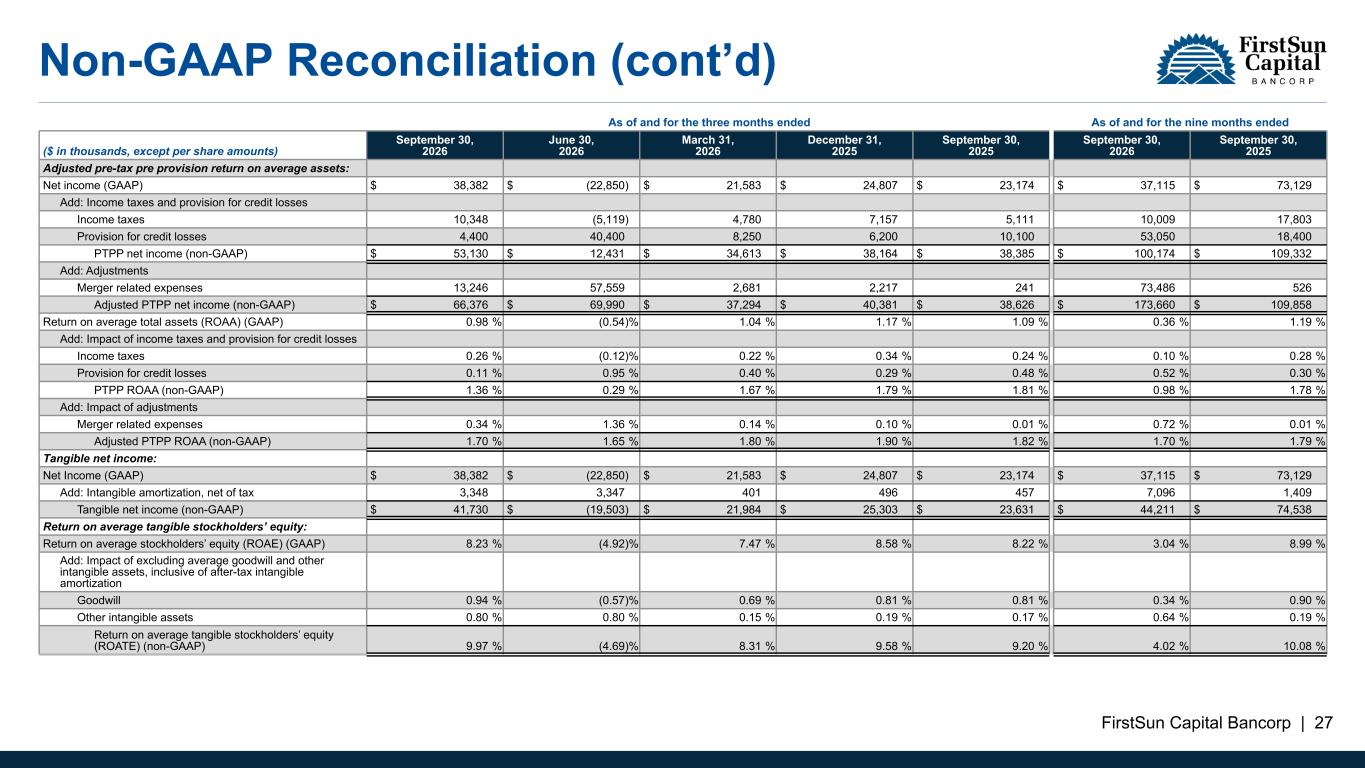
FirstSun Capital Bancorp | 27 Non-GAAP Reconciliation (cont’d) As of and for the three months ended As of and for the nine months ended ($ in thousands, except per share amounts) September 30, 2026 June 30, 2026 March 31, 2026 December 31, 2025 September 30, 2025 September 30, 2026 September 30, 2025 Adjusted pre-tax pre provision return on average assets: Net income (GAAP) $ 38,382 $ (22,850) $ 21,583 $ 24,807 $ 23,174 $ 37,115 $ 73,129 Add: Income taxes and provision for credit losses Income taxes 10,348 (5,119) 4,780 7,157 5,111 10,009 17,803 Provision for credit losses 4,400 40,400 8,250 6,200 10,100 53,050 18,400 PTPP net income (non-GAAP) $ 53,130 $ 12,431 $ 34,613 $ 38,164 $ 38,385 $ 100,174 $ 109,332 Add: Adjustments Merger related expenses 13,246 57,559 2,681 2,217 241 73,486 526 Adjusted PTPP net income (non-GAAP) $ 66,376 $ 69,990 $ 37,294 $ 40,381 $ 38,626 $ 173,660 $ 109,858 Return on average total assets (ROAA) (GAAP) 0.98 % (0.54) % 1.04 % 1.17 % 1.09 % 0.36 % 1.19 % Add: Impact of income taxes and provision for credit losses Income taxes 0.26 % (0.12) % 0.22 % 0.34 % 0.24 % 0.10 % 0.28 % Provision for credit losses 0.11 % 0.95 % 0.40 % 0.29 % 0.48 % 0.52 % 0.30 % PTPP ROAA (non-GAAP) 1.36 % 0.29 % 1.67 % 1.79 % 1.81 % 0.98 % 1.78 % Add: Impact of adjustments Merger related expenses 0.34 % 1.36 % 0.14 % 0.10 % 0.01 % 0.72 % 0.01 % Adjusted PTPP ROAA (non-GAAP) 1.70 % 1.65 % 1.80 % 1.90 % 1.82 % 1.70 % 1.79 % Tangible net income: Net Income (GAAP) $ 38,382 $ (22,850) $ 21,583 $ 24,807 $ 23,174 $ 37,115 $ 73,129 Add: Intangible amortization, net of tax 3,348 3,347 401 496 457 7,096 1,409 Tangible net income (non-GAAP) $ 41,730 $ (19,503) $ 21,984 $ 25,303 $ 23,631 $ 44,211 $ 74,538 Return on average tangible stockholders’ equity: Return on average stockholders’ equity (ROAE) (GAAP) 8.23 % (4.92) % 7.47 % 8.58 % 8.22 % 3.04 % 8.99 % Add: Impact of excluding average goodwill and other intangible assets, inclusive of after-tax intangible amortization Goodwill 0.94 % (0.57) % 0.69 % 0.81 % 0.81 % 0.34 % 0.90 % Other intangible assets 0.80 % 0.80 % 0.15 % 0.19 % 0.17 % 0.64 % 0.19 % Return on average tangible stockholders’ equity (ROATE) (non-GAAP) 9.97 % (4.69) % 8.31 % 9.58 % 9.20 % 4.02 % 10.08 %
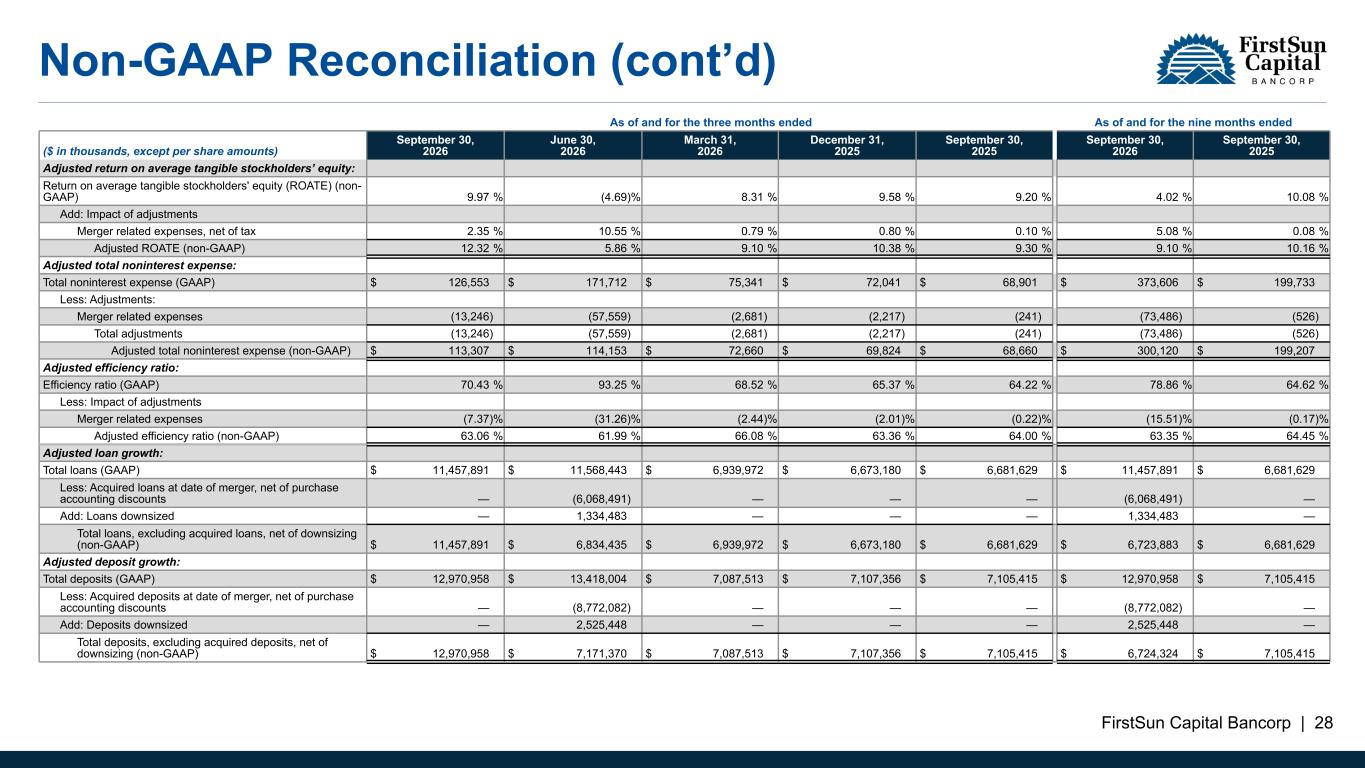
FirstSun Capital Bancorp | 28 Non-GAAP Reconciliation (cont’d) As of and for the three months ended As of and for the nine months ended ($ in thousands, except per share amounts) September 30, 2026 June 30, 2026 March 31, 2026 December 31, 2025 September 30, 2025 September 30, 2026 September 30, 2025 Adjusted return on average tangible stockholders’ equity: Return on average tangible stockholders' equity (ROATE) (non- GAAP) 9.97 % (4.69) % 8.31 % 9.58 % 9.20 % 4.02 % 10.08 % Add: Impact of adjustments Merger related expenses, net of tax 2.35 % 10.55 % 0.79 % 0.80 % 0.10 % 5.08 % 0.08 % Adjusted ROATE (non-GAAP) 12.32 % 5.86 % 9.10 % 10.38 % 9.30 % 9.10 % 10.16 % Adjusted total noninterest expense: Total noninterest expense (GAAP) $ 126,553 $ 171,712 $ 75,341 $ 72,041 $ 68,901 $ 373,606 $ 199,733 Less: Adjustments: Merger related expenses (13,246) (57,559) (2,681) (2,217) (241) (73,486) (526) Total adjustments (13,246) (57,559) (2,681) (2,217) (241) (73,486) (526) Adjusted total noninterest expense (non-GAAP) $ 113,307 $ 114,153 $ 72,660 $ 69,824 $ 68,660 $ 300,120 $ 199,207 Adjusted efficiency ratio: Efficiency ratio (GAAP) 70.43 % 93.25 % 68.52 % 65.37 % 64.22 % 78.86 % 64.62 % Less: Impact of adjustments Merger related expenses (7.37) % (31.26) % (2.44) % (2.01) % (0.22) % (15.51) % (0.17) % Adjusted efficiency ratio (non-GAAP) 63.06 % 61.99 % 66.08 % 63.36 % 64.00 % 63.35 % 64.45 % Adjusted loan growth: Total loans (GAAP) $ 11,457,891 $ 11,568,443 $ 6,939,972 $ 6,673,180 $ 6,681,629 $ 11,457,891 $ 6,681,629 Less: Acquired loans at date of merger, net of purchase accounting discounts — (6,068,491) — — — (6,068,491) — Add: Loans downsized — 1,334,483 — — — 1,334,483 — Total loans, excluding acquired loans, net of downsizing (non-GAAP) $ 11,457,891 $ 6,834,435 $ 6,939,972 $ 6,673,180 $ 6,681,629 $ 6,723,883 $ 6,681,629 Adjusted deposit growth: Total deposits (GAAP) $ 12,970,958 $ 13,418,004 $ 7,087,513 $ 7,107,356 $ 7,105,415 $ 12,970,958 $ 7,105,415 Less: Acquired deposits at date of merger, net of purchase accounting discounts — (8,772,082) — — — (8,772,082) — Add: Deposits downsized — 2,525,448 — — — 2,525,448 — Total deposits, excluding acquired deposits, net of downsizing (non-GAAP) $ 12,970,958 $ 7,171,370 $ 7,087,513 $ 7,107,356 $ 7,105,415 $ 6,724,324 $ 7,105,415
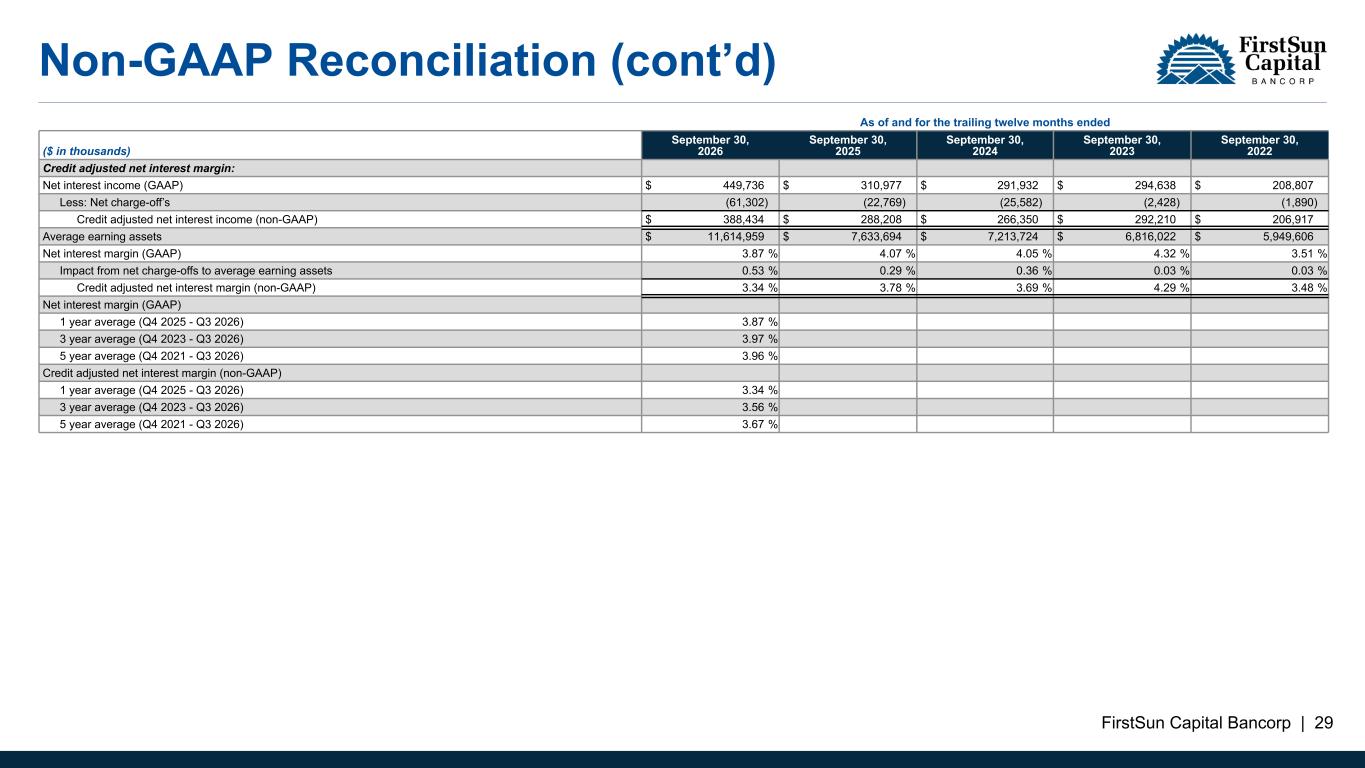
FirstSun Capital Bancorp | 29 Non-GAAP Reconciliation (cont’d) As of and for the trailing twelve months ended ($ in thousands) September 30, 2026 September 30, 2025 September 30, 2024 September 30, 2023 September 30, 2022 Credit adjusted net interest margin: Net interest income (GAAP) $ 449,736 $ 310,977 $ 291,932 $ 294,638 $ 208,807 Less: Net charge-off’s (61,302) (22,769) (25,582) (2,428) (1,890) Credit adjusted net interest income (non-GAAP) $ 388,434 $ 288,208 $ 266,350 $ 292,210 $ 206,917 Average earning assets $ 11,614,959 $ 7,633,694 $ 7,213,724 $ 6,816,022 $ 5,949,606 Net interest margin (GAAP) 3.87 % 4.07 % 4.05 % 4.32 % 3.51 % Impact from net charge-offs to average earning assets 0.53 % 0.29 % 0.36 % 0.03 % 0.03 % Credit adjusted net interest margin (non-GAAP) 3.34 % 3.78 % 3.69 % 4.29 % 3.48 % Net interest margin (GAAP) 1 year average (Q4 2025 - Q3 2026) 3.87 % 3 year average (Q4 2023 - Q3 2026) 3.97 % 5 year average (Q4 2021 - Q3 2026) 3.96 % Credit adjusted net interest margin (non-GAAP) 1 year average (Q4 2025 - Q3 2026) 3.34 % 3 year average (Q4 2023 - Q3 2026) 3.56 % 5 year average (Q4 2021 - Q3 2026) 3.67 %