Lakeland Financial Corporation A Proven History of Shareholder Value Creation And Commitment to Our Communities 3rd Quarter 2026 LKFN L I S T E D
2 David M. Findlay Chairman & Chief Executive Officer david.findlay@lakecitybank.com (574) 267-9197 Kristin L. Pruitt President kristin.pruitt@lakecitybank.com (574) 371-9220 Lisa M. O’Neill Executive Vice President & Chief Financial Officer lisa.oneill@lakecitybank.com (574) 267-9125
3 Forward-Looking Information This presentation contains, and future oral and written statements of the company and its management may contain, forward-looking statements within the meaning of the Private Securities Litigation Reform Act of 1995 with respect to the financial condition, results of operations, plans, objectives, future performance and business of the company. Forward-looking statements, which may be based upon beliefs, expectations and assumptions of the company’s management and on information currently available to management, are generally identifiable by the use of words such as “believe,” “expect,” “anticipate,” “continue,” “plan,” “intend,” “estimate,” “may,” “will,” “would,” “could,” “should” or other similar expressions. The company’s ability to predict results or the actual effect of future plans or strategies is inherently uncertain and, accordingly, the reader is cautioned not to place undue reliance on any forward-looking statements made by the company. Additionally, all statements in this presentation, including forward-looking statements, speak only as of the date they are made, and the company undertakes no obligation to update any statement in light of new information or future events. Numerous factors could cause the company’s actual results to differ from those reflected in forward-looking statements, including the effects of economic, business and market conditions and changes, particularly in our Indiana market area, including prevailing interest rates and the rate of inflation; governmental trade, monetary and fiscal policies; the risks of changes in interest rates on the levels, composition and costs of deposits, loan demand and the values and liquidity of loan collateral, securities and other interest sensitive assets and liabilities; changes in borrowers’ credit risks and payment behaviors; and developments in technology, as well as those identified in the company’s filings with the Securities and Exchange Commission, including the company’s Annual Report on Form 10-K and Quarterly Reports on Form 10-Q.
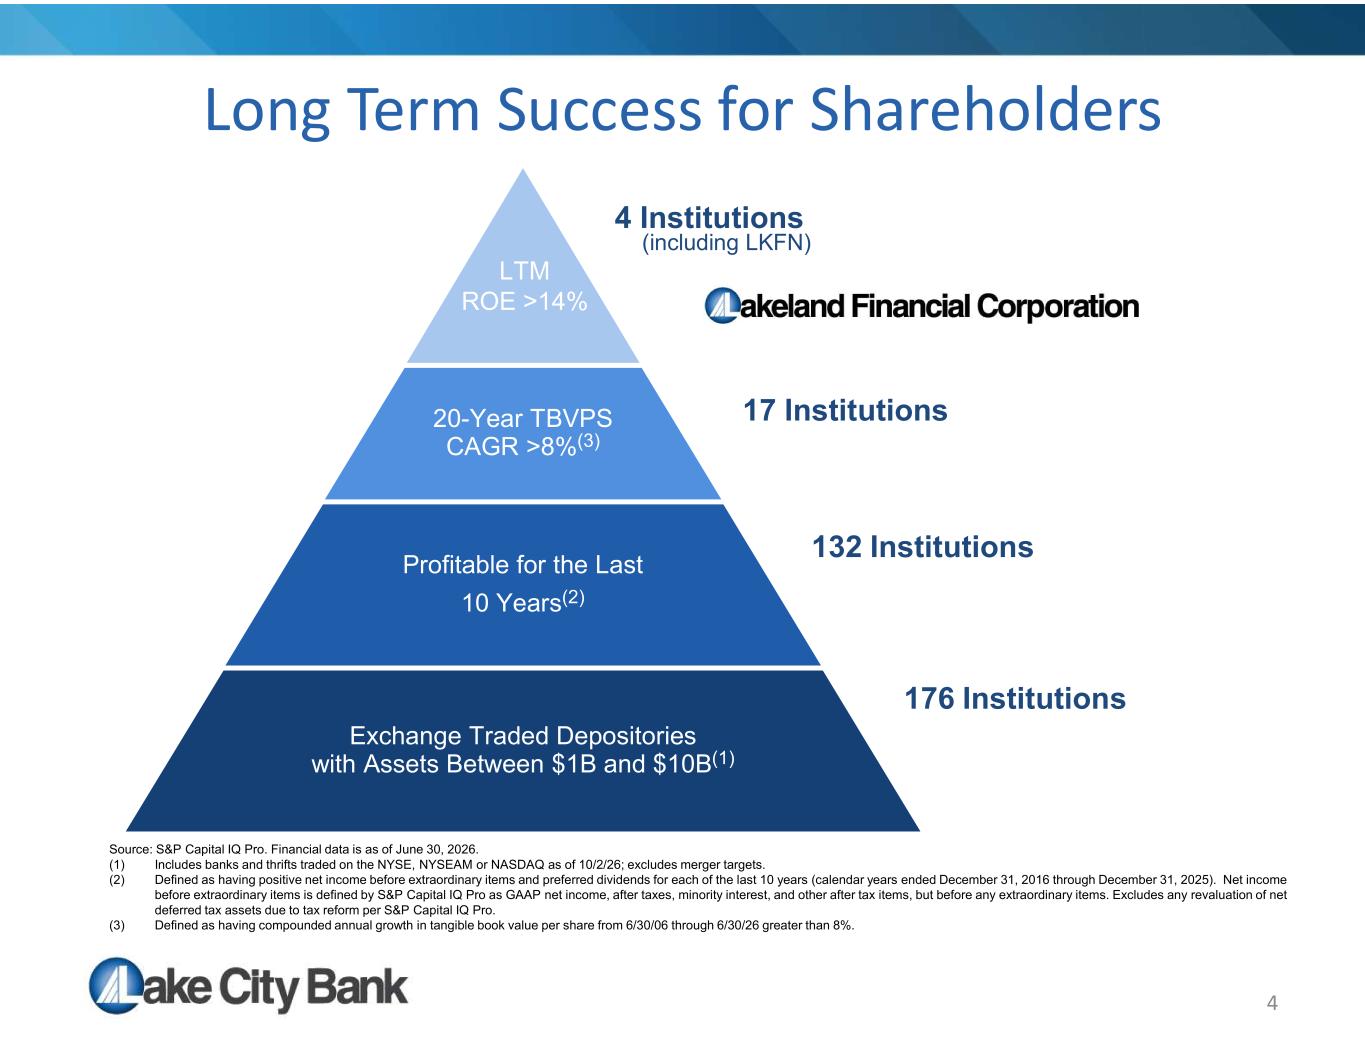
4 Long Term Success for Shareholders LTM ROE >13% Source: S&P Capital IQ Pro. Financial data is as of June 30, 2026. (1) Includes banks and thrifts traded on the NYSE, NYSEAM or NASDAQ as of 10/2/26; excludes merger targets. (2) Defined as having positive net income before extraordinary items and preferred dividends for each of the last 10 years (calendar years ended December 31, 2016 through December 31, 2025). Net income before extraordinary items is defined by S&P Capital IQ Pro as GAAP net income, after taxes, minority interest, and other after tax items, but before any extraordinary items. Excludes any revaluation of net deferred tax assets due to tax reform per S&P Capital IQ Pro. (3) Defined as having compounded annual growth in tangible book value per share from 6/30/06 through 6/30/26 greater than 8%. 20-Year TBVPS CAGR >8%(3) Profitable for the Last 10 Years(2) Exchange Traded Depositories with Assets Between $1B and $10B(1) 4 Institutions 17 Institutions 132 Institutions 176 Institutions (including LKFN) LTM ROE >14%
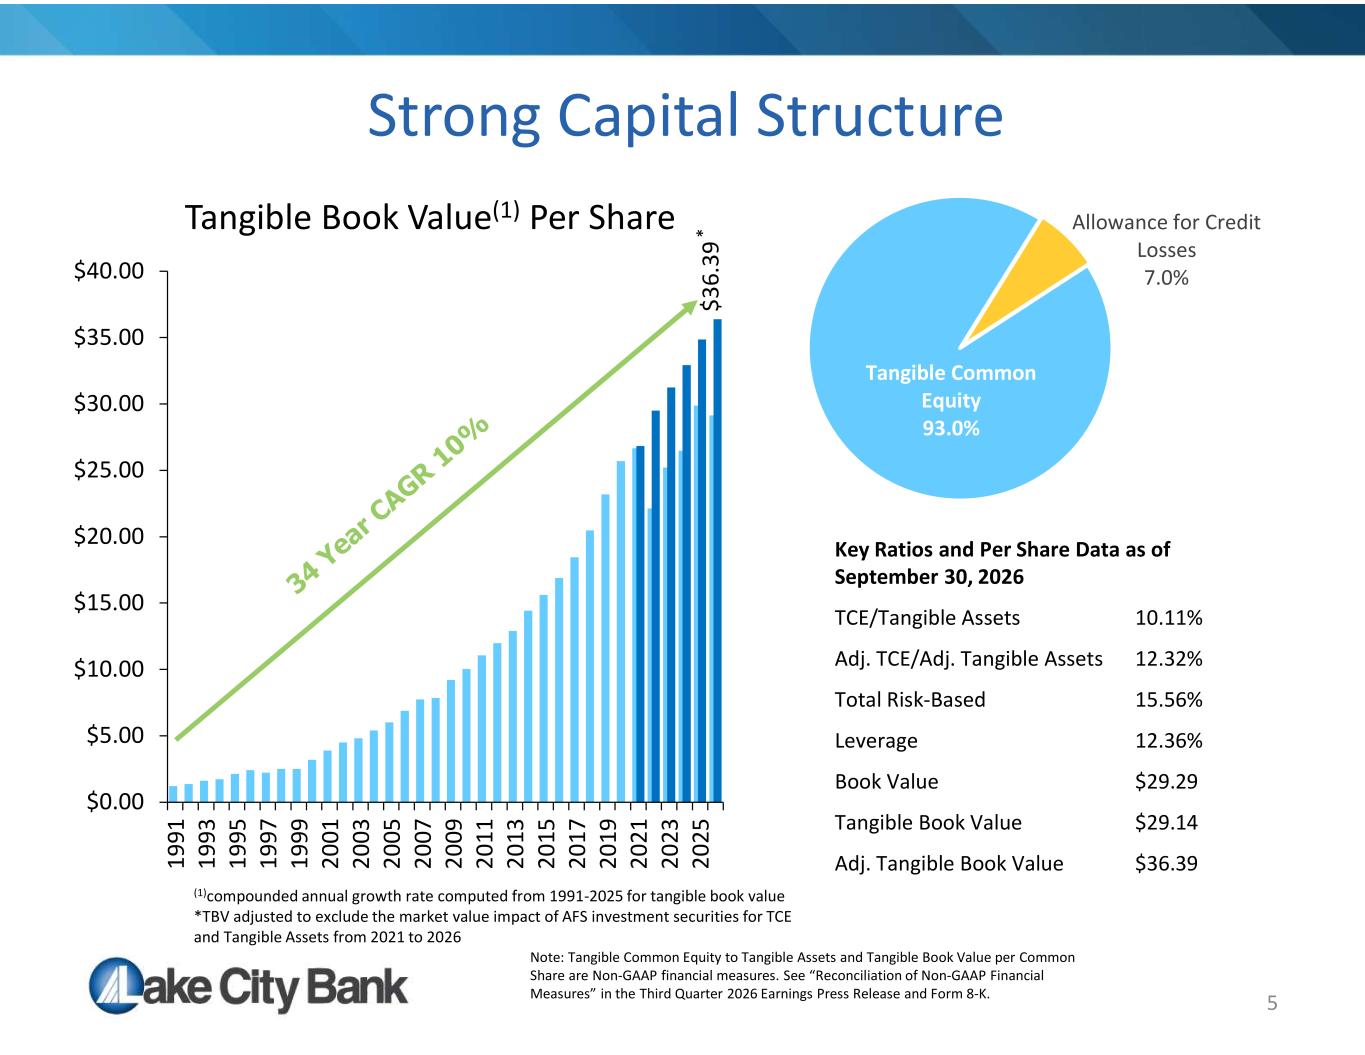
Tangible Common Equity 93.0% Allowance for Credit Losses 7.0% $3 6. 39 $0.00 $5.00 $10.00 $15.00 $20.00 $25.00 $30.00 $35.00 $40.00 19 91 19 93 19 95 19 97 19 99 20 01 20 03 20 05 20 07 20 09 20 11 20 13 20 15 20 17 20 19 20 21 20 23 20 25 Tangible Book Value(1) Per Share 5 Strong Capital Structure Key Ratios and Per Share Data as of September 30, 2026 10.11%TCE/Tangible Assets 12.32%Adj. TCE/Adj. Tangible Assets 15.56%Total Risk-Based 12.36%Leverage $29.29Book Value $29.14Tangible Book Value $36.39Adj. Tangible Book Value Note: Tangible Common Equity to Tangible Assets and Tangible Book Value per Common Share are Non-GAAP financial measures. See “Reconciliation of Non-GAAP Financial Measures” in the Third Quarter 2026 Earnings Press Release and Form 8-K. (1)compounded annual growth rate computed from 1991-2025 for tangible book value *TBV adjusted to exclude the market value impact of AFS investment securities for TCE and Tangible Assets from 2021 to 2026 *
6 Lake City Bank Today • An entrepreneurial 154-year-old de novo bank • A long-term and consistent organic growth story • Headquartered in Warsaw, Indiana • 55 branch offices - $7.2 billion banking assets • $3.7 billion in Wealth Advisory assets • A forward-thinking technology adopter • Focused on execution – “blocking and tackling” • A demonstrated history of identifying growth opportunities • Located in a pro-business state with economic expansion occurring statewide
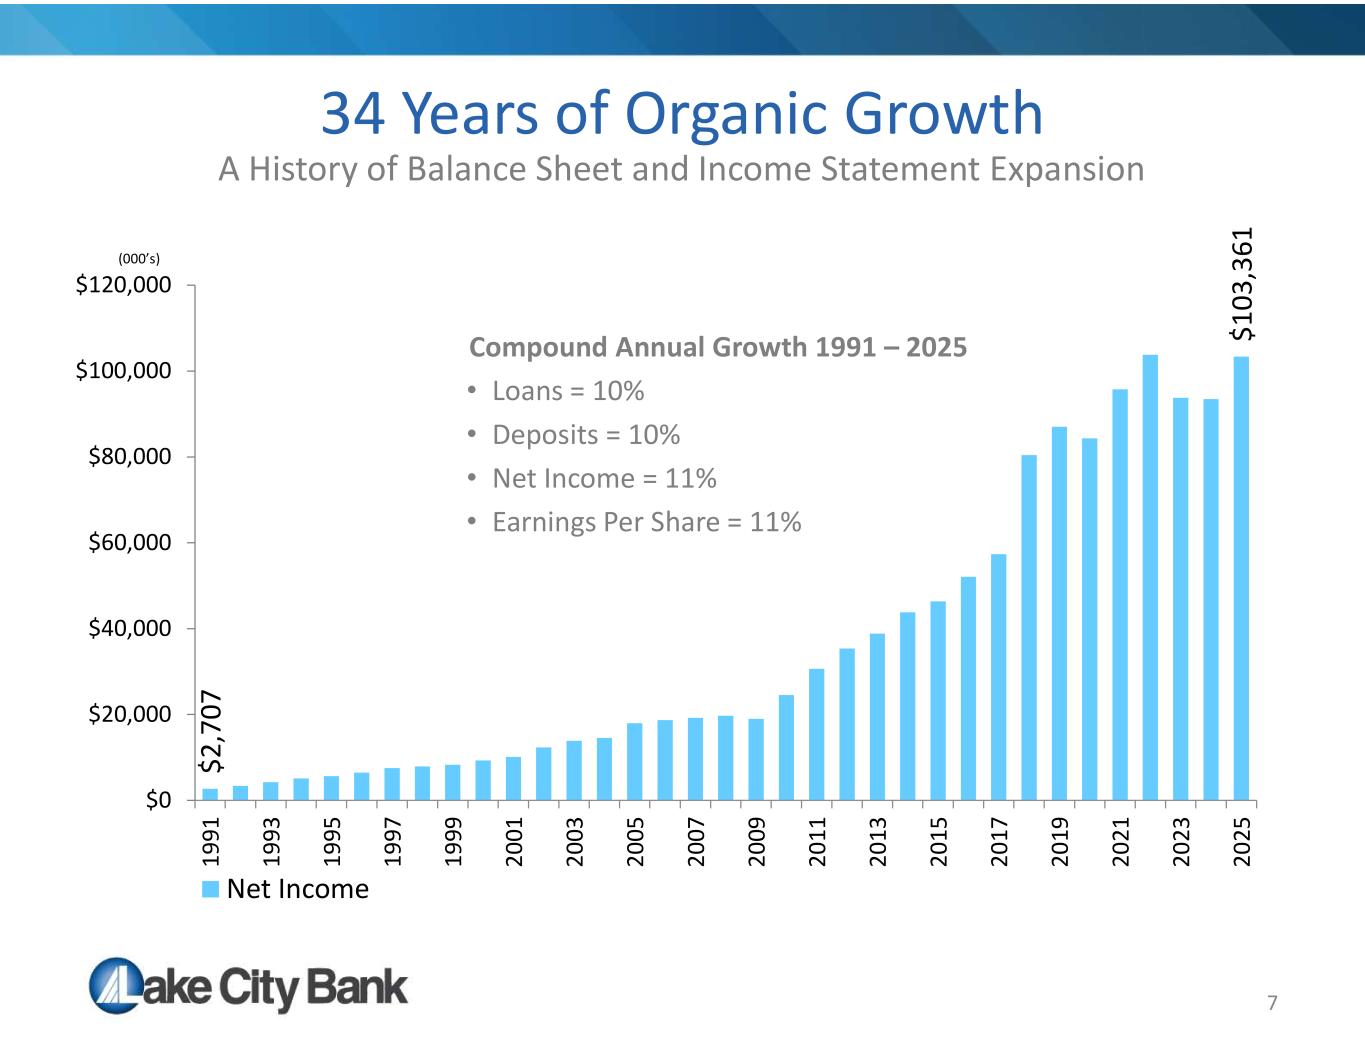
7 34 Years of Organic Growth A History of Balance Sheet and Income Statement Expansion $2 ,7 07 $1 03 ,3 61 $0 $20,000 $40,000 $60,000 $80,000 $100,000 $120,000 19 91 19 93 19 95 19 97 19 99 20 01 20 03 20 05 20 07 20 09 20 11 20 13 20 15 20 17 20 19 20 21 20 23 20 25 Net Income (000’s) Compound Annual Growth 1991 – 2025 • Loans = 10% • Deposits = 10% • Net Income = 11% • Earnings Per Share = 11%
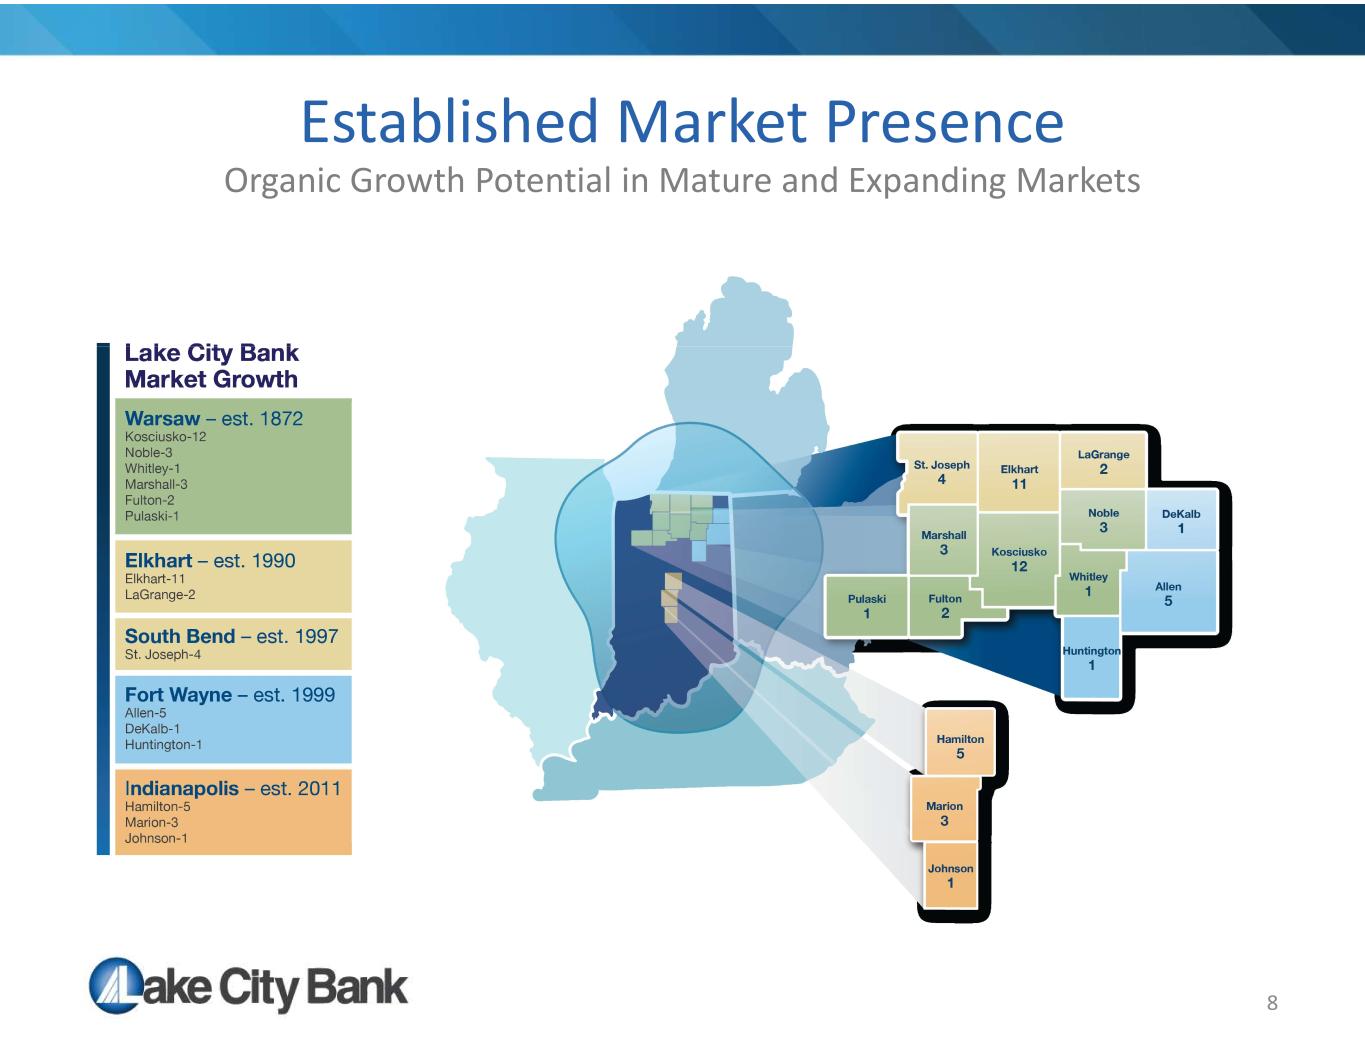
8 Established Market Presence Organic Growth Potential in Mature and Expanding Markets
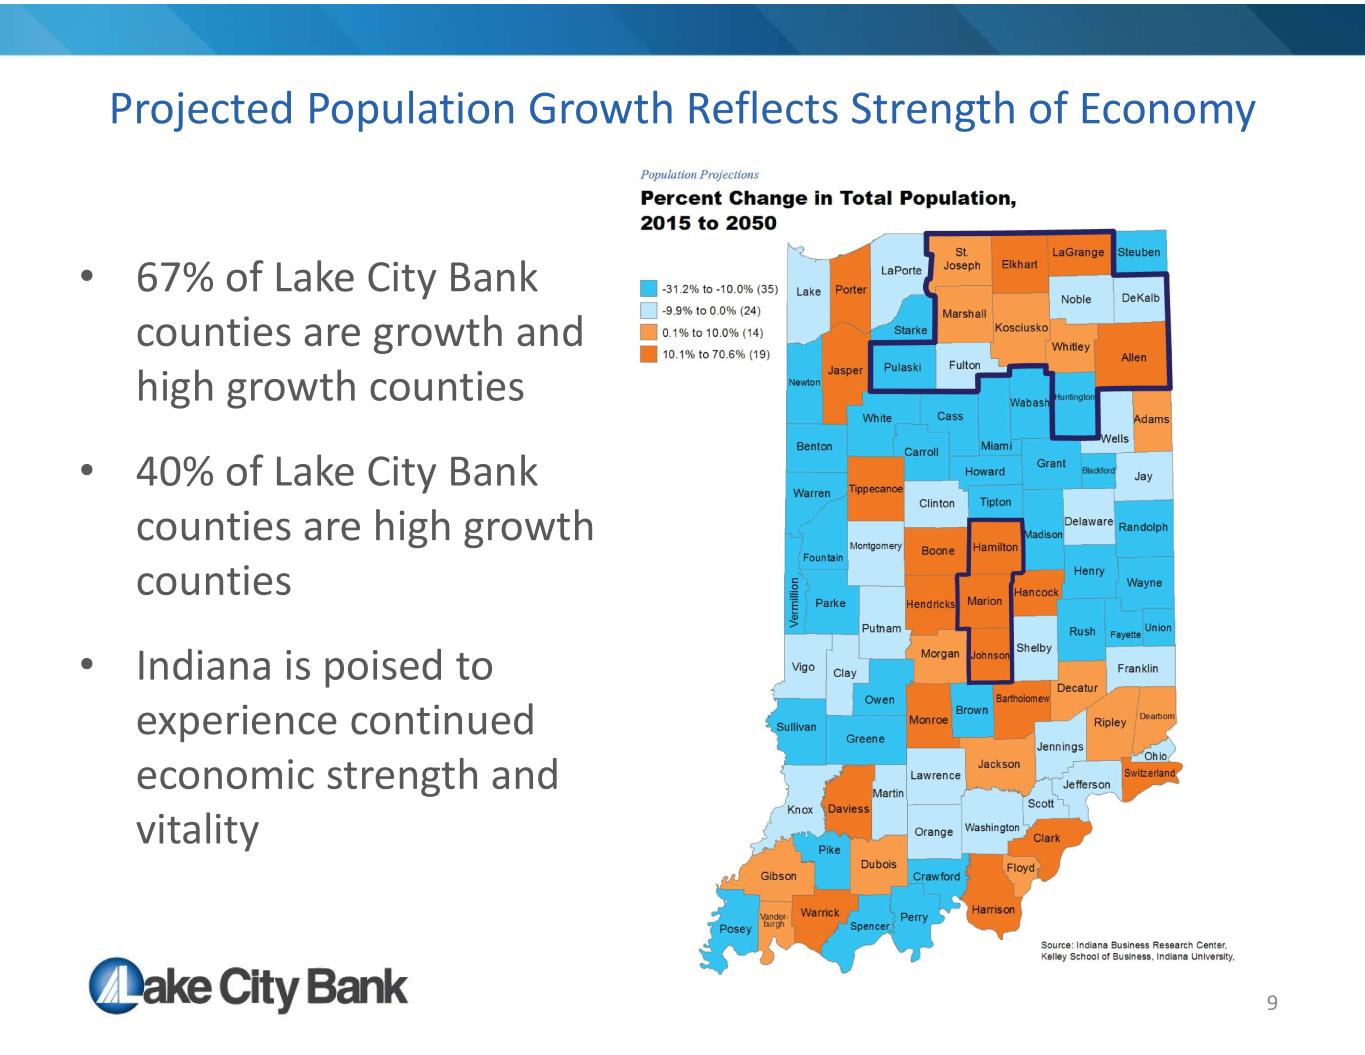
9 Projected Population Growth Reflects Strength of Economy • 67% of Lake City Bank counties are growth and high growth counties • 40% of Lake City Bank counties are high growth counties • Indiana is poised to experience continued economic strength and vitality
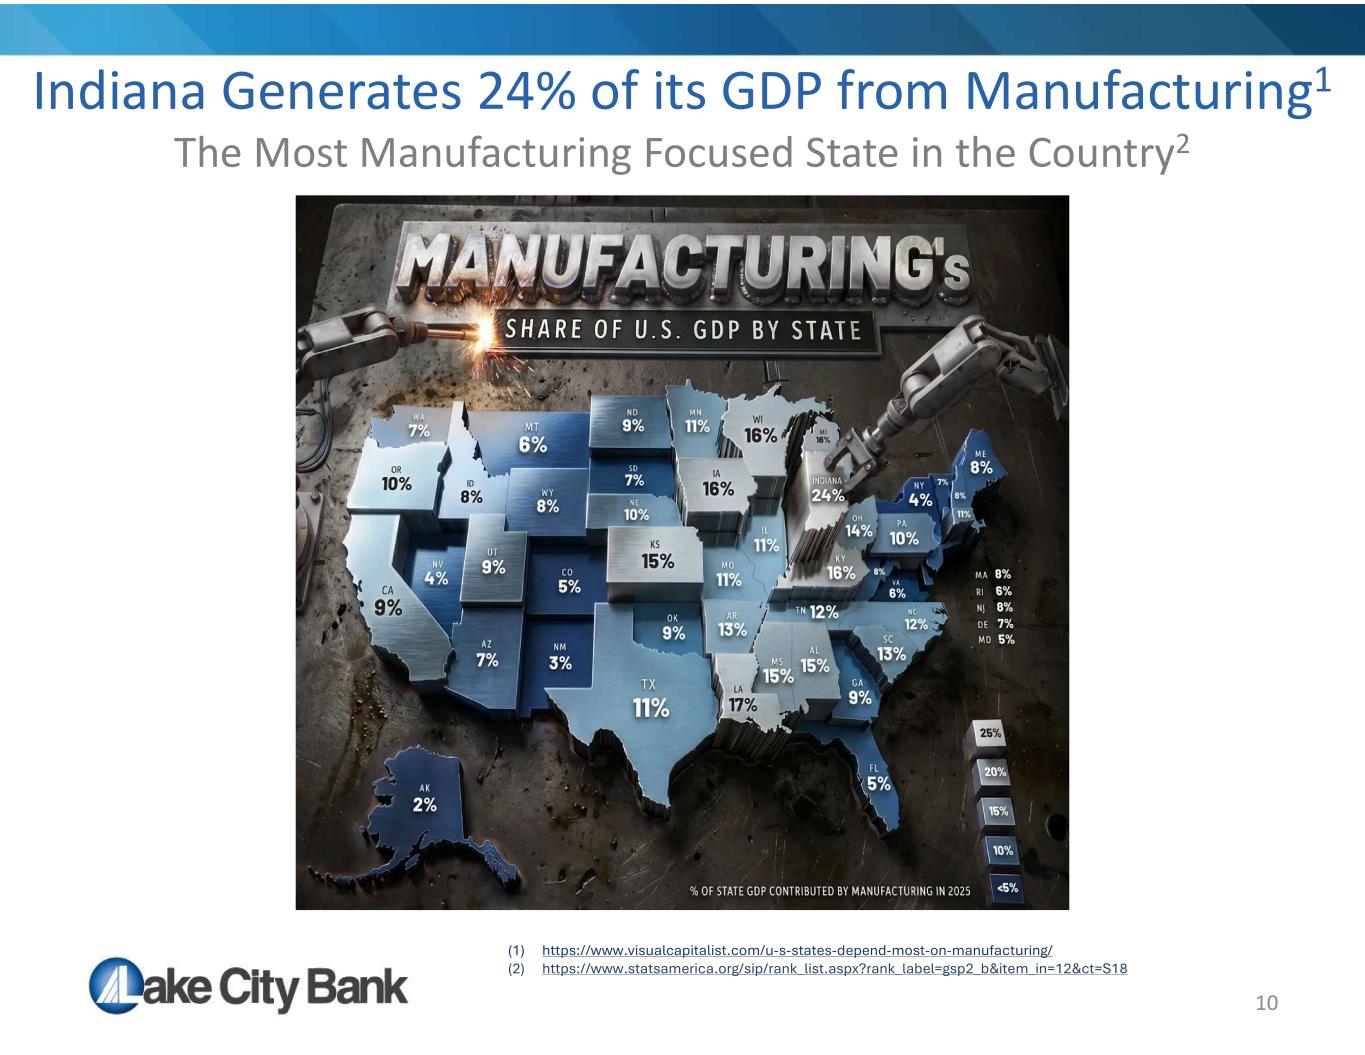
10 Indiana Generates 24% of its GDP from Manufacturing1 The Most Manufacturing Focused State in the Country2 (1) https://www.visualcapitalist.com/u-s-states-depend-most-on-manufacturing/ (2) https://www.statsamerica.org/sip/rank_list.aspx?rank_label=gsp2_b&item_in=12&ct=S18
11 Indiana Is Poised For Continued Economic Growth • In 2026, Herb Simon, the owner of the Pacers Sports & Entertainment, broke ground on a mixed-use development downtown featuring the first Ritz-Carlton in Indianapolis and a 4,000-person capacity live music venue operated by Live Nation for the entertainment district in the area surrounding the Gainbridge Fieldhouse(1) • In 2025, Eli Lilly broke ground on an $18 billion investment in Indiana’s LEAP Research and Innovation District in Boone County where Lake City Bank will open an office in 2026; In March 2026, Eli Lilly signed a LOI with the Indiana Office of Energy Development to focus on nuclear technologies in IN(2) • Bezos funded Slate Auto announced in 2025 it will build its low cost, direct to consumer electric vehicle in Warsaw, Indiana, Lake City Bank’s hometown and employ 2,000 workers(3) • Indiana has emerged as a Midwestern data-center hub driven by AI compute demand, favorable land and energy economics and aggressive state-local incentives. Amazon operates a data center in St. Joseph County, Google is developing a site in Allen County, and META has announced plans in Boone County(4) • In August 2026, the city of South Bend and Notre Dame broke ground on Colfax Corner in downtown as part of a broader transformation already underway in the city. This project is the first major investment in the Tech and Talent District identified in the 2045 South Bend Plan and is expected to open in 2028 with several hundred new jobs to the area(5) (1) https://newsroom.livenation.com/news/partners-formally-break-ground-on-mixed-use-development-downtown-featuring-ritz- carlton-indianapolis-and-new-live-nation-venue/ (2) https://dailyjournal.net/2026/05/07/lilly-announces-additional-4-5b-investment-at-leap-district-manufacturing-site/ (3) https://www.youtube.com/watch?v=YH3jEEDvduY (4) https://cleanview.co/public/data-centers/indiana (5) https://www.colfaxcorner.com/vision
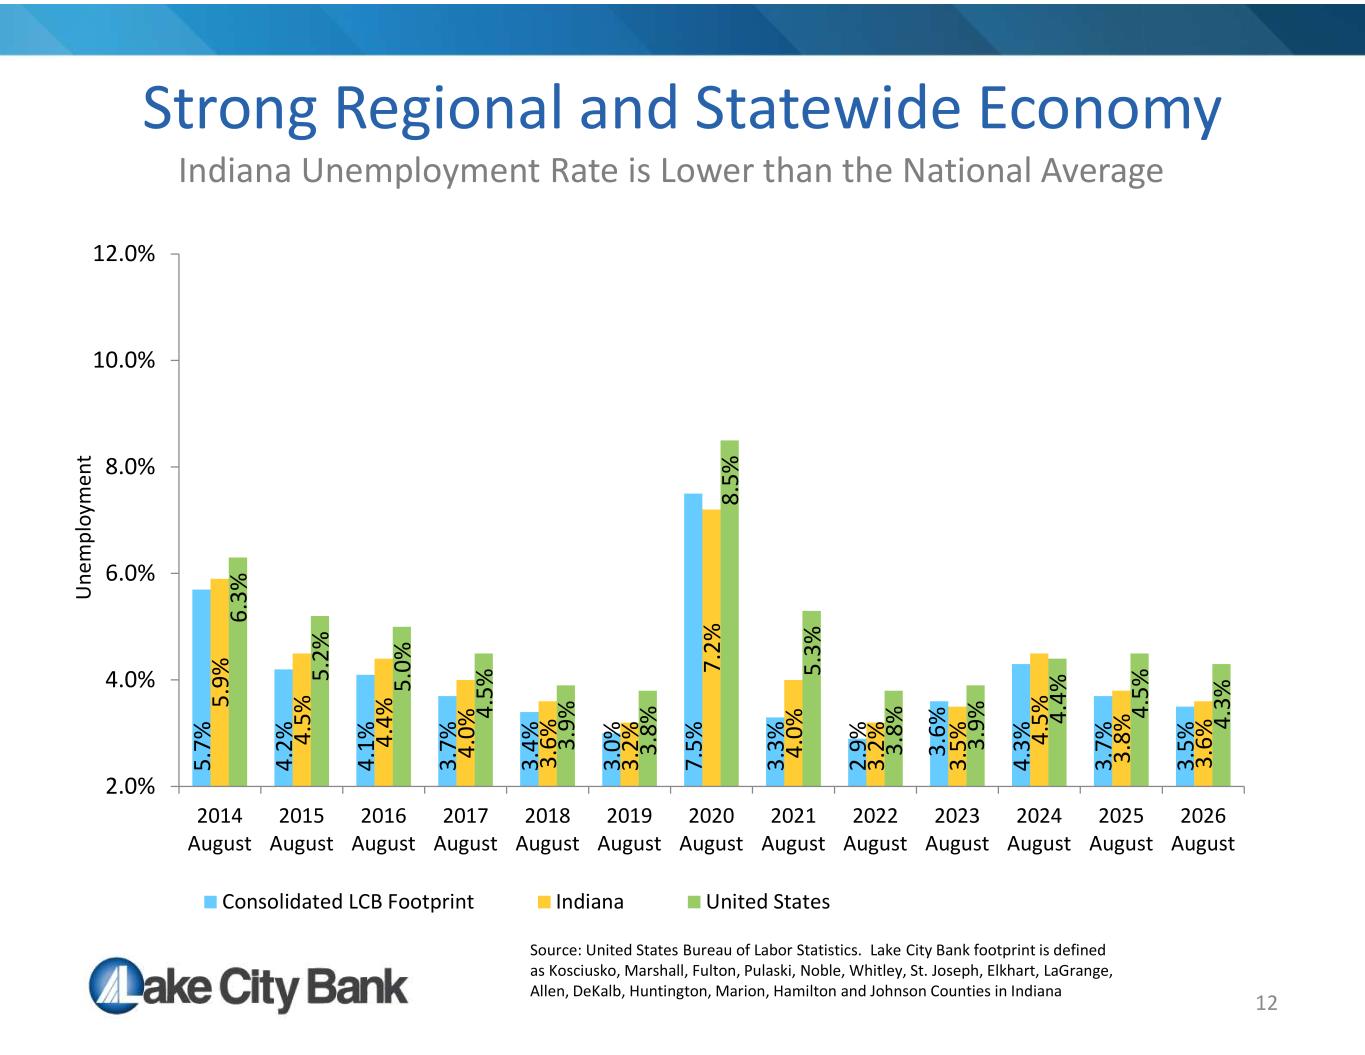
5. 7% 4. 2% 4. 1% 3. 7% 3. 4% 3. 0% 7. 5% 3. 3% 2. 9% 3. 6% 4. 3% 3. 7% 3. 5% 5. 9% 4. 5% 4. 4% 4. 0% 3. 6% 3. 2% 7. 2% 4. 0% 3. 2% 3. 5% 4. 5% 3. 8% 3. 6% 6. 3% 5. 2% 5. 0% 4. 5% 3. 9% 3. 8% 8. 5% 5. 3% 3. 8% 3. 9% 4. 4% 4. 5% 4. 3% 2.0% 4.0% 6.0% 8.0% 10.0% 12.0% 2014 August 2015 August 2016 August 2017 August 2018 August 2019 August 2020 August 2021 August 2022 August 2023 August 2024 August 2025 August 2026 August Consolidated LCB Footprint Indiana United States 12 Strong Regional and Statewide Economy U ne m pl oy m en t Source: United States Bureau of Labor Statistics. Lake City Bank footprint is defined as Kosciusko, Marshall, Fulton, Pulaski, Noble, Whitley, St. Joseph, Elkhart, LaGrange, Allen, DeKalb, Huntington, Marion, Hamilton and Johnson Counties in Indiana Indiana Unemployment Rate is Lower than the National Average
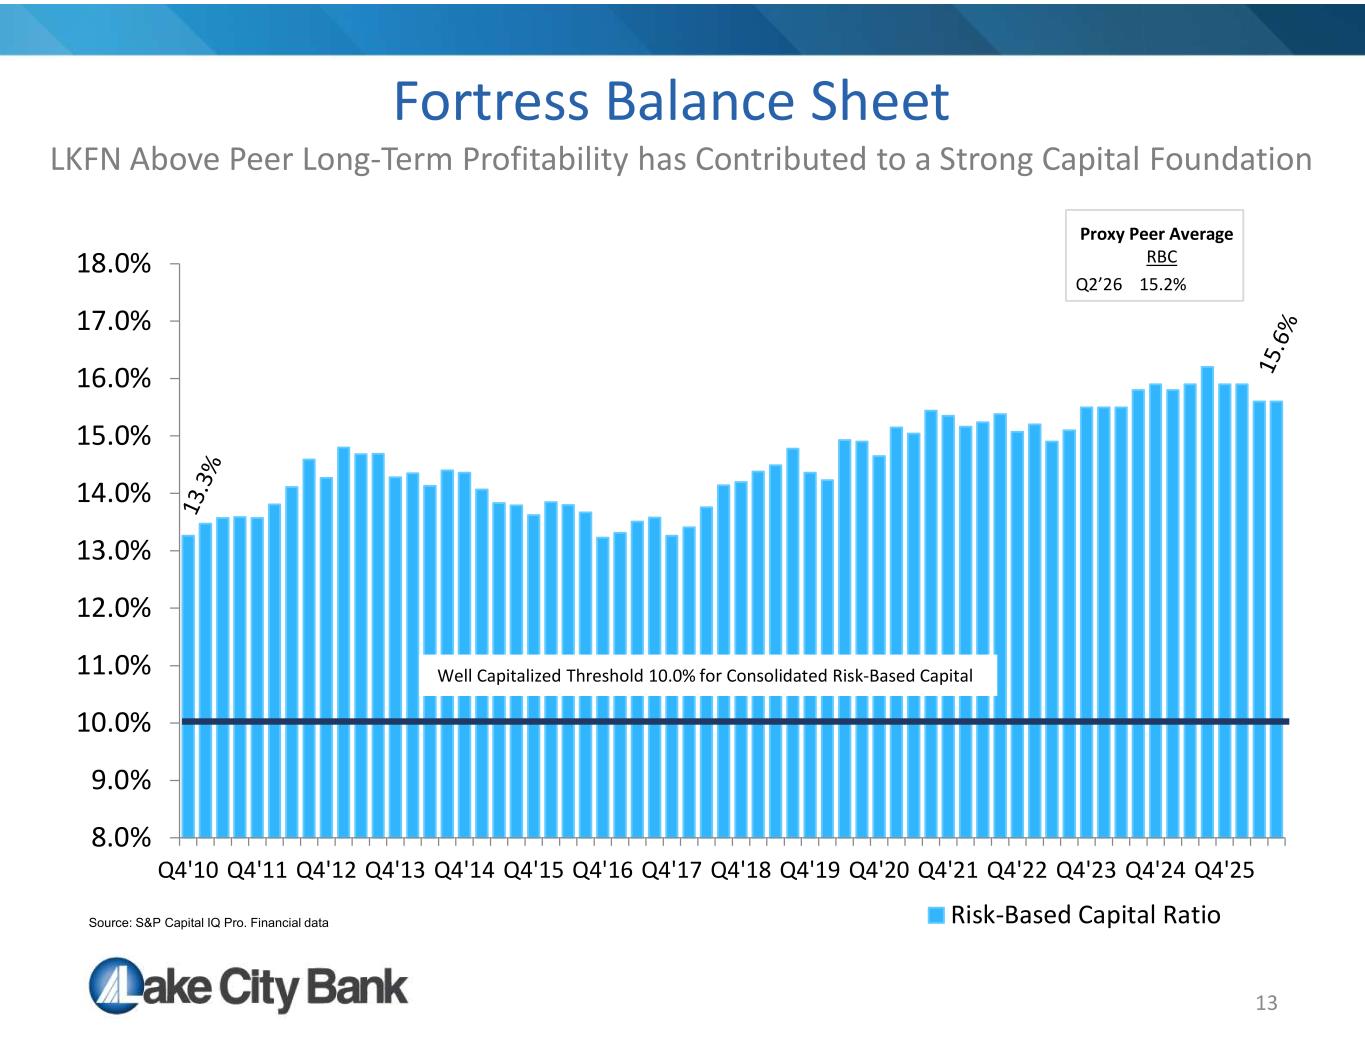
13 Fortress Balance Sheet LKFN Above Peer Long-Term Profitability has Contributed to a Strong Capital Foundation 8.0% 9.0% 10.0% 11.0% 12.0% 13.0% 14.0% 15.0% 16.0% 17.0% 18.0% Q4'10 Q4'11 Q4'12 Q4'13 Q4'14 Q4'15 Q4'16 Q4'17 Q4'18 Q4'19 Q4'20 Q4'21 Q4'22 Q4'23 Q4'24 Q4'25 Risk-Based Capital Ratio Proxy Peer Average RBC Q2’26 15.2% Well Capitalized Threshold 10.0% for Consolidated Risk-Based Capital Source: S&P Capital IQ Pro. Financial data
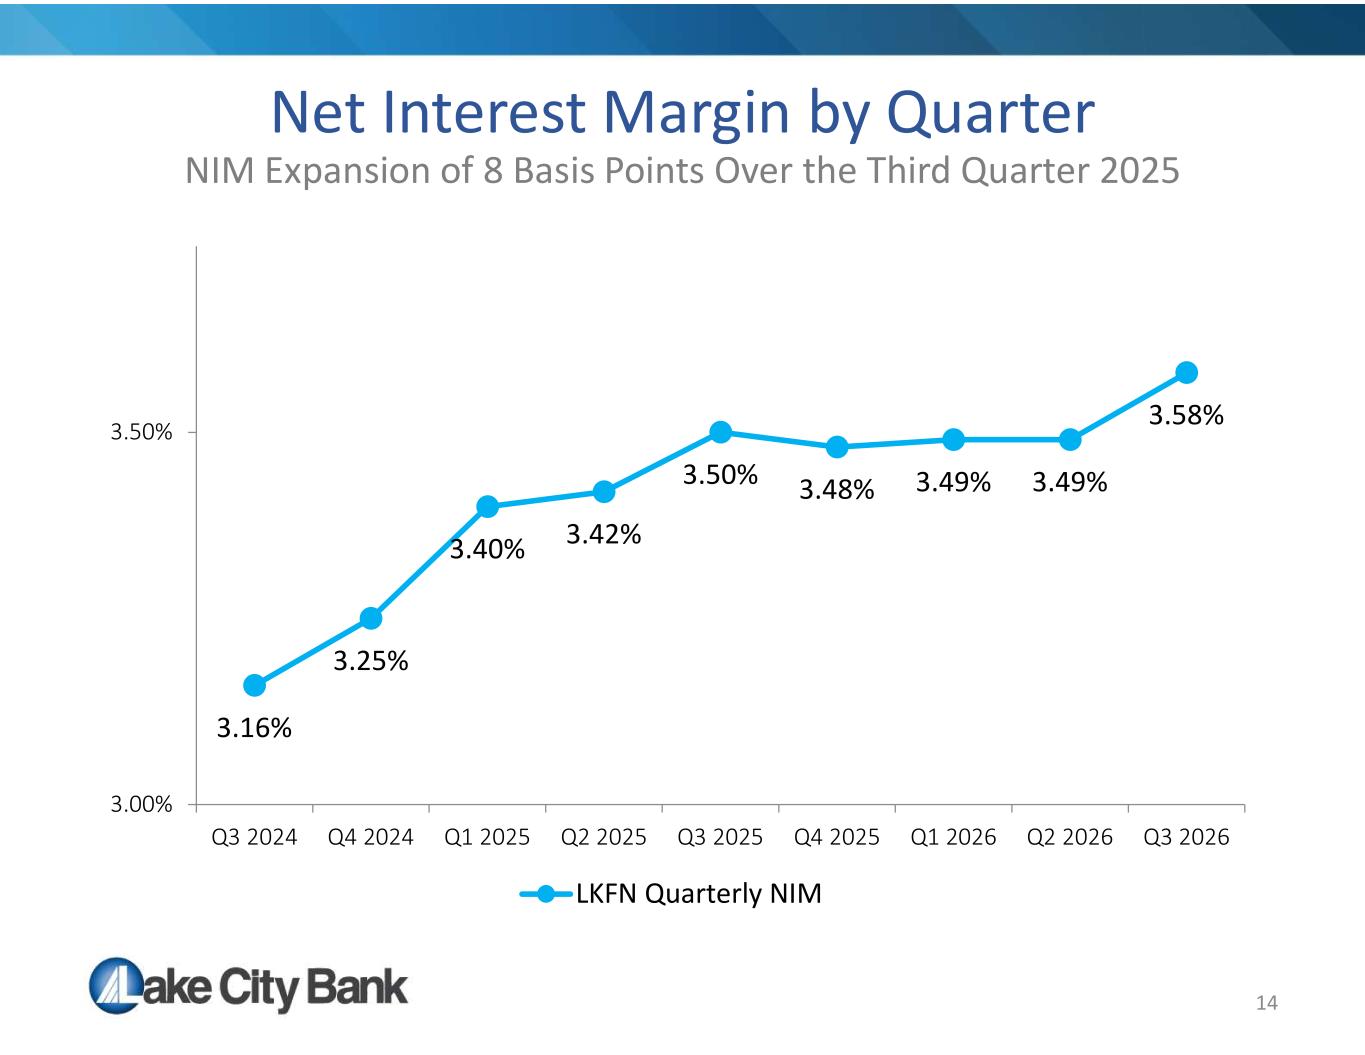
14 Net Interest Margin by Quarter NIM Expansion of 8 Basis Points Over the Third Quarter 2025 3.16% 3.25% 3.40% 3.42% 3.50% 3.48% 3.49% 3.49% 3.58% 3.00% 3.50% Q3 2024 Q4 2024 Q1 2025 Q2 2025 Q3 2025 Q4 2025 Q1 2026 Q2 2026 Q3 2026 LKFN Quarterly NIM
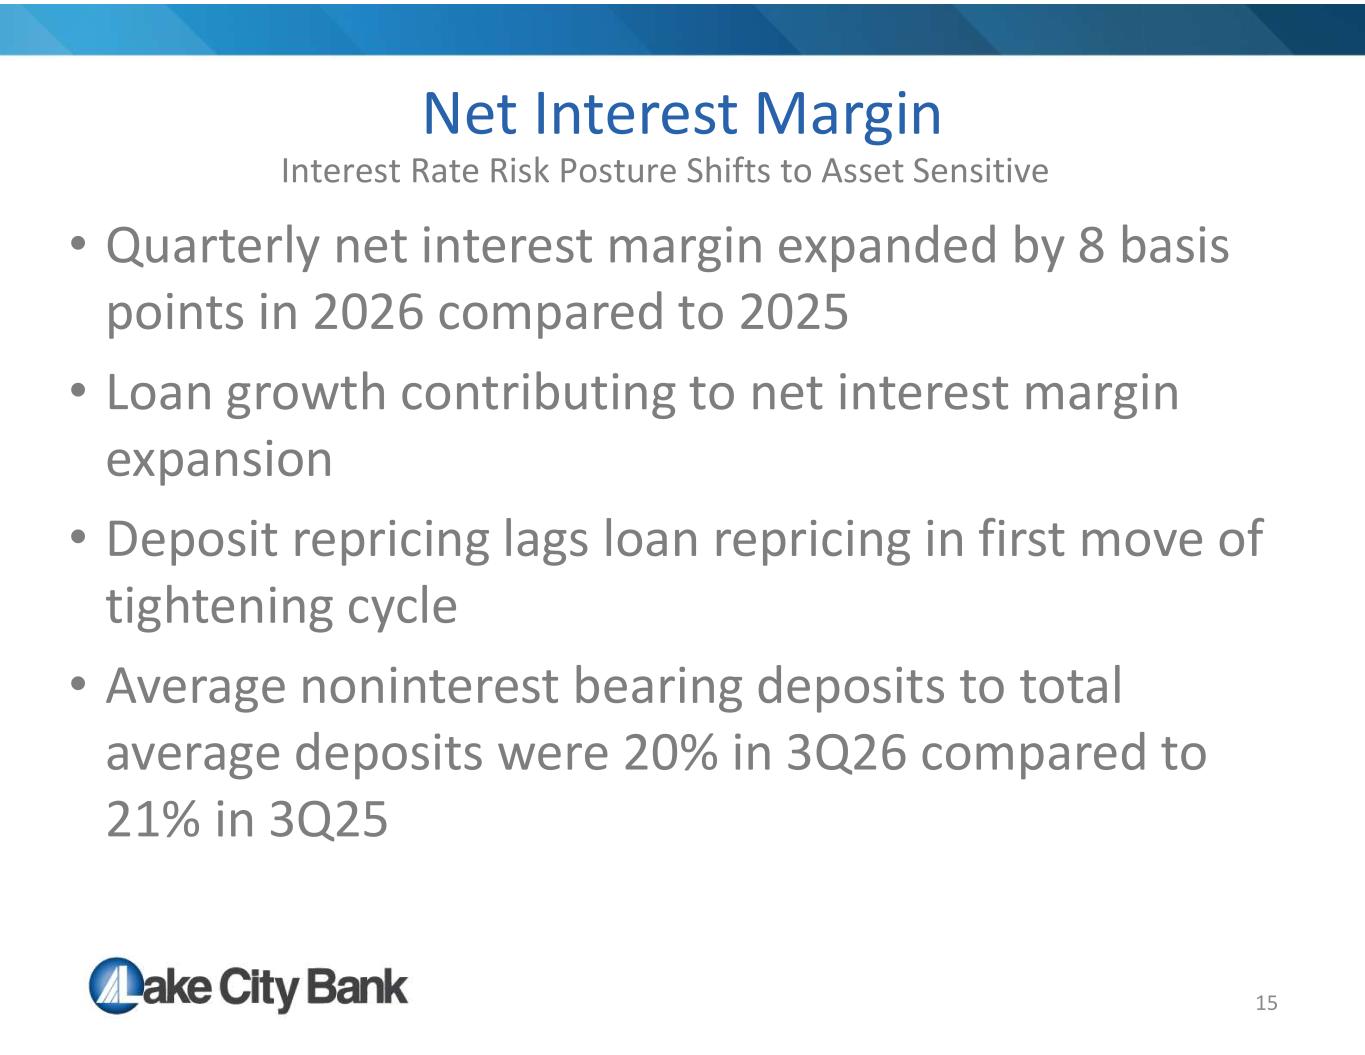
15 Net Interest Margin Interest Rate Risk Posture Shifts to Asset Sensitive • Quarterly net interest margin expanded by 8 basis points in 2026 compared to 2025 • Loan growth contributing to net interest margin expansion • Deposit repricing lags loan repricing in first move of tightening cycle • Average noninterest bearing deposits to total average deposits were 20% in 3Q26 compared to 21% in 3Q25
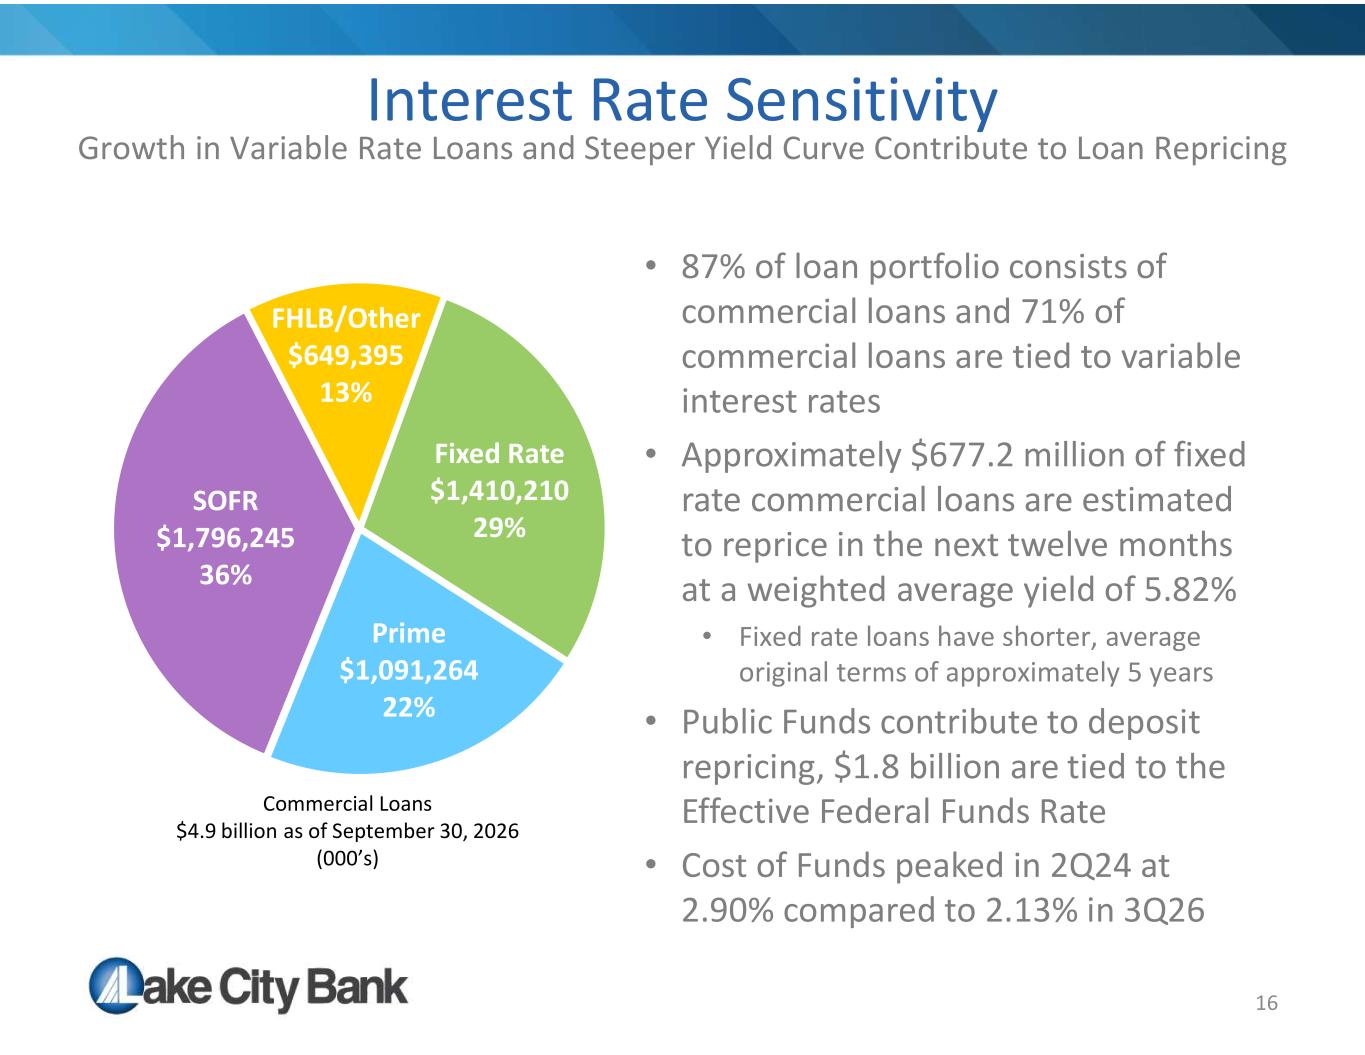
16 Interest Rate Sensitivity Growth in Variable Rate Loans and Steeper Yield Curve Contribute to Loan Repricing Fixed Rate $1,410,210 29% Prime $1,091,264 22% SOFR $1,796,245 36% FHLB/Other $649,395 13% Commercial Loans $4.9 billion as of September 30, 2026 (000’s) • 87% of loan portfolio consists of commercial loans and 71% of commercial loans are tied to variable interest rates • Approximately $677.2 million of fixed rate commercial loans are estimated to reprice in the next twelve months at a weighted average yield of 5.82% • Fixed rate loans have shorter, average original terms of approximately 5 years • Public Funds contribute to deposit repricing, $1.8 billion are tied to the Effective Federal Funds Rate • Cost of Funds peaked in 2Q24 at 2.90% compared to 2.13% in 3Q26
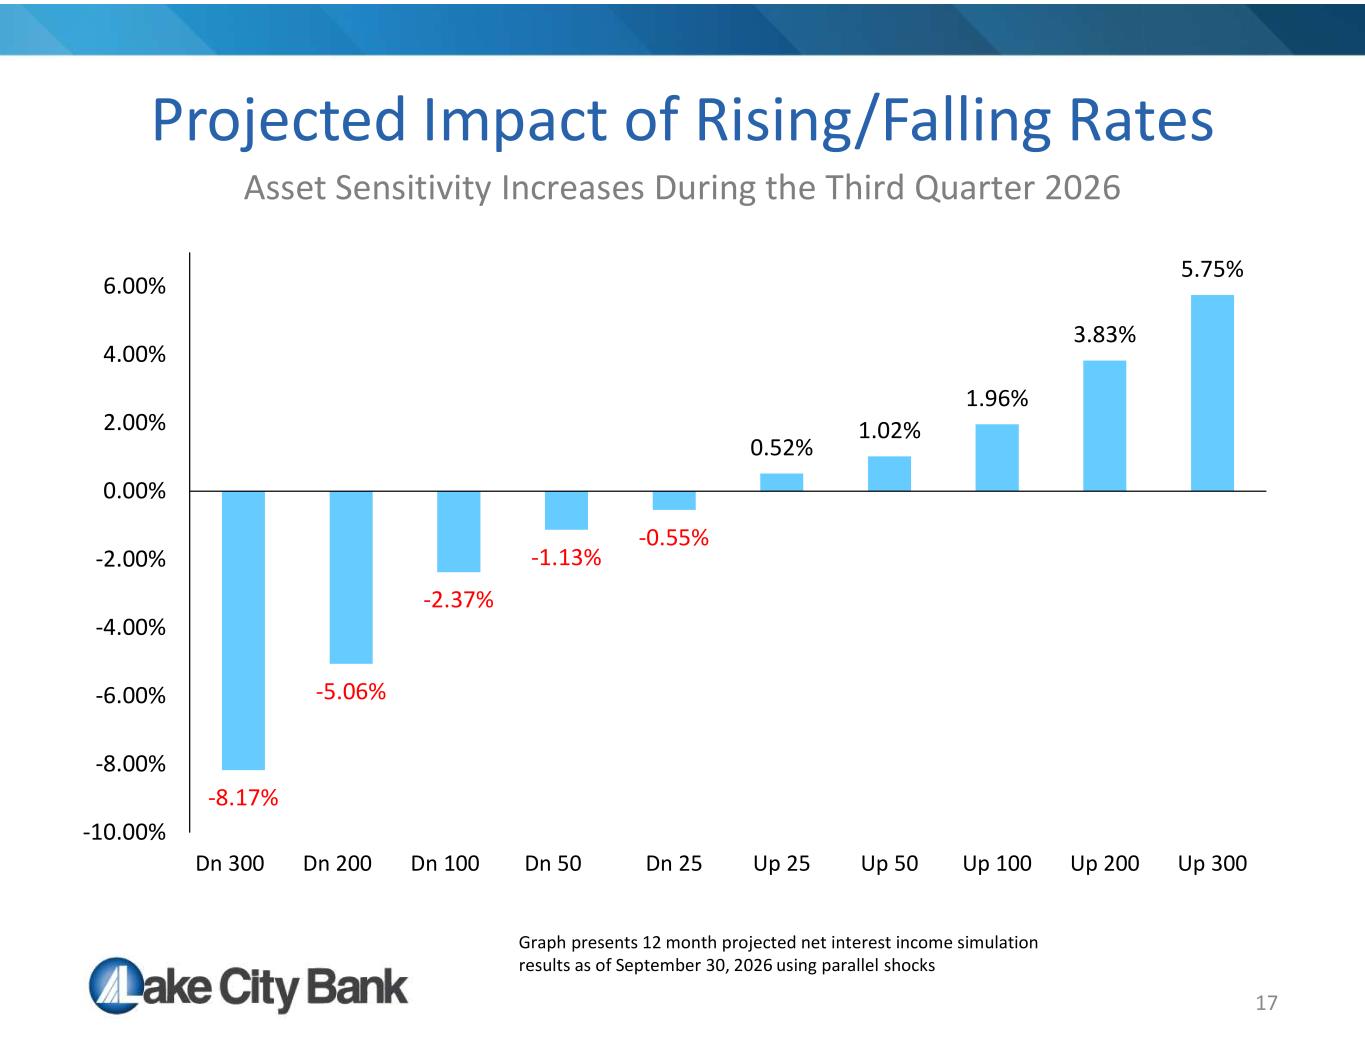
17 Projected Impact of Rising/Falling Rates Asset Sensitivity Increases During the Third Quarter 2026 Graph presents 12 month projected net interest income simulation results as of September 30, 2026 using parallel shocks -8.17% -5.06% -2.37% -1.13% -0.55% 0.52% 1.02% 1.96% 3.83% 5.75% -10.00% -8.00% -6.00% -4.00% -2.00% 0.00% 2.00% 4.00% 6.00% Dn 300 Dn 200 Dn 100 Dn 50 Dn 25 Up 25 Up 50 Up 100 Up 200 Up 300
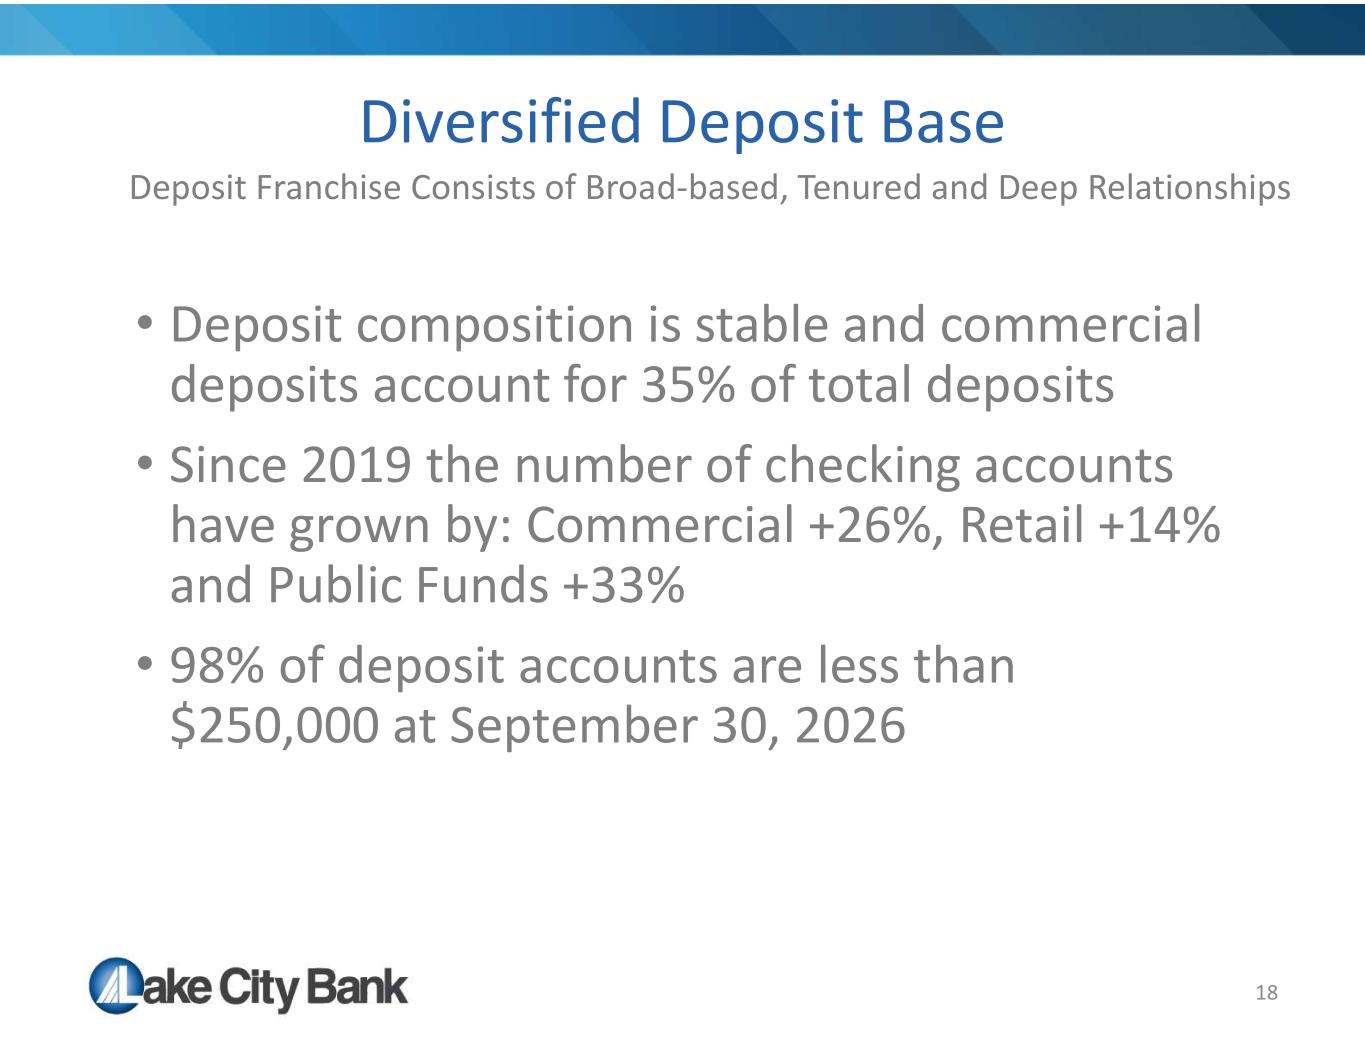
18 Diversified Deposit Base Deposit Franchise Consists of Broad-based, Tenured and Deep Relationships • Deposit composition is stable and commercial deposits account for 35% of total deposits • Since 2019 the number of checking accounts have grown by: Commercial +26%, Retail +14% and Public Funds +33% • 98% of deposit accounts are less than $250,000 at September 30, 2026
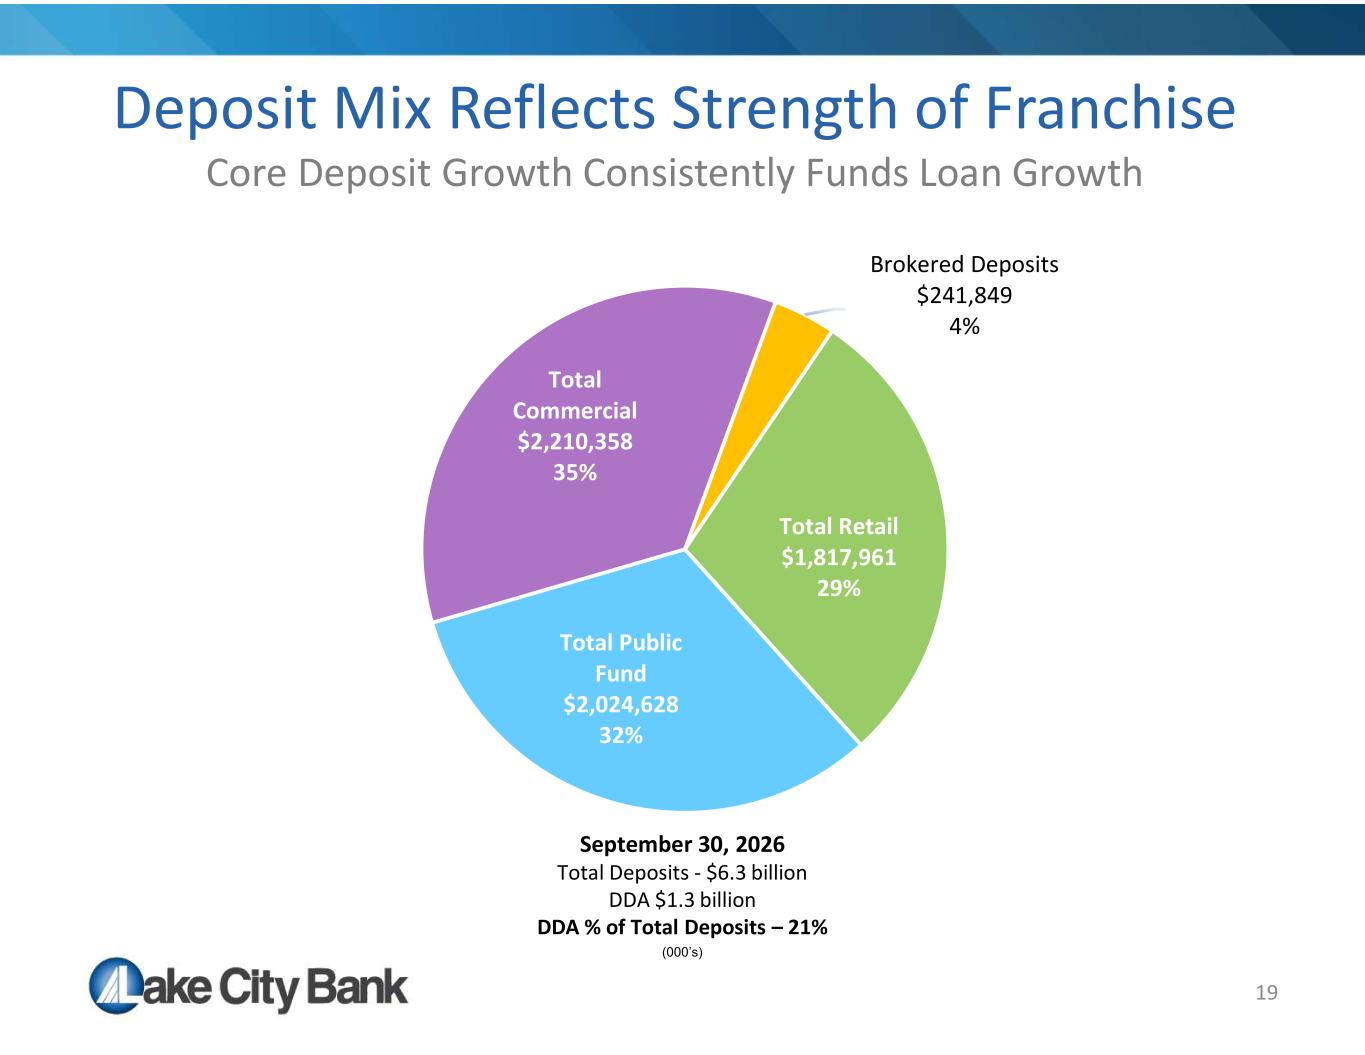
19 Deposit Mix Reflects Strength of Franchise Core Deposit Growth Consistently Funds Loan Growth Total Retail $1,817,961 29% Total Public Fund $2,024,628 32% Total Commercial $2,210,358 35% Brokered Deposits $241,849 4% September 30, 2026 Total Deposits - $6.3 billion DDA $1.3 billion DDA % of Total Deposits – 21% (000’s)
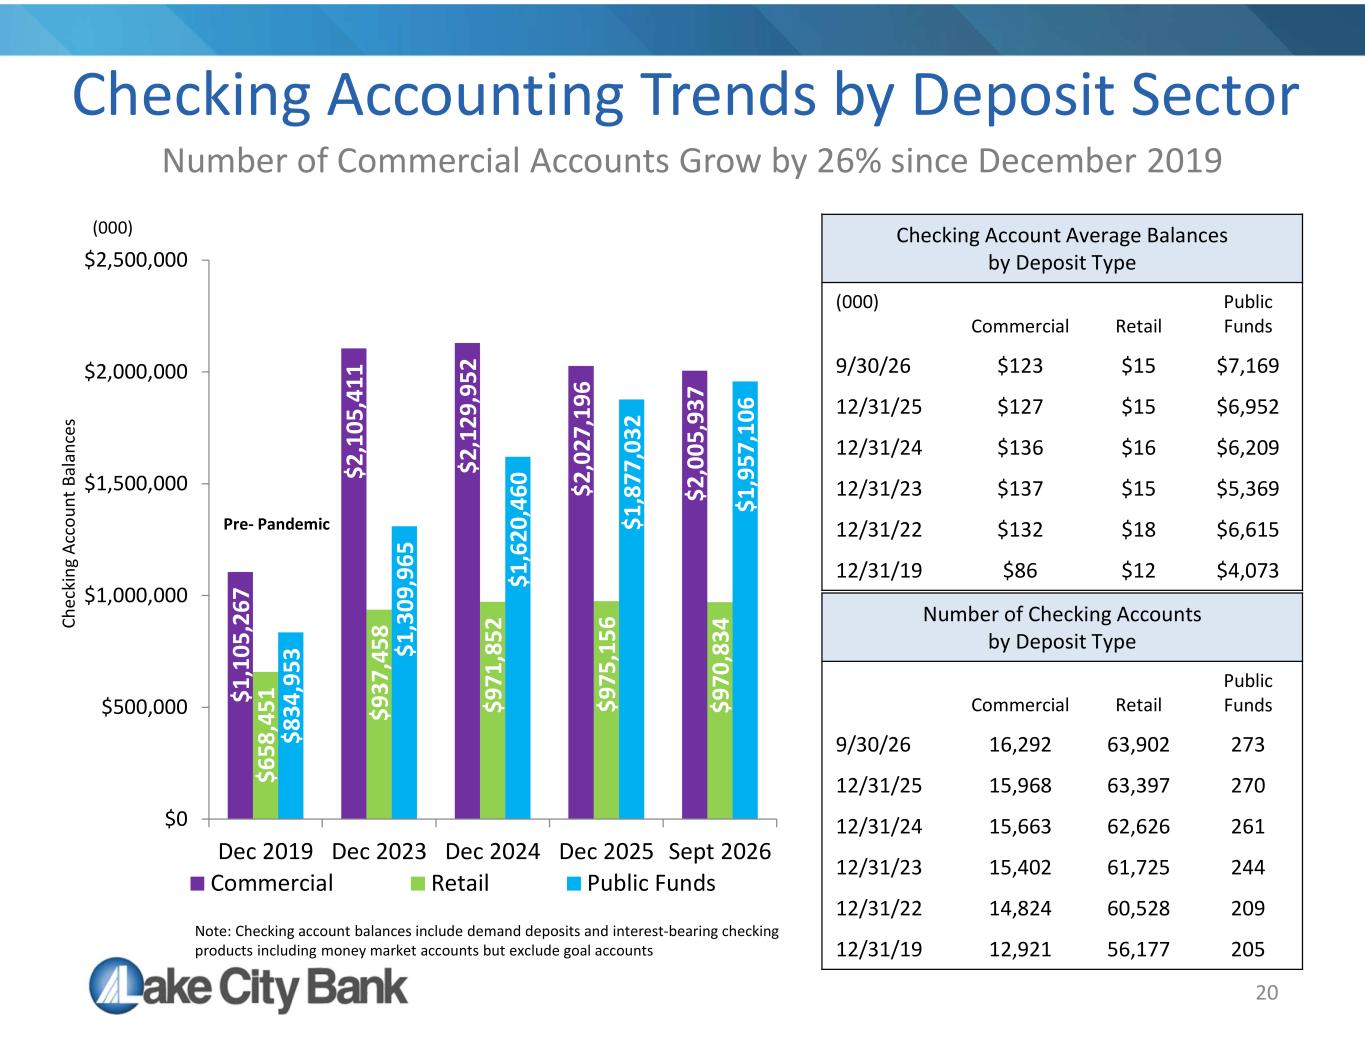
20 Checking Accounting Trends by Deposit Sector Number of Commercial Accounts Grow by 26% since December 2019 $1 ,1 05 ,2 67 $2 ,1 05 ,4 11 $2 ,1 29 ,9 52 $2 ,0 27 ,1 96 $2 ,0 05 ,9 37 $6 58 ,4 51 $9 37 ,4 58 $9 71 ,8 52 $9 75 ,1 56 $9 70 ,8 34 $8 34 ,9 53 $1 ,3 09 ,9 65 $1 ,6 20 ,4 60 $1 ,8 77 ,0 32 $1 ,9 57 ,1 06 $0 $500,000 $1,000,000 $1,500,000 $2,000,000 $2,500,000 Dec 2019 Dec 2023 Dec 2024 Dec 2025 Sept 2026 Commercial Retail Public Funds Ch ec ki ng A cc ou nt B al an ce s Checking Account Average Balances by Deposit Type Public FundsRetailCommercial (000) $7,169$15$1239/30/26 $6,952$15$12712/31/25 $6,209$16$13612/31/24 $5,369$15$13712/31/23 $6,615$18$13212/31/22 $4,073$12$8612/31/19 Number of Checking Accounts by Deposit Type Public FundsRetailCommercial 27363,90216,2929/30/26 27063,39715,96812/31/25 26162,62615,66312/31/24 24461,72515,40212/31/23 20960,52814,82412/31/22 20556,17712,92112/31/19 Pre- Pandemic (000) Note: Checking account balances include demand deposits and interest-bearing checking products including money market accounts but exclude goal accounts
21 Shareholder Value Strategy 1. Commercial Banking Focus 2. High Quality Team Members 3. Proven Organic Growth Experience 4. Focus on Core Deposit Funding 5. Commitment to Technology
22 Commercial Banking Focus Experienced Relationship Driven Team • 52 credit “smart” commercial bankers • Average 23 years in banking & 13 years at Lake City Bank • We live where we lend • Face to face calling matters and is a team effort • Deep organizational structure provides credit and administrative support • We cross sell aggressively by leveraging technology • Capital capacity supports organic loan growth
23 Business Development Program Momentum • The core foundation of future revenue growth • Enhanced focus on the in-person calling program will drive market share growth strategies • 4,488 sales calls in the third quarter, an increase of 2% over 2025 • Prospect Calls are critical- 2,111 prospect calls, or 47% of total • Working together builds relationships- 1,661 Joint Calls, or 37% of total
24 Credit Process Commercial Banking Focus • Our credit discipline has never changed • We have a centralized committee structure • We are in-market lender to in-market clients • Character matters – we lend to people first • We focus on management/cash flow • Structure is important and is disciplined • CRE portfolio is focused on owner occupied, in-market multifamily, and strong credit tenant transact projects
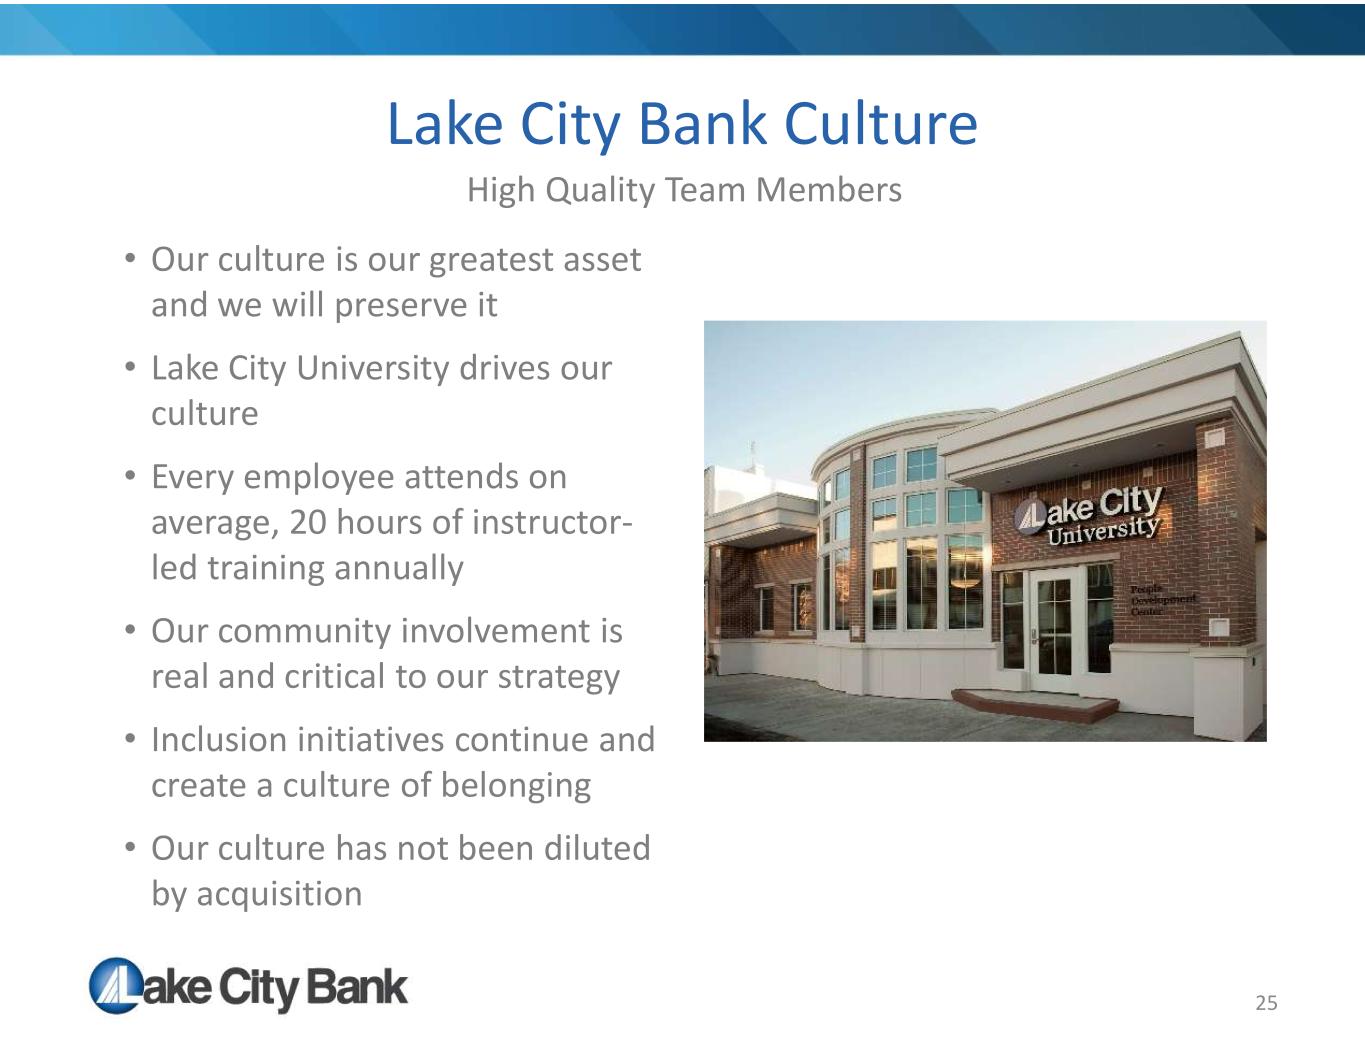
25 Lake City Bank Culture High Quality Team Members • Our culture is our greatest asset and we will preserve it • Lake City University drives our culture • Every employee attends on average, 20 hours of instructor- led training annually • Our community involvement is real and critical to our strategy • Inclusion initiatives continue and create a culture of belonging • Our culture has not been diluted by acquisition
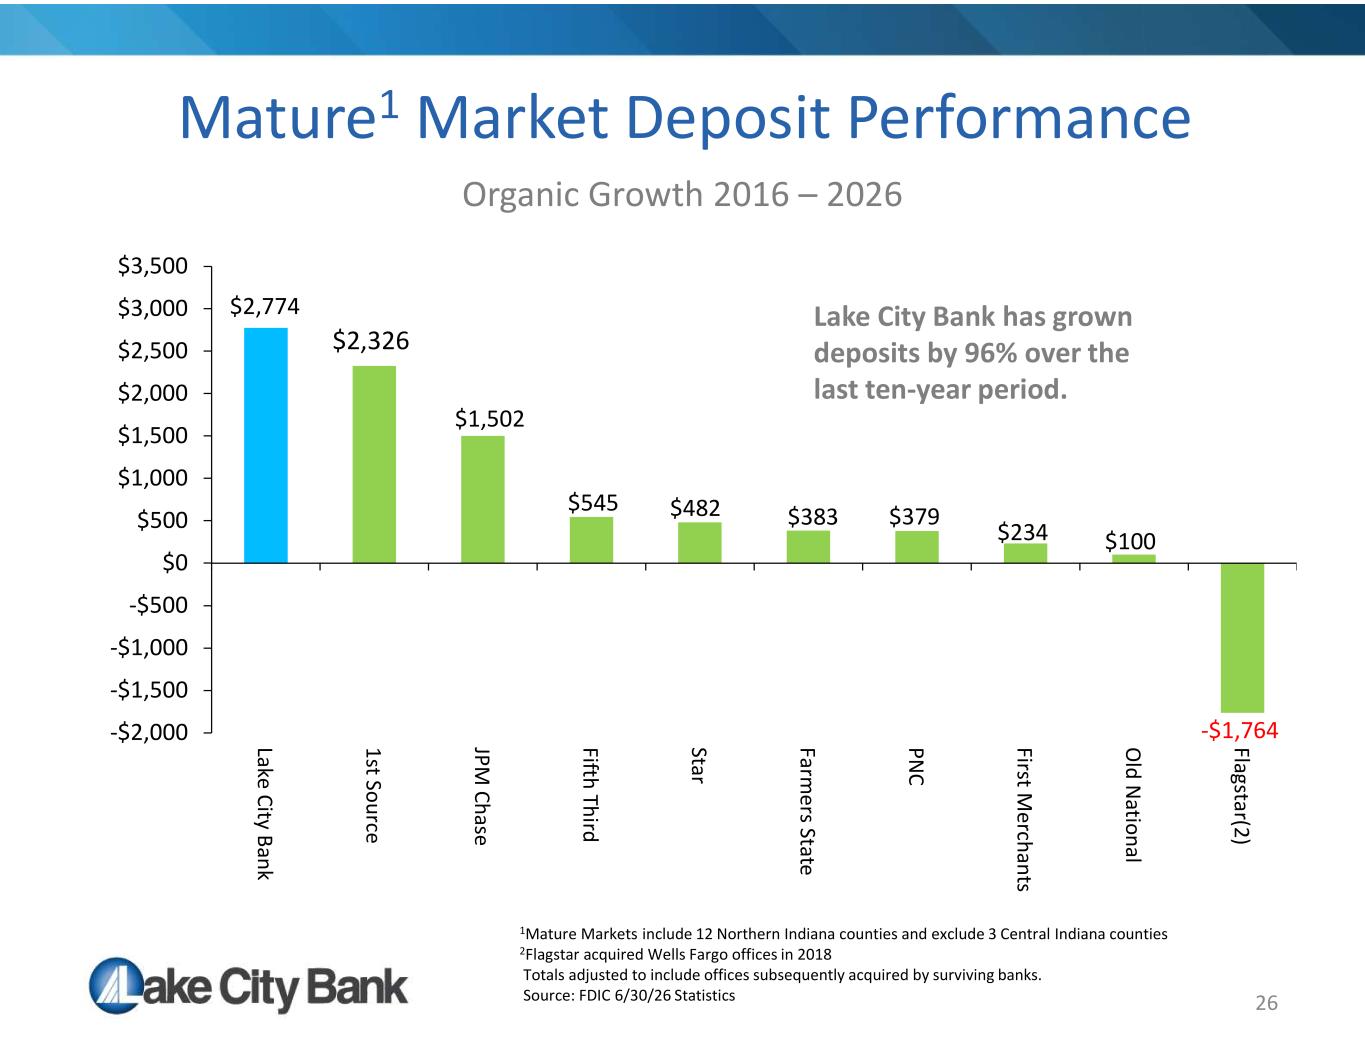
26 Mature1 Market Deposit Performance Organic Growth 2016 – 2026 $2,774 $2,326 $1,502 $545 $482 $383 $379 $234 $100 -$1,764-$2,000 -$1,500 -$1,000 -$500 $0 $500 $1,000 $1,500 $2,000 $2,500 $3,000 $3,500 Lake City Bank 1st Source JPM Chase Fifth Third Star Farm ers State PN C First M erchants O ld N ational Flagstar(2) Lake City Bank has grown deposits by 96% over the last ten-year period. 1Mature Markets include 12 Northern Indiana counties and exclude 3 Central Indiana counties 2Flagstar acquired Wells Fargo offices in 2018 Totals adjusted to include offices subsequently acquired by surviving banks. Source: FDIC 6/30/26 Statistics
27 Commitment to Technology Innovation and Competitive Technology is a Focus • Fintech partnerships play a significant role in our technology stack and enable delivery of innovative solutions to our customers • Investments in Lake City Bank Digital, a Q2 product implemented in 2021 with ongoing user and security functionality added since initial adoption • Technology partnership with FIS is strong – User Planning Council and Strategic Planning Advisory Council • Retail and Commercial platforms ensure competitive positioning • Branch design and functionality is ever evolving based on client transactions, relationship activity and geographic expansion plans • Artificial intelligence capabilities are a priority with a focus on our innovative customer relationship management (CRM) program
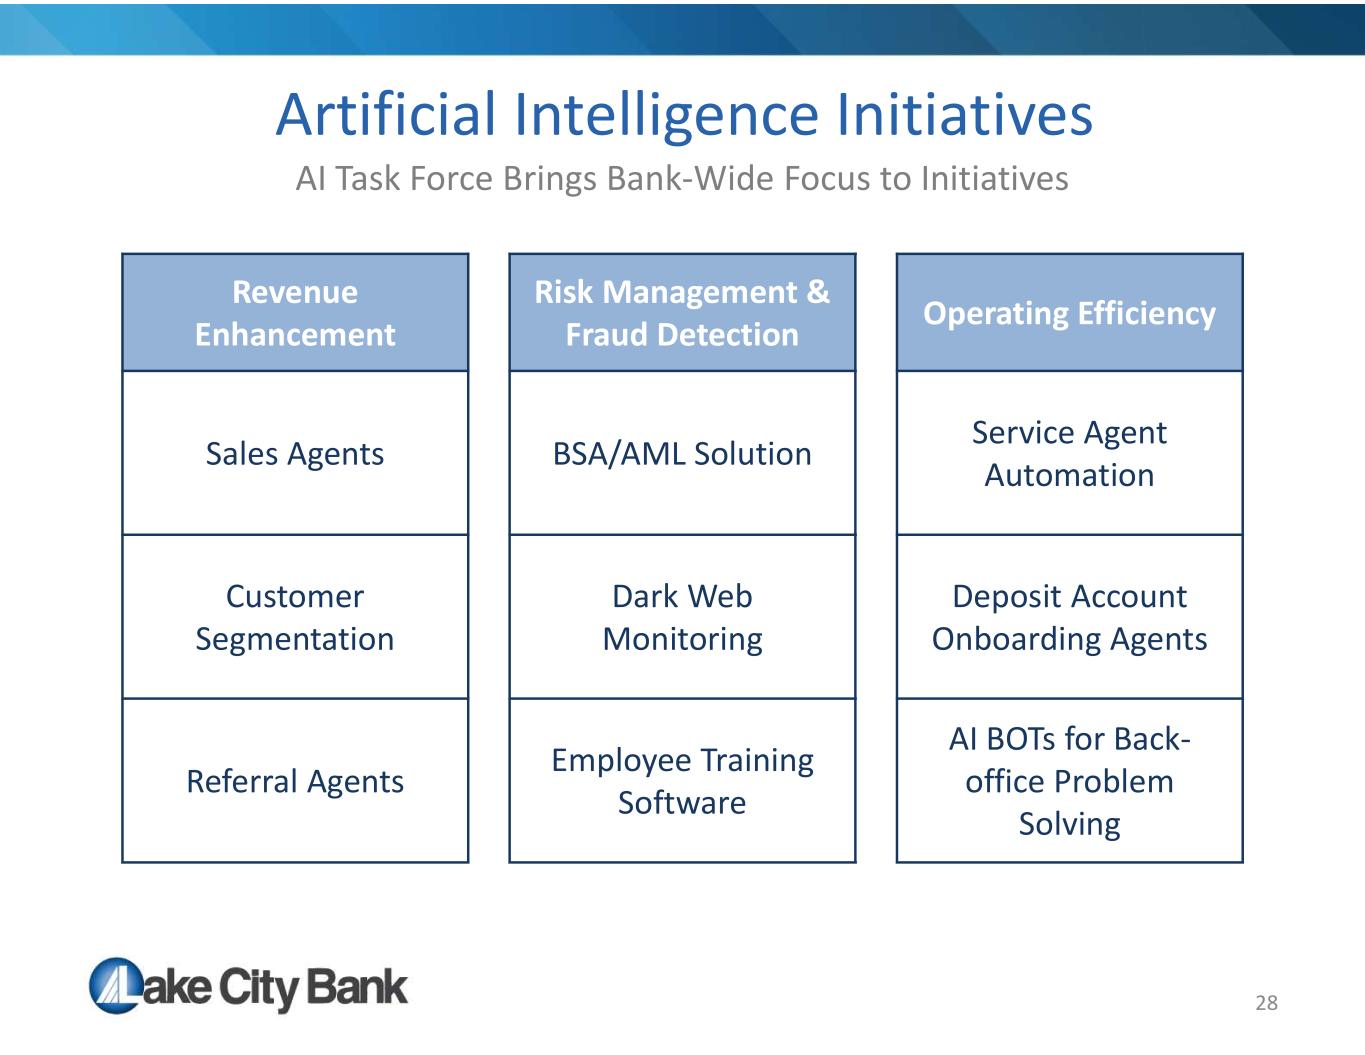
28 Artificial Intelligence Initiatives AI Task Force Brings Bank-Wide Focus to Initiatives Operating EfficiencyRisk Management & Fraud Detection Revenue Enhancement Service Agent AutomationBSA/AML SolutionSales Agents Deposit Account Onboarding Agents Dark Web Monitoring Customer Segmentation AI BOTs for Back- office Problem Solving Employee Training SoftwareReferral Agents
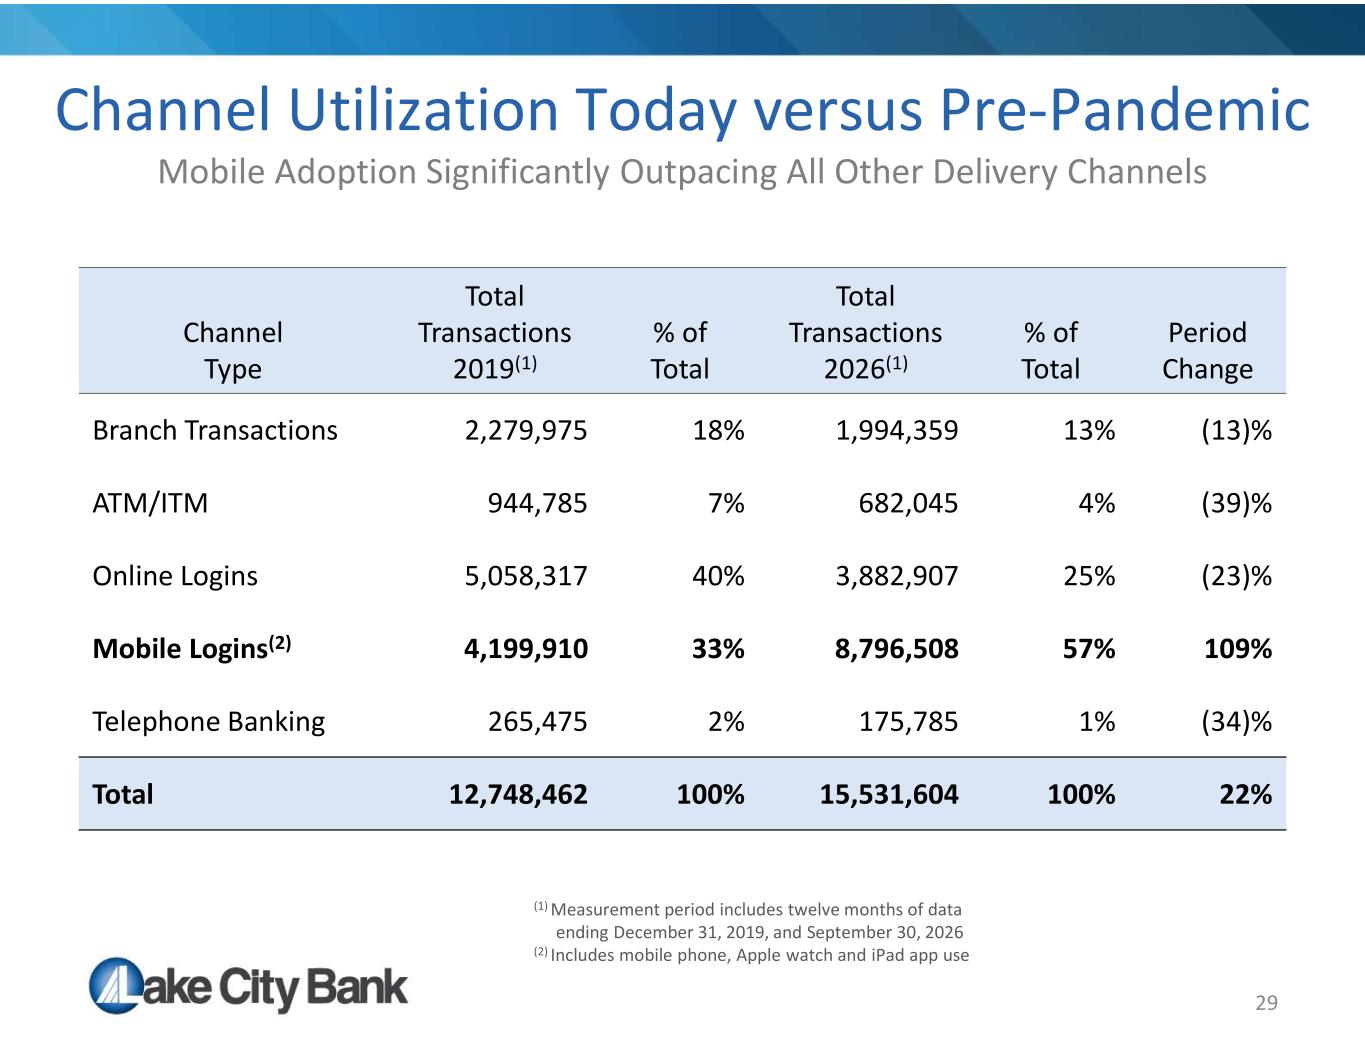
29 Channel Utilization Today versus Pre-Pandemic Mobile Adoption Significantly Outpacing All Other Delivery Channels Period Change % of Total Total Transactions 2026(1) % of Total Total Transactions 2019(1) Channel Type (13)%13%1,994,35918%2,279,975Branch Transactions (39)%4%682,0457%944,785ATM/ITM (23)%25%3,882,90740%5,058,317Online Logins 109%57%8,796,50833%4,199,910Mobile Logins(2) (34)%1%175,7852%265,475Telephone Banking 22%100%15,531,604100%12,748,462Total (1) Measurement period includes twelve months of data ending December 31, 2019, and September 30, 2026 (2) Includes mobile phone, Apple watch and iPad app use
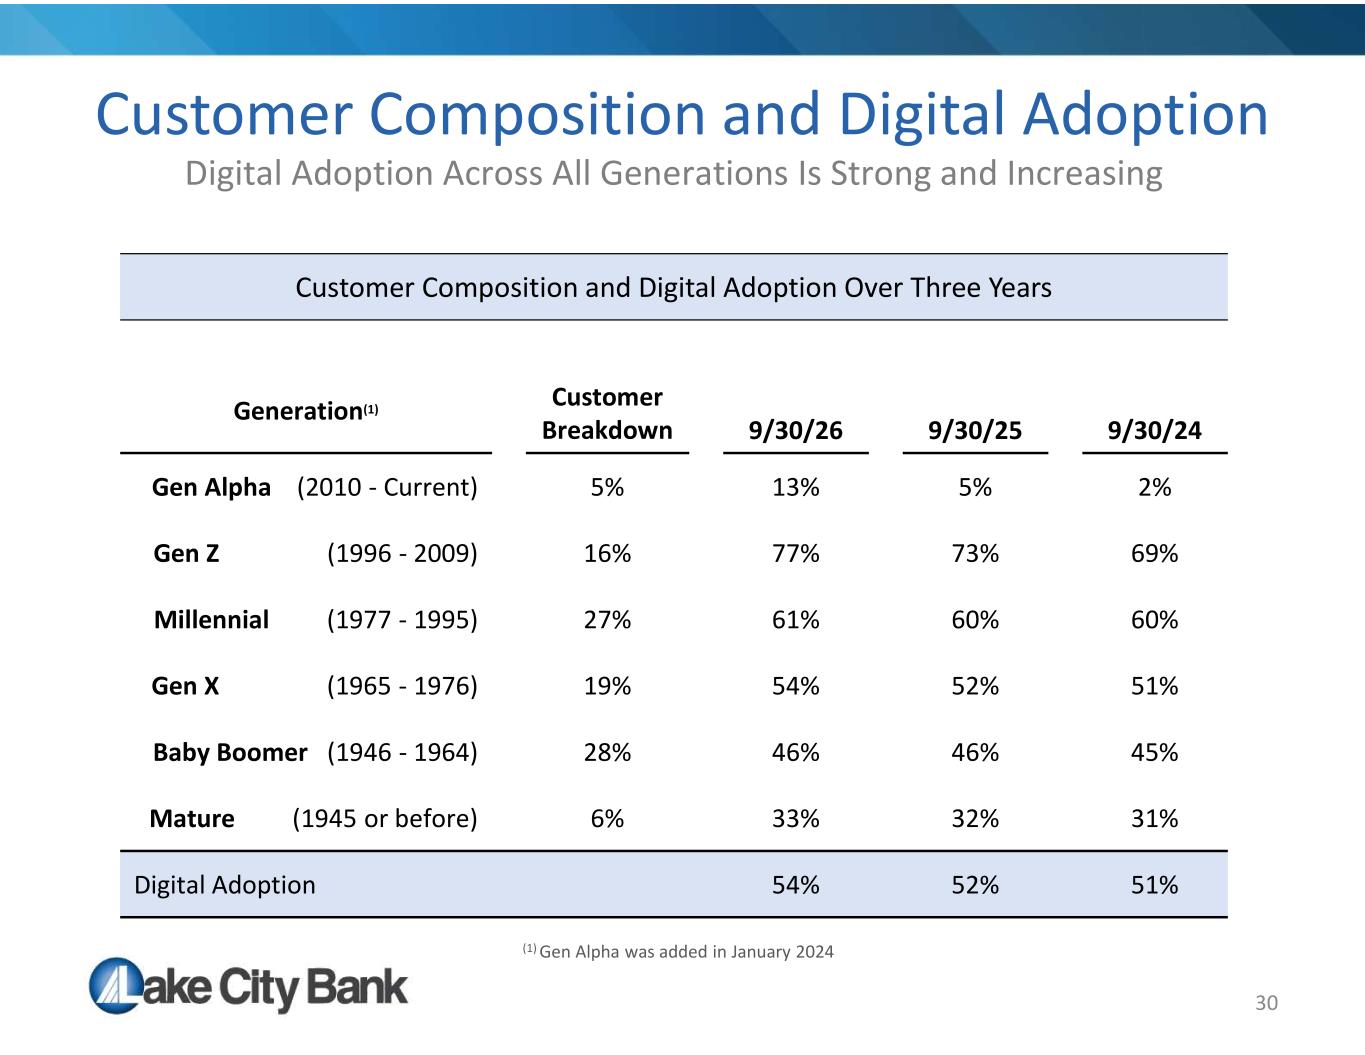
30 Customer Composition and Digital Adoption Digital Adoption Across All Generations Is Strong and Increasing Customer Composition and Digital Adoption Over Three Years 9/30/249/30/259/30/26 Customer Breakdown Generation(1) 2%5%13%5%Gen Alpha (2010 - Current) 69%73%77%16%Gen Z (1996 - 2009) 60%60%61%27%Millennial (1977 - 1995) 51%52%54%19%Gen X (1965 - 1976) 45%46%46%28%Baby Boomer (1946 - 1964) 31%32%33%6%Mature (1945 or before) 51%52%54%Digital Adoption (1) Gen Alpha was added in January 2024
Financial Performance
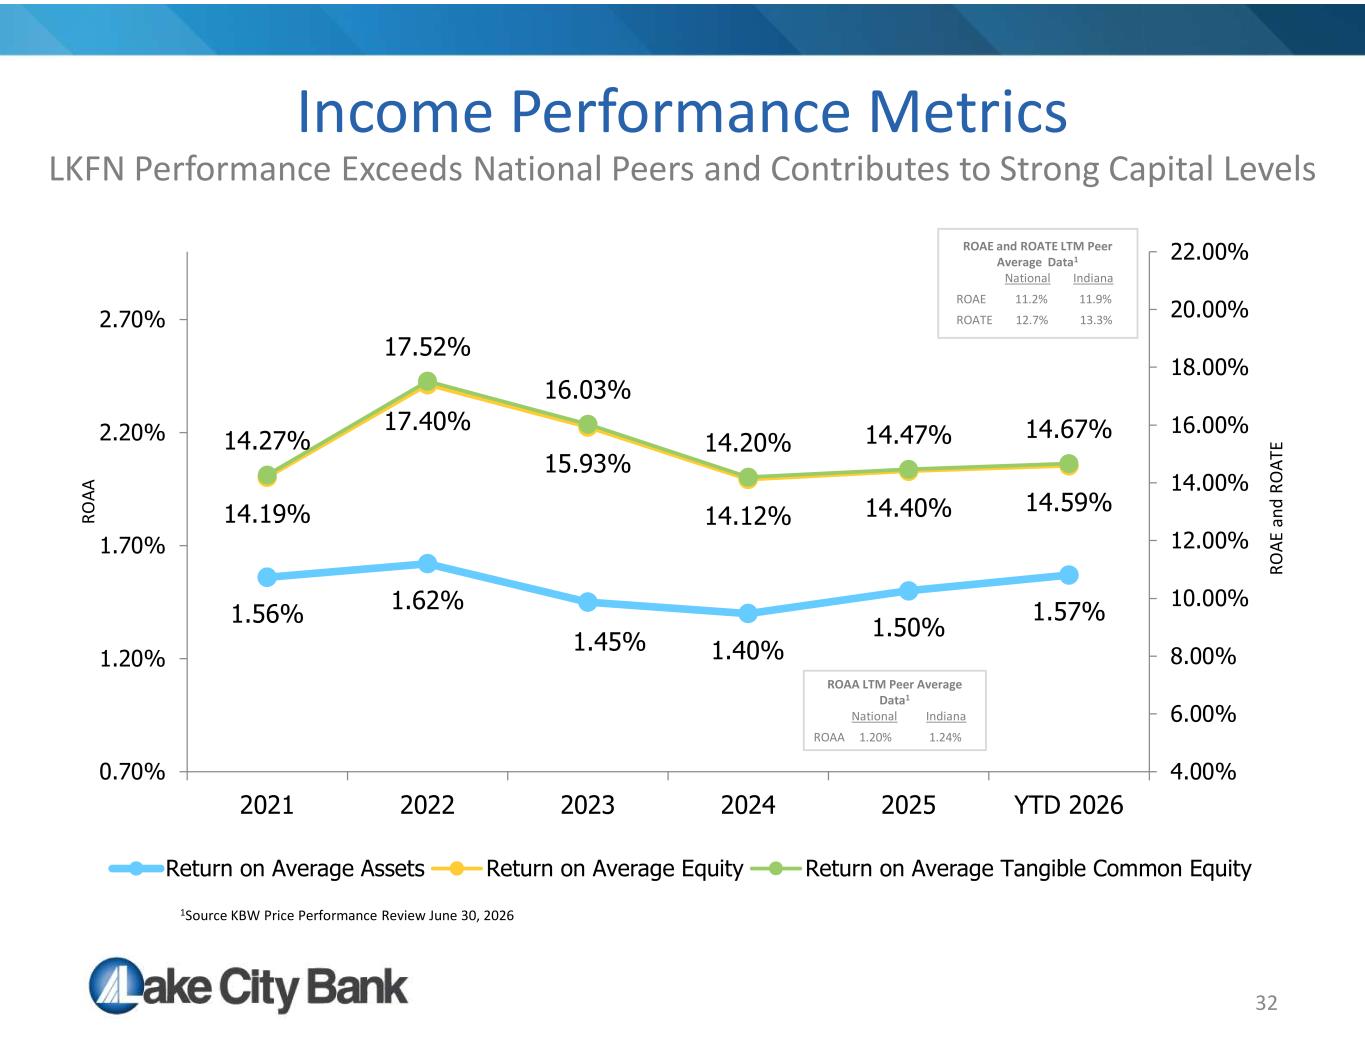
32 Income Performance Metrics LKFN Performance Exceeds National Peers and Contributes to Strong Capital Levels 1.56% 1.62% 1.45% 1.40% 1.50% 1.57% 14.19% 17.40% 15.93% 14.12% 14.40% 14.59% 14.27% 17.52% 16.03% 14.20% 14.47% 14.67% 4.00% 6.00% 8.00% 10.00% 12.00% 14.00% 16.00% 18.00% 20.00% 22.00% 0.70% 1.20% 1.70% 2.20% 2.70% 2021 2022 2023 2024 2025 YTD 2026 Return on Average Assets Return on Average Equity Return on Average Tangible Common Equity RO AA RO AE a nd R O AT E 1Source KBW Price Performance Review June 30, 2026 ROAE and ROATE LTM Peer Average Data1 National Indiana ROAE 11.2% 11.9% ROATE 12.7% 13.3% ROAA LTM Peer Average Data1 National Indiana ROAA 1.20% 1.24%
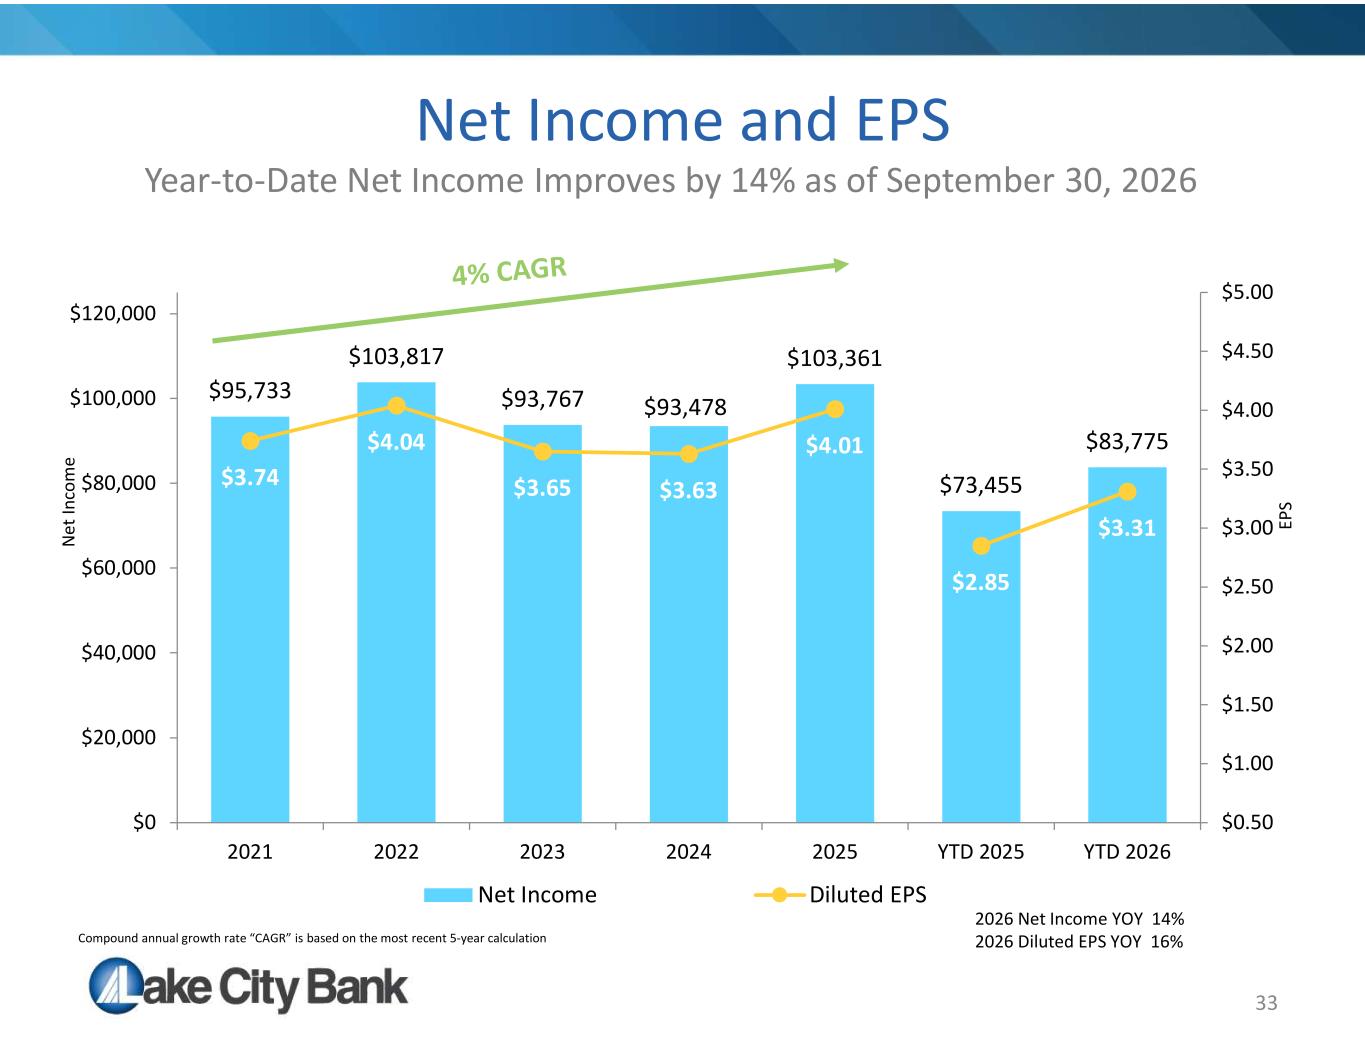
33 Net Income and EPS Year-to-Date Net Income Improves by 14% as of September 30, 2026 $95,733 $103,817 $93,767 $93,478 $103,361 $73,455 $83,775 $3.74 $4.04 $3.65 $3.63 $4.01 $2.85 $3.31 $0.50 $1.00 $1.50 $2.00 $2.50 $3.00 $3.50 $4.00 $4.50 $5.00 $0 $20,000 $40,000 $60,000 $80,000 $100,000 $120,000 2021 2022 2023 2024 2025 YTD 2025 YTD 2026 Net Income Diluted EPS N et In co m e EP S 2026 Net Income YOY 14% 2026 Diluted EPS YOY 16%Compound annual growth rate “CAGR” is based on the most recent 5-year calculation
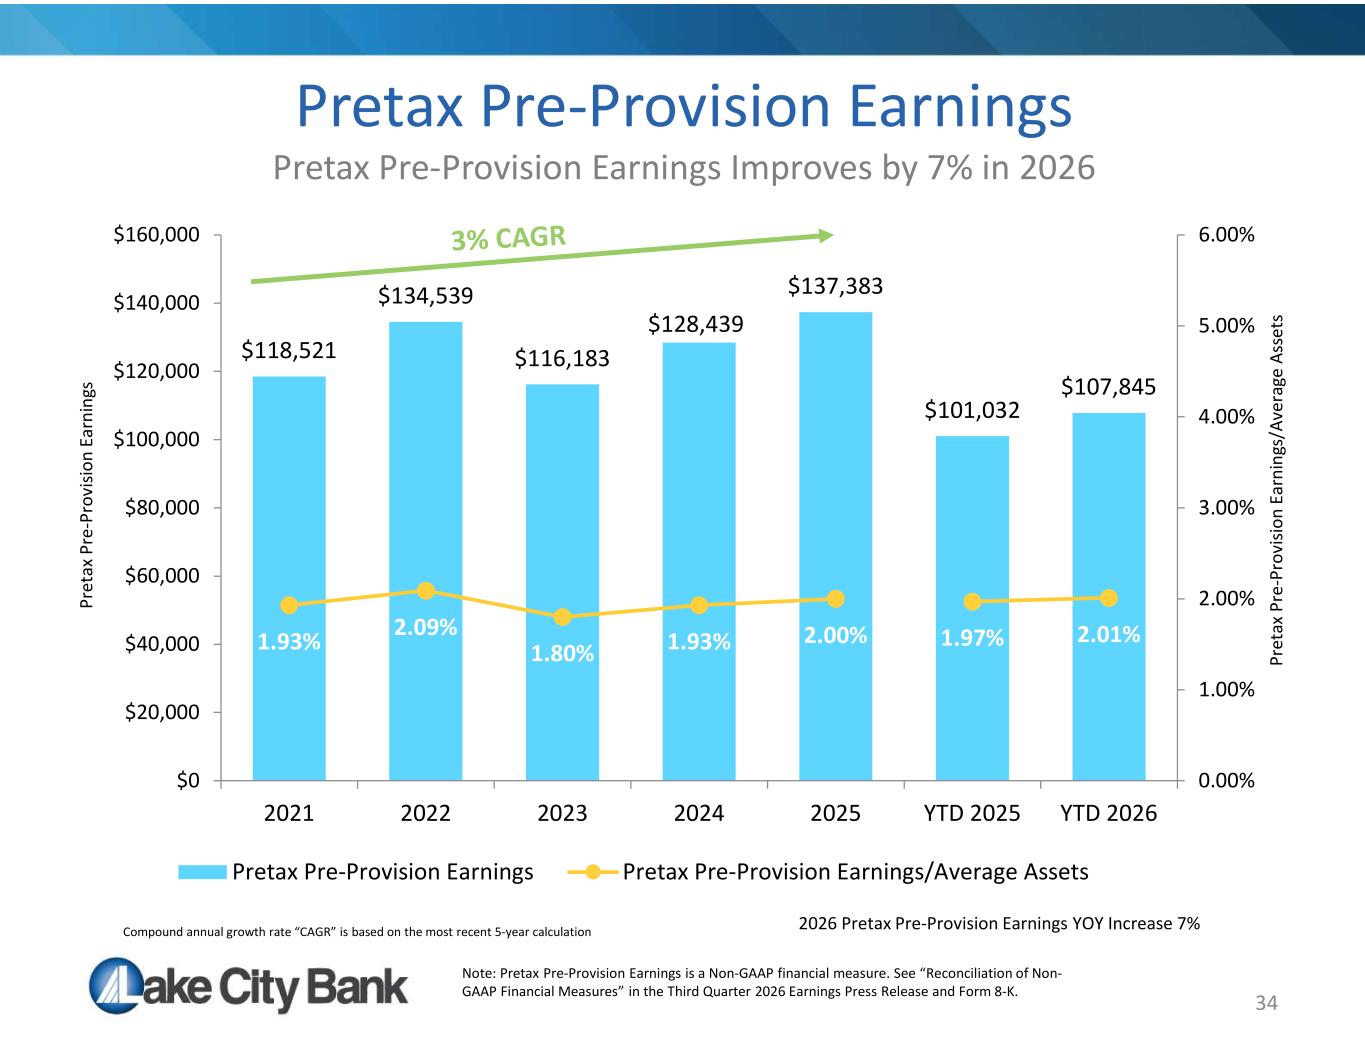
34 Pretax Pre-Provision Earnings Pretax Pre-Provision Earnings Improves by 7% in 2026 $118,521 $134,539 $116,183 $128,439 $137,383 $101,032 $107,845 1.93% 2.09% 1.80% 1.93% 2.00% 1.97% 2.01% 0.00% 1.00% 2.00% 3.00% 4.00% 5.00% 6.00% $0 $20,000 $40,000 $60,000 $80,000 $100,000 $120,000 $140,000 $160,000 2021 2022 2023 2024 2025 YTD 2025 YTD 2026 Pretax Pre-Provision Earnings Pretax Pre-Provision Earnings/Average Assets Pr et ax P re -P ro vi si on E ar ni ng s Pr et ax P re -P ro vi si on E ar ni ng s/ Av er ag e As se ts Note: Pretax Pre-Provision Earnings is a Non-GAAP financial measure. See “Reconciliation of Non- GAAP Financial Measures” in the Third Quarter 2026 Earnings Press Release and Form 8-K. 2026 Pretax Pre-Provision Earnings YOY Increase 7%Compound annual growth rate “CAGR” is based on the most recent 5-year calculation
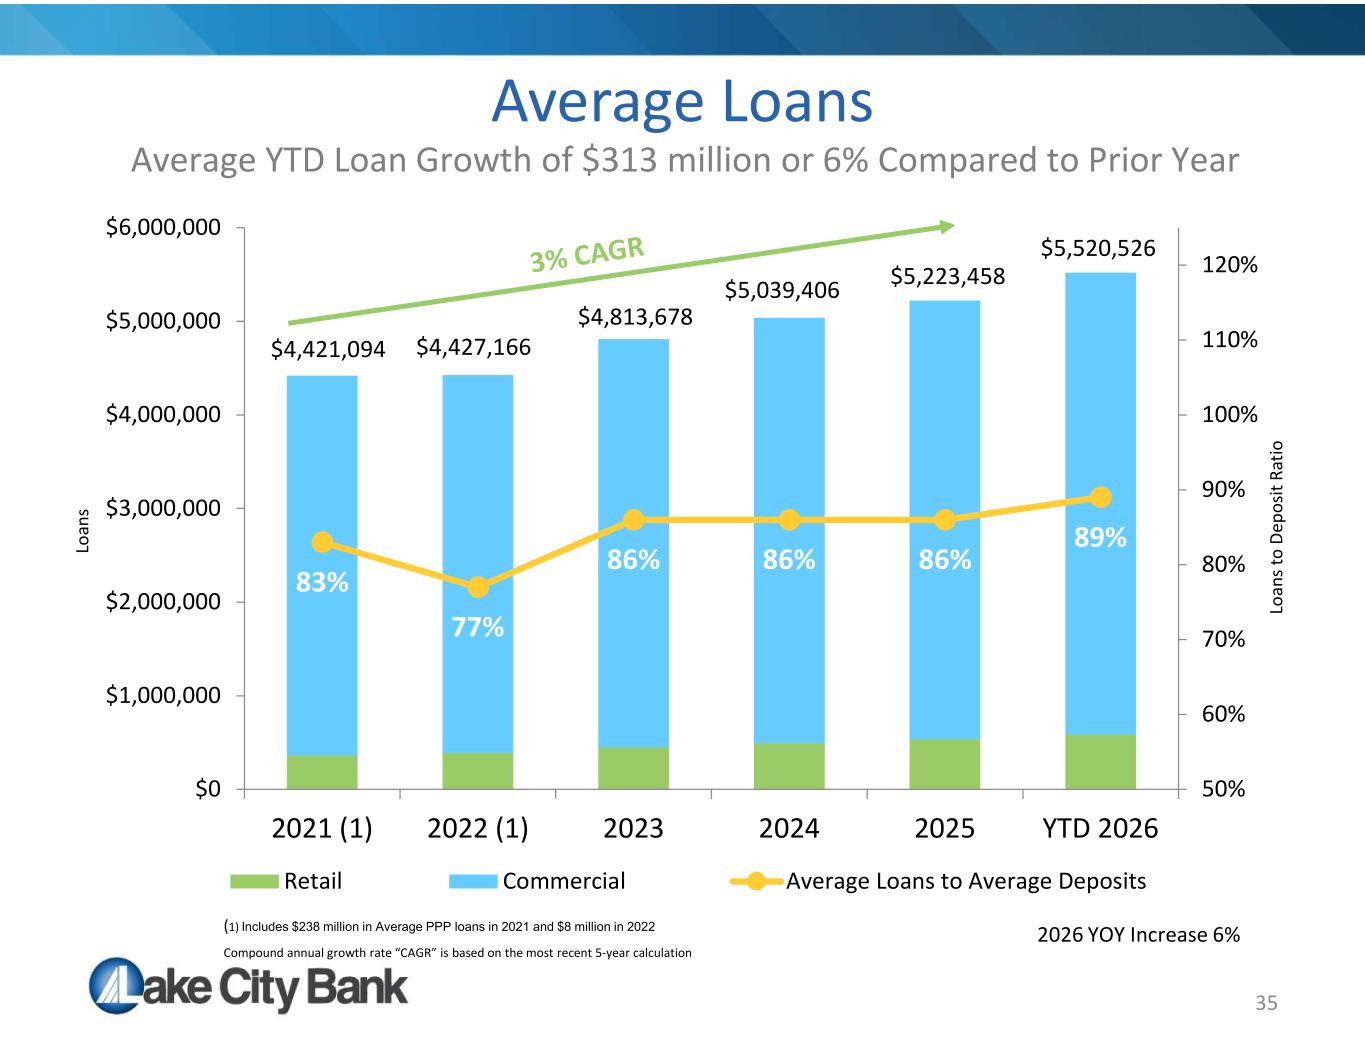
35 Average Loans Average YTD Loan Growth of $313 million or 6% Compared to Prior Year 83% 77% 86% 86% 86% 89% 50% 60% 70% 80% 90% 100% 110% 120% $0 $1,000,000 $2,000,000 $3,000,000 $4,000,000 $5,000,000 $6,000,000 2021 (1) 2022 (1) 2023 2024 2025 YTD 2026 Retail Commercial Average Loans to Average Deposits Lo an s Lo an s to D ep os it Ra tio (1) Includes $238 million in Average PPP loans in 2021 and $8 million in 2022 2026 YOY Increase 6% $4,421,094 $4,427,166 $4,813,678 $5,039,406 Compound annual growth rate “CAGR” is based on the most recent 5-year calculation $5,223,458 $5,520,526
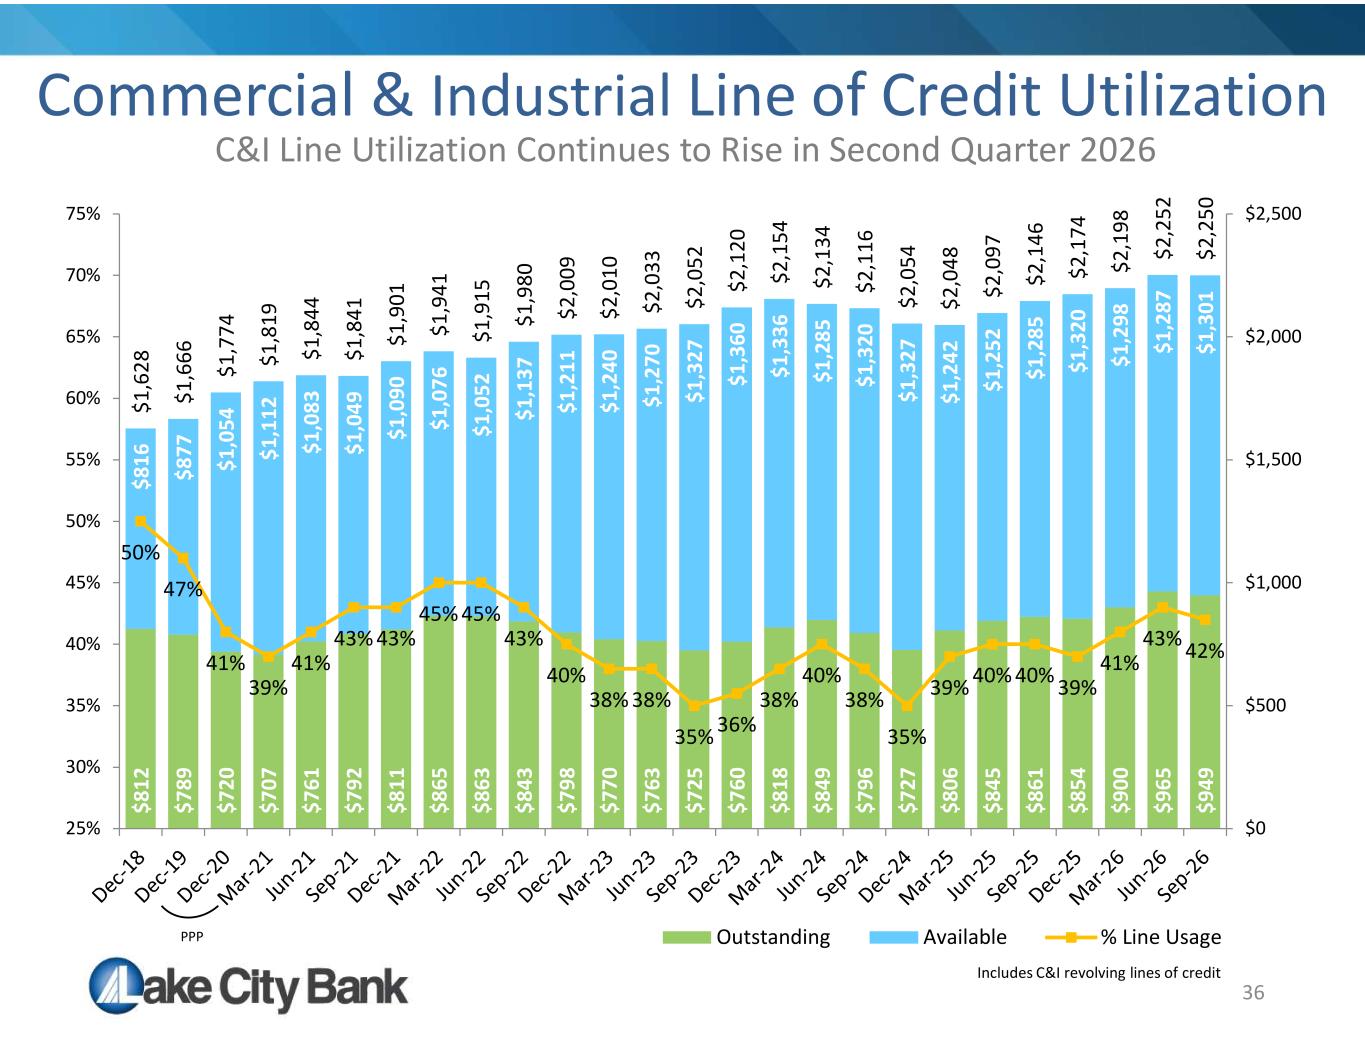
$8 12 $7 89 $7 20 $7 07 $7 61 $7 92 $8 11 $8 65 $8 63 $8 43 $7 98 $7 70 $7 63 $7 25 $7 60 $8 18 $8 49 $7 96 $7 27 $8 06 $8 45 $8 61 $8 54 $9 00 $9 65 $9 49 $8 16 $8 77 $1 ,0 54 $1 ,1 12 $1 ,0 83 $1 ,0 49 $1 ,0 90 $1 ,0 76 $1 ,0 52 $1 ,1 37 $1 ,2 11 $1 ,2 40 $1 ,2 70 $1 ,3 27 $1 ,3 60 $1 ,3 36 $1 ,2 85 $1 ,3 20 $1 ,3 27 $1 ,2 42 $1 ,2 52 $1 ,2 85 $1 ,3 20 $1 ,2 98 $1 ,2 87 $1 ,3 01 $1 ,6 28 $1 ,6 66 $1 ,7 74 $1 ,8 19 $1 ,8 44 $1 ,8 41 $1 ,9 01 $1 ,9 41 $1 ,9 15 $1 ,9 80 $2 ,0 09 $2 ,0 10 $2 ,0 33 $2 ,0 52 $2 ,1 20 $2 ,1 54 $2 ,1 34 $2 ,1 16 $2 ,0 54 $2 ,0 48 $2 ,0 97 $2 ,1 46 $2 ,1 74 $2 ,1 98 $2 ,2 52 $2 ,2 50 50% 47% 41% 39% 41% 43% 43% 45% 45% 43% 40% 38% 38% 35% 36% 38% 40% 38% 35% 39% 40% 40% 39% 41% 43% 42% $0 $500 $1,000 $1,500 $2,000 $2,500 25% 30% 35% 40% 45% 50% 55% 60% 65% 70% 75% Outstanding Available % Line UsagePPP 36 Includes C&I revolving lines of credit Commercial & Industrial Line of Credit Utilization C&I Line Utilization Continues to Rise in Second Quarter 2026
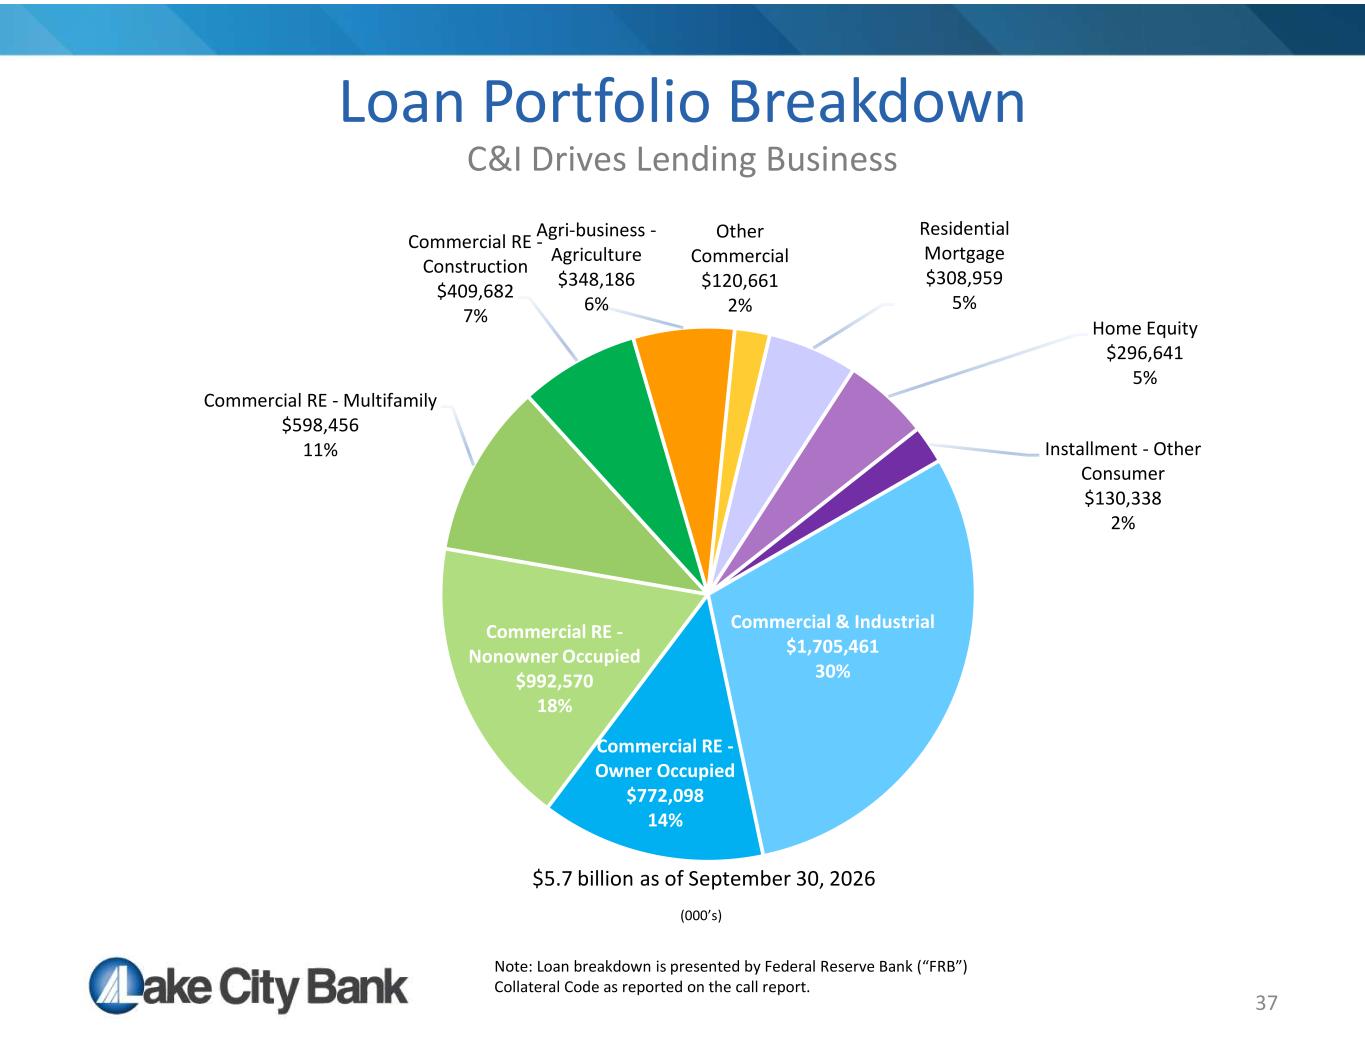
37 Loan Portfolio Breakdown C&I Drives Lending Business Commercial & Industrial $1,705,461 30% Commercial RE - Owner Occupied $772,098 14% Commercial RE - Nonowner Occupied $992,570 18% Commercial RE - Multifamily $598,456 11% Commercial RE - Construction $409,682 7% Agri-business - Agriculture $348,186 6% Other Commercial $120,661 2% Residential Mortgage $308,959 5% Home Equity $296,641 5% Installment - Other Consumer $130,338 2% $5.7 billion as of September 30, 2026 (000’s) Note: Loan breakdown is presented by Federal Reserve Bank (“FRB”) Collateral Code as reported on the call report.
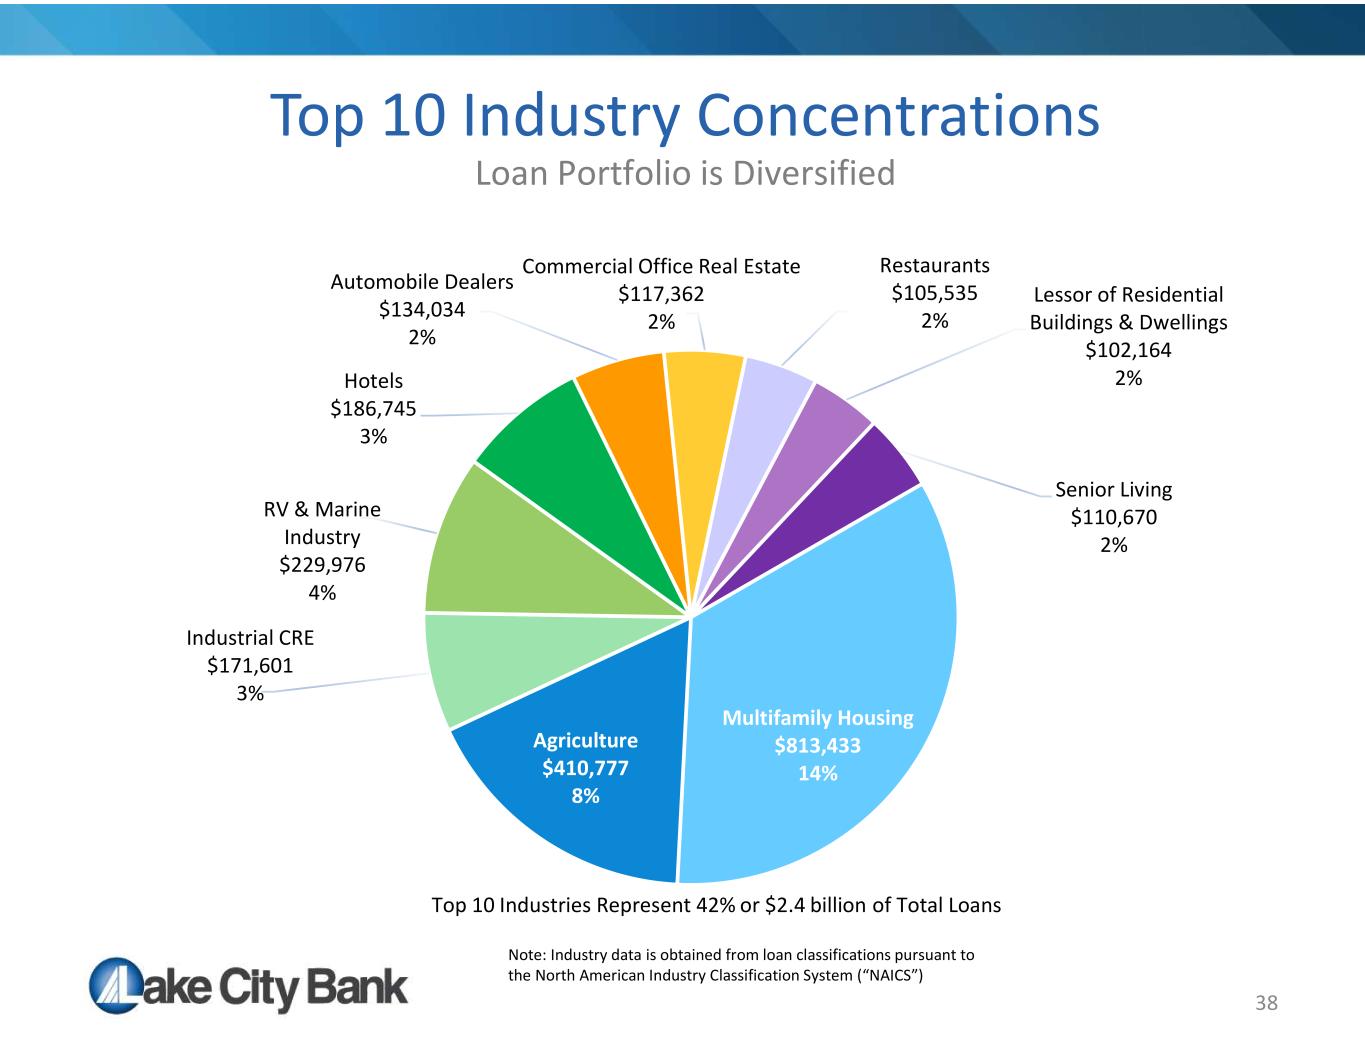
Multifamily Housing $813,433 14% Agriculture $410,777 8% Industrial CRE $171,601 3% RV & Marine Industry $229,976 4% Hotels $186,745 3% Automobile Dealers $134,034 2% Commercial Office Real Estate $117,362 2% Restaurants $105,535 2% Lessor of Residential Buildings & Dwellings $102,164 2% Senior Living $110,670 2% 38 Top 10 Industry Concentrations Loan Portfolio is Diversified Top 10 Industries Represent 42% or $2.4 billion of Total Loans Note: Industry data is obtained from loan classifications pursuant to the North American Industry Classification System (“NAICS”)
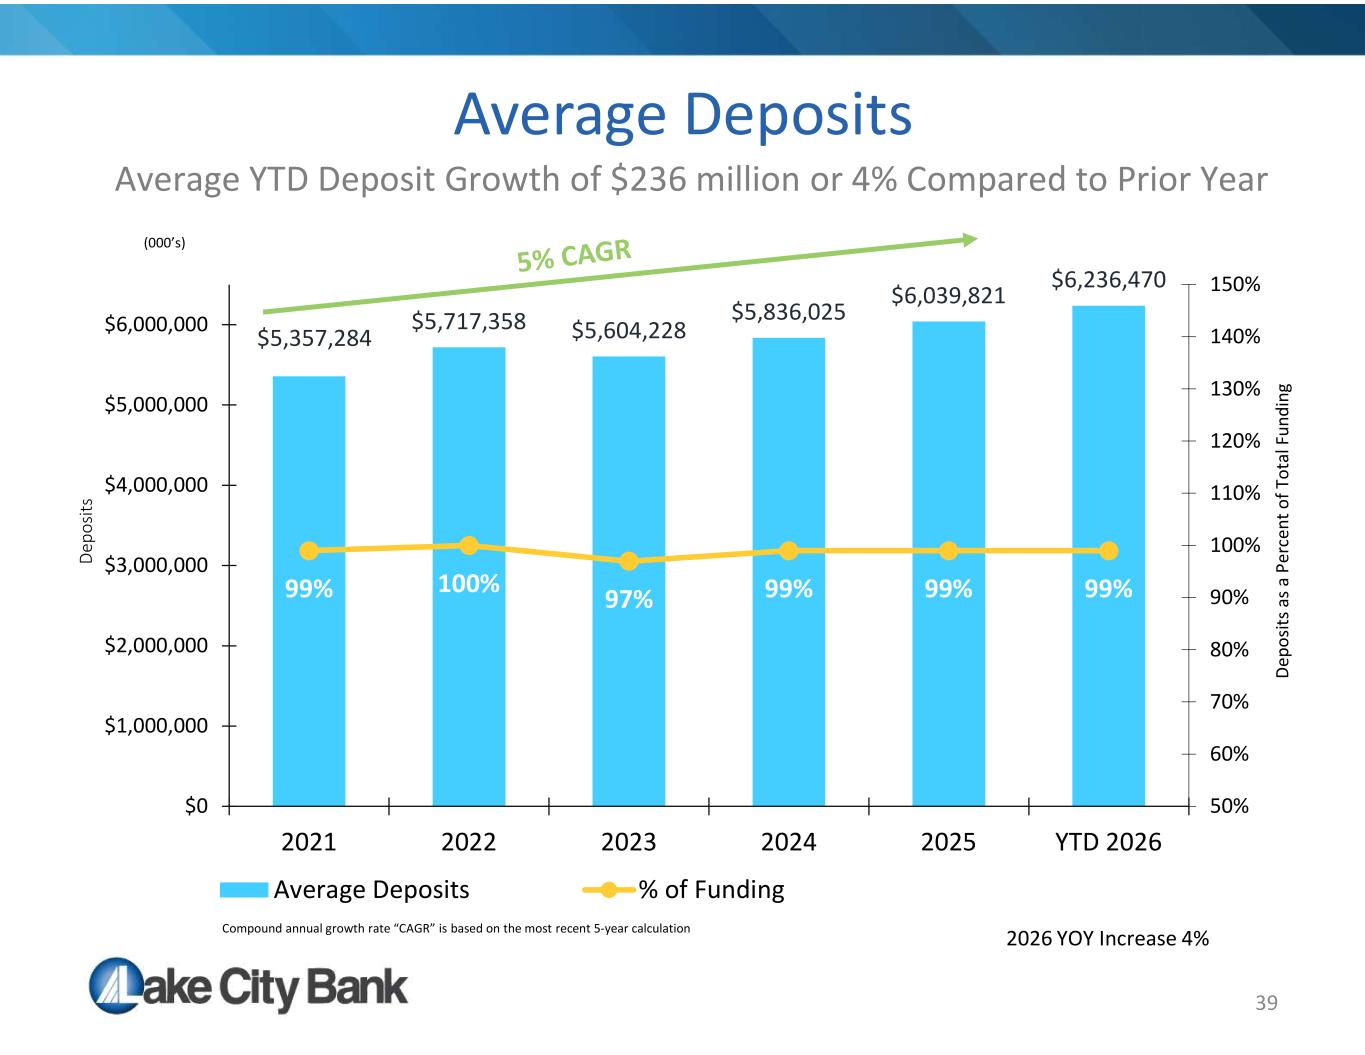
$5,357,284 $5,717,358 $5,604,228 $5,836,025 $6,039,821 $6,236,470 99% 100% 97% 99% 99% 99% 50% 60% 70% 80% 90% 100% 110% 120% 130% 140% 150% $0 $1,000,000 $2,000,000 $3,000,000 $4,000,000 $5,000,000 $6,000,000 2021 2022 2023 2024 2025 YTD 2026 Average Deposits % of Funding 39 Average Deposits Average YTD Deposit Growth of $236 million or 4% Compared to Prior Year De po sit s D ep os its a s a Pe rc en t o f T ot al F un di ng (000’s) 2026 YOY Increase 4%Compound annual growth rate “CAGR” is based on the most recent 5-year calculation
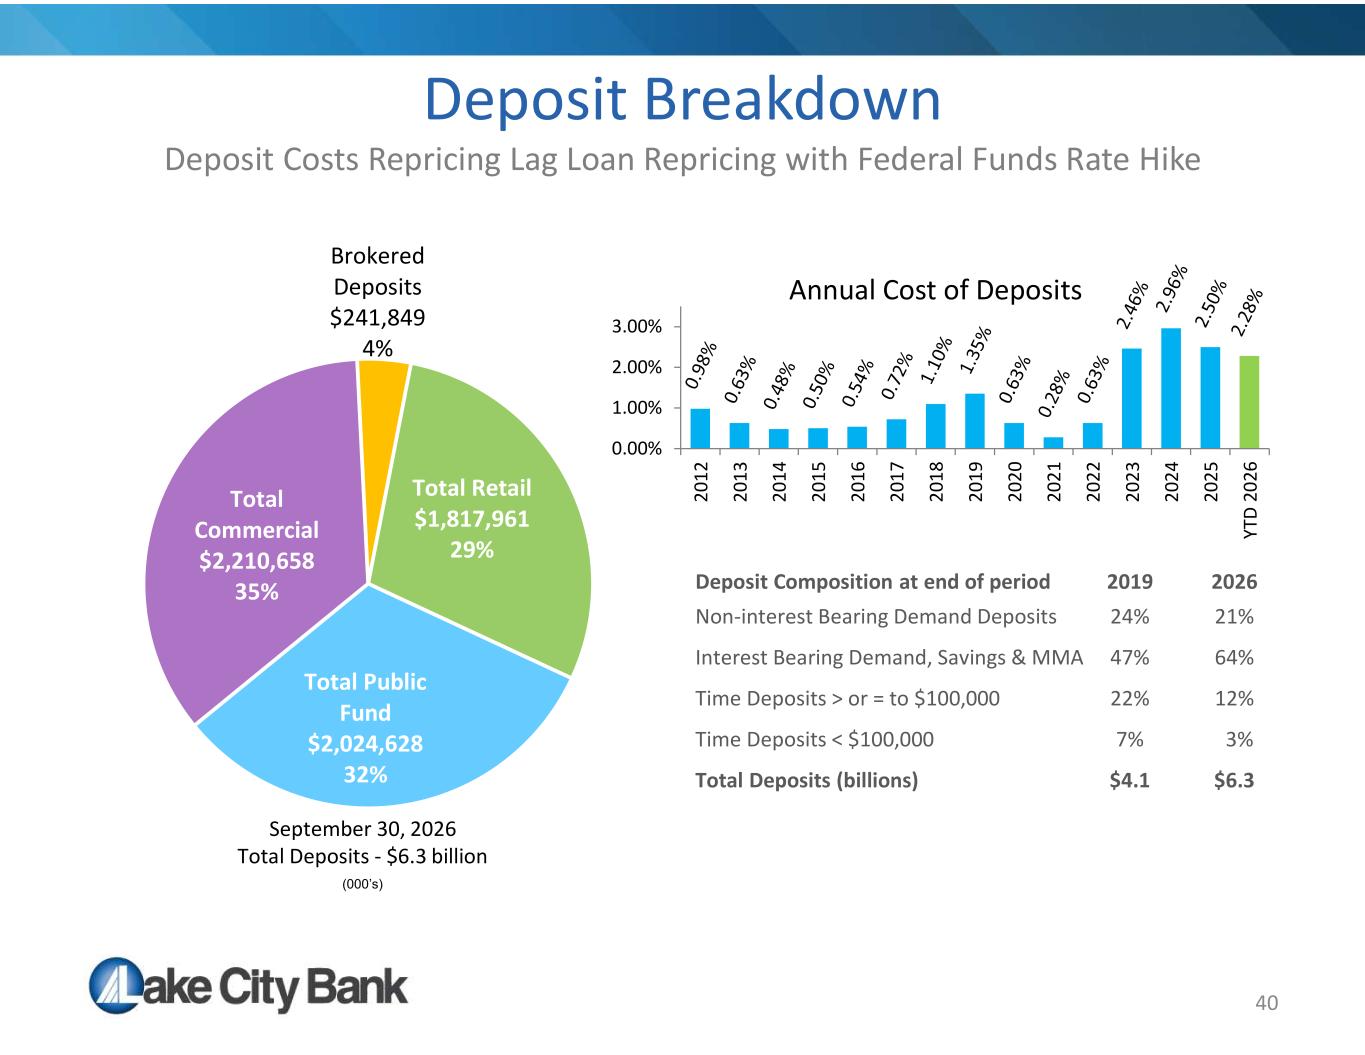
40 Deposit Breakdown Deposit Costs Repricing Lag Loan Repricing with Federal Funds Rate Hike Total Retail $1,817,961 29% Total Public Fund $2,024,628 32% Total Commercial $2,210,658 35% Brokered Deposits $241,849 4% September 30, 2026 Total Deposits - $6.3 billion (000’s) 0.00% 1.00% 2.00% 3.00% 20 12 20 13 20 14 20 15 20 16 20 17 20 18 20 19 20 20 20 21 20 22 20 23 20 24 20 25 YT D 20 26 Annual Cost of Deposits 20262019Deposit Composition at end of period 21%24%Non-interest Bearing Demand Deposits 64%47%Interest Bearing Demand, Savings & MMA 12%22%Time Deposits > or = to $100,000 3%7%Time Deposits < $100,000 $6.3$4.1Total Deposits (billions)
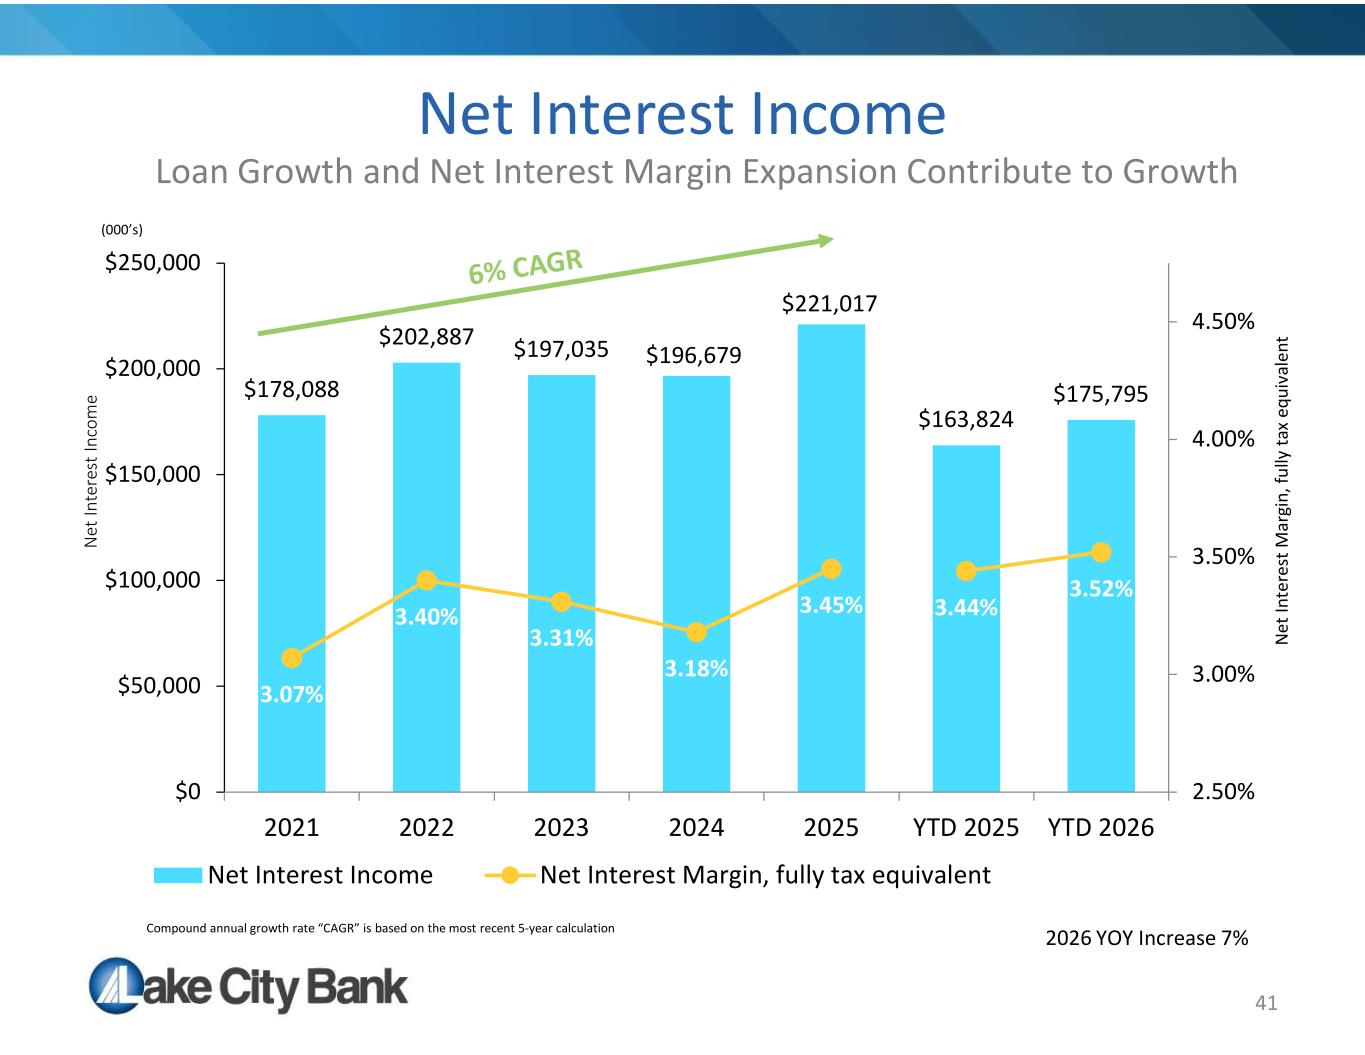
41 Net Interest Income Loan Growth and Net Interest Margin Expansion Contribute to Growth $178,088 $202,887 $197,035 $196,679 $221,017 $163,824 $175,795 3.07% 3.40% 3.31% 3.18% 3.45% 3.44% 3.52% 2.50% 3.00% 3.50% 4.00% 4.50% $0 $50,000 $100,000 $150,000 $200,000 $250,000 2021 2022 2023 2024 2025 YTD 2025 YTD 2026 Net Interest Income Net Interest Margin, fully tax equivalent (000’s) N et In te re st In co m e N et In te re st M ar gi n, fu lly ta x eq ui va le nt 2026 YOY Increase 7%Compound annual growth rate “CAGR” is based on the most recent 5-year calculation
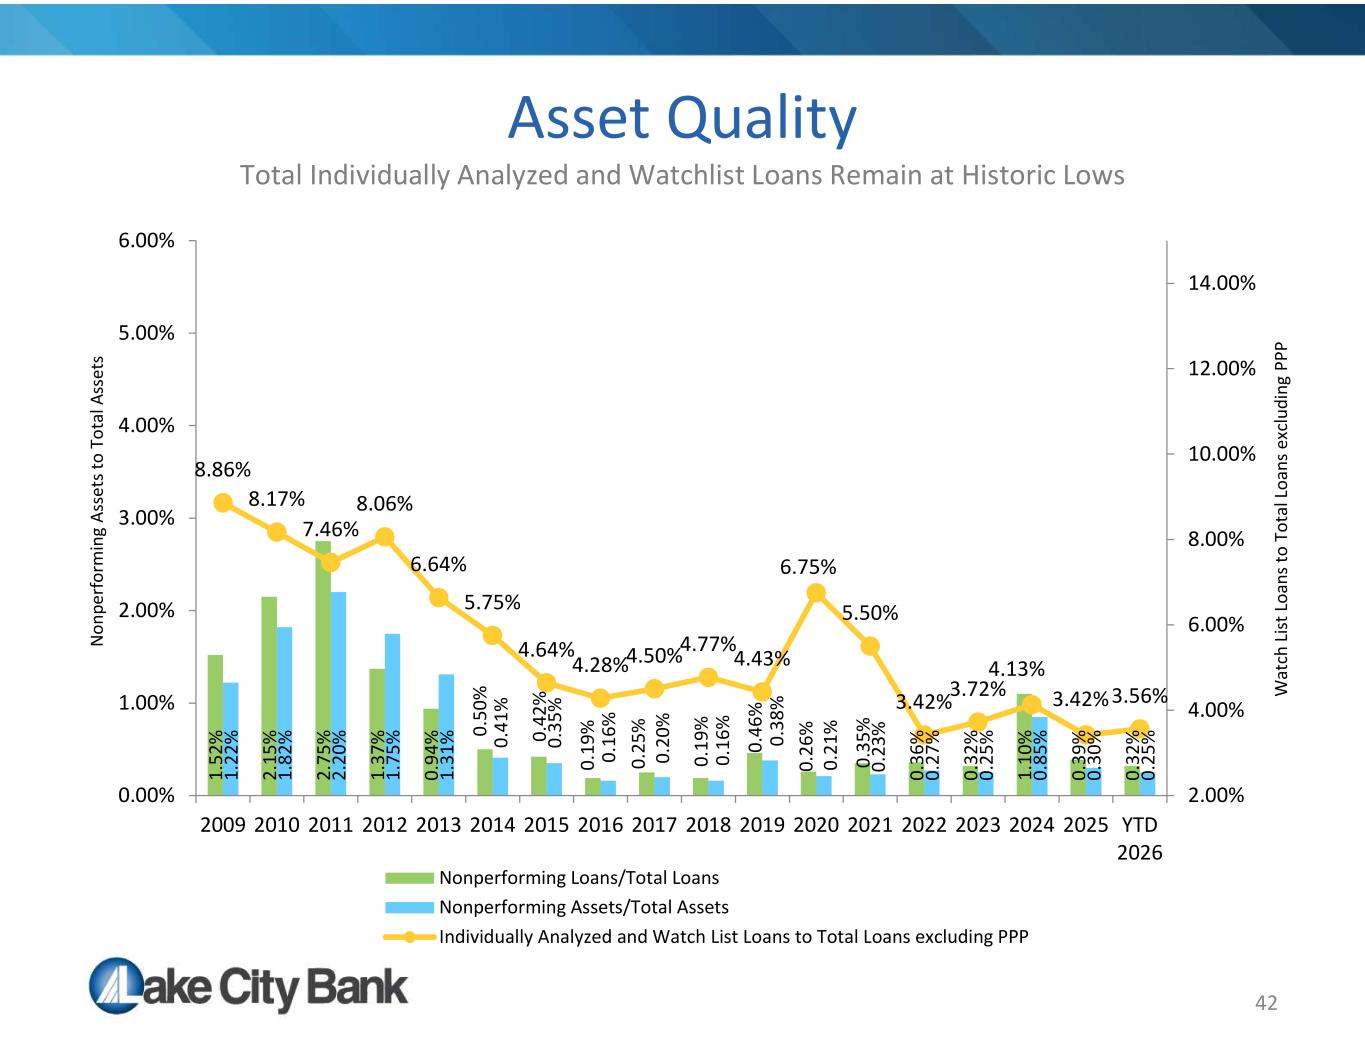
42 Asset Quality Total Individually Analyzed and Watchlist Loans Remain at Historic Lows 1. 52 % 2. 15 % 2. 75 % 1. 37 % 0. 94 % 0. 50 % 0. 42 % 0. 19 % 0. 25 % 0. 19 % 0. 46 % 0. 26 % 0. 35 % 0. 36 % 0. 32 % 1. 10 % 0. 39 % 0. 32 % 1. 22 % 1. 82 % 2. 20 % 1. 75 % 1. 31 % 0. 41 % 0. 35 % 0. 16 % 0. 20 % 0. 16 % 0. 38 % 0. 21 % 0. 23 % 0. 27 % 0. 25 % 0. 85 % 0. 30 % 0. 25 % 8.86% 8.17% 7.46% 8.06% 6.64% 5.75% 4.64% 4.28%4.50%4.77% 4.43% 6.75% 5.50% 3.42%3.72% 4.13% 3.42%3.56% 2.00% 4.00% 6.00% 8.00% 10.00% 12.00% 14.00% 0.00% 1.00% 2.00% 3.00% 4.00% 5.00% 6.00% 2009 2010 2011 2012 2013 2014 2015 2016 2017 2018 2019 2020 2021 2022 2023 2024 2025 YTD 2026 Nonperforming Loans/Total Loans Nonperforming Assets/Total Assets Individually Analyzed and Watch List Loans to Total Loans excluding PPP N on pe rf or m in g As se ts to T ot al A ss et s W at ch L is t L oa ns to T ot al L oa ns e xc lu di ng P PP
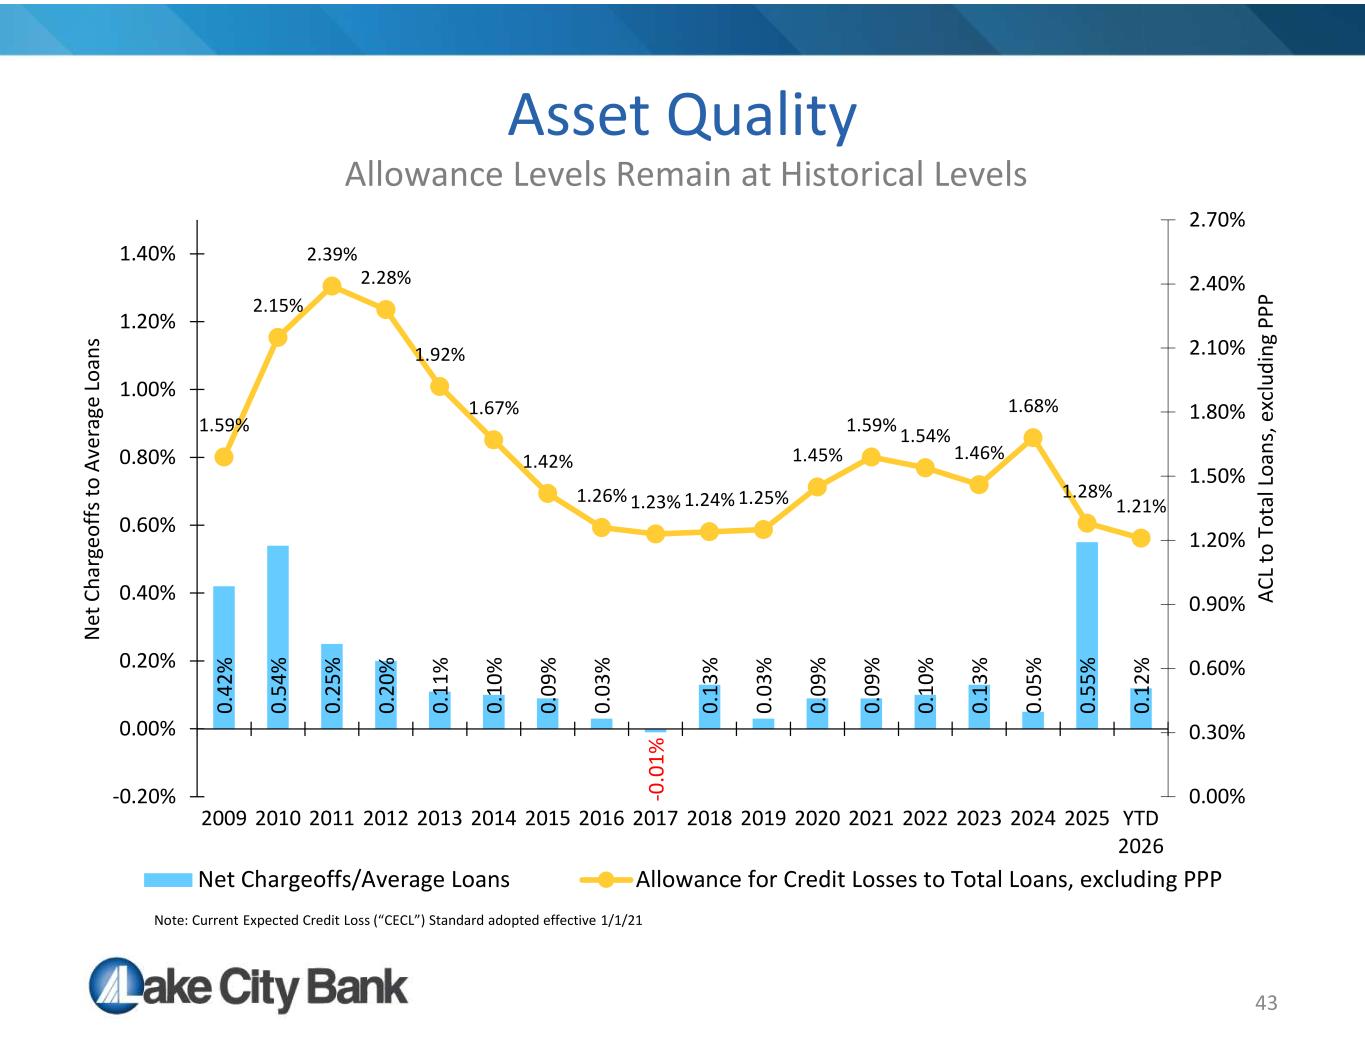
43 Asset Quality Allowance Levels Remain at Historical Levels 0. 42 % 0. 54 % 0. 25 % 0. 20 % 0. 11 % 0. 10 % 0. 09 % 0. 03 % -0 .0 1% 0. 13 % 0. 03 % 0. 09 % 0. 09 % 0. 10 % 0. 13 % 0. 05 % 0. 55 % 0. 12 % 1.59% 2.15% 2.39% 2.28% 1.92% 1.67% 1.42% 1.26% 1.23% 1.24% 1.25% 1.45% 1.59% 1.54% 1.46% 1.68% 1.28% 1.21% 0.00% 0.30% 0.60% 0.90% 1.20% 1.50% 1.80% 2.10% 2.40% 2.70% -0.20% 0.00% 0.20% 0.40% 0.60% 0.80% 1.00% 1.20% 1.40% 2009 2010 2011 2012 2013 2014 2015 2016 2017 2018 2019 2020 2021 2022 2023 2024 2025 YTD 2026 AC L to T ot al L oa ns , e xc lu di ng P PP N et C ha rg eo ff s to A ve ra ge L oa ns Net Chargeoffs/Average Loans Allowance for Credit Losses to Total Loans, excluding PPP Note: Current Expected Credit Loss (“CECL”) Standard adopted effective 1/1/21
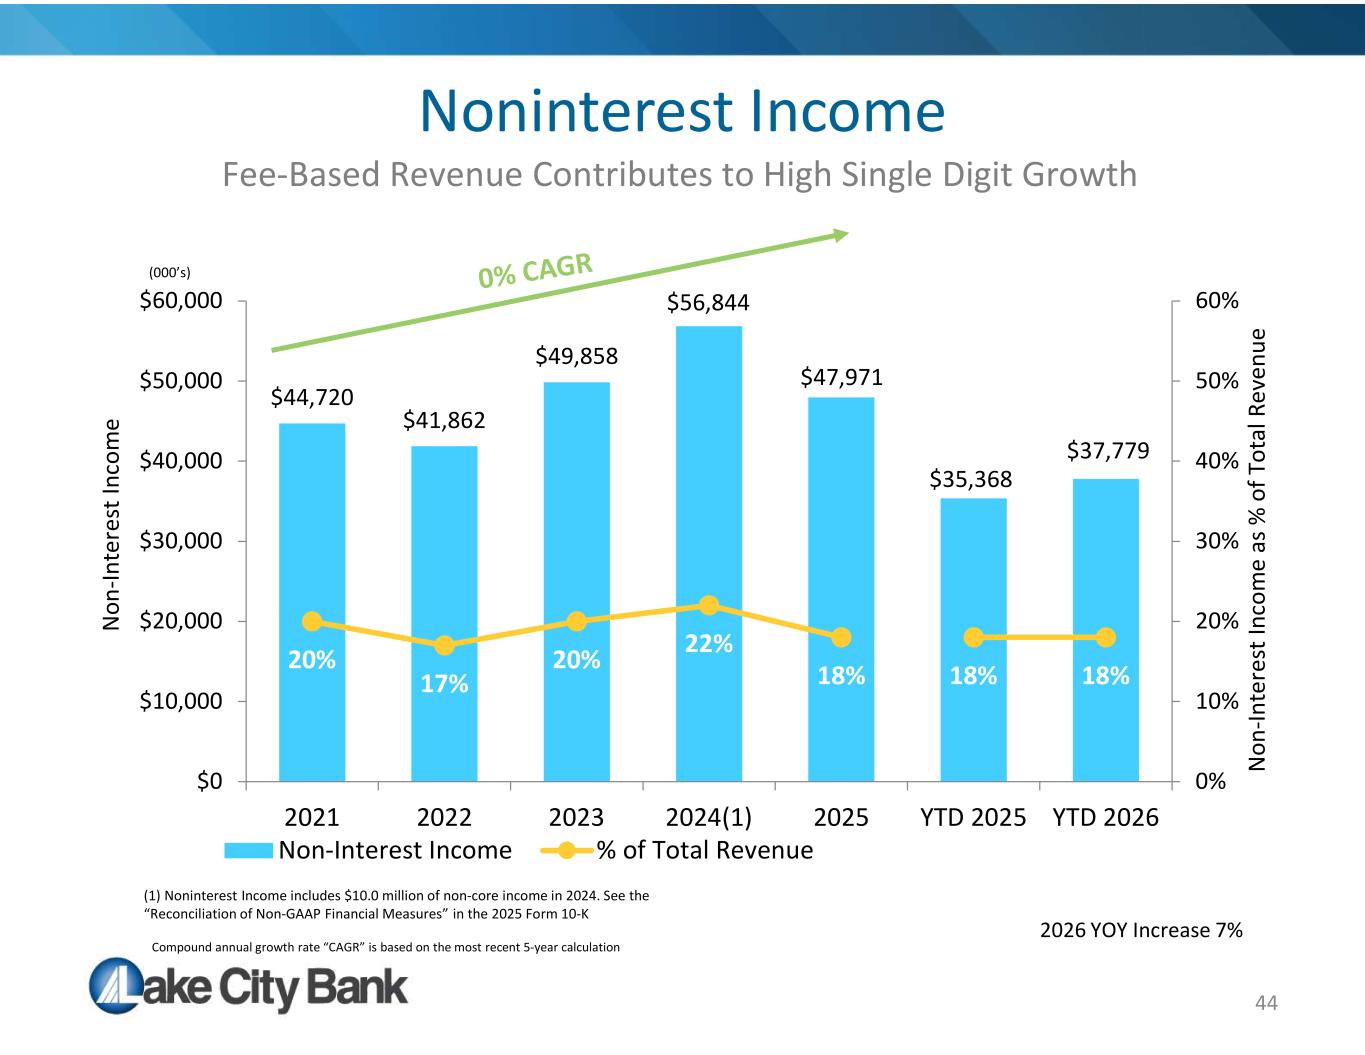
44 Noninterest Income Fee-Based Revenue Contributes to High Single Digit Growth $44,720 $41,862 $49,858 $56,844 $47,971 $35,368 $37,779 20% 17% 20% 22% 18% 18% 18% 0% 10% 20% 30% 40% 50% 60% $0 $10,000 $20,000 $30,000 $40,000 $50,000 $60,000 2021 2022 2023 2024(1) 2025 YTD 2025 YTD 2026 N on -In te re st In co m e as % o f T ot al R ev en ue N on -In te re st In co m e Non-Interest Income % of Total Revenue 2026 YOY Increase 7% (000’s) (1) Noninterest Income includes $10.0 million of non-core income in 2024. See the “Reconciliation of Non-GAAP Financial Measures” in the 2025 Form 10-K Compound annual growth rate “CAGR” is based on the most recent 5-year calculation
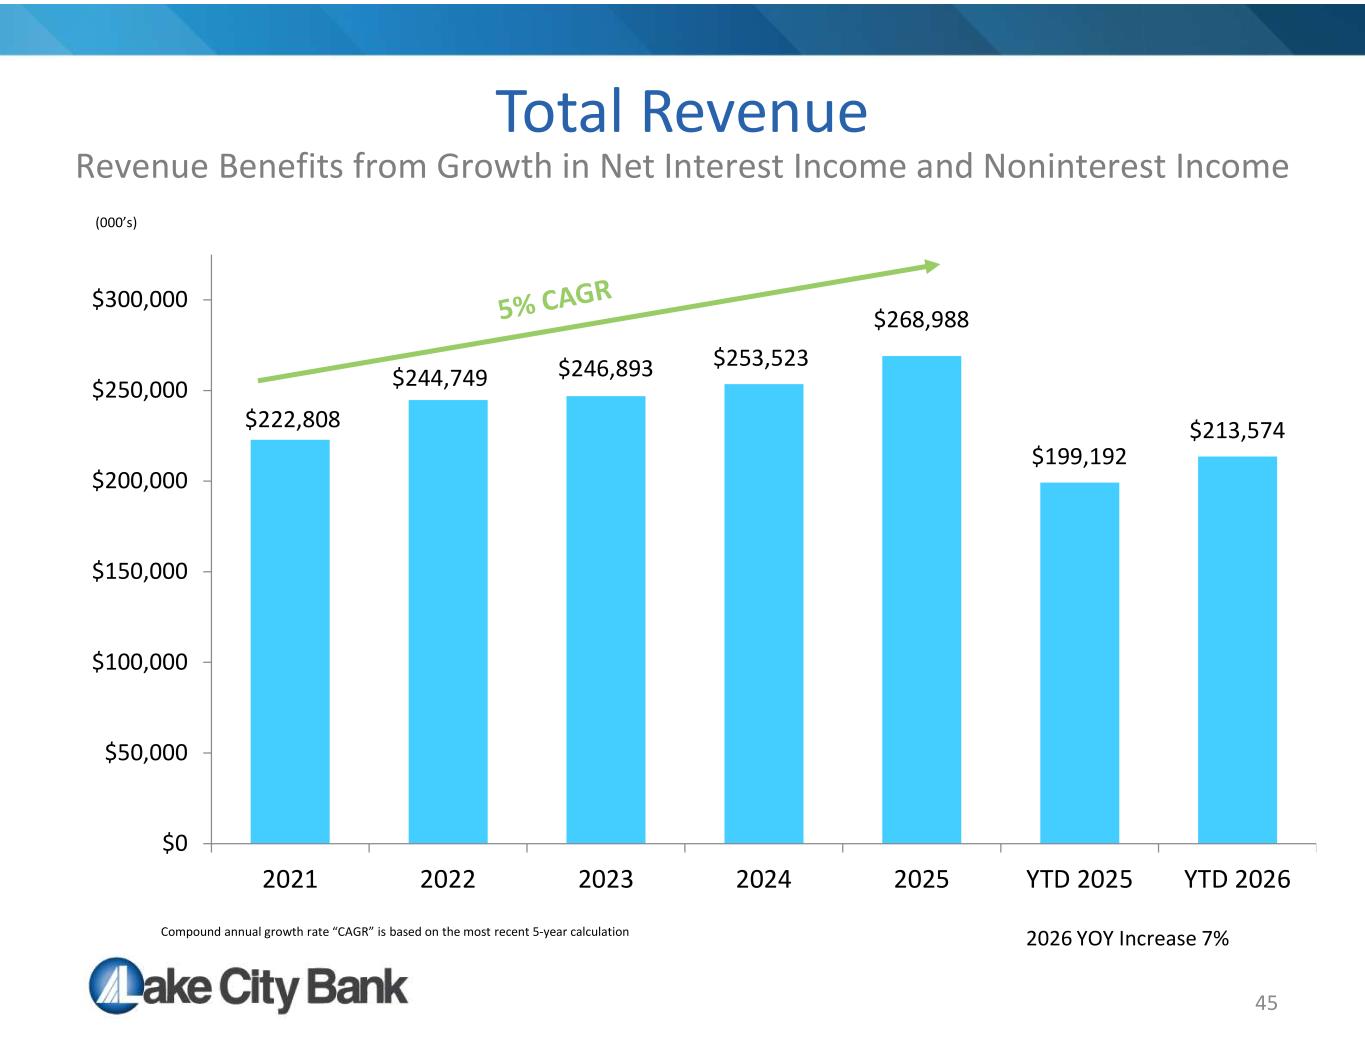
45 2026 YOY Increase 7% Total Revenue Revenue Benefits from Growth in Net Interest Income and Noninterest Income $222,808 $244,749 $246,893 $253,523 $268,988 $199,192 $213,574 $0 $50,000 $100,000 $150,000 $200,000 $250,000 $300,000 2021 2022 2023 2024 2025 YTD 2025 YTD 2026 (000’s) Compound annual growth rate “CAGR” is based on the most recent 5-year calculation
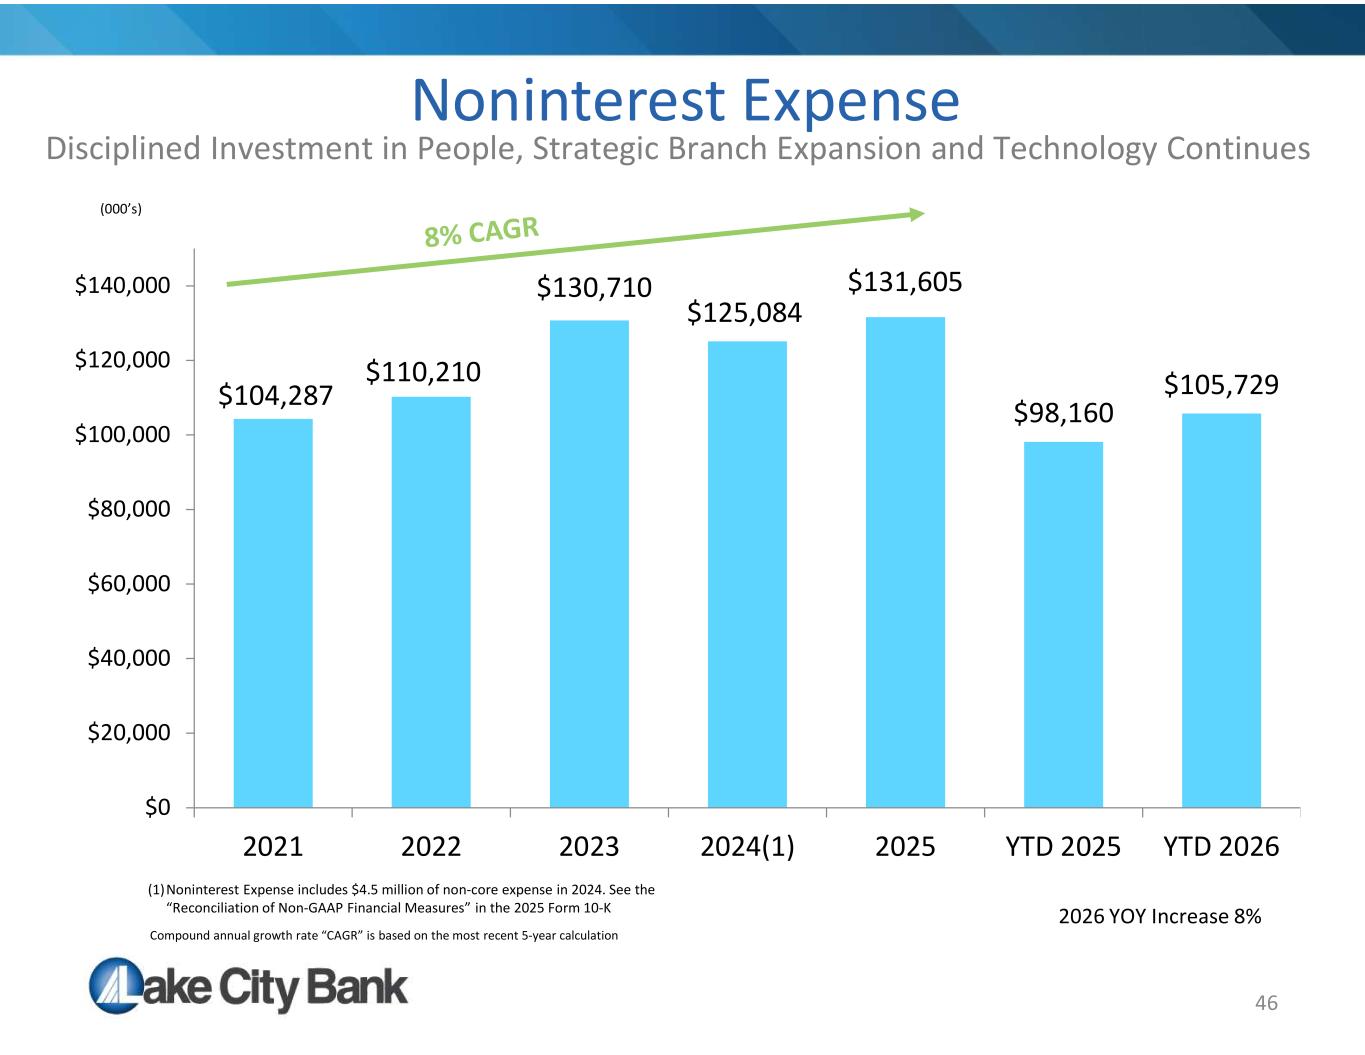
46 Noninterest Expense $104,287 $110,210 $130,710 $125,084 $131,605 $98,160 $105,729 $0 $20,000 $40,000 $60,000 $80,000 $100,000 $120,000 $140,000 2021 2022 2023 2024(1) 2025 YTD 2025 YTD 2026 (000’s) 2026 YOY Increase 8% Disciplined Investment in People, Strategic Branch Expansion and Technology Continues Compound annual growth rate “CAGR” is based on the most recent 5-year calculation (1)Noninterest Expense includes $4.5 million of non-core expense in 2024. See the “Reconciliation of Non-GAAP Financial Measures” in the 2025 Form 10-K
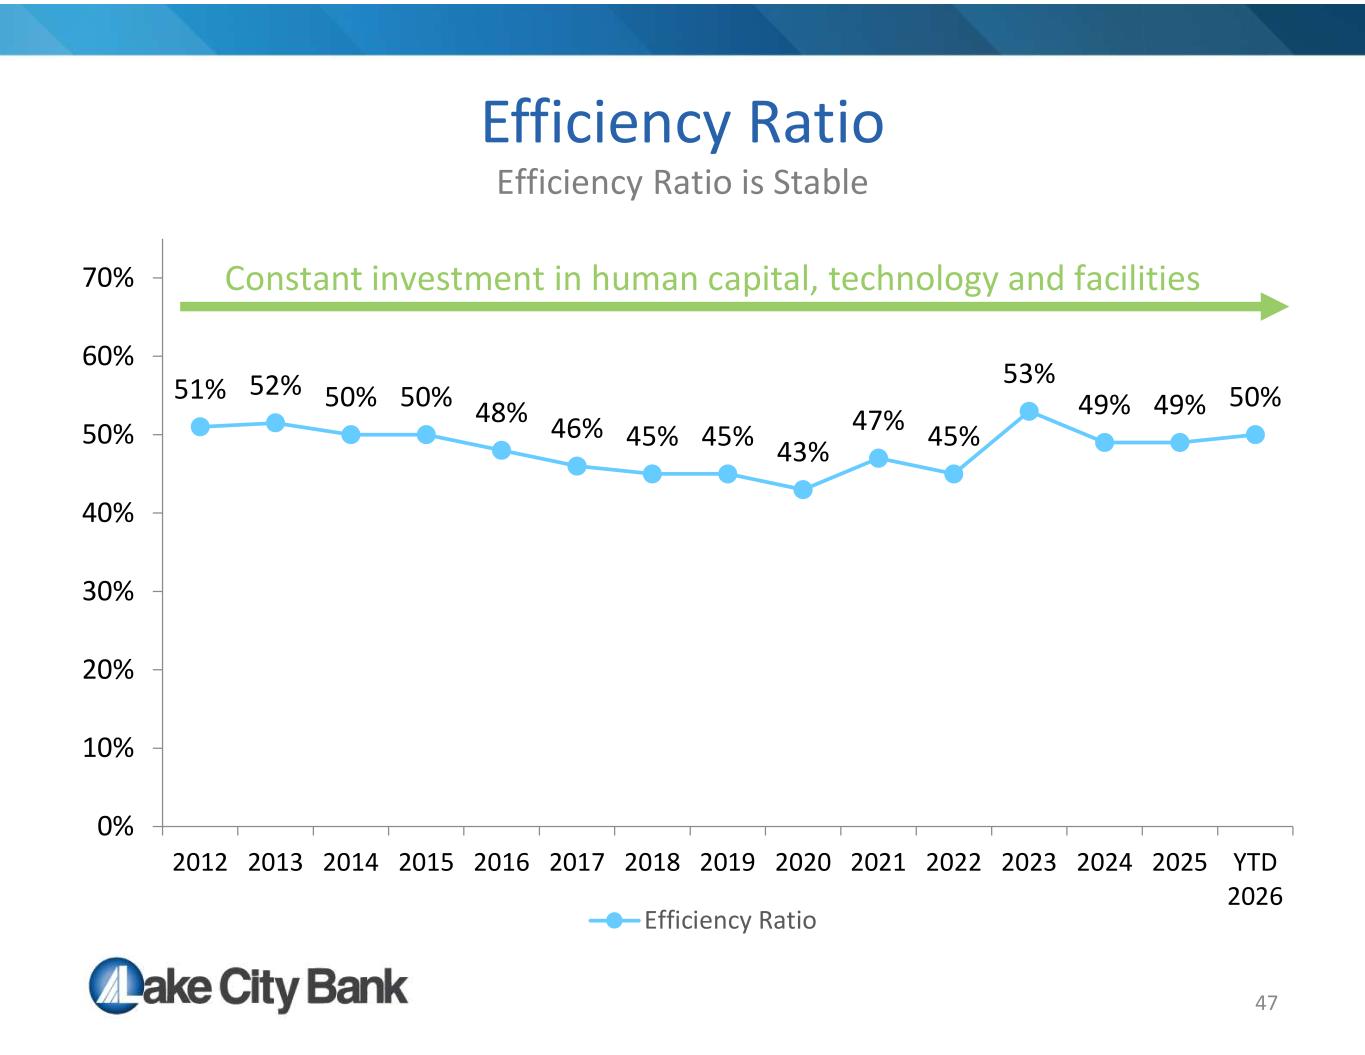
47 Efficiency Ratio Efficiency Ratio is Stable 51% 52% 50% 50% 48% 46% 45% 45% 43% 47% 45% 53% 49% 49% 50% 0% 10% 20% 30% 40% 50% 60% 70% 2012 2013 2014 2015 2016 2017 2018 2019 2020 2021 2022 2023 2024 2025 YTD 2026 Efficiency Ratio Constant investment in human capital, technology and facilities
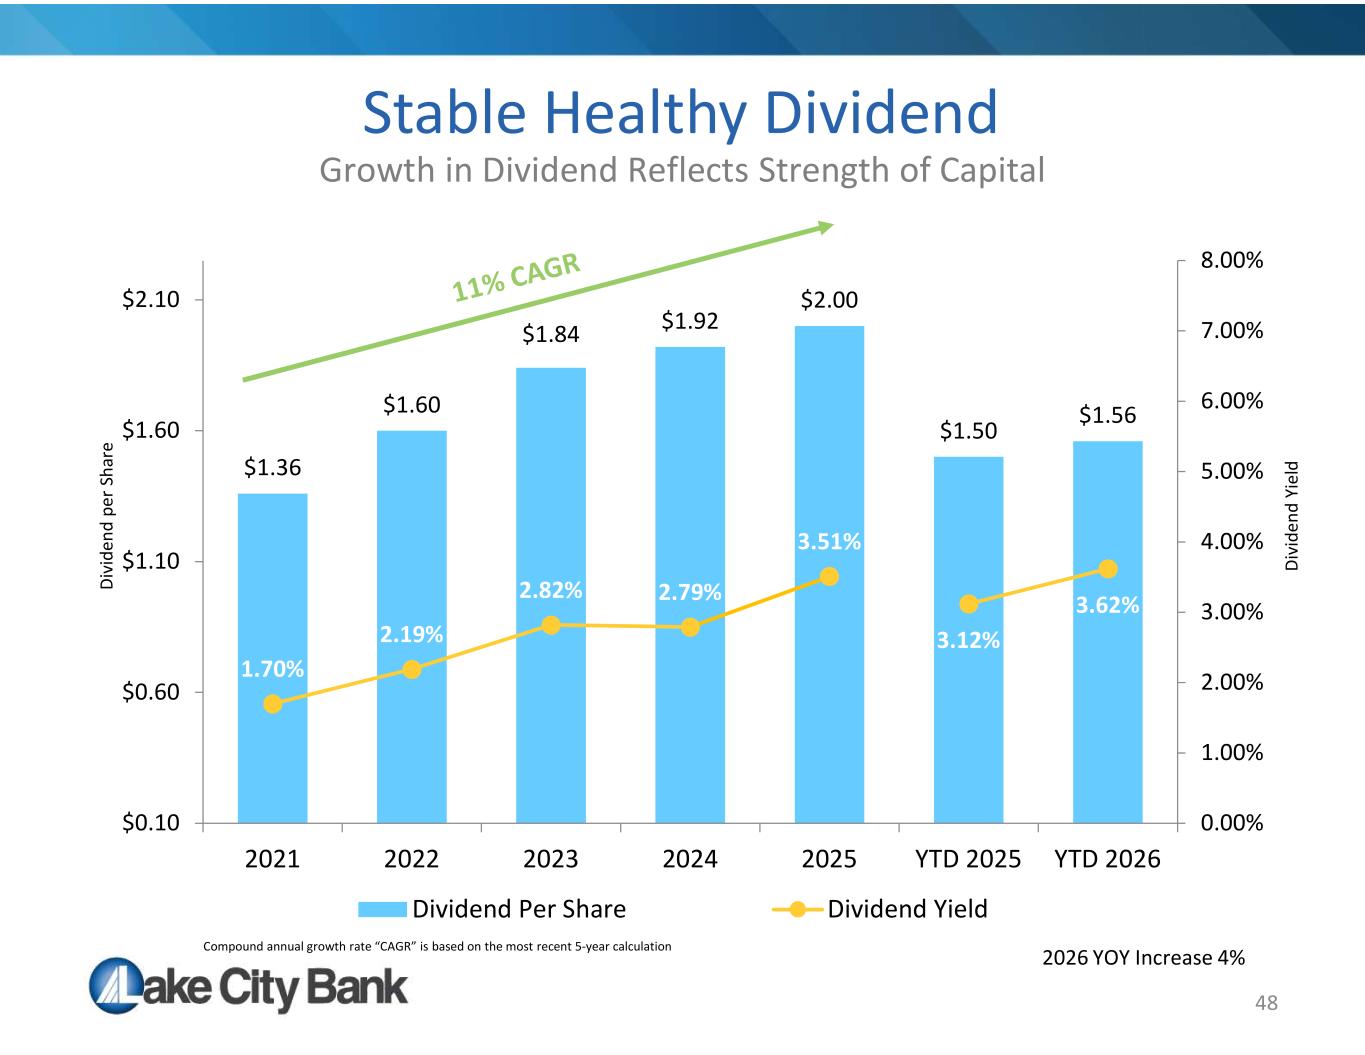
48 Stable Healthy Dividend Growth in Dividend Reflects Strength of Capital $1.36 $1.60 $1.84 $1.92 $2.00 $1.50 $1.56 1.70% 2.19% 2.82% 2.79% 3.51% 3.12% 3.62% 0.00% 1.00% 2.00% 3.00% 4.00% 5.00% 6.00% 7.00% 8.00% $0.10 $0.60 $1.10 $1.60 $2.10 2021 2022 2023 2024 2025 YTD 2025 YTD 2026 Dividend Per Share Dividend Yield 2026 YOY Increase 4% D iv id en d pe r S ha re D iv id en d Yi el d Compound annual growth rate “CAGR” is based on the most recent 5-year calculation
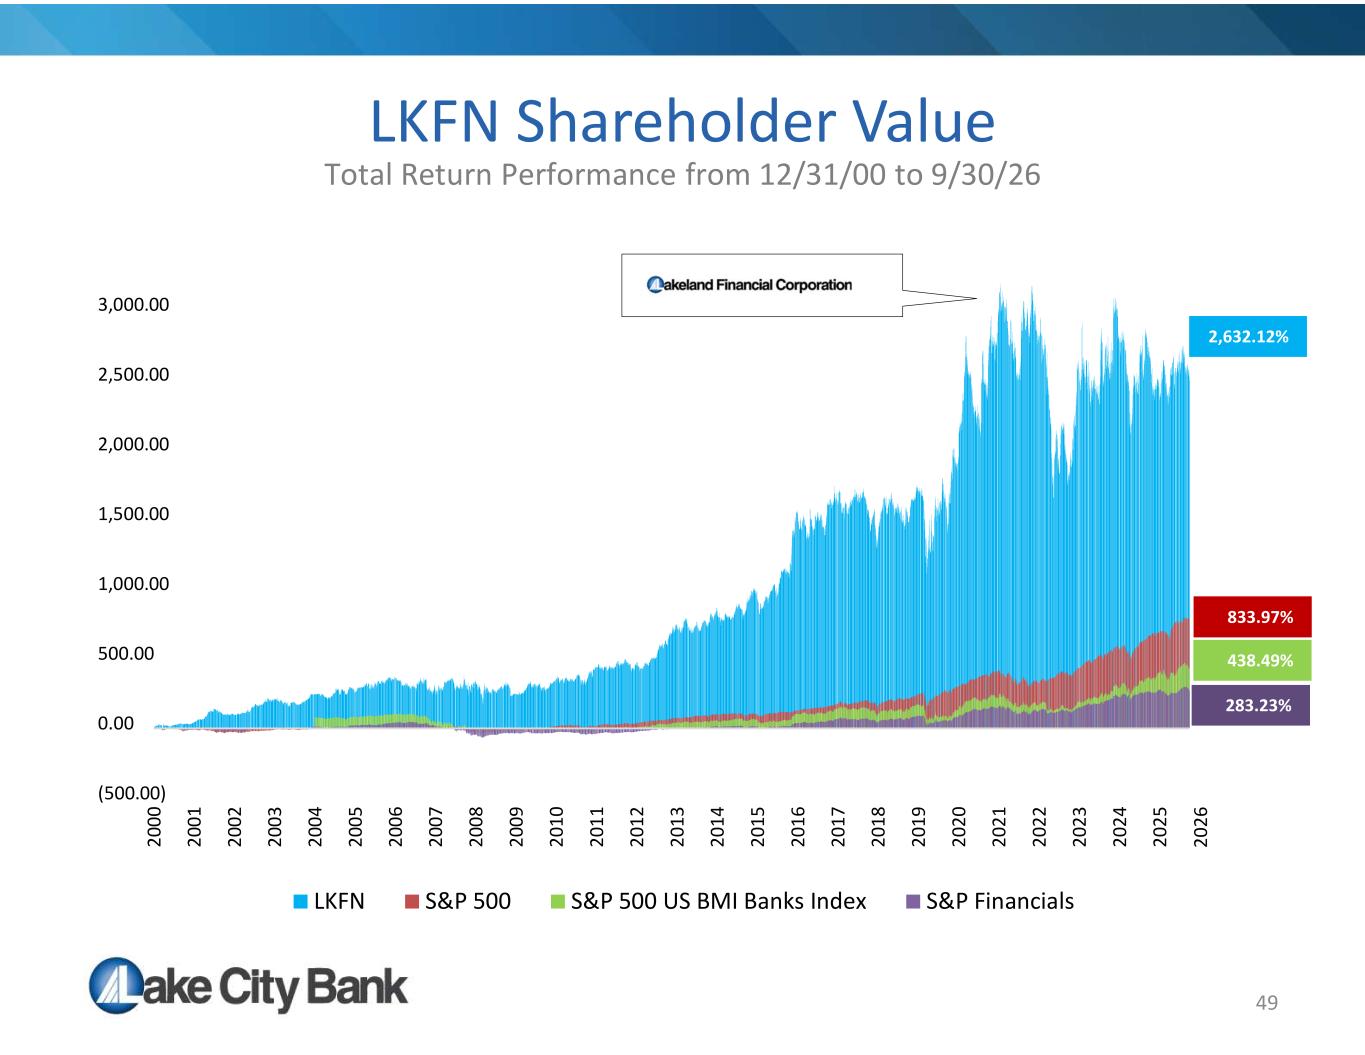
49 LKFN Shareholder Value Total Return Performance from 12/31/00 to 9/30/26 20 00 20 01 20 02 20 03 20 04 20 05 20 06 20 07 20 08 20 09 20 10 20 11 20 12 20 13 20 14 20 15 20 16 20 17 20 18 20 19 20 20 20 21 20 22 20 23 20 24 20 25 LKFN S&P 500 S&P 500 US BMI Banks Index S&P Financials 2,632.12% 833.97% 438.49% 283.23% 3,000.00 2,500.00 2,000.00 1,500.00 1,000.00 500.00 0.00 (500.00) 20 26
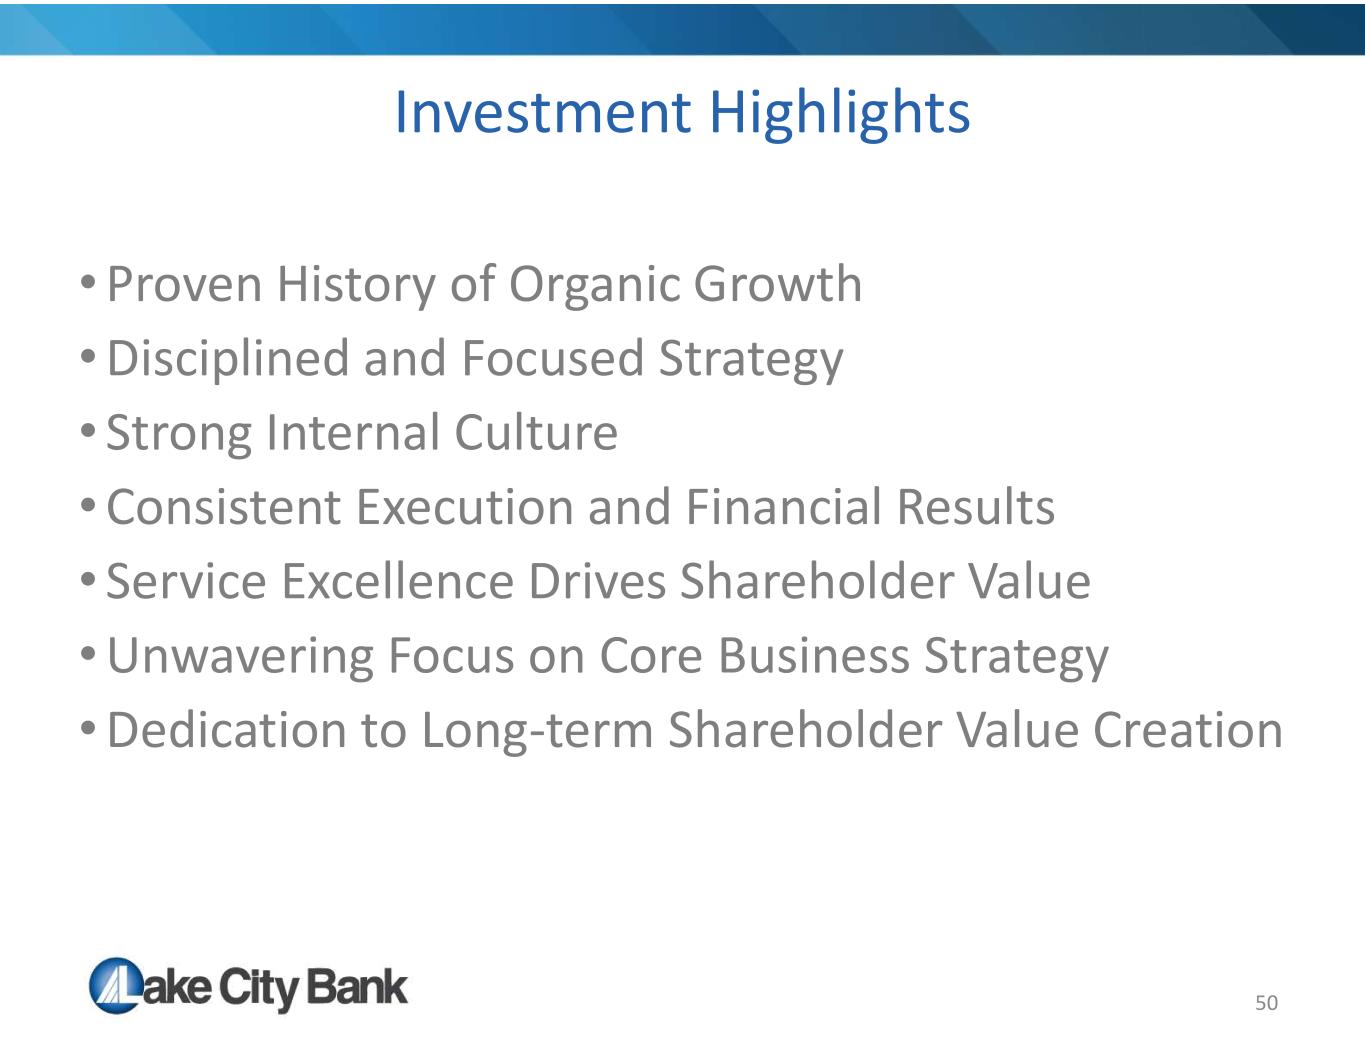
50 Investment Highlights • Proven History of Organic Growth • Disciplined and Focused Strategy • Strong Internal Culture • Consistent Execution and Financial Results • Service Excellence Drives Shareholder Value • Unwavering Focus on Core Business Strategy • Dedication to Long-term Shareholder Value Creation
Supplemental Information
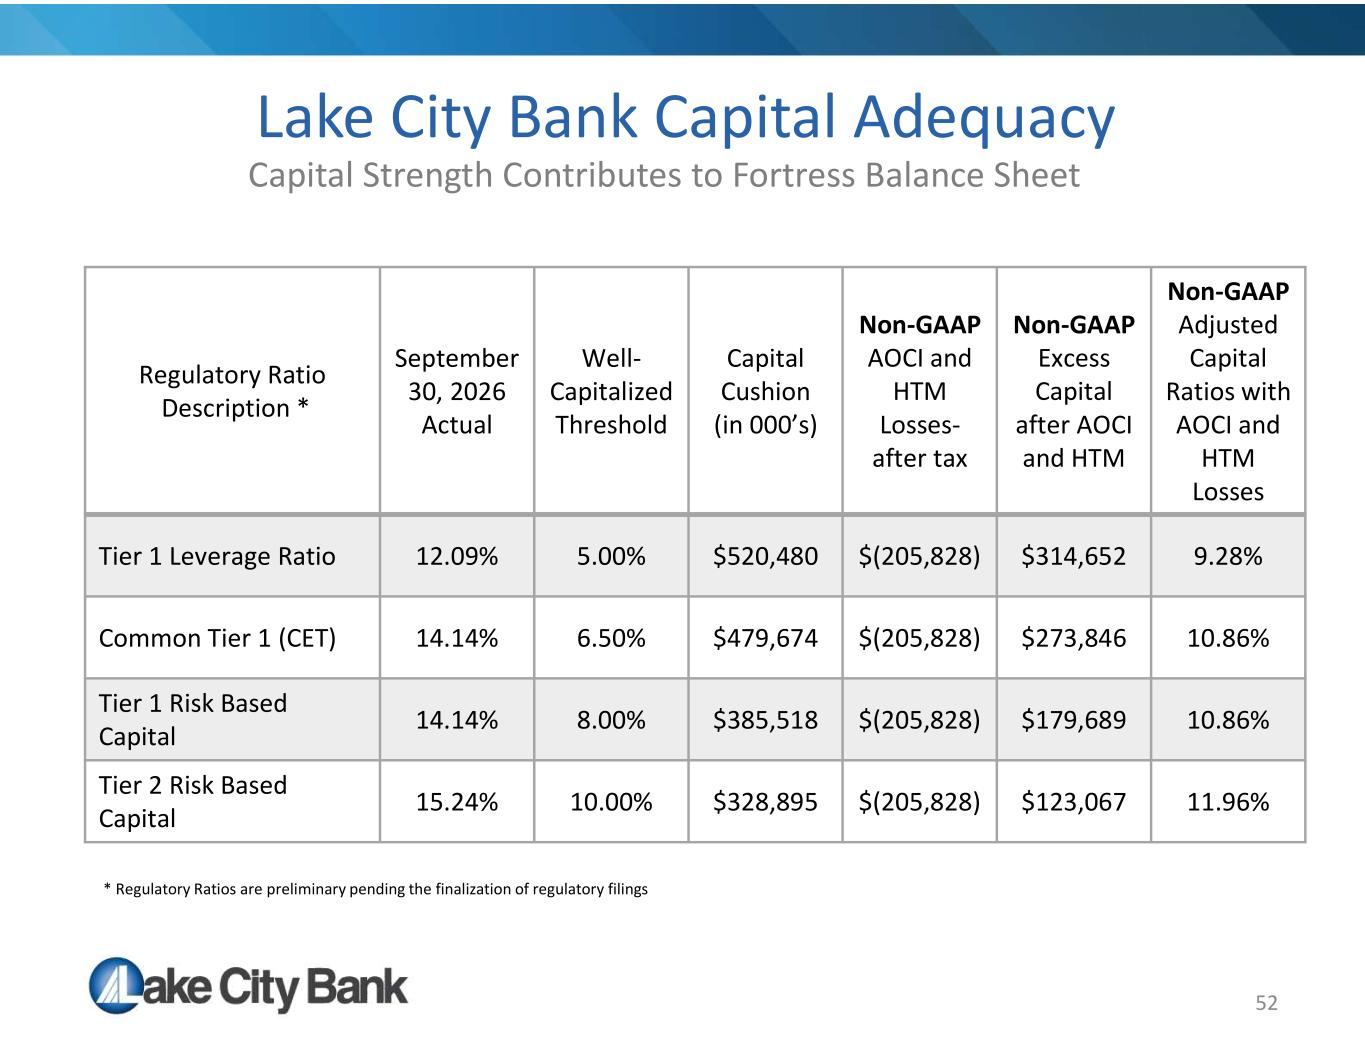
52 Lake City Bank Capital Adequacy Capital Strength Contributes to Fortress Balance Sheet Non-GAAP Adjusted Capital Ratios with AOCI and HTM Losses Non-GAAP Excess Capital after AOCI and HTM Non-GAAP AOCI and HTM Losses- after tax Capital Cushion (in 000’s) Well- Capitalized Threshold September 30, 2026 Actual Regulatory Ratio Description * 9.28%$314,652$(205,828)$520,4805.00%12.09%Tier 1 Leverage Ratio 10.86%$273,846$(205,828)$479,6746.50%14.14%Common Tier 1 (CET) 10.86%$179,689$(205,828)$385,5188.00%14.14%Tier 1 Risk Based Capital 11.96%$123,067$(205,828)$328,89510.00%15.24%Tier 2 Risk Based Capital * Regulatory Ratios are preliminary pending the finalization of regulatory filings
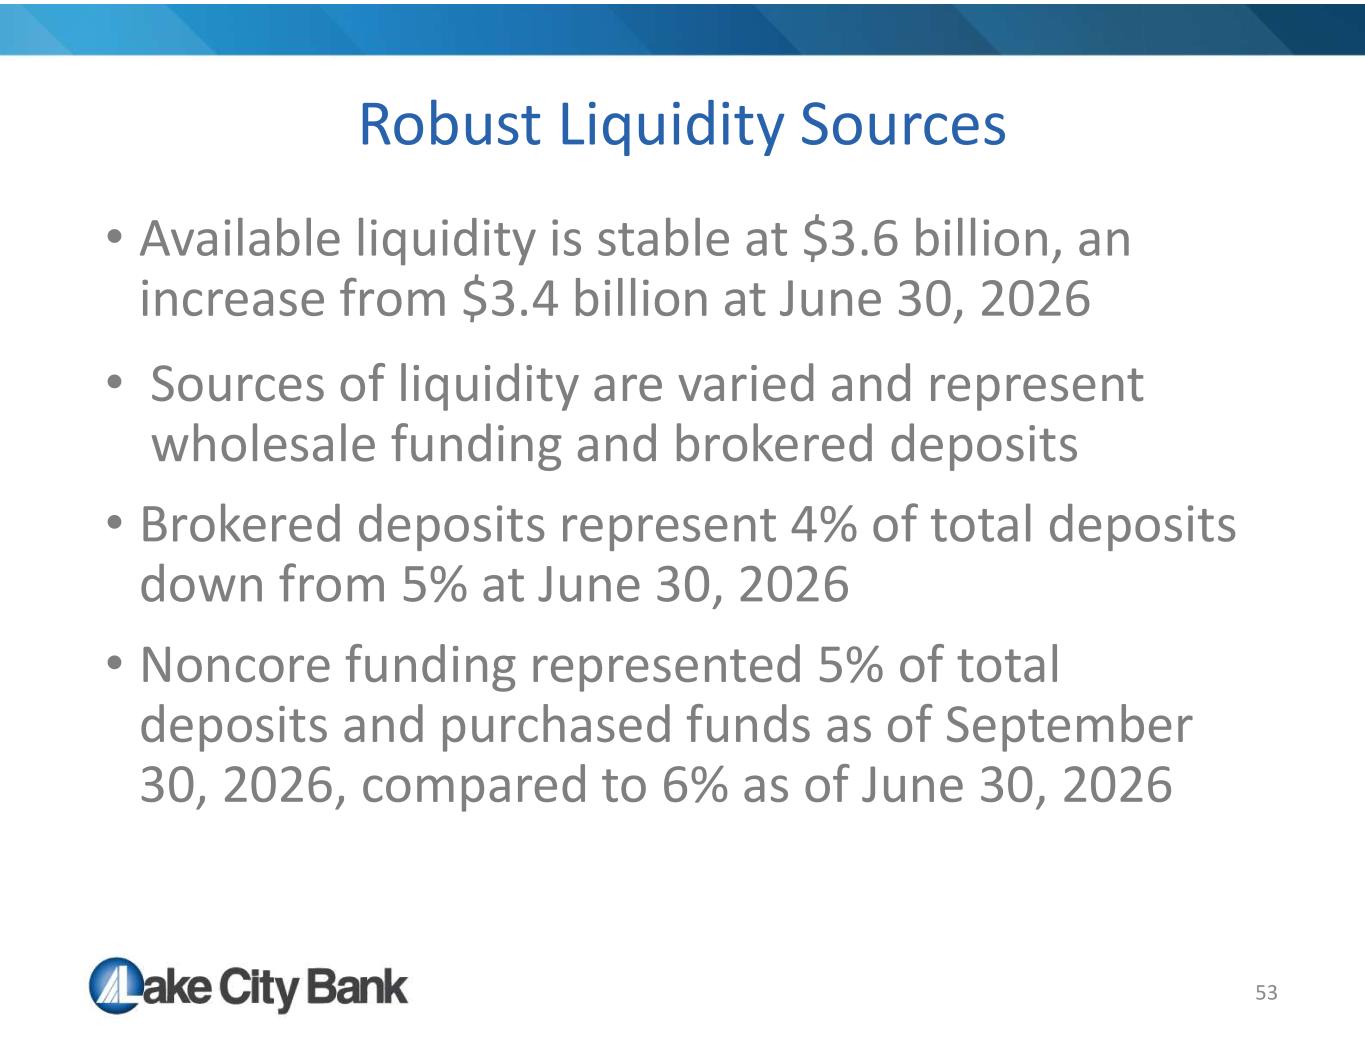
53 Robust Liquidity Sources • Available liquidity is stable at $3.6 billion, an increase from $3.4 billion at June 30, 2026 • Sources of liquidity are varied and represent wholesale funding and brokered deposits • Brokered deposits represent 4% of total deposits down from 5% at June 30, 2026 • Noncore funding represented 5% of total deposits and purchased funds as of September 30, 2026, compared to 6% as of June 30, 2026
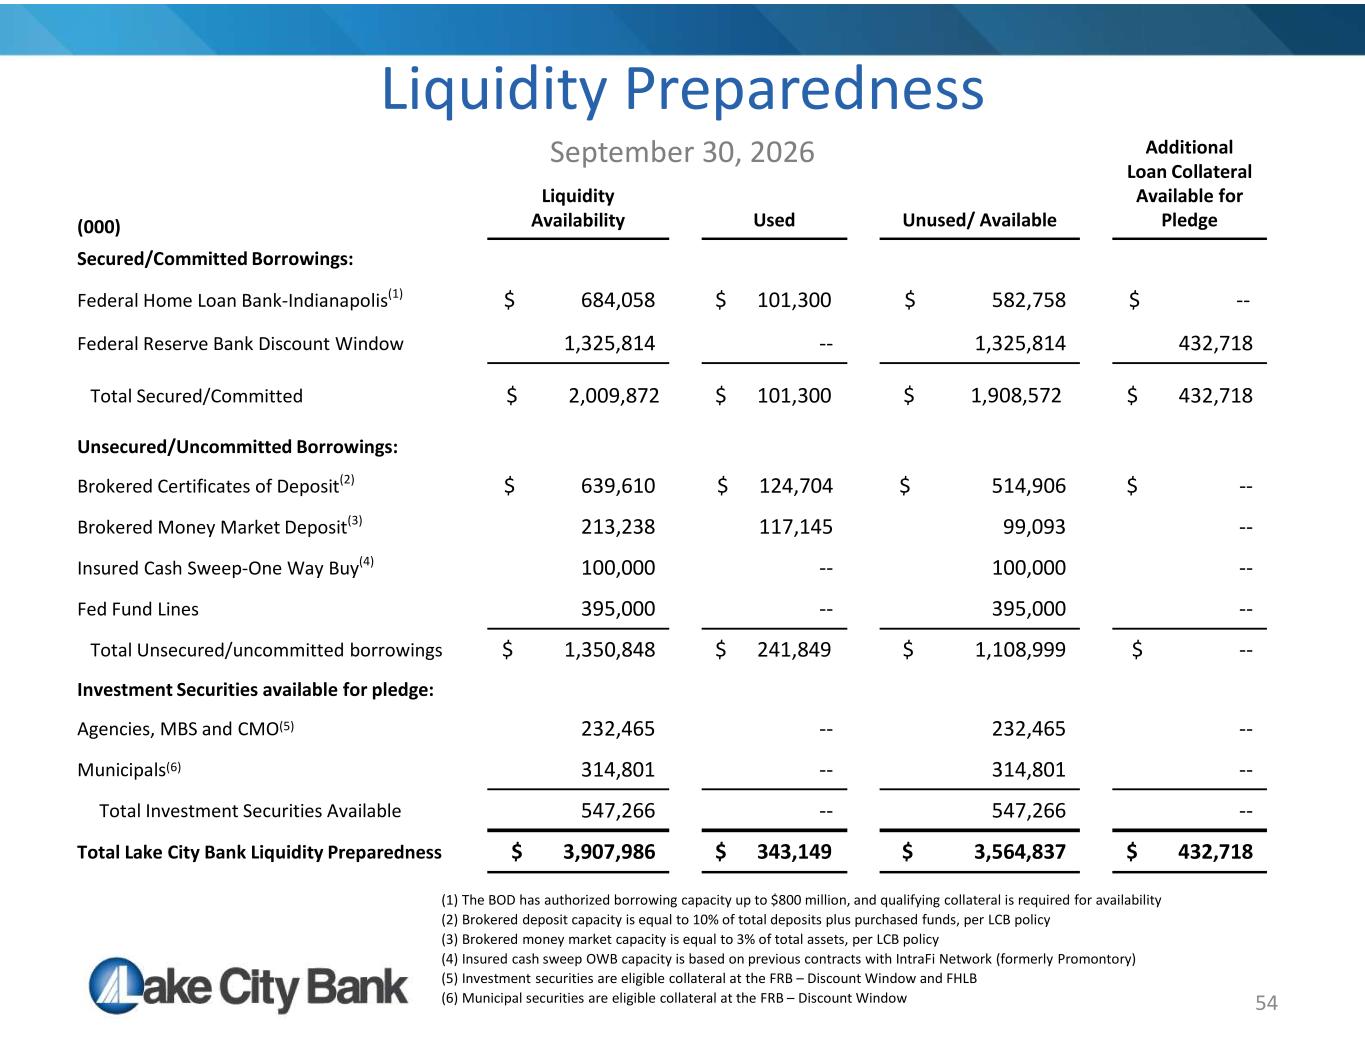
Additional Loan Collateral Available for PledgeUnused/ AvailableUsed Liquidity Availability(000) Secured/Committed Borrowings: $ --$ 582,758$ 101,300$ 684,058Federal Home Loan Bank-Indianapolis(1) 432,7181,325,814--1,325,814Federal Reserve Bank Discount Window $ 432,718 $ 1,908,572$ 101,300$ 2,009,872 Total Secured/Committed Unsecured/Uncommitted Borrowings: $ --$ 514,906$ 124,704 $ 639,610Brokered Certificates of Deposit(2) --99,093117,145213,238Brokered Money Market Deposit(3) --100,000--100,000Insured Cash Sweep-One Way Buy(4) --395,000--395,000Fed Fund Lines $ --$ 1,108,999$ 241,849$ 1,350,848Total Unsecured/uncommitted borrowings Investment Securities available for pledge: --232,465--232,465Agencies, MBS and CMO(5) --314,801--314,801Municipals(6) --547,266--547,266Total Investment Securities Available $ 432,718$ 3,564,837$ 343,149$ 3,907,986Total Lake City Bank Liquidity Preparedness 54 Liquidity Preparedness September 30, 2026 (1) The BOD has authorized borrowing capacity up to $800 million, and qualifying collateral is required for availability (2) Brokered deposit capacity is equal to 10% of total deposits plus purchased funds, per LCB policy (3) Brokered money market capacity is equal to 3% of total assets, per LCB policy (4) Insured cash sweep OWB capacity is based on previous contracts with IntraFi Network (formerly Promontory) (5) Investment securities are eligible collateral at the FRB – Discount Window and FHLB (6) Municipal securities are eligible collateral at the FRB – Discount Window
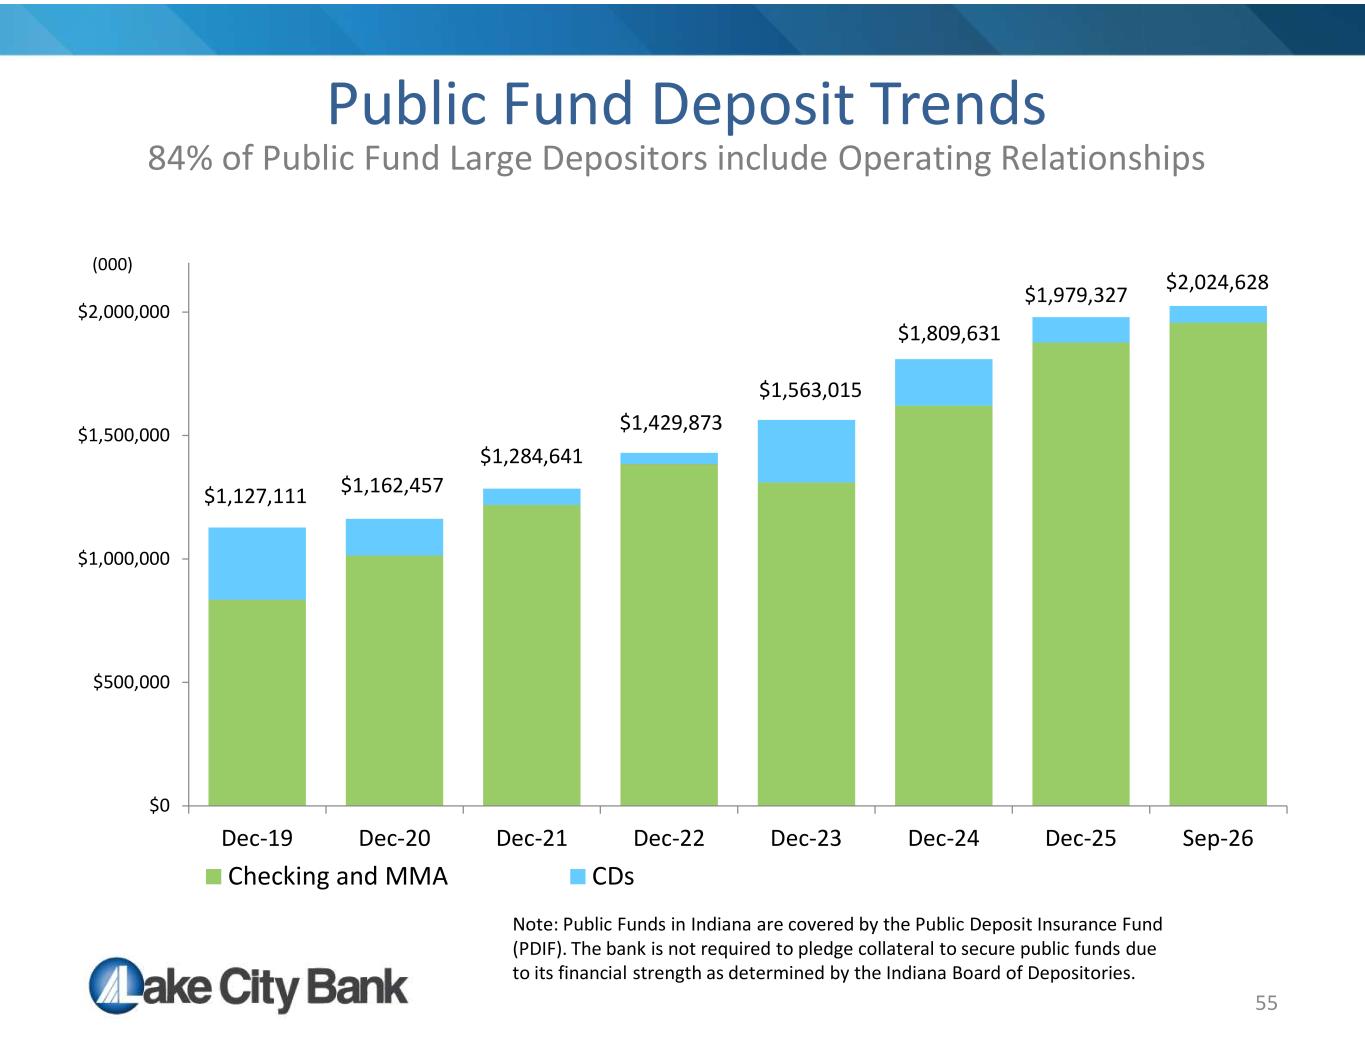
$0 $500,000 $1,000,000 $1,500,000 $2,000,000 Dec-19 Dec-20 Dec-21 Dec-22 Dec-23 Dec-24 Dec-25 Sep-26 Checking and MMA CDs (000) $2,024,628 55 Public Fund Deposit Trends 84% of Public Fund Large Depositors include Operating Relationships $1,127,111 $1,162,457 $1,284,641 $1,429,873 $1,563,015 $1,809,631 $1,979,327 Note: Public Funds in Indiana are covered by the Public Deposit Insurance Fund (PDIF). The bank is not required to pledge collateral to secure public funds due to its financial strength as determined by the Indiana Board of Depositories.
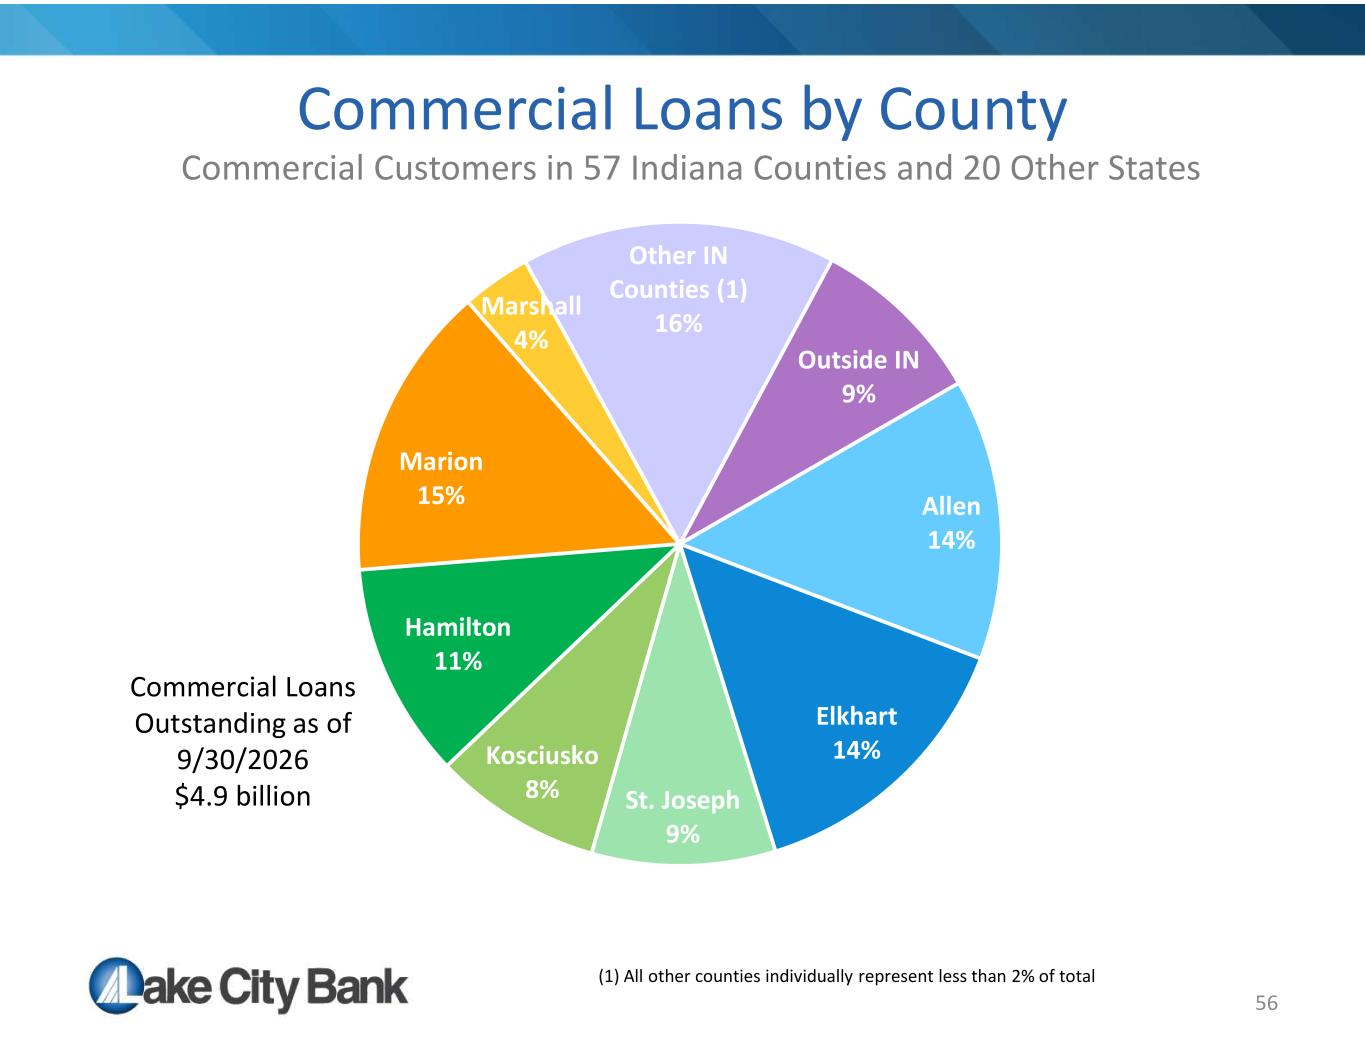
56 Commercial Loans by County Commercial Customers in 57 Indiana Counties and 20 Other States (1) All other counties individually represent less than 2% of total Allen 14% Elkhart 14% St. Joseph 9% Kosciusko 8% Hamilton 11% Marion 15% Marshall 4% Other IN Counties (1) 16% Outside IN 9% Commercial Loans Outstanding as of 9/30/2026 $4.9 billion
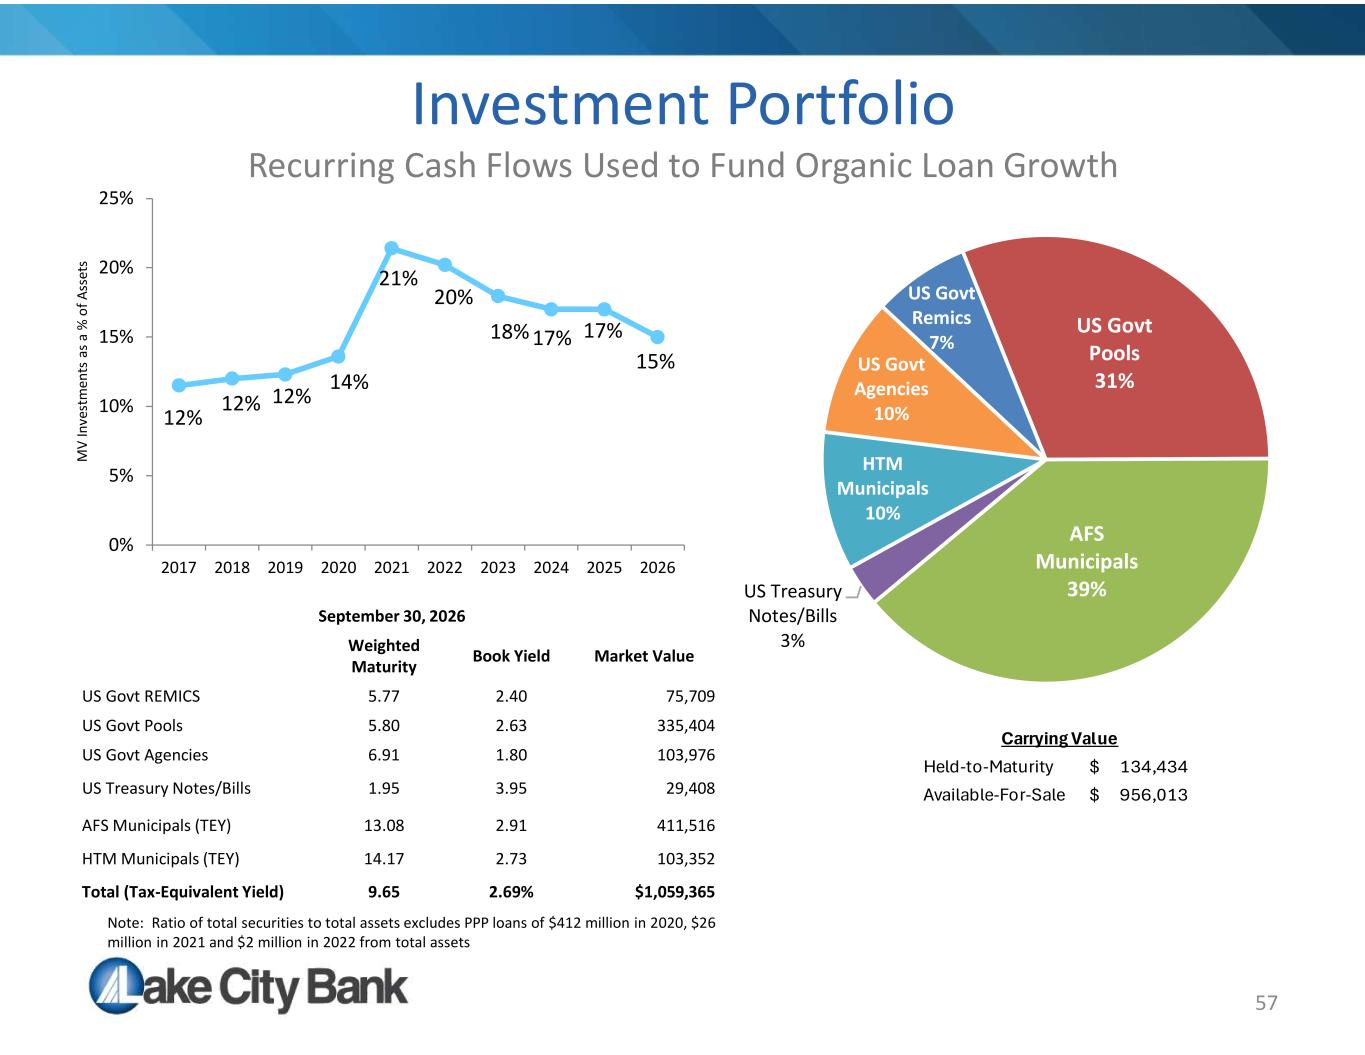
57 Investment Portfolio Recurring Cash Flows Used to Fund Organic Loan Growth M V In ve st m en ts a s a % o f A ss et s Note: Ratio of total securities to total assets excludes PPP loans of $412 million in 2020, $26 million in 2021 and $2 million in 2022 from total assets 12% 12% 12% 14% 21% 20% 18% 17% 17% 15% 0% 5% 10% 15% 20% 25% 2017 2018 2019 2020 2021 2022 2023 2024 2025 2026 September 30, 2026 Market ValueBook YieldWeighted Maturity 75,7092.405.77US Govt REMICS 335,4042.635.80US Govt Pools 103,9761.806.91US Govt Agencies 29,4083.951.95US Treasury Notes/Bills 411,5162.9113.08AFS Municipals (TEY) 103,3522.7314.17HTM Municipals (TEY) $1,059,3652.69%9.65Total (Tax-Equivalent Yield) US Govt Remics 7% US Govt Pools 31% AFS Municipals 39%US Treasury Notes/Bills 3% HTM Municipals 10% US Govt Agencies 10% Held-to-Maturity 134,434$ Available-For-Sale 956,013$ Carrying Value
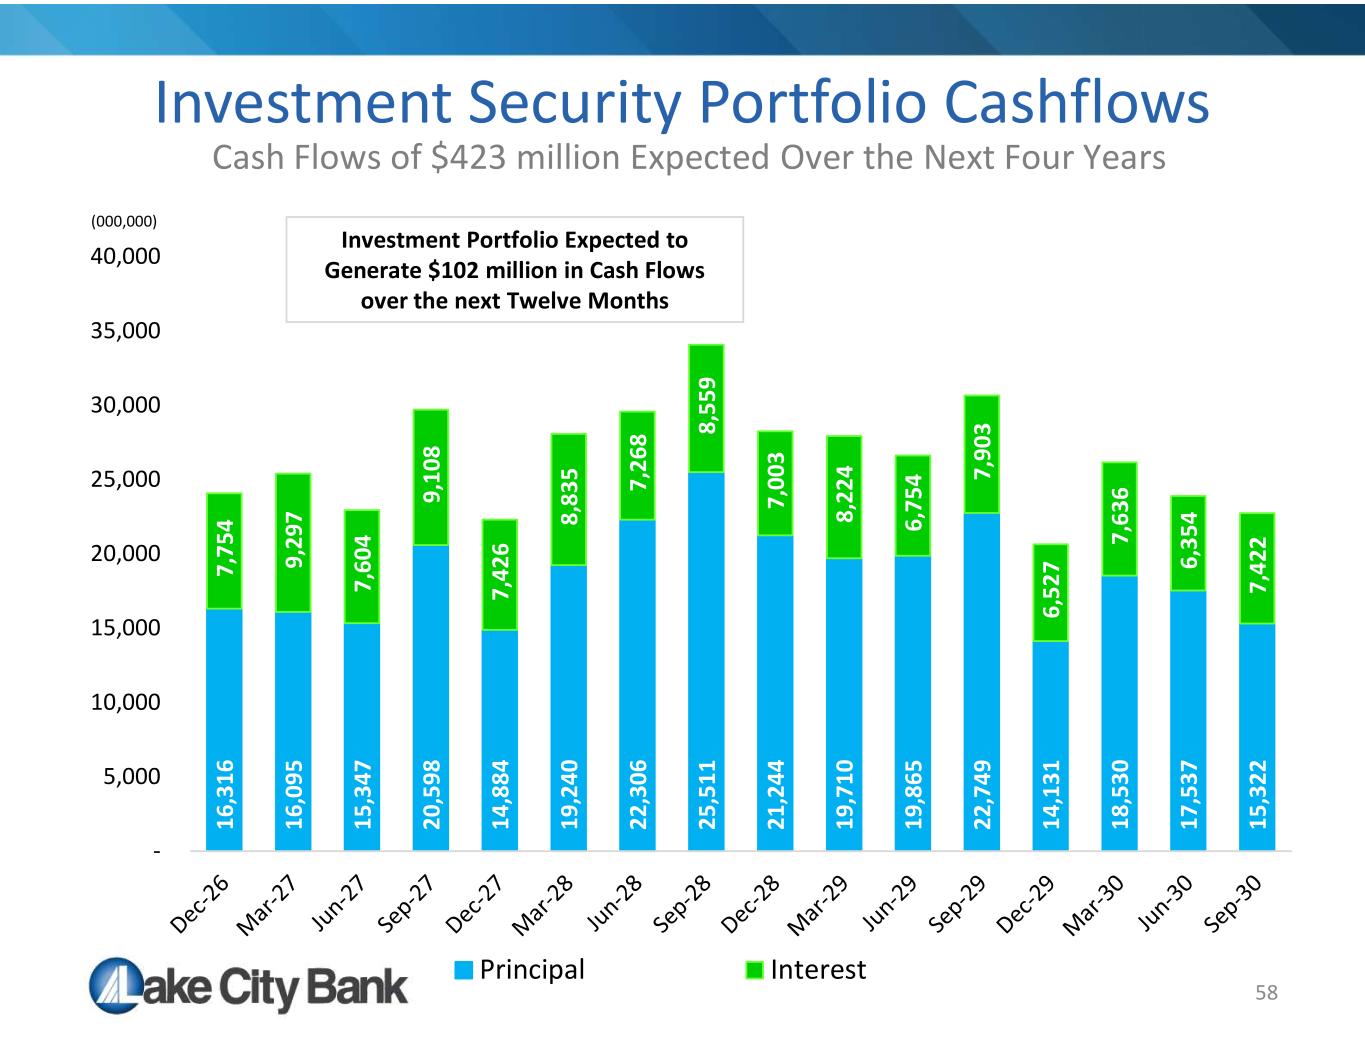
58 Investment Security Portfolio Cashflows Cash Flows of $423 million Expected Over the Next Four Years 16 ,3 16 16 ,0 95 15 ,3 47 20 ,5 98 14 ,8 84 19 ,2 40 22 ,3 06 25 ,5 11 21 ,2 44 19 ,7 10 19 ,8 65 22 ,7 49 14 ,1 31 18 ,5 30 17 ,5 37 15 ,3 22 7, 75 4 9, 29 7 7, 60 4 9, 10 8 7, 42 6 8, 83 5 7, 26 8 8, 55 9 7, 00 3 8, 22 4 6, 75 4 7, 90 3 6, 52 7 7, 63 6 6, 35 4 7, 42 2 - 5,000 10,000 15,000 20,000 25,000 30,000 35,000 40,000 Principal Interest (000,000) Investment Portfolio Expected to Generate $102 million in Cash Flows over the next Twelve Months
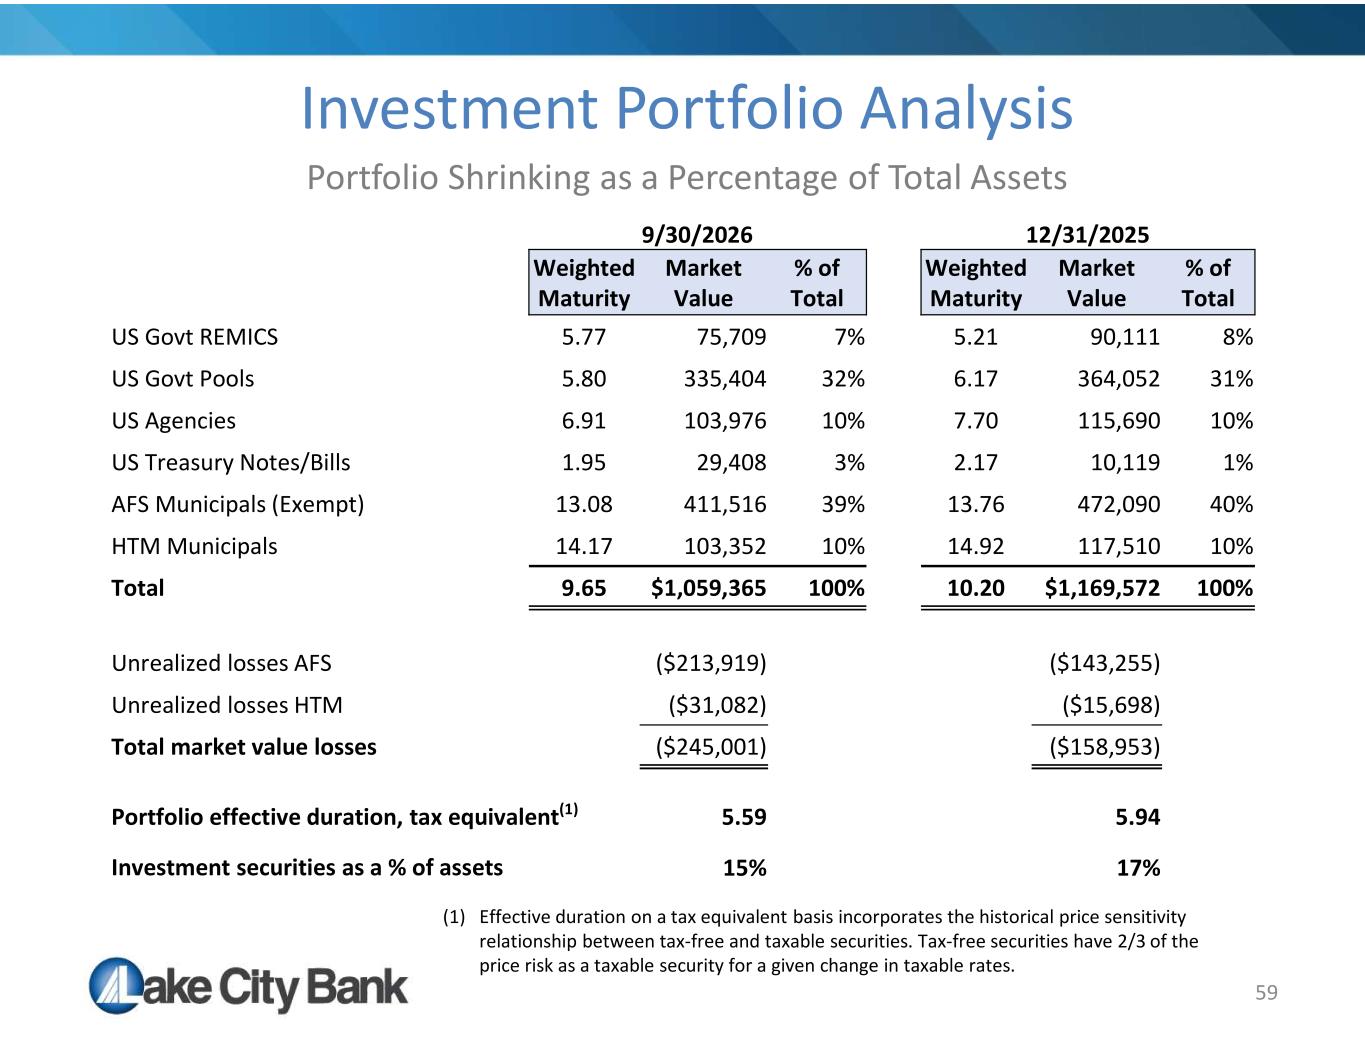
Investment Portfolio Analysis Portfolio Shrinking as a Percentage of Total Assets 59 12/31/20259/30/2026 % of Total Market Value Weighted Maturity % of Total Market Value Weighted Maturity 8%90,1115.217%75,7095.77US Govt REMICS 31%364,0526.1732%335,4045.80US Govt Pools 10%115,6907.7010%103,9766.91US Agencies 1%10,1192.173%29,4081.95US Treasury Notes/Bills 40%472,09013.7639%411,51613.08AFS Municipals (Exempt) 10%117,51014.9210%103,35214.17HTM Municipals 100%$1,169,57210.20100%$1,059,3659.65Total ($143,255)($213,919)Unrealized losses AFS ($15,698)($31,082)Unrealized losses HTM ($158,953)($245,001)Total market value losses 5.945.59Portfolio effective duration, tax equivalent(1) 17%15%Investment securities as a % of assets (1) Effective duration on a tax equivalent basis incorporates the historical price sensitivity relationship between tax-free and taxable securities. Tax-free securities have 2/3 of the price risk as a taxable security for a given change in taxable rates.
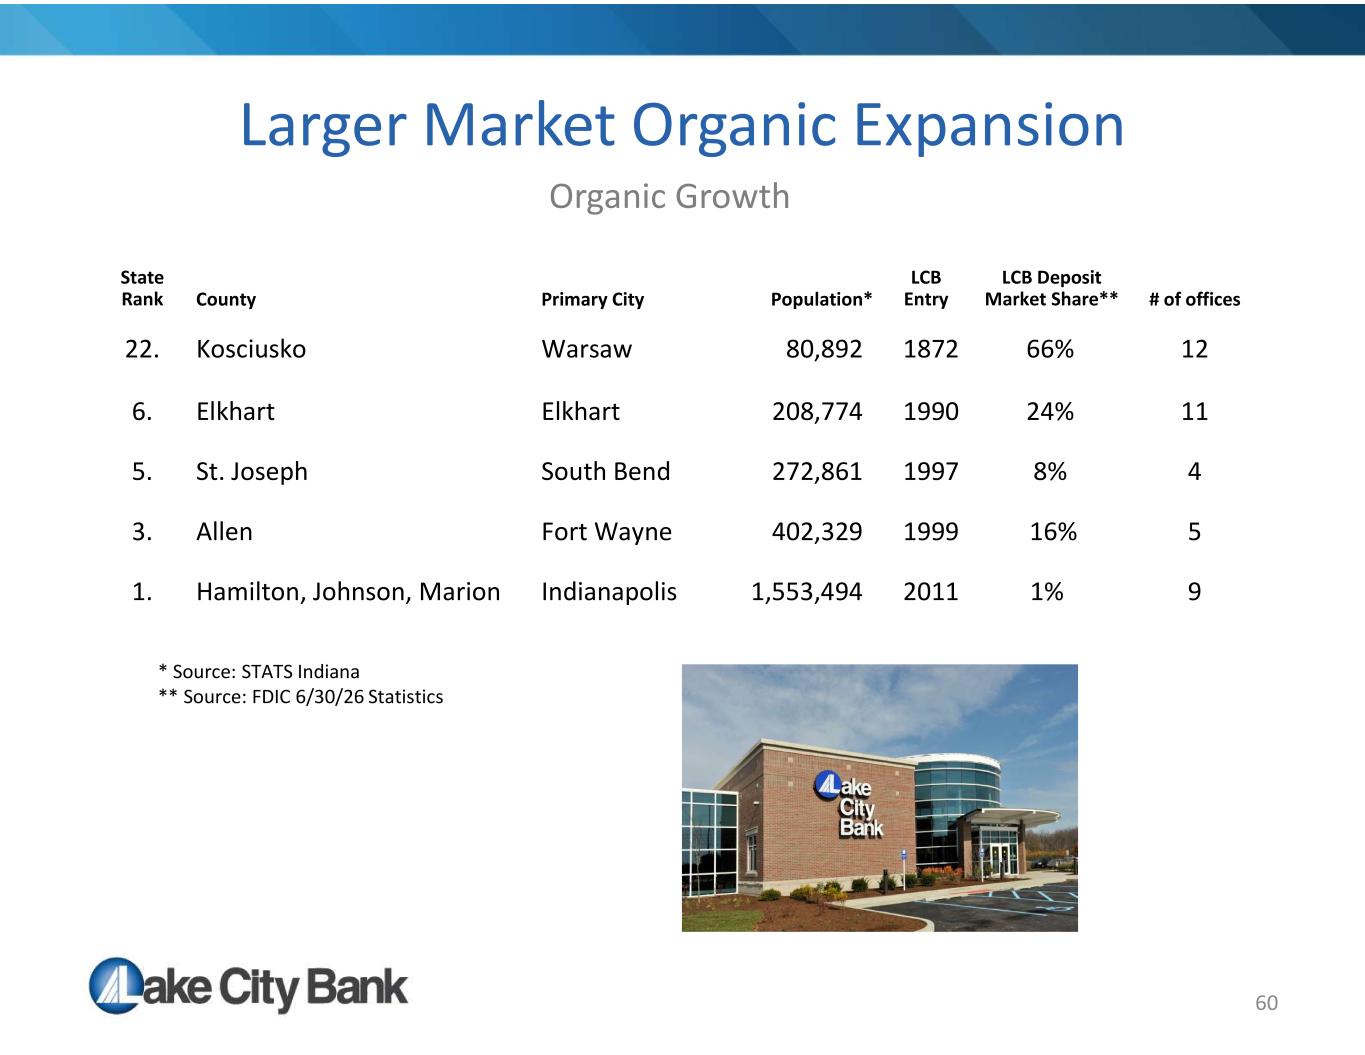
60 Larger Market Organic Expansion Organic Growth # of offices LCB Deposit Market Share** LCB EntryPopulation*Primary CityCounty State Rank 1266%187280,892WarsawKosciusko 22. 1124%1990208,774ElkhartElkhart6. 48%1997272,861South BendSt. Joseph5. 516%1999402,329Fort WayneAllen3. 91%20111,553,494IndianapolisHamilton, Johnson, Marion1. * Source: STATS Indiana ** Source: FDIC 6/30/26 Statistics
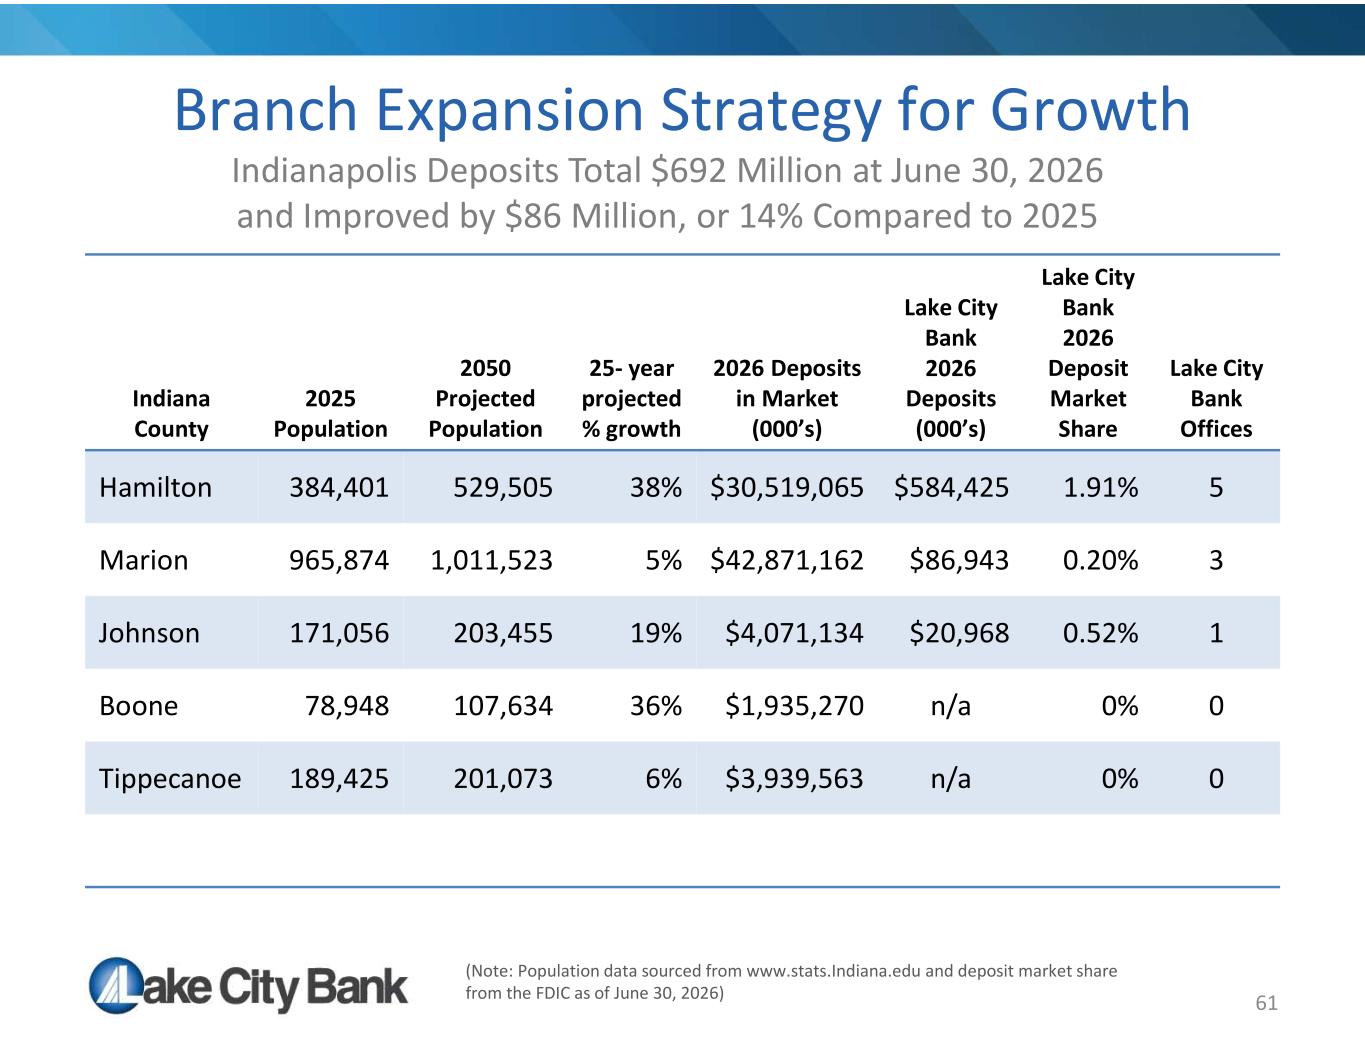
61 Branch Expansion Strategy for Growth Indianapolis Deposits Total $692 Million at June 30, 2026 and Improved by $86 Million, or 14% Compared to 2025 Lake City Bank Offices Lake City Bank 2026 Deposit Market Share Lake City Bank 2026 Deposits (000’s) 2026 Deposits in Market (000’s) 25- year projected % growth 2050 Projected Population 2025 Population Indiana County 51.91%$584,425$30,519,06538%529,505384,401Hamilton 30.20%$86,943$42,871,1625%1,011,523965,874Marion 10.52%$20,968$4,071,13419%203,455171,056Johnson 00%n/a $1,935,27036%107,63478,948Boone 00%n/a$3,939,5636%201,073189,425Tippecanoe (Note: Population data sourced from www.stats.Indiana.edu and deposit market share from the FDIC as of June 30, 2026)
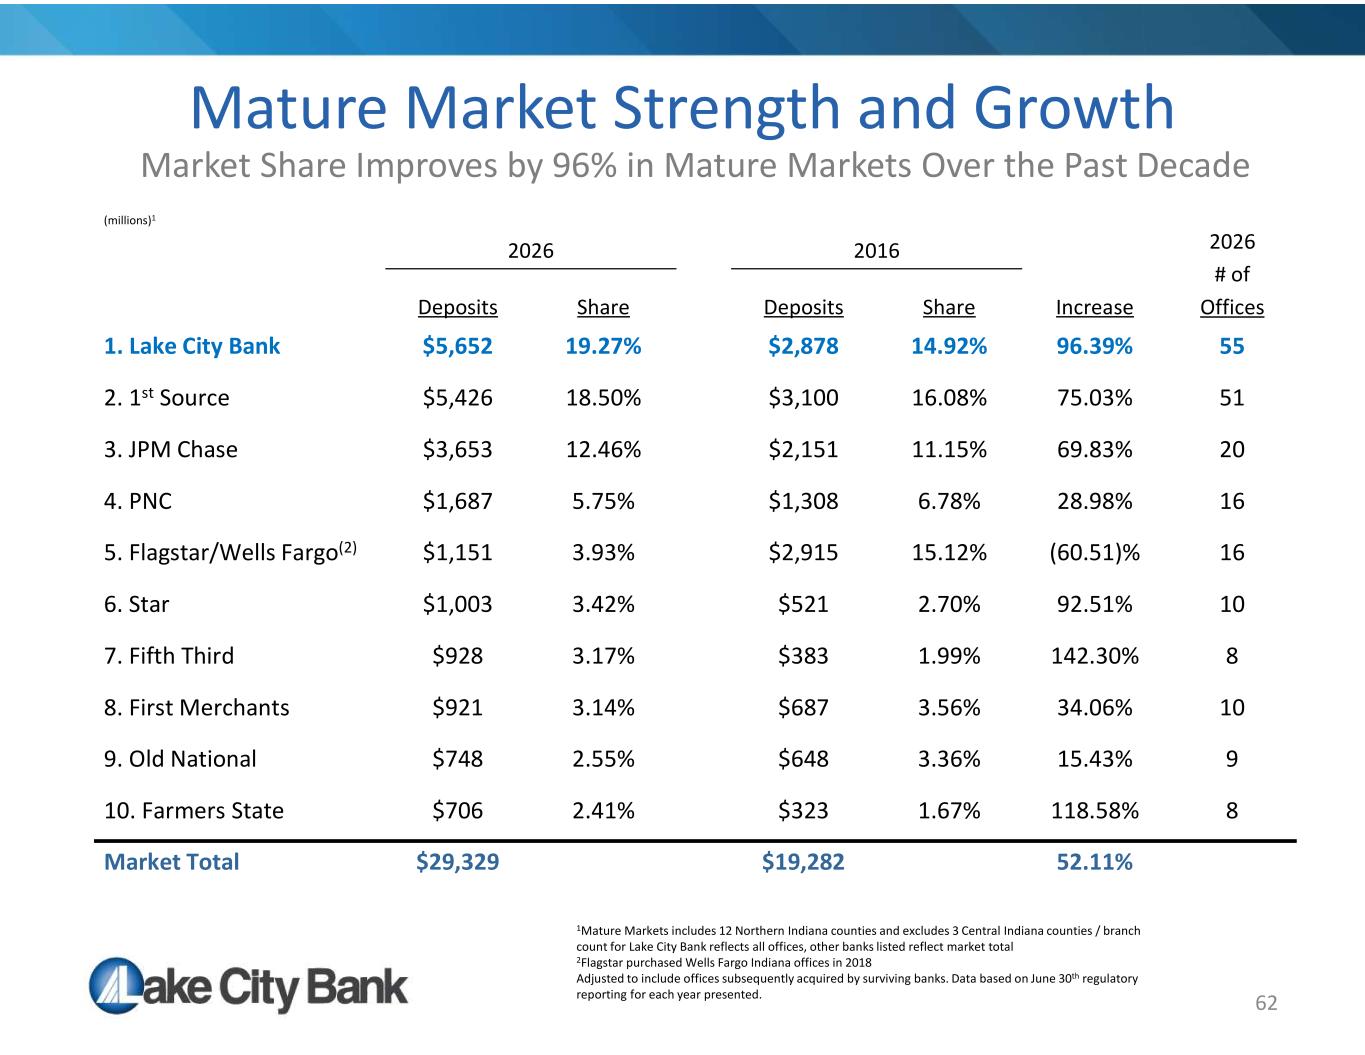
62 Mature Market Strength and Growth Market Share Improves by 96% in Mature Markets Over the Past Decade 2026 # of Offices 20162026 (millions)1 IncreaseShareDepositsShareDeposits 5596.39%14.92%$2,87819.27%$5,6521. Lake City Bank 5175.03%16.08%$3,10018.50%$5,4262. 1st Source 2069.83%11.15%$2,15112.46%$3,6533. JPM Chase 1628.98%6.78%$1,3085.75%$1,6874. PNC 16(60.51)%15.12%$2,9153.93%$1,1515. Flagstar/Wells Fargo(2) 1092.51%2.70%$5213.42%$1,0036. Star 8142.30%1.99%$3833.17%$9287. Fifth Third 1034.06%3.56%$6873.14%$9218. First Merchants 915.43%3.36%$6482.55%$7489. Old National 8118.58%1.67%$3232.41%$70610. Farmers State 52.11%$19,282$29,329Market Total 1Mature Markets includes 12 Northern Indiana counties and excludes 3 Central Indiana counties / branch count for Lake City Bank reflects all offices, other banks listed reflect market total 2Flagstar purchased Wells Fargo Indiana offices in 2018 Adjusted to include offices subsequently acquired by surviving banks. Data based on June 30th regulatory reporting for each year presented.