

CB Financial Services, Inc. (Nasdaq: CBFV) October 2026 Page 2 Forward-Looking Statements and Non-GAAP Financial Measures Statements contained in this investor presentation that are not historical facts may constitute forward-looking statements as that term is defined in the Private Securities Litigation Reform Act of 1995 and such forward-looking statements are subject to significant risks and uncertainties. The Company intends such forward-looking statements to be covered by the safe harbor provisions contained in the Act. The Company’s ability to predict results or the actual effect of future plans or strategies is inherently uncertain. Factors which could have a material adverse effect on the operations and future prospects of the Company and its subsidiaries include, but are not limited to, general and local economic conditions, changes in market interest rates, deposit flows, demand for loans, real estate values and competition, competitive products and pricing, the ability of our clients to make scheduled loan payments, loan delinquency rates and trends, our ability to manage the risks involved in our business, our ability to control costs and expenses, inflation, market and monetary fluctuations, changes in federal and state legislation and regulation applicable to our business, actions by our competitors, and other factors that may be disclosed in the Company’s periodic reports as filed with the Securities and Exchange Commission. These risks and uncertainties should be considered in evaluating forward-looking statements and undue reliance should not be placed on such statements. The Company assumes no obligation to update any forward-looking statements except as may be required by applicable law or regulation. Explanation of Use of Non-GAAP Financial Measures In addition to financial measures presented in accordance with generally accepted accounting principles (“GAAP”), we use, and this investor presentation may contain or reference, certain non-GAAP financial measures. We believe these non-GAAP financial measures provide useful information in understanding our underlying results of operations or financial position and our business and performance trends as they facilitate comparisons with the performance of other companies in the financial services industry. Non-GAAP adjusted items impacting the Company's financial performance are identified to assist investors in providing a complete understanding of factors and trends affecting the Company’s business and in analyzing the Company’s operating results on the same basis as that applied by management. Although we believe that these non-GAAP financial measures enhance the understanding of our business and performance, they should not be considered an alternative to GAAP or considered to be more important than financial results determined in accordance with GAAP, nor are they necessarily comparable with similar non-GAAP measures which may be presented by other companies. Where non-GAAP financial measures are used, the comparable GAAP financial measure, as well as the reconciliation to the comparable GAAP financial measure, can be found within the referenced earnings release.
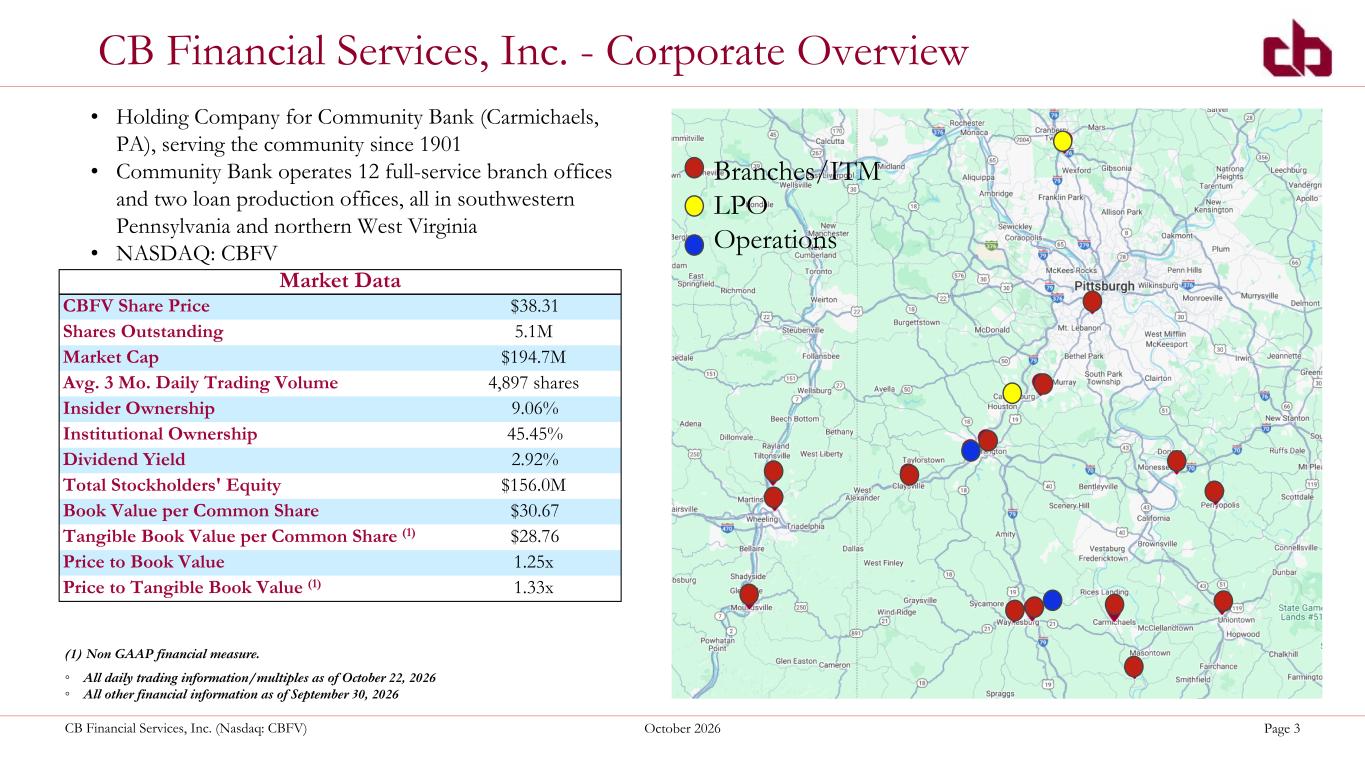
CB Financial Services, Inc. (Nasdaq: CBFV) October 2026 Page 3 CB Financial Services, Inc. - Corporate Overview • Holding Company for Community Bank (Carmichaels, PA), serving the community since 1901 • Community Bank operates 12 full-service branch offices and two loan production offices, all in southwestern Pennsylvania and northern West Virginia • NASDAQ: CBFV Market Data CBFV Share Price $38.31 Shares Outstanding 5.1M Market Cap $194.7M Avg. 3 Mo. Daily Trading Volume 4,897 shares Insider Ownership 9.06% Institutional Ownership 45.45% Dividend Yield 2.92% Total Stockholders' Equity $156.0M Book Value per Common Share $30.67 Tangible Book Value per Common Share (1) $28.76 Price to Book Value 1.25x Price to Tangible Book Value (1) 1.33x ◦ All daily trading information/multiples as of October 22, 2026 ◦ All other financial information as of September 30, 2026 Washington Waynesburg Moundsville Canonsburg Uniontown Branches/ITM LPO Operations (1) Non GAAP financial measure.
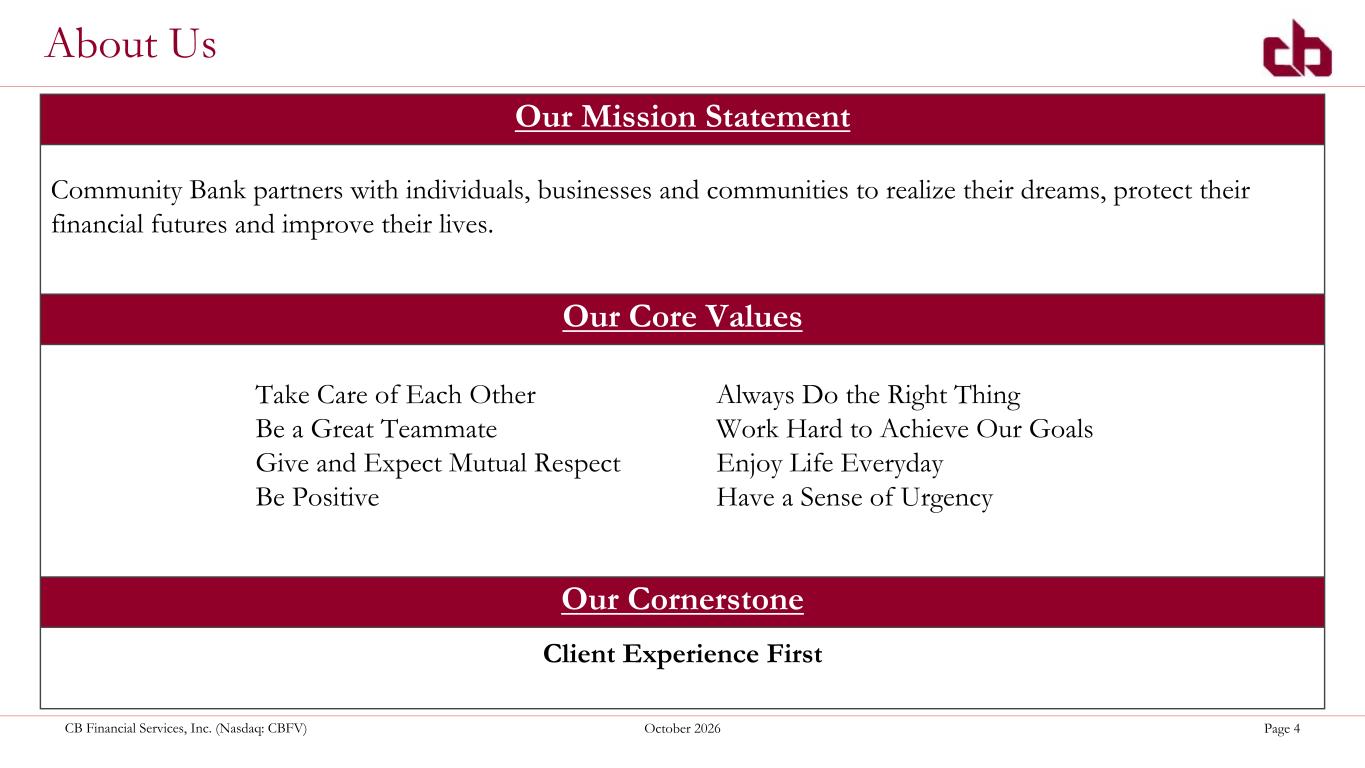
CB Financial Services, Inc. (Nasdaq: CBFV) October 2026 Page 4 Community Bank partners with individuals, businesses and communities to realize their dreams, protect their financial futures and improve their lives. Take Care of Each Other Always Do the Right Thing Be a Great Teammate Work Hard to Achieve Our Goals Give and Expect Mutual Respect Enjoy Life Everyday Be Positive Have a Sense of Urgency Client Experience First Our Mission Statement Our Core Values Our Cornerstone About Us
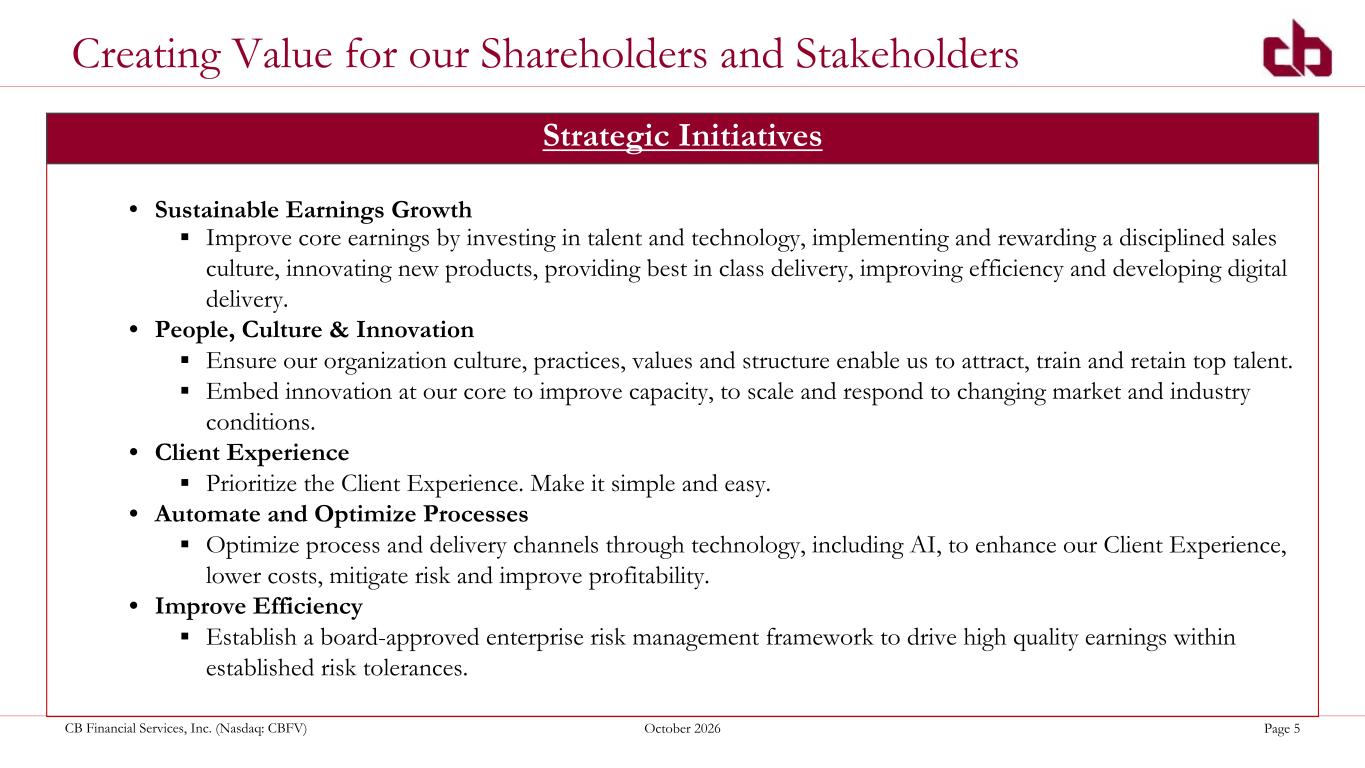
CB Financial Services, Inc. (Nasdaq: CBFV) October 2026 Page 5 Creating Value for our Shareholders and Stakeholders • Sustainable Earnings Growth ▪ Improve core earnings by investing in talent and technology, implementing and rewarding a disciplined sales culture, innovating new products, providing best in class delivery, improving efficiency and developing digital delivery. • People, Culture & Innovation ▪ Ensure our organization culture, practices, values and structure enable us to attract, train and retain top talent. ▪ Embed innovation at our core to improve capacity, to scale and respond to changing market and industry conditions. • Client Experience ▪ Prioritize the Client Experience. Make it simple and easy. • Automate and Optimize Processes ▪ Optimize process and delivery channels through technology, including AI, to enhance our Client Experience, lower costs, mitigate risk and improve profitability. • Improve Efficiency ▪ Establish a board-approved enterprise risk management framework to drive high quality earnings within established risk tolerances. Strategic Initiatives
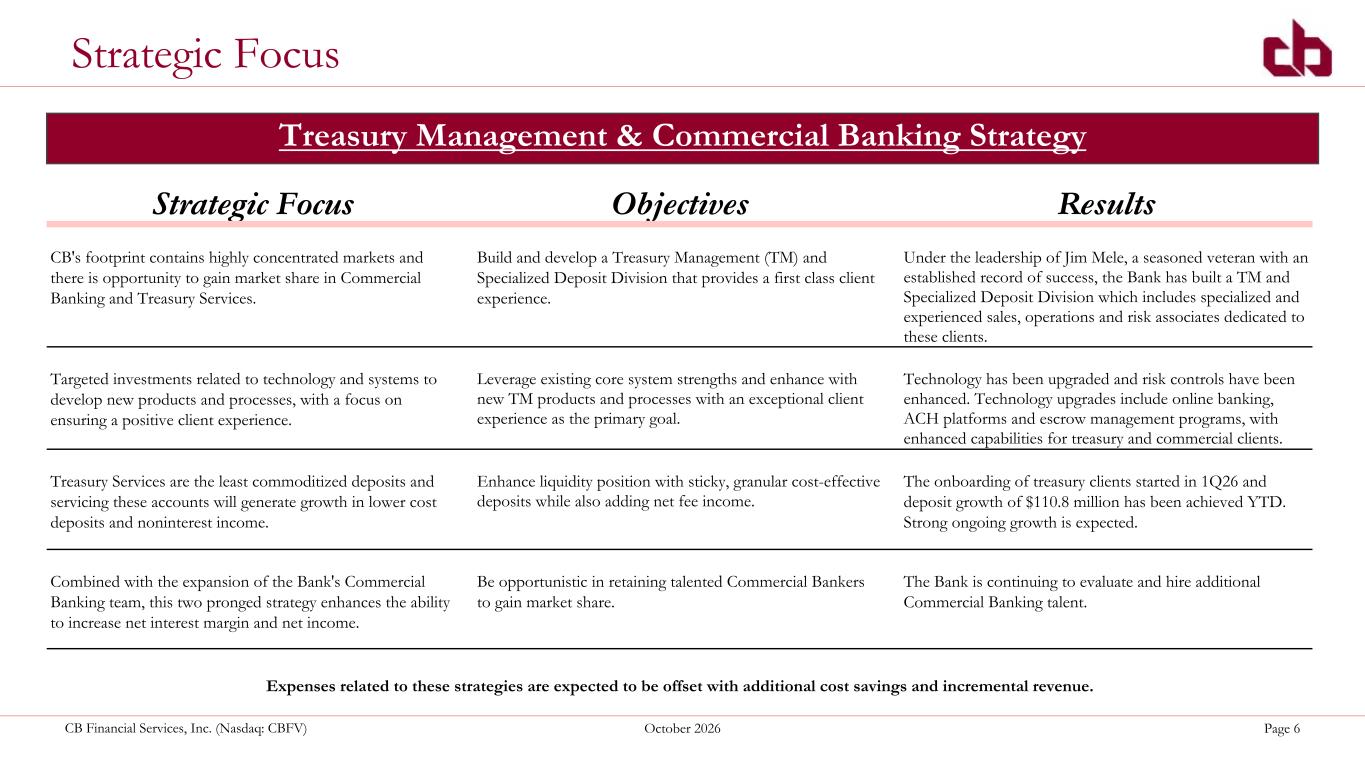
CB Financial Services, Inc. (Nasdaq: CBFV) October 2026 Page 6 Strategic Focus Treasury Management & Commercial Banking Strategy Strategic Focus Objectives Results CB's footprint contains highly concentrated markets and there is opportunity to gain market share in Commercial Banking and Treasury Services. Build and develop a Treasury Management (TM) and Specialized Deposit Division that provides a first class client experience. Under the leadership of Jim Mele, a seasoned veteran with an established record of success, the Bank has built a TM and Specialized Deposit Division which includes specialized and experienced sales, operations and risk associates dedicated to these clients. Targeted investments related to technology and systems to develop new products and processes, with a focus on ensuring a positive client experience. Leverage existing core system strengths and enhance with new TM products and processes with an exceptional client experience as the primary goal. Technology has been upgraded and risk controls have been enhanced. Technology upgrades include online banking, ACH platforms and escrow management programs, with enhanced capabilities for treasury and commercial clients. Treasury Services are the least commoditized deposits and servicing these accounts will generate growth in lower cost deposits and noninterest income. Enhance liquidity position with sticky, granular cost-effective deposits while also adding net fee income. The onboarding of treasury clients started in 1Q26 and deposit growth of $110.8 million has been achieved YTD. Strong ongoing growth is expected. Combined with the expansion of the Bank's Commercial Banking team, this two pronged strategy enhances the ability to increase net interest margin and net income. Be opportunistic in retaining talented Commercial Bankers to gain market share. The Bank is continuing to evaluate and hire additional Commercial Banking talent. Expenses related to these strategies are expected to be offset with additional cost savings and incremental revenue.
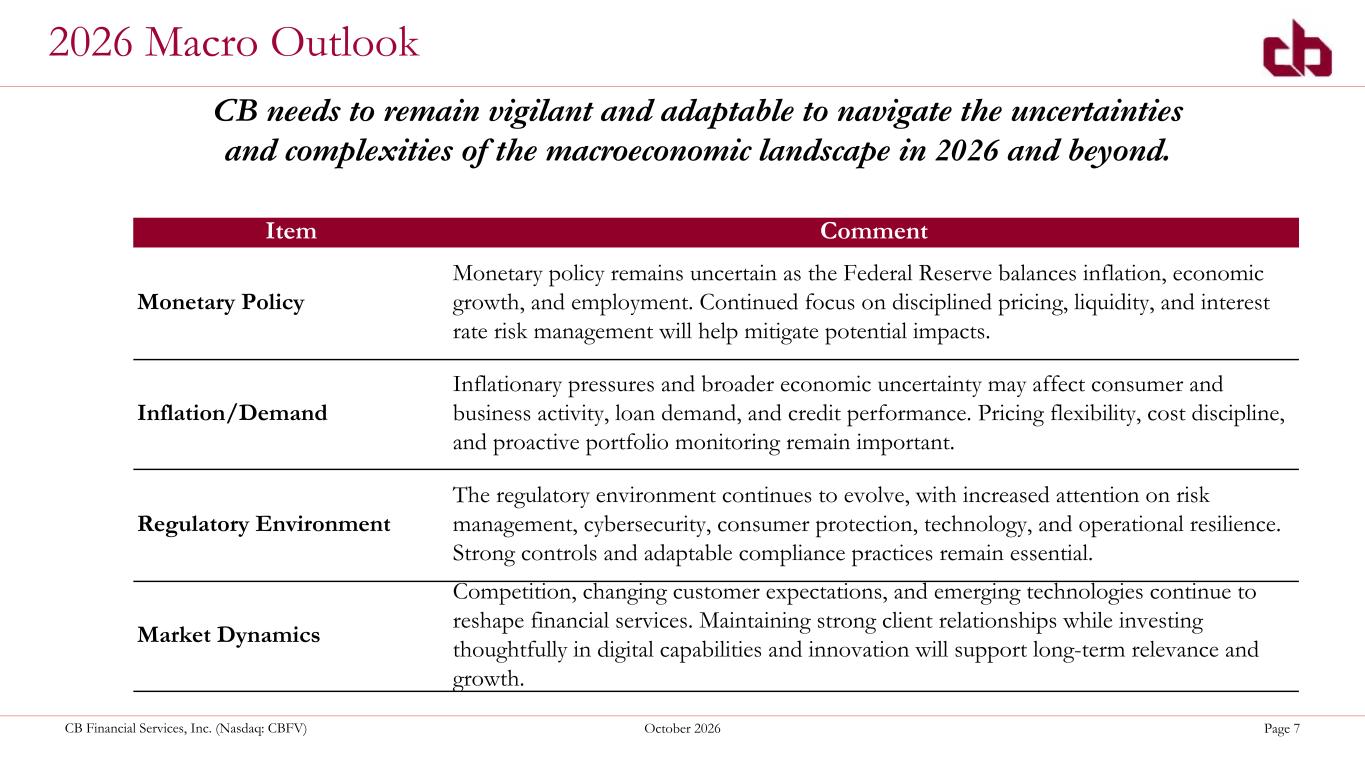
CB Financial Services, Inc. (Nasdaq: CBFV) October 2026 Page 7 2026 Macro Outlook Item Comment Monetary Policy Monetary policy remains uncertain as the Federal Reserve balances inflation, economic growth, and employment. Continued focus on disciplined pricing, liquidity, and interest rate risk management will help mitigate potential impacts. Inflation/Demand Inflationary pressures and broader economic uncertainty may affect consumer and business activity, loan demand, and credit performance. Pricing flexibility, cost discipline, and proactive portfolio monitoring remain important. Regulatory Environment The regulatory environment continues to evolve, with increased attention on risk management, cybersecurity, consumer protection, technology, and operational resilience. Strong controls and adaptable compliance practices remain essential. Market Dynamics Competition, changing customer expectations, and emerging technologies continue to reshape financial services. Maintaining strong client relationships while investing thoughtfully in digital capabilities and innovation will support long-term relevance and growth. CB needs to remain vigilant and adaptable to navigate the uncertainties and complexities of the macroeconomic landscape in 2026 and beyond.
Q3 2026 Financial Highlights
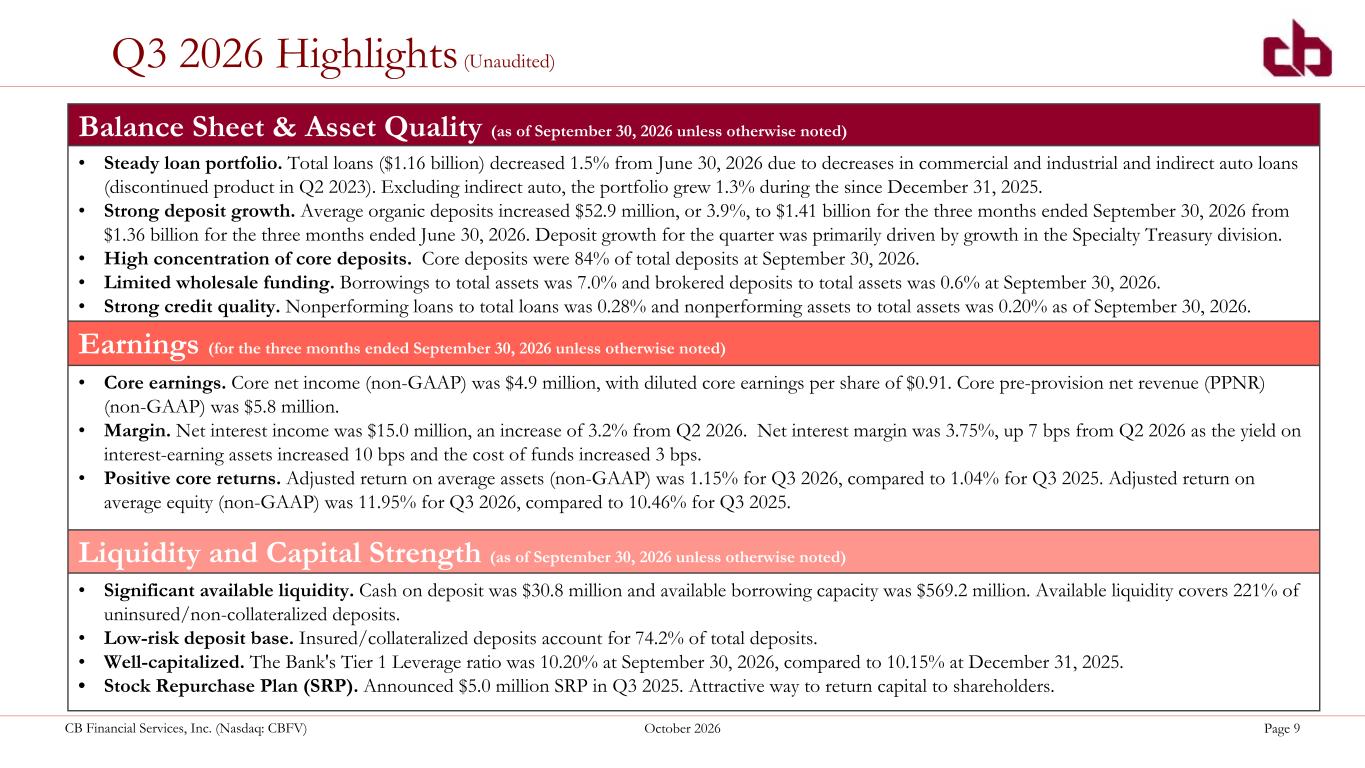
CB Financial Services, Inc. (Nasdaq: CBFV) October 2026 Page 9 Q3 2026 Highlights (Unaudited) Earnings (for the three months ended September 30, 2026 unless otherwise noted) • Core earnings. Core net income (non-GAAP) was $4.9 million, with diluted core earnings per share of $0.91. Core pre-provision net revenue (PPNR) (non-GAAP) was $5.8 million. • Margin. Net interest income was $15.0 million, an increase of 3.2% from Q2 2026. Net interest margin was 3.75%, up 7 bps from Q2 2026 as the yield on interest-earning assets increased 10 bps and the cost of funds increased 3 bps. • Positive core returns. Adjusted return on average assets (non-GAAP) was 1.15% for Q3 2026, compared to 1.04% for Q3 2025. Adjusted return on average equity (non-GAAP) was 11.95% for Q3 2026, compared to 10.46% for Q3 2025. Balance Sheet & Asset Quality (as of September 30, 2026 unless otherwise noted) • Steady loan portfolio. Total loans ($1.16 billion) decreased 1.5% from June 30, 2026 due to decreases in commercial and industrial and indirect auto loans (discontinued product in Q2 2023). Excluding indirect auto, the portfolio grew 1.3% during the since December 31, 2025. • Strong deposit growth. Average organic deposits increased $52.9 million, or 3.9%, to $1.41 billion for the three months ended September 30, 2026 from $1.36 billion for the three months ended June 30, 2026. Deposit growth for the quarter was primarily driven by growth in the Specialty Treasury division. • High concentration of core deposits. Core deposits were 84% of total deposits at September 30, 2026. • Limited wholesale funding. Borrowings to total assets was 7.0% and brokered deposits to total assets was 0.6% at September 30, 2026. • Strong credit quality. Nonperforming loans to total loans was 0.28% and nonperforming assets to total assets was 0.20% as of September 30, 2026. Liquidity and Capital Strength (as of September 30, 2026 unless otherwise noted) • Significant available liquidity. Cash on deposit was $30.8 million and available borrowing capacity was $569.2 million. Available liquidity covers 221% of uninsured/non-collateralized deposits. • Low-risk deposit base. Insured/collateralized deposits account for 74.2% of total deposits. • Well-capitalized. The Bank's Tier 1 Leverage ratio was 10.20% at September 30, 2026, compared to 10.15% at December 31, 2025. • Stock Repurchase Plan (SRP). Announced $5.0 million SRP in Q3 2025. Attractive way to return capital to shareholders.
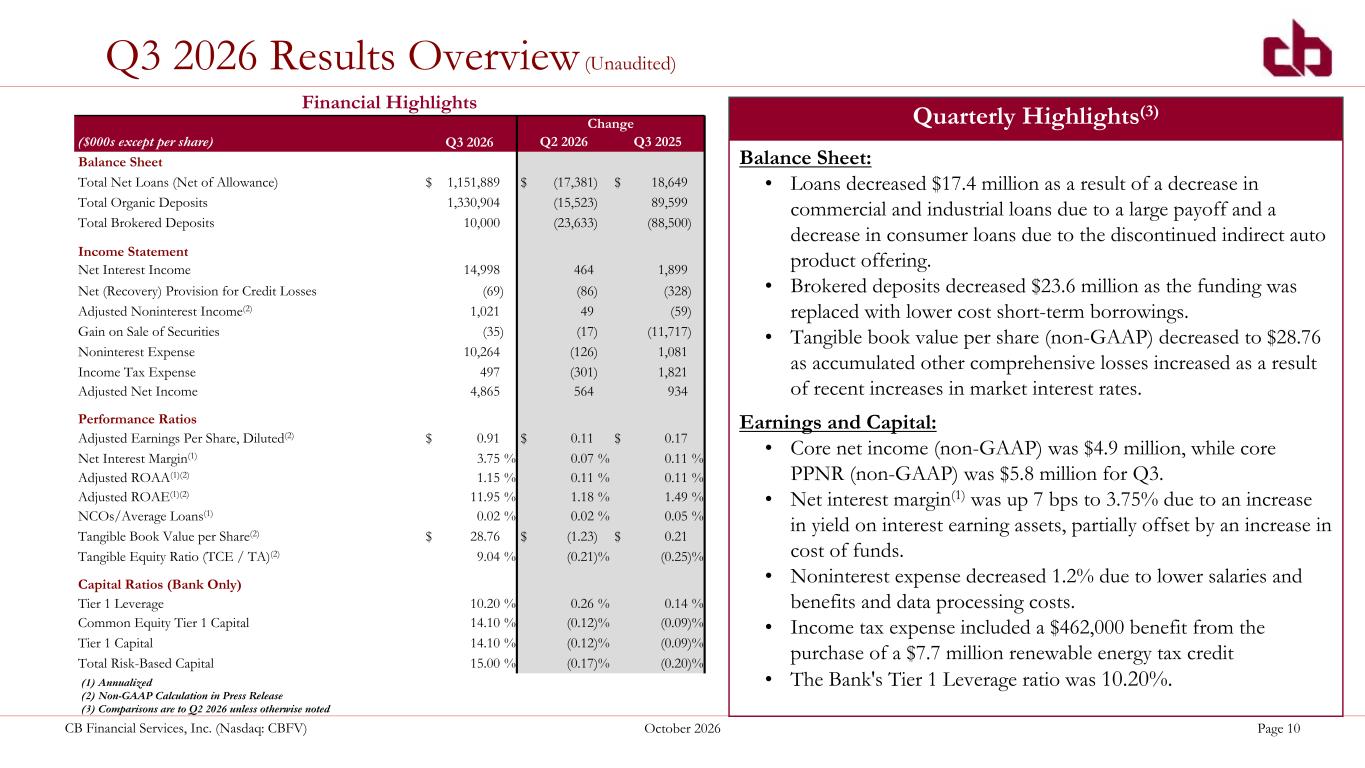
CB Financial Services, Inc. (Nasdaq: CBFV) October 2026 Page 10 Financial Highlights Change ($000s except per share) Q3 2026 Q2 2026 Q3 2025 Balance Sheet Total Net Loans (Net of Allowance) $ 1,151,889 $ (17,381) $ 18,649 Total Organic Deposits 1,330,904 (15,523) 89,599 Total Brokered Deposits 10,000 (23,633) (88,500) Income Statement Net Interest Income 14,998 464 1,899 Net (Recovery) Provision for Credit Losses (69) (86) (328) Adjusted Noninterest Income(2) 1,021 49 (59) Gain on Sale of Securities (35) (17) (11,717) Noninterest Expense 10,264 (126) 1,081 Income Tax Expense 497 (301) 1,821 Adjusted Net Income 4,865 564 934 Performance Ratios Adjusted Earnings Per Share, Diluted(2) $ 0.91 $ 0.11 $ 0.17 Net Interest Margin(1) 3.75 % 0.07 % 0.11 % Adjusted ROAA(1)(2) 1.15 % 0.11 % 0.11 % Adjusted ROAE(1)(2) 11.95 % 1.18 % 1.49 % NCOs/Average Loans(1) 0.02 % 0.02 % 0.05 % Tangible Book Value per Share(2) $ 28.76 $ (1.23) $ 0.21 Tangible Equity Ratio (TCE / TA)(2) 9.04 % (0.21) % (0.25) % Capital Ratios (Bank Only) Tier 1 Leverage 10.20 % 0.26 % 0.14 % Common Equity Tier 1 Capital 14.10 % (0.12) % (0.09) % Tier 1 Capital 14.10 % (0.12) % (0.09) % Total Risk-Based Capital 15.00 % (0.17) % (0.20) % Q3 2026 Results Overview (Unaudited) (1) Annualized (2) Non-GAAP Calculation in Press Release (3) Comparisons are to Q2 2026 unless otherwise noted Quarterly Highlights(3) Balance Sheet: • Loans decreased $17.4 million as a result of a decrease in commercial and industrial loans due to a large payoff and a decrease in consumer loans due to the discontinued indirect auto product offering. • Brokered deposits decreased $23.6 million as the funding was replaced with lower cost short-term borrowings. • Tangible book value per share (non-GAAP) decreased to $28.76 as accumulated other comprehensive losses increased as a result of recent increases in market interest rates. Earnings and Capital: • Core net income (non-GAAP) was $4.9 million, while core PPNR (non-GAAP) was $5.8 million for Q3. • Net interest margin(1) was up 7 bps to 3.75% due to an increase in yield on interest earning assets, partially offset by an increase in cost of funds. • Noninterest expense decreased 1.2% due to lower salaries and benefits and data processing costs. • Income tax expense included a $462,000 benefit from the purchase of a $7.7 million renewable energy tax credit • The Bank's Tier 1 Leverage ratio was 10.20%.
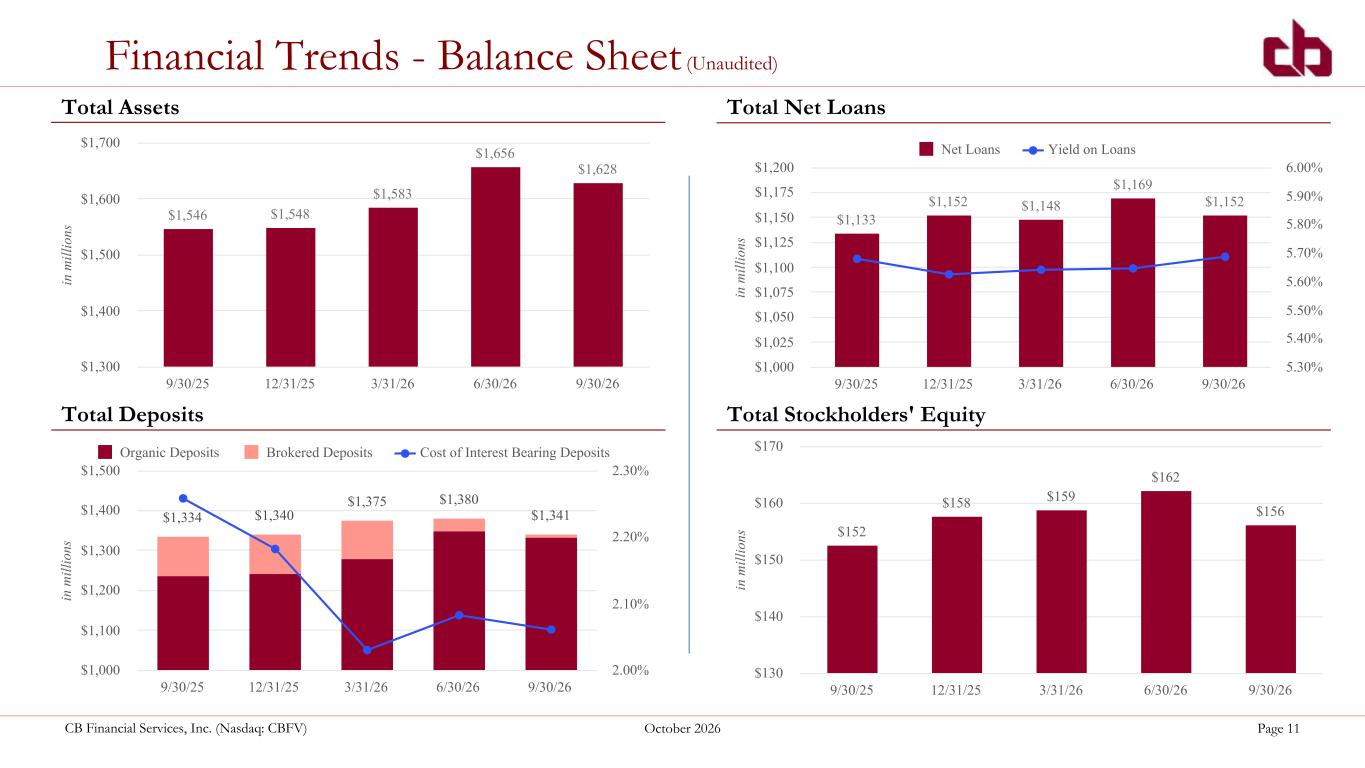
CB Financial Services, Inc. (Nasdaq: CBFV) October 2026 Page 11 Financial Trends - Balance Sheet (Unaudited) Total Net LoansTotal Assets Total Deposits Total Stockholders' Equity in m ill io ns $1,546 $1,548 $1,583 $1,656 $1,628 9/30/25 12/31/25 3/31/26 6/30/26 9/30/26 $1,300 $1,400 $1,500 $1,600 $1,700 in m ill io ns $1,133 $1,152 $1,148 $1,169 $1,152 Net Loans Yield on Loans 9/30/25 12/31/25 3/31/26 6/30/26 9/30/26 $1,000 $1,025 $1,050 $1,075 $1,100 $1,125 $1,150 $1,175 $1,200 5.30% 5.40% 5.50% 5.60% 5.70% 5.80% 5.90% 6.00% in m ill io ns $1,334 $1,340 $1,375 $1,380 $1,341 Organic Deposits Brokered Deposits Cost of Interest Bearing Deposits 9/30/25 12/31/25 3/31/26 6/30/26 9/30/26 $1,000 $1,100 $1,200 $1,300 $1,400 $1,500 2.00% 2.10% 2.20% 2.30% in m ill io ns $152 $158 $159 $162 $156 9/30/25 12/31/25 3/31/26 6/30/26 9/30/26 $130 $140 $150 $160 $170
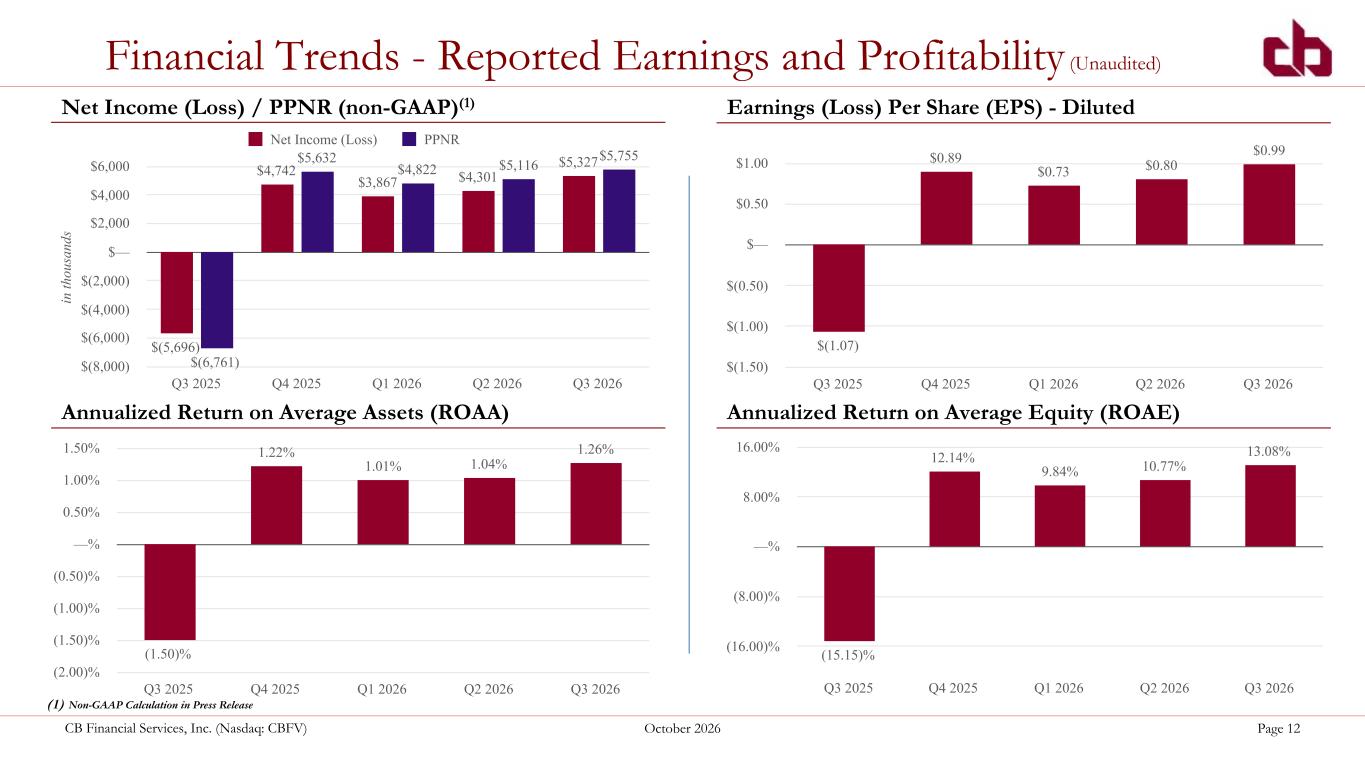
CB Financial Services, Inc. (Nasdaq: CBFV) October 2026 Page 12 Financial Trends - Reported Earnings and Profitability (Unaudited) Net Income (Loss) / PPNR (non-GAAP)(1) Earnings (Loss) Per Share (EPS) - Diluted in th ou sa nd s $(5,696) $4,742 $3,867 $4,301 $5,327 $(6,761) $5,632 $4,822 $5,116 $5,755 Net Income (Loss) PPNR Q3 2025 Q4 2025 Q1 2026 Q2 2026 Q3 2026 $(8,000) $(6,000) $(4,000) $(2,000) $— $2,000 $4,000 $6,000 $(1.07) $0.89 $0.73 $0.80 $0.99 Q3 2025 Q4 2025 Q1 2026 Q2 2026 Q3 2026 $(1.50) $(1.00) $(0.50) $— $0.50 $1.00 Annualized Return on Average Equity (ROAE) (15.15)% 12.14% 9.84% 10.77% 13.08% Q3 2025 Q4 2025 Q1 2026 Q2 2026 Q3 2026 (16.00)% (8.00)% —% 8.00% 16.00% Annualized Return on Average Assets (ROAA) (1.50)% 1.22% 1.01% 1.04% 1.26% Q3 2025 Q4 2025 Q1 2026 Q2 2026 Q3 2026 (2.00)% (1.50)% (1.00)% (0.50)% —% 0.50% 1.00% 1.50% (1) Non-GAAP Calculation in Press Release
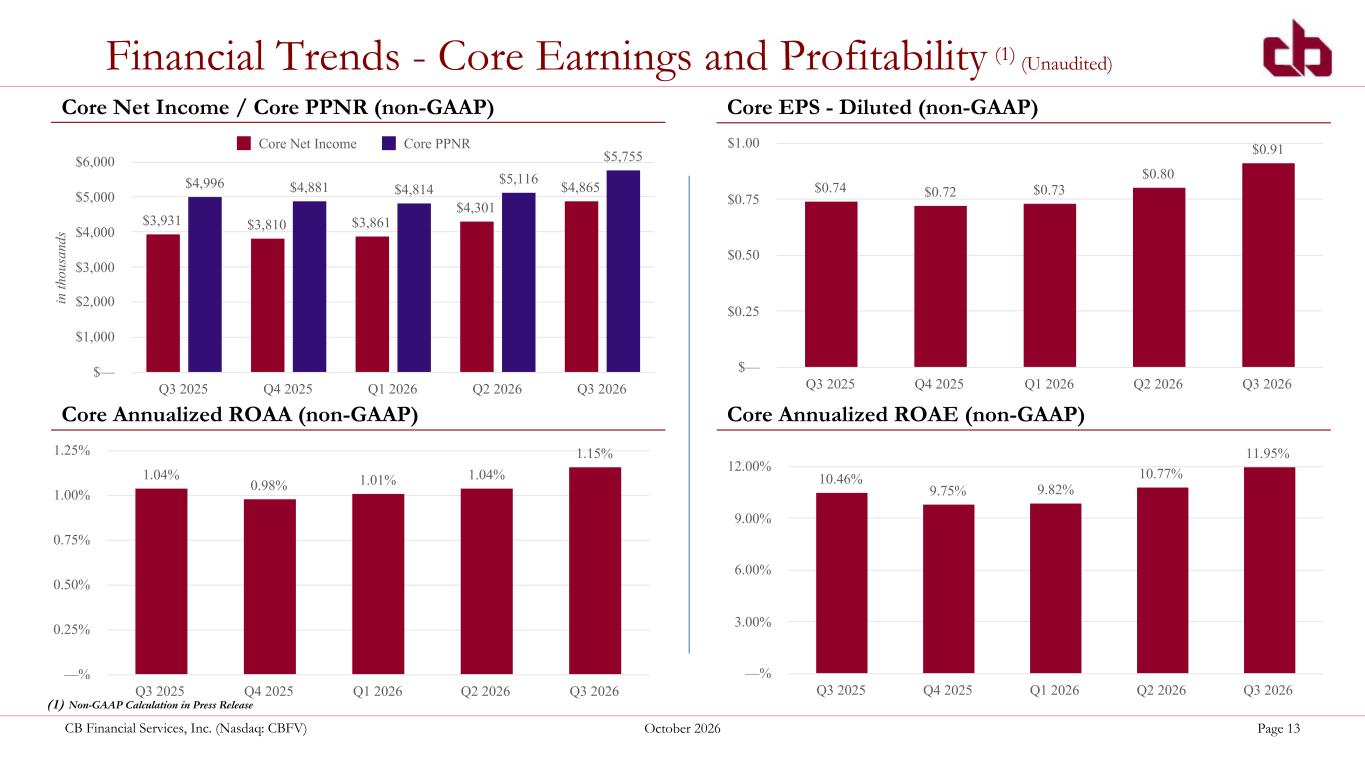
CB Financial Services, Inc. (Nasdaq: CBFV) October 2026 Page 13 Financial Trends - Core Earnings and Profitability (1) (Unaudited) Core Net Income / Core PPNR (non-GAAP) Core EPS - Diluted (non-GAAP) in th ou sa nd s $3,931 $3,810 $3,861 $4,301 $4,865$4,996 $4,881 $4,814 $5,116 $5,755 Core Net Income Core PPNR Q3 2025 Q4 2025 Q1 2026 Q2 2026 Q3 2026 $— $1,000 $2,000 $3,000 $4,000 $5,000 $6,000 $0.74 $0.72 $0.73 $0.80 $0.91 Q3 2025 Q4 2025 Q1 2026 Q2 2026 Q3 2026 $— $0.25 $0.50 $0.75 $1.00 Core Annualized ROAE (non-GAAP) 10.46% 9.75% 9.82% 10.77% 11.95% Q3 2025 Q4 2025 Q1 2026 Q2 2026 Q3 2026 —% 3.00% 6.00% 9.00% 12.00% Core Annualized ROAA (non-GAAP) 1.04% 0.98% 1.01% 1.04% 1.15% Q3 2025 Q4 2025 Q1 2026 Q2 2026 Q3 2026 —% 0.25% 0.50% 0.75% 1.00% 1.25% (1) Non-GAAP Calculation in Press Release
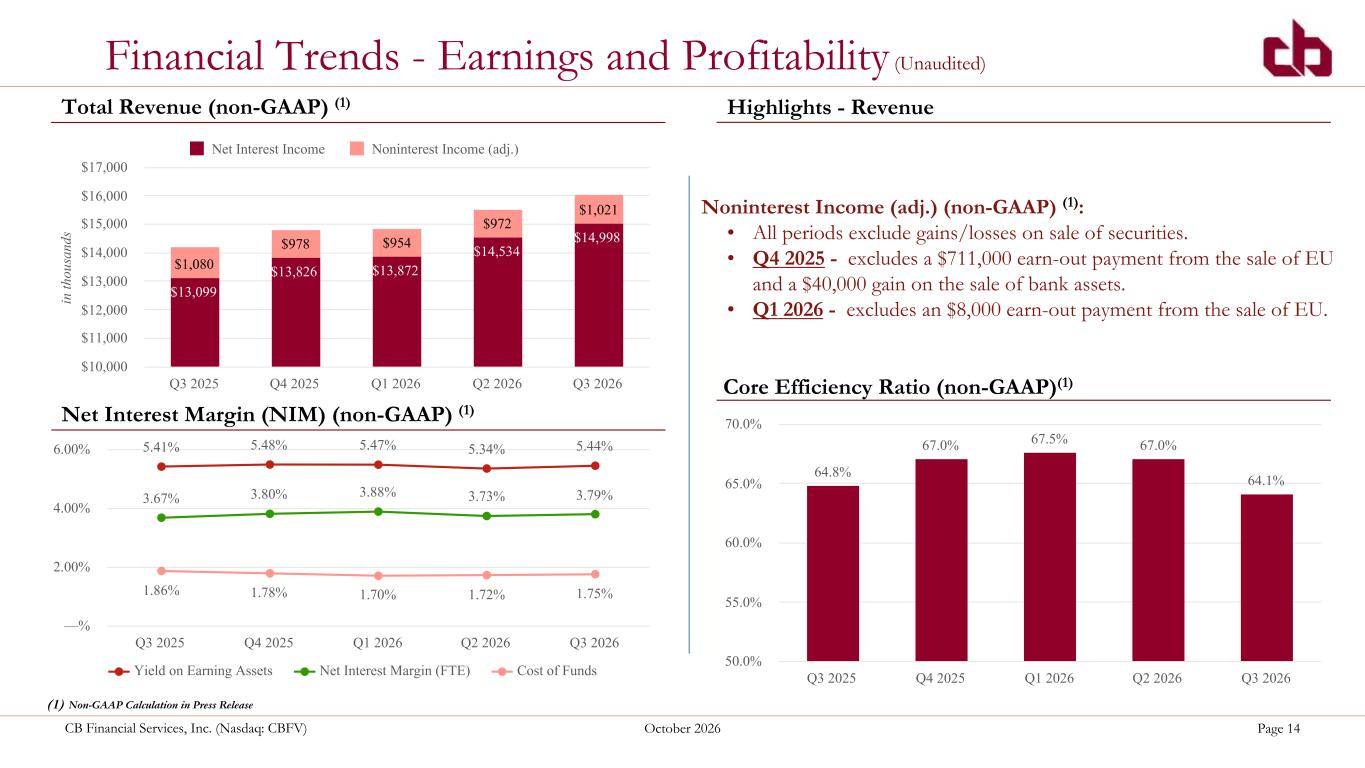
CB Financial Services, Inc. (Nasdaq: CBFV) October 2026 Page 14 Financial Trends - Earnings and Profitability (Unaudited) Total Revenue (non-GAAP) (1) Highlights - Revenue Core Efficiency Ratio (non-GAAP)(1) in th ou sa nd s $13,099 $13,826 $13,872 $14,534 $14,998 $1,080 $978 $954 $972 $1,021 Net Interest Income Noninterest Income (adj.) Q3 2025 Q4 2025 Q1 2026 Q2 2026 Q3 2026 $10,000 $11,000 $12,000 $13,000 $14,000 $15,000 $16,000 $17,000 64.8% 67.0% 67.5% 67.0% 64.1% Q3 2025 Q4 2025 Q1 2026 Q2 2026 Q3 2026 50.0% 55.0% 60.0% 65.0% 70.0%Net Interest Margin (NIM) (non-GAAP) (1) 5.41% 5.48% 5.47% 5.34% 5.44% 3.67% 3.80% 3.88% 3.73% 3.79% 1.86% 1.78% 1.70% 1.72% 1.75% Yield on Earning Assets Net Interest Margin (FTE) Cost of Funds Q3 2025 Q4 2025 Q1 2026 Q2 2026 Q3 2026 —% 2.00% 4.00% 6.00% Noninterest Income (adj.) (non-GAAP) (1): • All periods exclude gains/losses on sale of securities. • Q4 2025 - excludes a $711,000 earn-out payment from the sale of EU and a $40,000 gain on the sale of bank assets. • Q1 2026 - excludes an $8,000 earn-out payment from the sale of EU. (1) Non-GAAP Calculation in Press Release $13,099 $13,826 $13,872 $14,534 $14,998 $(10,677) $1,729 $962 $972 $1,021 Net Interest Income Noninterest Income Q3 2025 Q4 2025 Q1 2026 Q2 2026 Q3 2026 $(20,000) $(10,000) $— $10,000 $20,000
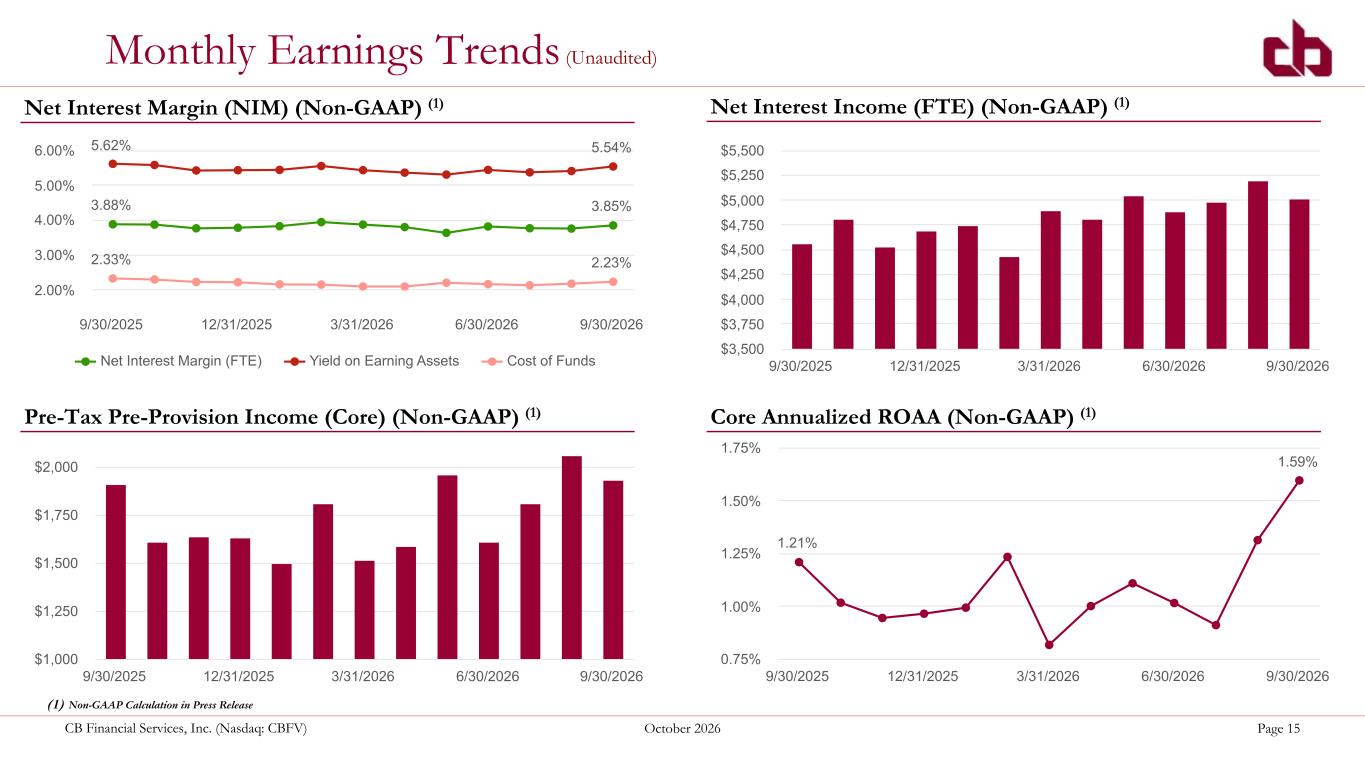
CB Financial Services, Inc. (Nasdaq: CBFV) October 2026 Page 15 Monthly Earnings Trends (Unaudited) 3.88% 3.85% 5.62% 5.54% 2.33% 2.23% Net Interest Margin (FTE) Yield on Earning Assets Cost of Funds 9/30/2025 12/31/2025 3/31/2026 6/30/2026 9/30/2026 2.00% 3.00% 4.00% 5.00% 6.00% Net Interest Margin (NIM) (Non-GAAP) (1) 9/30/2025 12/31/2025 3/31/2026 6/30/2026 9/30/2026 $1,000 $1,250 $1,500 $1,750 $2,000 Pre-Tax Pre-Provision Income (Core) (Non-GAAP) (1) 1.21% 1.59% 9/30/2025 12/31/2025 3/31/2026 6/30/2026 9/30/2026 0.75% 1.00% 1.25% 1.50% 1.75% Core Annualized ROAA (Non-GAAP) (1) 9/30/2025 12/31/2025 3/31/2026 6/30/2026 9/30/2026 $3,500 $3,750 $4,000 $4,250 $4,500 $4,750 $5,000 $5,250 $5,500 Net Interest Income (FTE) (Non-GAAP) (1) (1) Non-GAAP Calculation in Press Release

Deposit Composition / Characteristics
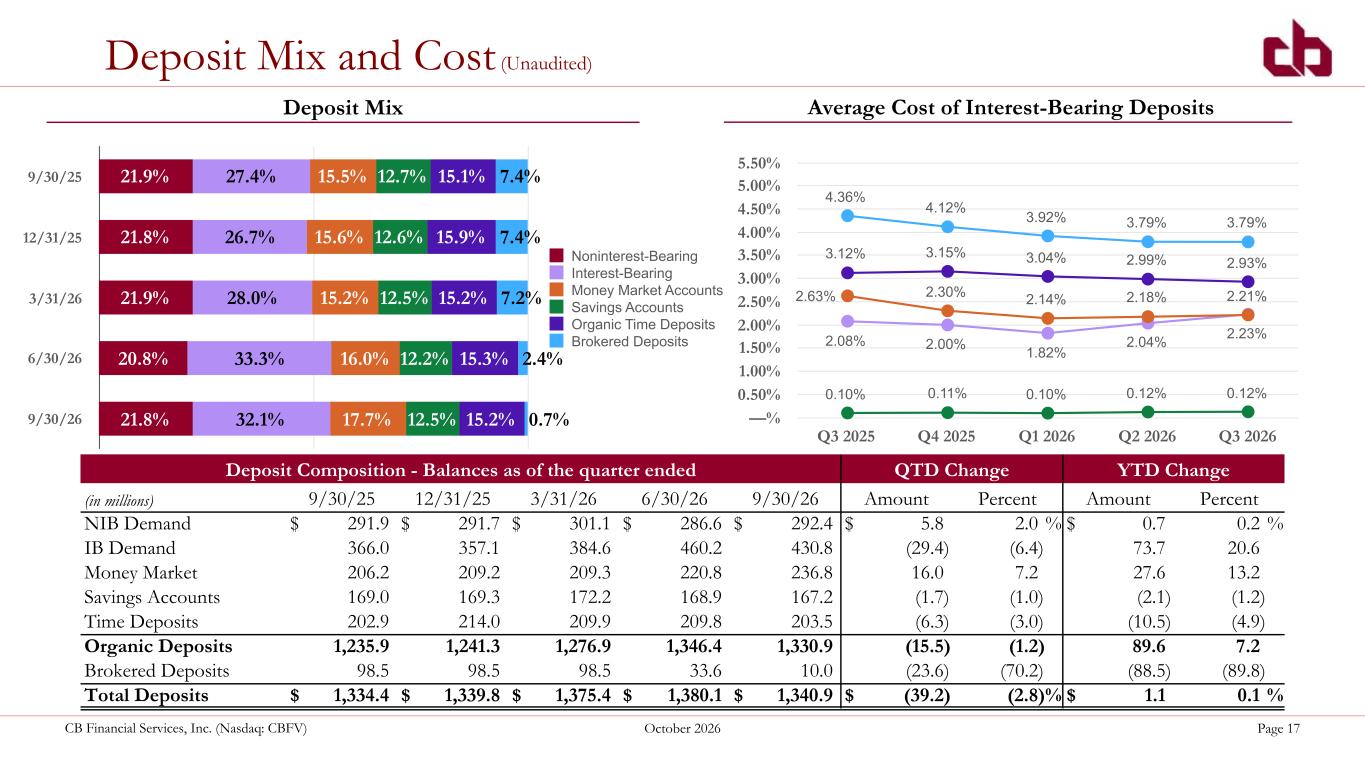
CB Financial Services, Inc. (Nasdaq: CBFV) October 2026 Page 17 Deposit Mix and Cost (Unaudited) Deposit Mix Average Cost of Interest-Bearing Deposits Deposit Composition - Balances as of the quarter ended QTD Change YTD Change (in millions) 9/30/25 12/31/25 3/31/26 6/30/26 9/30/26 Amount Percent Amount Percent NIB Demand $ 291.9 $ 291.7 $ 301.1 $ 286.6 $ 292.4 $ 5.8 2.0 % $ 0.7 0.2 % IB Demand 366.0 357.1 384.6 460.2 430.8 (29.4) (6.4) 73.7 20.6 Money Market 206.2 209.2 209.3 220.8 236.8 16.0 7.2 27.6 13.2 Savings Accounts 169.0 169.3 172.2 168.9 167.2 (1.7) (1.0) (2.1) (1.2) Time Deposits 202.9 214.0 209.9 209.8 203.5 (6.3) (3.0) (10.5) (4.9) Organic Deposits 1,235.9 1,241.3 1,276.9 1,346.4 1,330.9 (15.5) (1.2) 89.6 7.2 Brokered Deposits 98.5 98.5 98.5 33.6 10.0 (23.6) (70.2) (88.5) (89.8) Total Deposits $ 1,334.4 $ 1,339.8 $ 1,375.4 $ 1,380.1 $ 1,340.9 $ (39.2) (2.8) % $ 1.1 0.1 % 2.08% 2.00% 1.82% 2.04% 2.23% 2.63% 2.30% 2.14% 2.18% 2.21% 0.10% 0.11% 0.10% 0.12% 0.12% 3.12% 3.15% 3.04% 2.99% 2.93% 4.36% 4.12% 3.92% 3.79% 3.79% Q3 2025 Q4 2025 Q1 2026 Q2 2026 Q3 2026 —% 0.50% 1.00% 1.50% 2.00% 2.50% 3.00% 3.50% 4.00% 4.50% 5.00% 5.50% 21.9% 21.8% 21.9% 20.8% 21.8% 27.4% 26.7% 28.0% 33.3% 32.1% 15.5% 15.6% 15.2% 16.0% 17.7% 12.7% 12.6% 12.5% 12.2% 12.5% 15.1% 15.9% 15.2% 15.3% 15.2% 7.4% 7.4% 7.2% 2.4% 0.7% Noninterest-Bearing Interest-Bearing Money Market Accounts Savings Accounts Organic Time Deposits Brokered Deposits 9/30/25 12/31/25 3/31/26 6/30/26 9/30/26
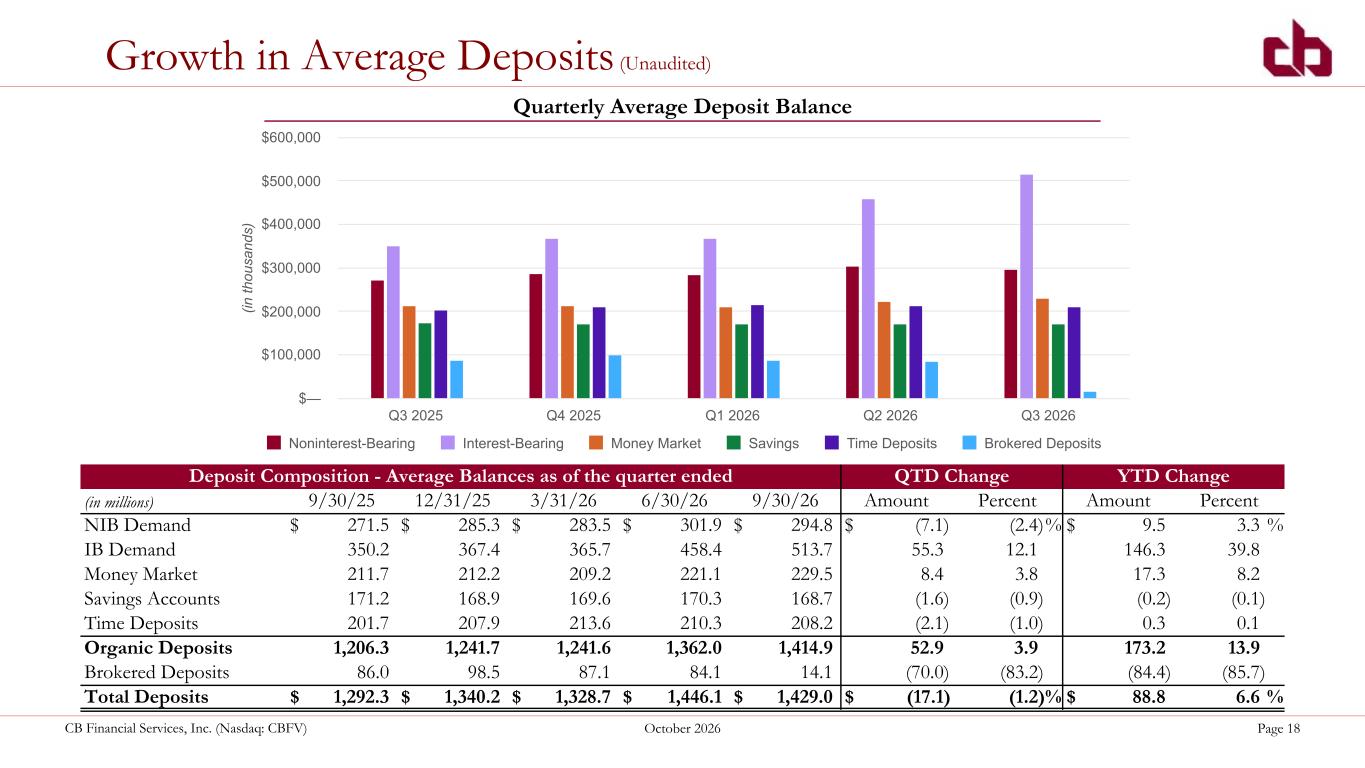
CB Financial Services, Inc. (Nasdaq: CBFV) October 2026 Page 18 Growth in Average Deposits (Unaudited) Deposit Composition - Average Balances as of the quarter ended QTD Change YTD Change (in millions) 9/30/25 12/31/25 3/31/26 6/30/26 9/30/26 Amount Percent Amount Percent NIB Demand $ 271.5 $ 285.3 $ 283.5 $ 301.9 $ 294.8 $ (7.1) (2.4) % $ 9.5 3.3 % IB Demand 350.2 367.4 365.7 458.4 513.7 55.3 12.1 146.3 39.8 Money Market 211.7 212.2 209.2 221.1 229.5 8.4 3.8 17.3 8.2 Savings Accounts 171.2 168.9 169.6 170.3 168.7 (1.6) (0.9) (0.2) (0.1) Time Deposits 201.7 207.9 213.6 210.3 208.2 (2.1) (1.0) 0.3 0.1 Organic Deposits 1,206.3 1,241.7 1,241.6 1,362.0 1,414.9 52.9 3.9 173.2 13.9 Brokered Deposits 86.0 98.5 87.1 84.1 14.1 (70.0) (83.2) (84.4) (85.7) Total Deposits $ 1,292.3 $ 1,340.2 $ 1,328.7 $ 1,446.1 $ 1,429.0 $ (17.1) (1.2) % $ 88.8 6.6 % (in th ou sa nd s) Noninterest-Bearing Interest-Bearing Money Market Savings Time Deposits Brokered Deposits Q3 2025 Q4 2025 Q1 2026 Q2 2026 Q3 2026 $— $100,000 $200,000 $300,000 $400,000 $500,000 $600,000 Quarterly Average Deposit Balance
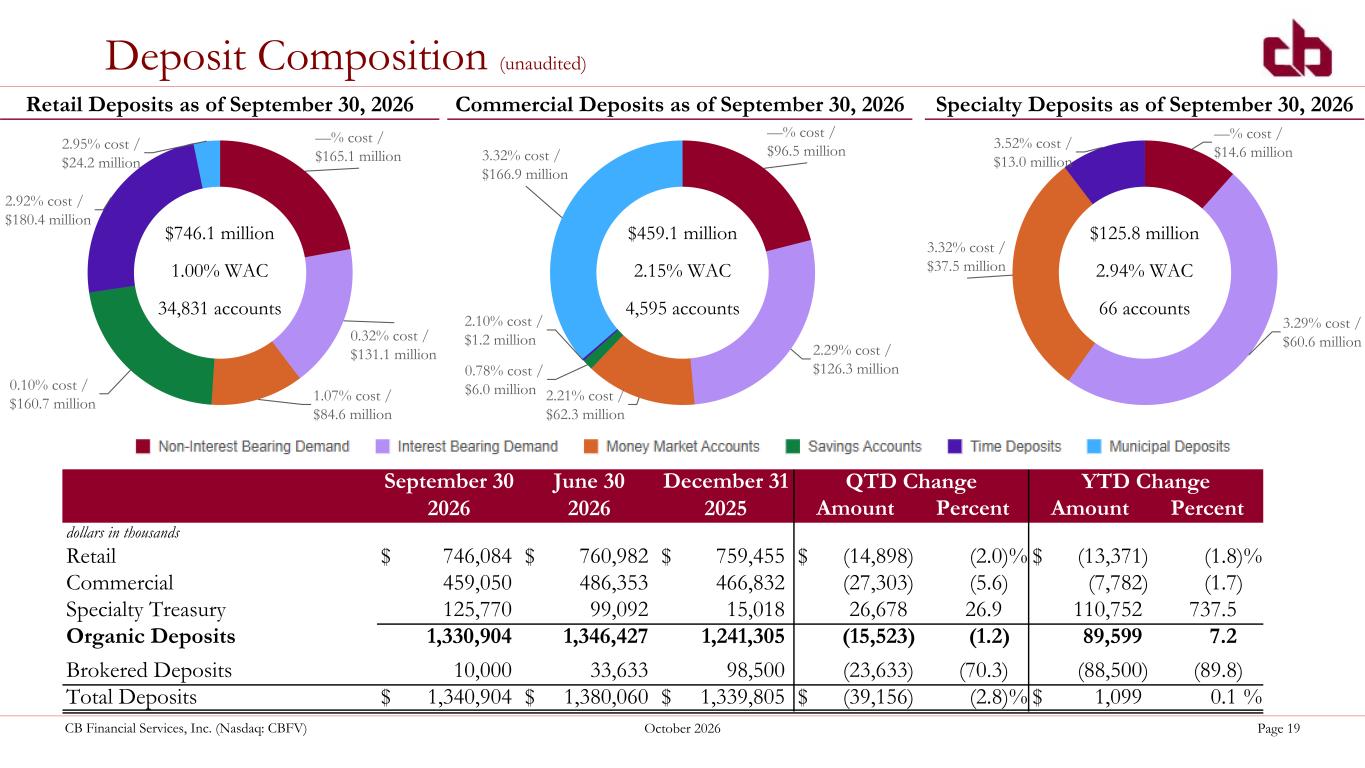
CB Financial Services, Inc. (Nasdaq: CBFV) October 2026 Page 19 —% cost / $165.1 million 0.32% cost / $131.1 million 1.07% cost / $84.6 million 0.10% cost / $160.7 million 2.92% cost / $180.4 million 2.95% cost / $24.2 million Deposit Composition (unaudited) Retail Deposits as of September 30, 2026 $746.1 million 1.00% WAC 34,831 accounts —% cost / $96.5 million 2.29% cost / $126.3 million 2.21% cost / $62.3 million 0.78% cost / $6.0 million 2.10% cost / $1.2 million 3.32% cost / $166.9 million Commercial Deposits as of September 30, 2026 $459.1 million 2.15% WAC 4,595 accounts —% cost / $14.6 million 3.29% cost / $60.6 million 3.32% cost / $37.5 million 3.52% cost / $13.0 million Specialty Deposits as of September 30, 2026 $125.8 million 2.94% WAC 66 accounts —% cost / $168.7 million 0.28% cost / $129.9 million 1.27% cost / $88.9 million 0.08% cost / $163.3 million 3.13% cost / $188.1 million 3.04% cost / $20.6 million Retail Deposits as of December 31, 2025 $759.5 million 1.07% WAC 35,798 accounts —% cost / $116.8 million 2.28% cost / $118.2 million2.29% cost / $57.8 million 0.61% cost / $5.5 million 2.73% cost / $1.9 million 3.33% cost / $166.6 million Commercial Deposits as of December 31, 2025 $466.8 million 2.07% WAC 4,448 accounts 3.75% cost / $1.5 million 3.69% cost / $13.6 million —% 3.75% —% —% 3.69% —% Specialty Deposits as of December 31, 2025 $15.0 million 3.70% WAC 43 accounts September 30 2026 June 30 2026 December 31 2025 QTD Change YTD Change Amount Percent Amount Percent dollars in thousands Retail $ 746,084 $ 760,982 $ 759,455 $ (14,898) (2.0) % $ (13,371) (1.8) % Commercial 459,050 486,353 466,832 (27,303) (5.6) (7,782) (1.7) Specialty Treasury 125,770 99,092 15,018 26,678 26.9 110,752 737.5 Organic Deposits 1,330,904 1,346,427 1,241,305 (15,523) (1.2) 89,599 7.2 Brokered Deposits 10,000 33,633 98,500 (23,633) (70.3) (88,500) (89.8) Total Deposits $ 1,340,904 $ 1,380,060 $ 1,339,805 $ (39,156) (2.8) % $ 1,099 0.1 %
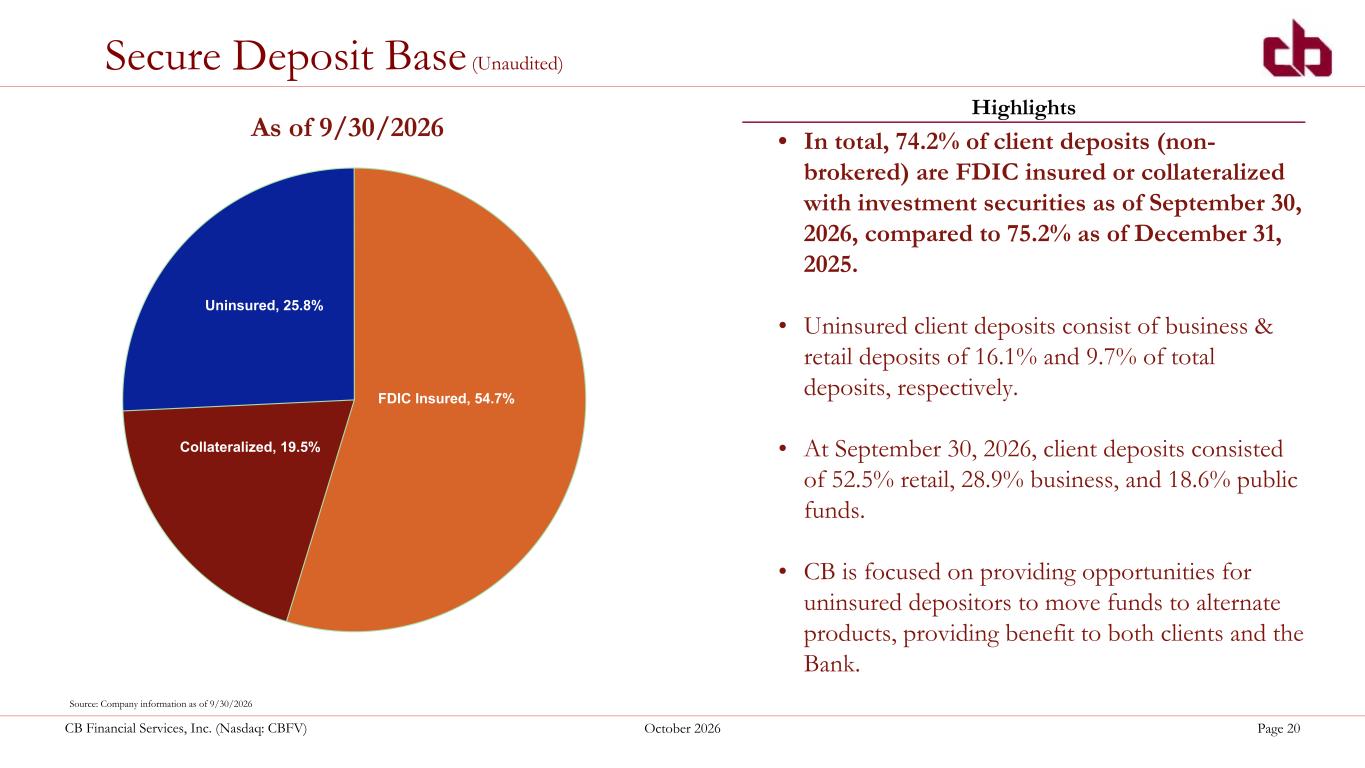
CB Financial Services, Inc. (Nasdaq: CBFV) October 2026 Page 20 Secure Deposit Base (Unaudited) • In total, 74.2% of client deposits (non- brokered) are FDIC insured or collateralized with investment securities as of September 30, 2026, compared to 75.2% as of December 31, 2025. • Uninsured client deposits consist of business & retail deposits of 16.1% and 9.7% of total deposits, respectively. • At September 30, 2026, client deposits consisted of 52.5% retail, 28.9% business, and 18.6% public funds. • CB is focused on providing opportunities for uninsured depositors to move funds to alternate products, providing benefit to both clients and the Bank. FDIC Insured, 54.7% Collateralized, 19.5% Uninsured, 25.8% Source: Company information as of 9/30/2026 As of 9/30/2026 Highlights
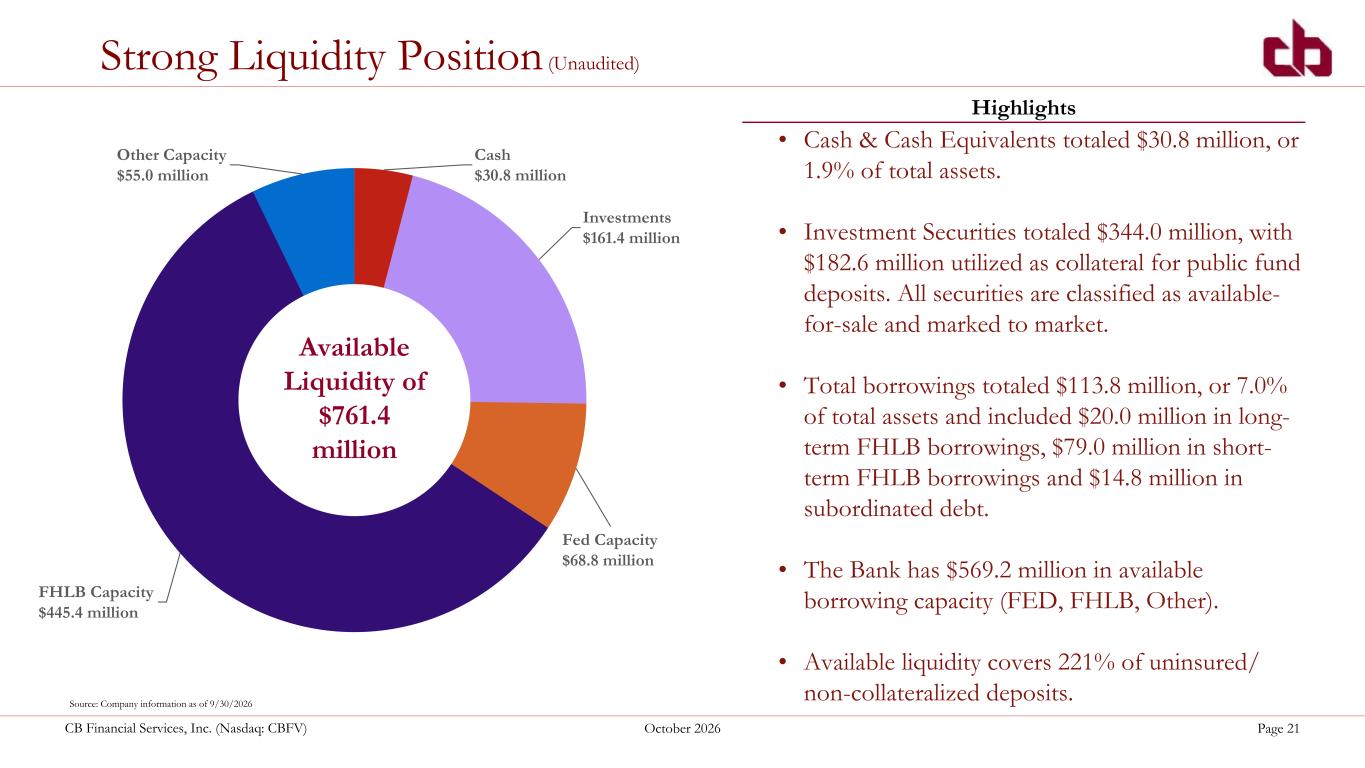
CB Financial Services, Inc. (Nasdaq: CBFV) October 2026 Page 21 Strong Liquidity Position (Unaudited) $1,815 0.7% $37,825 13.8% $102,157 37.3% $109,612 40.0% $21,586 7.9% $864 0.3% Government Agency Municipal MBS's CMO's Corporate Debt Marketable Equity Cash $30.8 million Investments $161.4 million Fed Capacity $68.8 million FHLB Capacity $445.4 million Other Capacity $55.0 million Available Liquidity of $761.4 million Highlights Source: Company information as of 9/30/2026 • Cash & Cash Equivalents totaled $30.8 million, or 1.9% of total assets. • Investment Securities totaled $344.0 million, with $182.6 million utilized as collateral for public fund deposits. All securities are classified as available- for-sale and marked to market. • Total borrowings totaled $113.8 million, or 7.0% of total assets and included $20.0 million in long- term FHLB borrowings, $79.0 million in short- term FHLB borrowings and $14.8 million in subordinated debt. • The Bank has $569.2 million in available borrowing capacity (FED, FHLB, Other). • Available liquidity covers 221% of uninsured/ non-collateralized deposits.

Loan Portfolio Composition
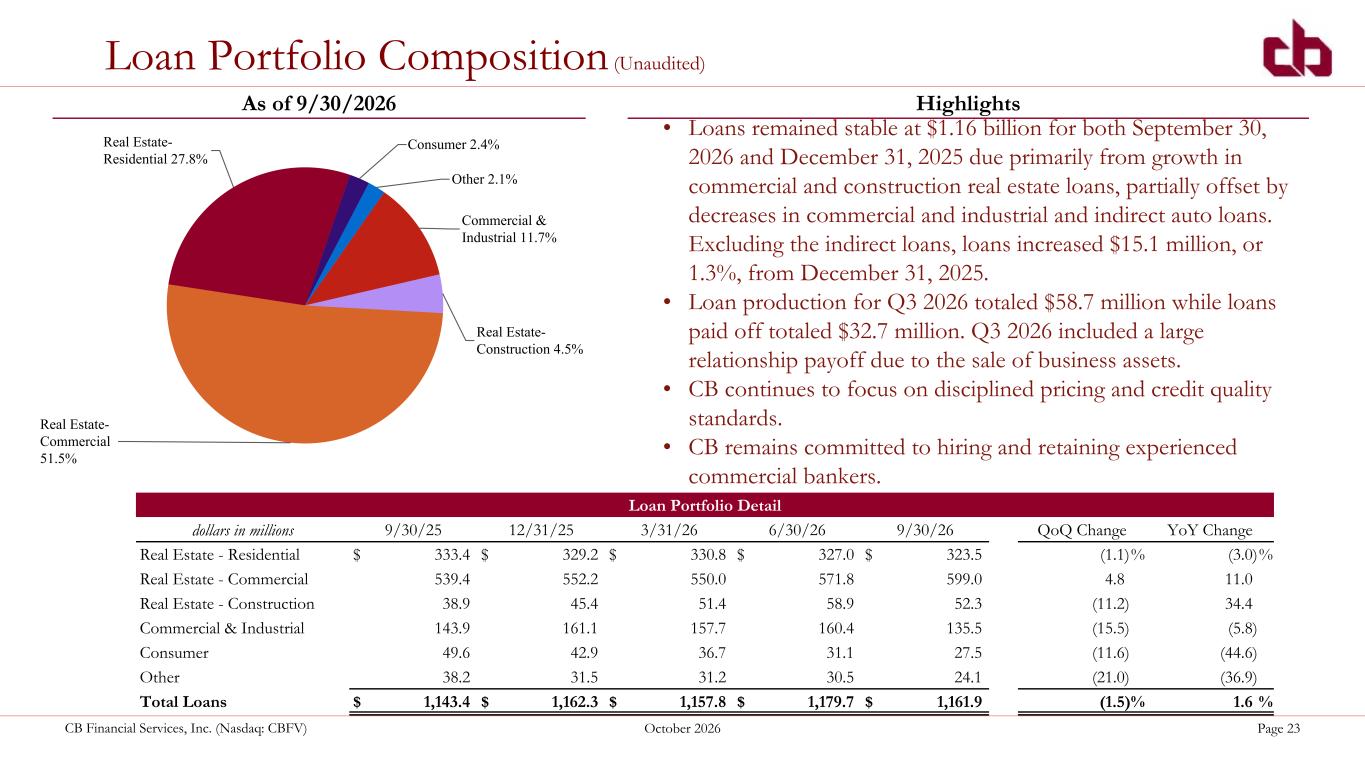
CB Financial Services, Inc. (Nasdaq: CBFV) October 2026 Page 23 Loan Portfolio Composition (Unaudited) Commercial & Industrial 11.7% Real Estate- Construction 4.5% Real Estate- Commercial 51.5% Real Estate- Residential 27.8% Consumer 2.4% Other 2.1% As of 9/30/2026 Loan Portfolio Detail dollars in millions 9/30/25 12/31/25 3/31/26 6/30/26 9/30/26 QoQ Change YoY Change Real Estate - Residential $ 333.4 $ 329.2 $ 330.8 $ 327.0 $ 323.5 (1.1) % (3.0) % Real Estate - Commercial 539.4 552.2 550.0 571.8 599.0 4.8 11.0 Real Estate - Construction 38.9 45.4 51.4 58.9 52.3 (11.2) 34.4 Commercial & Industrial 143.9 161.1 157.7 160.4 135.5 (15.5) (5.8) Consumer 49.6 42.9 36.7 31.1 27.5 (11.6) (44.6) Other 38.2 31.5 31.2 30.5 24.1 (21.0) (36.9) Total Loans $ 1,143.4 $ 1,162.3 $ 1,157.8 $ 1,179.7 $ 1,161.9 (1.5) % 1.6 % Highlights • Loans remained stable at $1.16 billion for both September 30, 2026 and December 31, 2025 due primarily from growth in commercial and construction real estate loans, partially offset by decreases in commercial and industrial and indirect auto loans. Excluding the indirect loans, loans increased $15.1 million, or 1.3%, from December 31, 2025. • Loan production for Q3 2026 totaled $58.7 million while loans paid off totaled $32.7 million. Q3 2026 included a large relationship payoff due to the sale of business assets. • CB continues to focus on disciplined pricing and credit quality standards. • CB remains committed to hiring and retaining experienced commercial bankers.
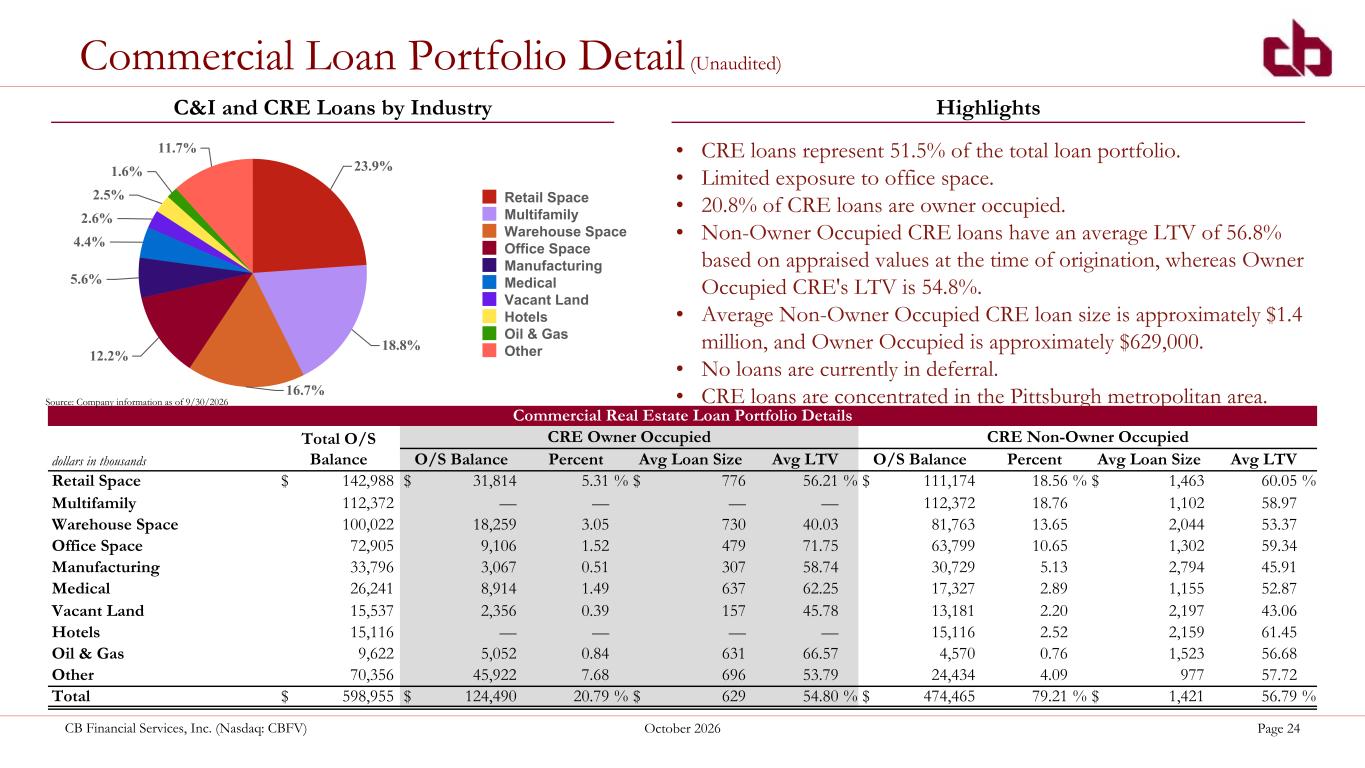
CB Financial Services, Inc. (Nasdaq: CBFV) October 2026 Page 24 Commercial Loan Portfolio Detail (Unaudited) 23.9% 18.8% 16.7% 12.2% 5.6% 4.4% 2.6% 2.5% 1.6% 11.7% Retail Space Multifamily Warehouse Space Office Space Manufacturing Medical Vacant Land Hotels Oil & Gas Other C&I and CRE Loans by Industry Highlights Commercial Real Estate Loan Portfolio Details Total O/S Balance CRE Owner Occupied CRE Non-Owner Occupied dollars in thousands O/S Balance Percent Avg Loan Size Avg LTV O/S Balance Percent Avg Loan Size Avg LTV Retail Space $ 142,988 $ 31,814 5.31 % $ 776 56.21 % $ 111,174 18.56 % $ 1,463 60.05 % Multifamily 112,372 — — — — 112,372 18.76 1,102 58.97 Warehouse Space 100,022 18,259 3.05 730 40.03 81,763 13.65 2,044 53.37 Office Space 72,905 9,106 1.52 479 71.75 63,799 10.65 1,302 59.34 Manufacturing 33,796 3,067 0.51 307 58.74 30,729 5.13 2,794 45.91 Medical 26,241 8,914 1.49 637 62.25 17,327 2.89 1,155 52.87 Vacant Land 15,537 2,356 0.39 157 45.78 13,181 2.20 2,197 43.06 Hotels 15,116 — — — — 15,116 2.52 2,159 61.45 Oil & Gas 9,622 5,052 0.84 631 66.57 4,570 0.76 1,523 56.68 Other 70,356 45,922 7.68 696 53.79 24,434 4.09 977 57.72 Total $ 598,955 $ 124,490 20.79 % $ 629 54.80 % $ 474,465 79.21 % $ 1,421 56.79 % • CRE loans represent 51.5% of the total loan portfolio. • Limited exposure to office space. • 20.8% of CRE loans are owner occupied. • Non-Owner Occupied CRE loans have an average LTV of 56.8% based on appraised values at the time of origination, whereas Owner Occupied CRE's LTV is 54.8%. • Average Non-Owner Occupied CRE loan size is approximately $1.4 million, and Owner Occupied is approximately $629,000. • No loans are currently in deferral. • CRE loans are concentrated in the Pittsburgh metropolitan area.Source: Company information as of 9/30/2026
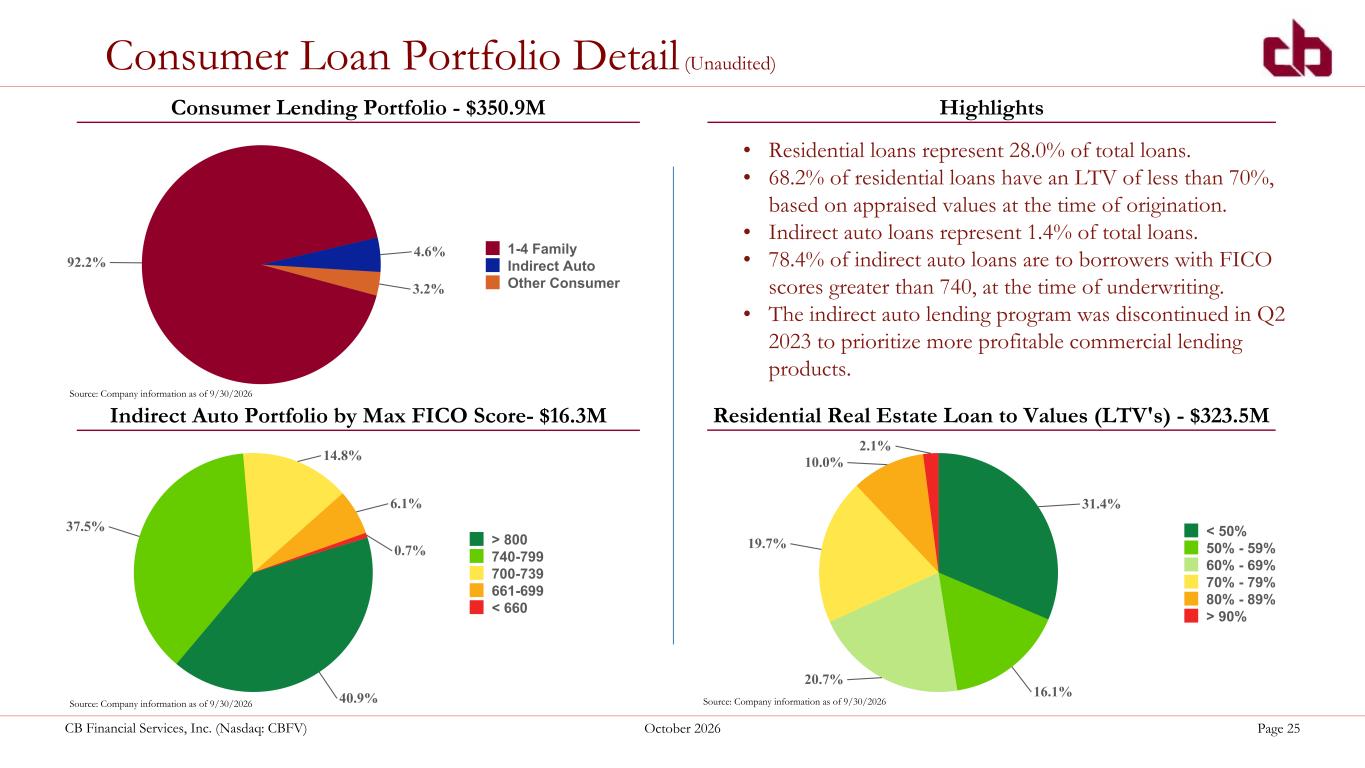
CB Financial Services, Inc. (Nasdaq: CBFV) October 2026 Page 25 Consumer Loan Portfolio Detail (Unaudited) 92.2% 4.6% 3.2% 1-4 Family Indirect Auto Other Consumer 31.4% 16.1% 20.7% 19.7% 10.0% 2.1% < 50% 50% - 59% 60% - 69% 70% - 79% 80% - 89% > 90% 40.9% 37.5% 14.8% 6.1% 0.7% > 800 740-799 700-739 661-699 < 660 Consumer Lending Portfolio - $350.9M Residential Real Estate Loan to Values (LTV's) - $323.5MIndirect Auto Portfolio by Max FICO Score- $16.3M Highlights • Residential loans represent 28.0% of total loans. • 68.2% of residential loans have an LTV of less than 70%, based on appraised values at the time of origination. • Indirect auto loans represent 1.4% of total loans. • 78.4% of indirect auto loans are to borrowers with FICO scores greater than 740, at the time of underwriting. • The indirect auto lending program was discontinued in Q2 2023 to prioritize more profitable commercial lending products. Source: Company information as of 9/30/2026 Source: Company information as of 9/30/2026 Source: Company information as of 9/30/2026

Asset Quality, Capital Ratios and IRR
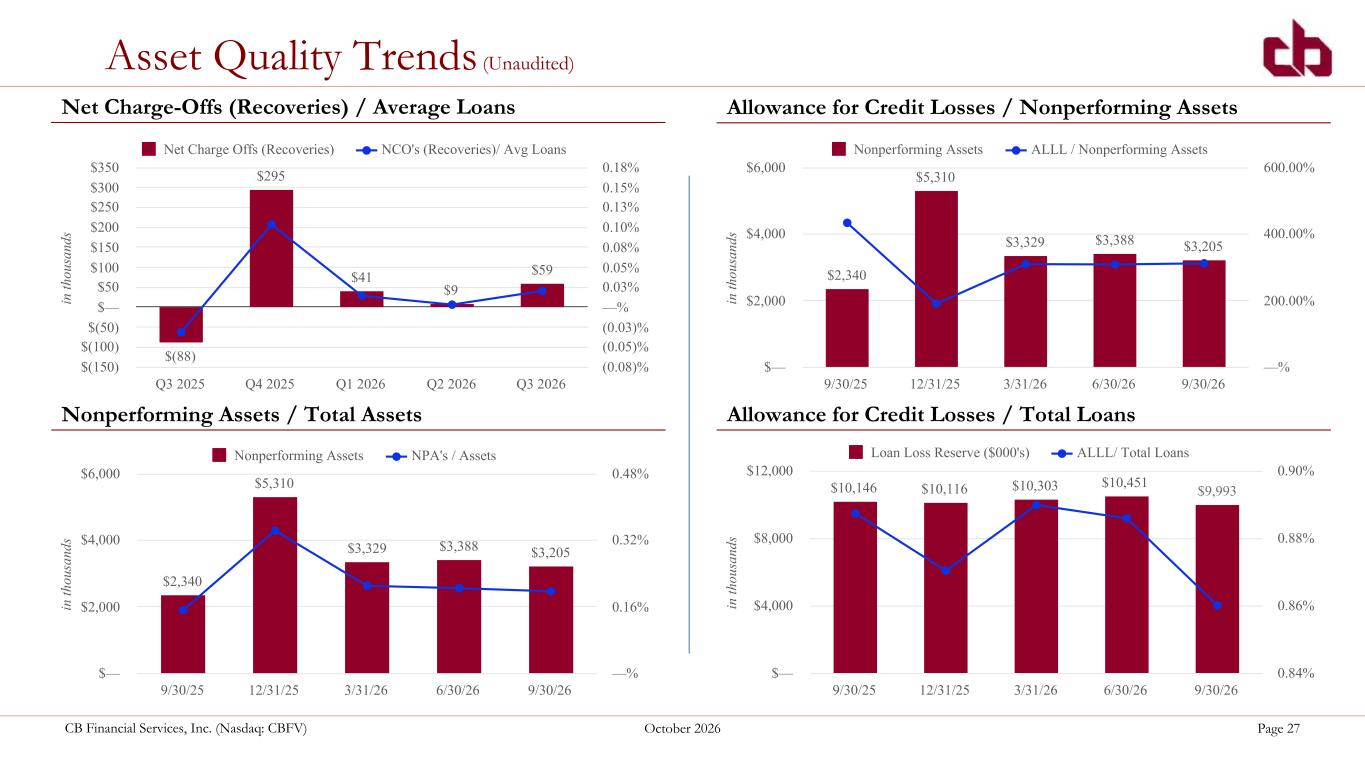
CB Financial Services, Inc. (Nasdaq: CBFV) October 2026 Page 27 Asset Quality Trends (Unaudited) Net Charge-Offs (Recoveries) / Average Loans Allowance for Credit Losses / Total LoansNonperforming Assets / Total Assets in th ou sa nd s $2,340 $5,310 $3,329 $3,388 $3,205 Nonperforming Assets NPA's / Assets 9/30/25 12/31/25 3/31/26 6/30/26 9/30/26 $— $2,000 $4,000 $6,000 —% 0.16% 0.32% 0.48% Allowance for Credit Losses / Nonperforming Assets Nonperforming Loans to Total Loans $2,182 $5,310 $3,329 $3,388 $3,205 Nonperforming Loans (000's) Nonperforming/Total Loans 9/30/25 12/31/25 3/31/26 6/30/26 9/30/26 $— $2,000 $4,000 $6,000 0.15% 0.20% 0.25% in th ou sa nd s $(88) $295 $41 $9 $59 Net Charge Offs (Recoveries) NCO's (Recoveries)/ Avg Loans Q3 2025 Q4 2025 Q1 2026 Q2 2026 Q3 2026 $(150) $(100) $(50) $— $50 $100 $150 $200 $250 $300 $350 (0.08)% (0.05)% (0.03)% —% 0.03% 0.05% 0.08% 0.10% 0.13% 0.15% 0.18% in th ou sa nd s $10,146 $10,116 $10,303 $10,451 $9,993 Loan Loss Reserve ($000's) ALLL/ Total Loans 9/30/25 12/31/25 3/31/26 6/30/26 9/30/26 $— $4,000 $8,000 $12,000 0.84% 0.86% 0.88% 0.90% in th ou sa nd s $2,340 $5,310 $3,329 $3,388 $3,205 Nonperforming Assets ALLL / Nonperforming Assets 9/30/25 12/31/25 3/31/26 6/30/26 9/30/26 $— $2,000 $4,000 $6,000 —% 200.00% 400.00% 600.00%
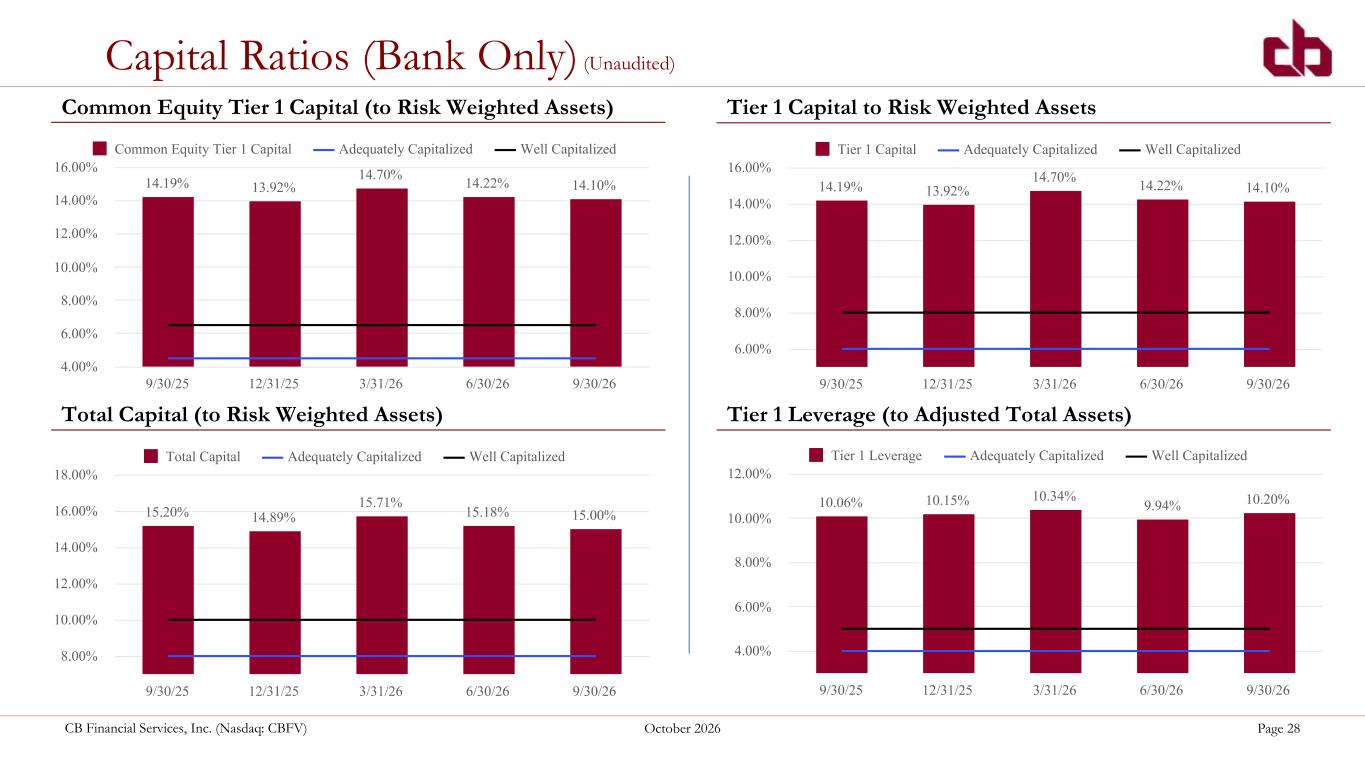
CB Financial Services, Inc. (Nasdaq: CBFV) October 2026 Page 28 Capital Ratios (Bank Only) (Unaudited) Common Equity Tier 1 Capital (to Risk Weighted Assets) Tier 1 Capital to Risk Weighted Assets 14.19% 13.92% 14.70% 14.22% 14.10% Common Equity Tier 1 Capital Adequately Capitalized Well Capitalized 9/30/25 12/31/25 3/31/26 6/30/26 9/30/26 4.00% 6.00% 8.00% 10.00% 12.00% 14.00% 16.00% 14.19% 13.92% 14.70% 14.22% 14.10% Tier 1 Capital Adequately Capitalized Well Capitalized 9/30/25 12/31/25 3/31/26 6/30/26 9/30/26 6.00% 8.00% 10.00% 12.00% 14.00% 16.00% Tier 1 Leverage (to Adjusted Total Assets) 10.06% 10.15% 10.34% 9.94% 10.20% Tier 1 Leverage Adequately Capitalized Well Capitalized 9/30/25 12/31/25 3/31/26 6/30/26 9/30/26 4.00% 6.00% 8.00% 10.00% 12.00% Total Capital (to Risk Weighted Assets) 15.20% 14.89% 15.71% 15.18% 15.00% Total Capital Adequately Capitalized Well Capitalized 9/30/25 12/31/25 3/31/26 6/30/26 9/30/26 8.00% 10.00% 12.00% 14.00% 16.00% 18.00%
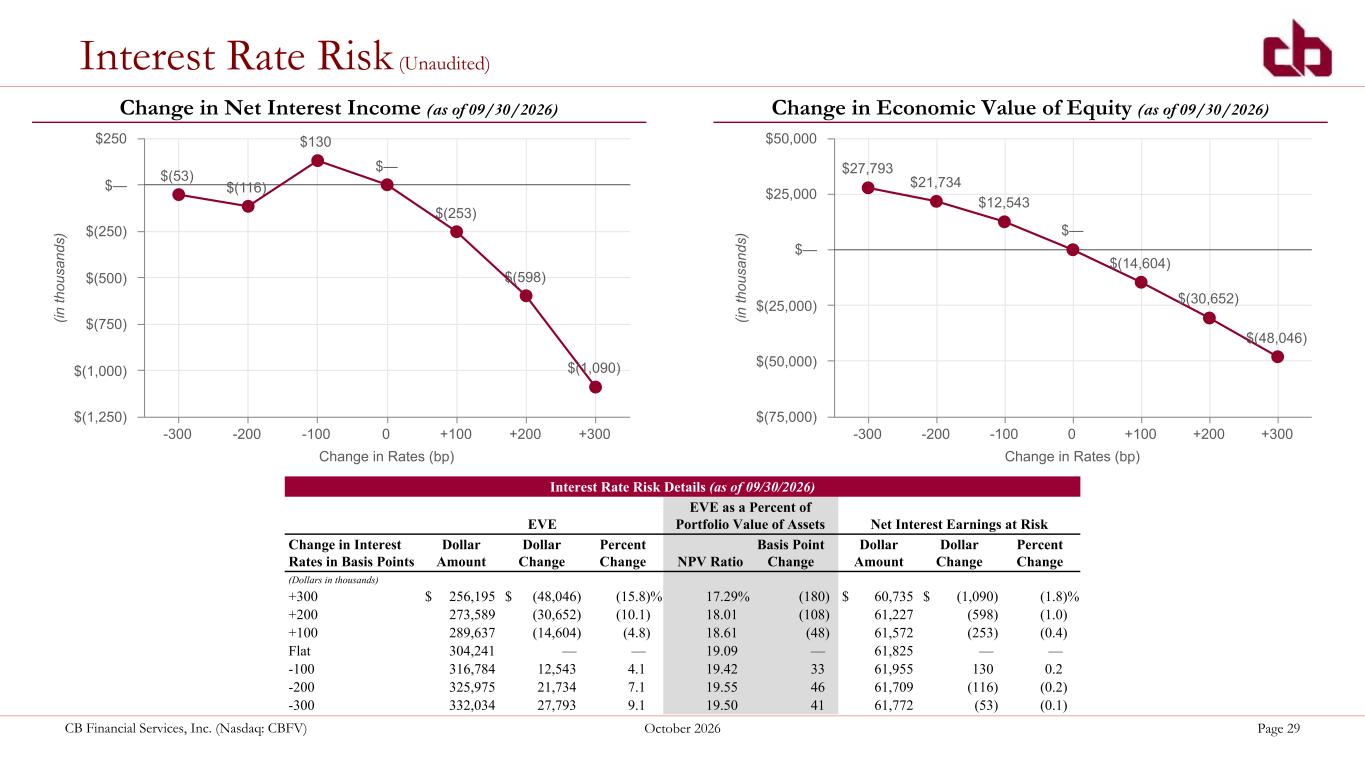
CB Financial Services, Inc. (Nasdaq: CBFV) October 2026 Page 29 Change in Rates (bp) (in th ou sa nd s) $(53) $(116) $130 $— $(253) $(598) $(1,090) -300 -200 -100 0 +100 +200 +300 $(1,250) $(1,000) $(750) $(500) $(250) $— $250 Change in Rates (bp) (in th ou sa nd s) $27,793 $21,734 $12,543 $— $(14,604) $(30,652) $(48,046) -300 -200 -100 0 +100 +200 +300 $(75,000) $(50,000) $(25,000) $— $25,000 $50,000 Change in Net Interest Income (as of 09/30/2026) Change in Economic Value of Equity (as of 09/30/2026) Interest Rate Risk (Unaudited) Interest Rate Risk Details (as of 09/30/2026) EVE EVE as a Percent of Portfolio Value of Assets Net Interest Earnings at Risk Change in Interest Rates in Basis Points Dollar Amount Dollar Change Percent Change NPV Ratio Basis Point Change Dollar Amount Dollar Change Percent Change (Dollars in thousands) +300 $ 256,195 $ (48,046) (15.8) % 17.29 % (180) $ 60,735 $ (1,090) (1.8) % +200 273,589 (30,652) (10.1) 18.01 (108) 61,227 (598) (1.0) +100 289,637 (14,604) (4.8) 18.61 (48) 61,572 (253) (0.4) Flat 304,241 — — 19.09 — 61,825 — — -100 316,784 12,543 4.1 19.42 33 61,955 130 0.2 -200 325,975 21,734 7.1 19.55 46 61,709 (116) (0.2) -300 332,034 27,793 9.1 19.50 41 61,772 (53) (0.1)

Conclusions
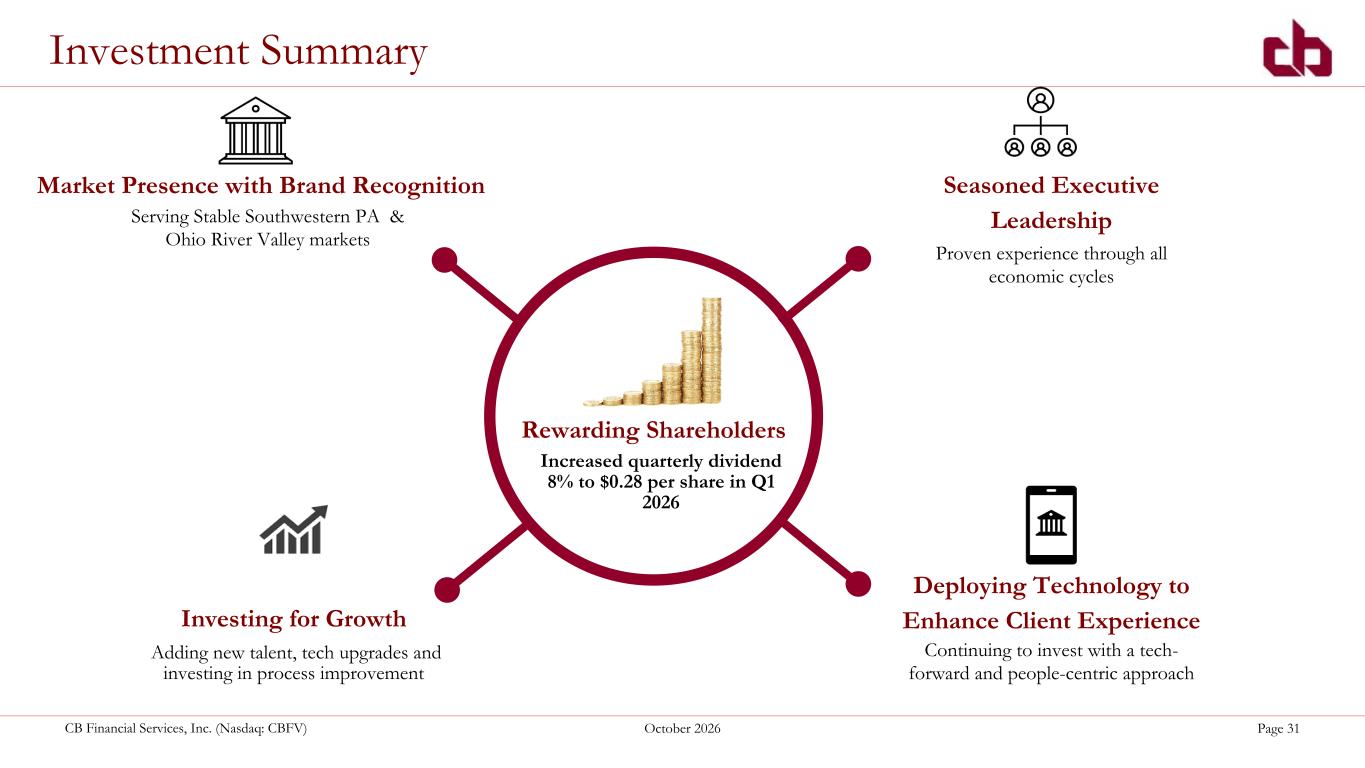
CB Financial Services, Inc. (Nasdaq: CBFV) October 2026 Page 31 Market Presence with Brand Recognition Seasoned Executive Leadership Deploying Technology to Enhance Client Experience Investment Summary Serving Stable Southwestern PA & Ohio River Valley markets Proven experience through all economic cycles Continuing to invest with a tech- forward and people-centric approach Investing for Growth Adding new talent, tech upgrades and investing in process improvement Rewarding Shareholders Increased quarterly dividend 8% to $0.28 per share in Q1 2026
CB Financial Services, Inc. (Nasdaq: CBFV) October 2026 Page 32 Delivering Value to Shareholders Our goal is to continue operating as a high-performing, independent community bank, generating positive returns and adding significant value for our shareholders. ◦ Committed to Improving Financial Performance ▪ Revenue Growth ▪ Consistent returns ◦ Dividend and Capital Reinvestment ▪ Regular and reliable dividend payouts ▪ Attractive dividend yield ▪ Capital reinvestment to produce higher returns ◦ Investing in Products and Strategies for Future Growth ▪ Specialty Treasury Payments & Services ▪ Commercial Banking ▪ Mortgage Banking ◦ Creating Franchise Value ◦ Supporting Local Communities (building value beyond financial returns)
CB Financial Services, Inc. (Nasdaq: CBFV) October 2026 Page 33 ◦ Community bank model is highly-differentiated compared with large regional banks ◦ Intense focus on sales and service culture and quality product offerings which builds full relationships with our clients ◦ Utilize technology investments to enhance speed of process while improving client experience ◦ Enhance profitability and efficiency potential while continuing to invest for future growth ◦ Continue our track record of opportunistic growth in the robust Pittsburgh Metropolitan area and across our footprint ◦ Defend and grow our relatively low-cost deposit base which enables the bank to protect net interest margin ◦ Leverage our credit culture and strong loan underwriting as a foundation to uphold our asset quality metrics Be the Community Bank of choice across our footprint Concluding Thoughts

CB Financial Services, Inc. (Nasdaq: CBFV) October 2026 Page 34 Company Contact John H. Montgomery President and Chief Executive Officer Phone: (724) 223-8317 Investor Relations The IR Group Diane Fitzgibbons, President Phone: (206) 388-5789 Email: dianef@theIRgroup.com Bank Main Office: 100 N. Market Street Carmichaels, PA 15320 Corporate Center: 2111 North Franklin Drive, Suite 200 Washington, PA 15301 Contact Information