2025 PAY VERSUS PERFORMANCE TABLE AND SUPPORTING NARRATIVE
The following table and supporting narrative contain information regarding “compensation actually paid” to our named executive officers and the relationship to Company performance.
Pay Versus Performance Table
Year | Summary Compensation Table Total for PEO ($) (1) | Compensation Actually Paid to PEO ($) (1) | Average Summary Compensation Table Total for Non-PEO Named Executive Officers ($) (2) | Average Compensation Actually Paid to Non-PEO Named Executive Officers ($) (2) | Value of $100 fixed investment | Net Income ($mm USD) |
Total Shareholder Return ($) |
||||||
2025 | $816,557 | $682,336 | $340,187 | $313,291 | $48 | -$9 |
2024 | $940,887 | $588,830 | $231,940 | $59,349 | $61 | -$10 |
2023 | $940,811 | $1,034,727 | $574,941 | $621,491 | $112 | -$9 |
(1) | Reflects compensation for our Chief Executive Officer, Fei Chen, who served as our Principal Executive Officer (PEO) for 2023 – 2025. |
(2) | Reflects compensation for Simon Stadil in 2023, Simon Stadil and Phillip Massie Price in 2024, and David Kowalczyk and Phillip Massie Price in 2025 as shown in the Summary Compensation Table for each respective year. |
To calculate “compensation actually paid” for our PEO and other NEOs the following adjustments were made to Summary Compensation Table total pay.
| PEO – Chen | Other NEO | PEO – Chen | Other NEO | PEO – Chen | Other NEO |
| 2023 | 2023 | 2024 | 2024 | 2025 | 2025 |
Summary Compensation Table Total | $940,811 | $574,941 | $940,887 | $231,940 | $816,557 | $340,187 |
Deduction for amount reported in “Stock Awards” column of the Summary Compensation Table | ($363,248) | ($130,769) | ($374,449) | ($85,734) | ($398,643) | ($99,940) |
Addition of fair value at fiscal year (FY) end, of equity awards granted during the FY that remained outstanding | $412,893 | $148,642 | $196,602 | $12,668 | $293,949 | $68,889 |
Addition of change in fair value at FY end versus prior FY end for awards granted in prior FY that remained outstanding | $19,271 | $22,672 | ($167,309) | $0 | ($42,686) | $0 |
Addition of change in fair value at vesting date versus prior FY end for awards granted in prior FY that vested during the FY | $25,000 | $6,005 | ($6,901) | $2,258 | $13,159 | $5,212 |
Reduction of fair value of awards granted during prior FY that were forfeited during applicable FY, determined as of prior FY end (1) | $0 | $0 | $0 | ($101,784) | $0 | ($1,056) |
Compensation Actually Paid | $1,034,727 | $621,491 | $588,830 | $59,349 | $682,336 | $313,291 |
The equity awards included above comprise of restricted share units granted from 2021 through 2025. Measurement date equity fair values are calculated with assumptions derived on a basis consistent with those used for grant date fair value purposes. Restricted stock units are valued based on the stock price on the relevant measurement date.
Compensation Actually Paid Versus Company Performance
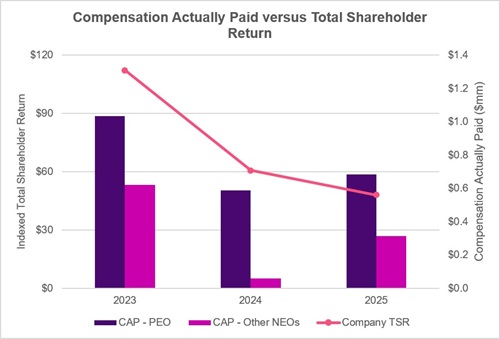
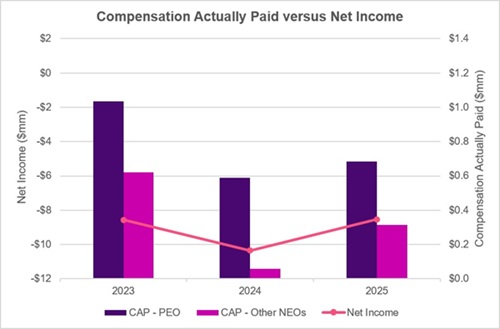
The following charts provide a clear, visual description of the relationships between “compensation actually paid” to our PEOs, and the average for our non-PEO NEOs, to aspects of our financial performance.