The bar chart and performance table below show the variability of the Fund’s returns, which is some indication of the risks of investing in the Fund. The bar chart shows the performance of the Fund’s Institutional Class shares for each full calendar year since the Fund’s Institutional Class Shares inception. The Investor Class Shares of the Fund have not commenced operations. The performance table compares the performance of the Fund’s Institutional Class shares over time to the performance of a broad-based market index and a supplemental index. You should be aware that the Fund’s past performance (before and after taxes) may not be an indication of how the Fund will perform in the future. Also, class specific annual and semi-annual Shareholder Reports, containing performance and portfolio holdings information are mailed to shareholders; and full financials and shareholder reports are made available to shareholders semi-annually upon request. Updated performance information and daily net asset value per share (“NAV”) is available at no cost by calling toll-free 1-833-462-6344.
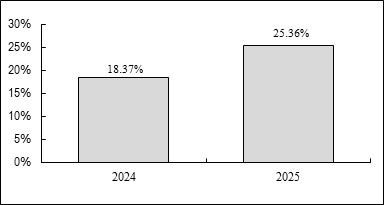
| Best Quarter | 17.00% | September 30, 2024 |
| Worst Quarter | (7.30)% | December 31, 2024 |
The Fund’s Institutional Class year-to-date return as of September 30, 2026 was 3.81%.
| Dynamic Alpha Macro Fund | One Year |
Since Inception(1) |
| Institutional Class Shares Return before taxes | 25.36% | 20.37% |
| Institutional Class Shares Return after taxes on distributions(2) | 22.31% | 17.80% |
| Institutional Class Shares Return after taxes on distributions and sale of Fund shares(2) | 15.20% | 14.84% |
| S&P
500 Total Return Index(3) (reflects no deduction for fees, expenses or taxes) |
17.88% | 19.62% |
| Barclay
Global Macro Index(4) (reflects no deduction for taxes) |
19.62% | 13.00% |
| (1) | The Fund’s Institutional Class Shares commenced operations on July 31, 2023. The Fund’s Investor Class Shares have not commenced operations. |
| (2) | After-tax returns are calculated using the historical highest individual federal marginal income tax rates and do not reflect the impact of state and local taxes. Actual after-tax returns depend on an investor’s tax situation and may differ from those shown, and after-tax returns shown are not relevant to investors who hold their Fund shares through tax-deferred arrangements, such as 401(k) plans or individual retirement accounts. |
| (3) | The S&P 500 Total Return Index is an unmanaged composite of 500 large capitalization companies and includes the reinvestment of dividends. The Index is widely used by professional investors as a performance benchmark for large-cap stocks. Investors cannot invest directly in an index; unlike the Fund’s returns, the index does not reflect any taxes. |
| (4) | Barclay Global Macro Index is maintained by Barclay Hedge and measures the performance of hedge fund managers who take long and short positions across major capital and derivative markets worldwide. These positions are based on the managers’ views of macroeconomic trends and global events. Investors cannot invest directly in an index; unlike the Fund’s returns, the index does not reflect any fees or expenses. |