| Year | Summary | Compensation Actually Paid | | Summary | Compensation | Value of Initial | Net Income (Loss) ($) | |||||||||||||||||
| 2026 | $ | 661,332 | $ | 620,615 | $ | 521,500 | $ | 480,783 | $ | 0.69 | $ | (12,468,672 | ) | |||||||||||
| 2025 | $ | 562,103 | $ | 573,958 | $ | 423,954 | $ | 434,179 | $ | 5.16 | $ | (10,604,886 | ) | |||||||||||
| 2024 | $ | 446,622 | $ | 446,622 | $ | 336,699 | $ | 336,699 | $ | 5.76 | $ | (10,190,932 | ) | |||||||||||
| (1) | Amounts shown represent the total compensation reported in the Summary Compensation Table for the applicable fiscal year for our principal executive officer (“PEO”), Mr. Harry Simeonidis, and the average of the total compensation reported in the Summary Compensation Table for the applicable fiscal year for our sole non-PEO named executive officer (“NEO”), Mr. Spiro Sakiris for fiscal years 2024, 2025, and 2026. |
The following table sets forth adjustments made to the SCT Total for our PEO during each year to determine compensation actually paid, with “fair value” calculated in accordance with ASC Topic 718 as of the end of the specified period. Since the Company did not report a change in pension value for the CEO/PEO for any years reflected in the Summary Compensation Table, adjustments for pensions are not needed.
| Adjustments to Determine CAP for PEO | 2026 | 2025 | 2024 | |||||||||
| SCT Total for PEO | 661,332 | 562,103 | 446,622 | |||||||||
| (Deduct) amounts reported under “Stock Awards” Column of the SCT | (110,715 | ) | (56,945 | ) | ||||||||
| Add the fair value of awards granted in the covered year that remain outstanding and unvested as of covered year-end(a) | 69,998 | |||||||||||
| Add the fair value of awards granted and vested during the covered year(b) | 68,800 | |||||||||||
| Total Adjustments | (40,717 | ) | 11,855 | |||||||||
| CAP for PEO | 620,615 | 573,958 | 446,622 | |||||||||
| (a) | For fiscal 2026, the amount represents the fair value at June 30, 2026 of restricted stock awards granted during fiscal 2026 that remained outstanding and unvested at fiscal year-end. For the PEO, this amount was $69,998, representing 30,500 restricted stock awards granted on March 18, 2026. |
| (b) | For fiscal 2025, the amount represents the fair value of restricted stock awards that were granted and vested during the fiscal year. For the PEO, the amount was $68,800, representing 4,000 restricted stock awards. No amounts were included in this category for fiscal 2026 or 2024. |
The following table sets forth adjustments made to the SCT Total during each year to determine CAP to the Non-PEO NEO, with “fair value” calculated in accordance with ASC Topic 718 as of the end of the specified period. Since the Company did not report a change in pension value for the Non-PEO NEO for any years reflected in the Summary Compensation Table, adjustments for pensions are not needed.
| Adjustments to Determine CAP for Non-PEO NEO | 2026 | 2025 | 2024 | |||||||||
| SCT Total for Non-PEO NEO | 521,500 | 423,954 | 336,699 | |||||||||
| (Deduct) amounts reported under “Stock Awards” Column of the SCT | (110,715 | ) | (49,115 | ) | ||||||||
| Add the fair value of awards granted in the covered year that remain outstanding and unvested as of covered year-end(a) | 69,998 | |||||||||||
| Add the fair value of awards granted and vested during the covered year(b) | 59,340 | |||||||||||
| Total Adjustments | (40,717 | ) | 10,225 | |||||||||
| CAP for non-PEO NEO | 480,783 | 434,179 | 336,699 | |||||||||
| (a) | For fiscal 2026, the amount represents the fair value at June 30, 2026 of restricted stock awards granted during fiscal 2026 that remained outstanding and unvested at fiscal year-end. For the Non-PEO NEO, this amount was also $69,998, representing 30,500 restricted stock awards granted on March 18, 2026. | |
| (b) | For fiscal 2025, the amount represents the fair value of restricted stock awards that were granted and vested during the fiscal year. For the Non-PEO NEO, the amount was $59,340, representing 3,450 restricted stock awards. No amounts were included in this category for fiscal 2026 or 2024. |
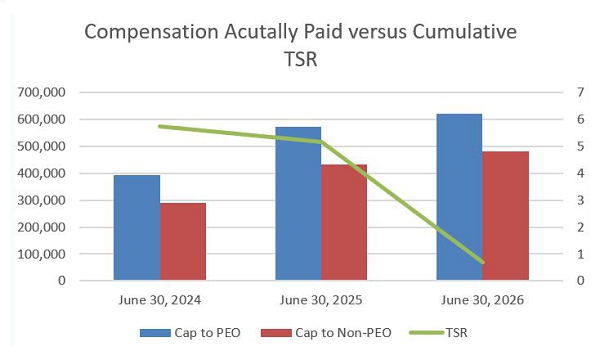
The following chart sets forth the relationship between CAP to our PEO, the CAP to our Non-PEO NEO, and the Company’s cumulative TSR over the three most recently completed fiscal years.
CAP and Company Net Income (Loss)
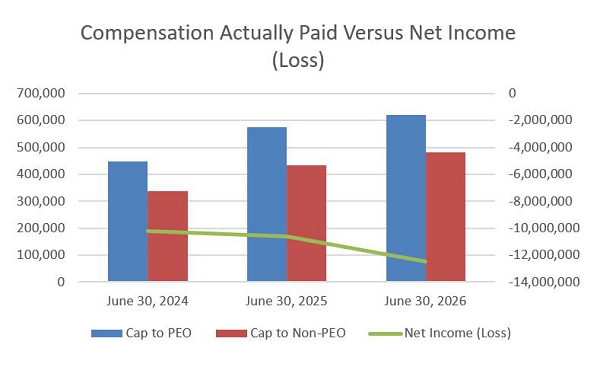
The following chart sets forth the relationship between CAP to our PEO, the CAP to our Non-PEO NEO, and our net income (loss) during the three most recently completed fiscal years.
Pay Versus Performance: Graphical Description
The illustrations below provide a graphical description of CAP (as calculated in accordance with the SEC rules) and the following measures:
| ● | INBS’s cumulative TSR; and |
| ● | INBS’s net income (loss) |
| [1] | Amounts shown represent the total compensation reported in the Summary Compensation Table for the applicable fiscal year for our principal executive officer (“PEO”), Mr. Harry Simeonidis, and the average of the total compensation reported in the Summary Compensation Table for the applicable fiscal year for our sole non-PEO named executive officer (“NEO”), Mr. Spiro Sakiris for fiscal years 2024, 2025, and 2026. |
| [2] | The dollar amounts reported represent the amount of “compensation actually paid”, as computed in accordance with SEC rules. The dollar amounts reported are the amounts of total compensation reported for Mr. Simeonidis during the applicable year, but also include (i) the year-end value of equity awards granted during the reported year, (ii) the change in the value of equity awards that were unvested at the end of the prior year, measured through the date the awards vested, or through the end of the reported fiscal year, and (iii) value of equity awards issued and vested during the reported fiscal year. |
| [3] | The dollar amounts reported represent the average amount of “compensation actually paid”, as computed in accordance with SEC rules, for our NEOs, other than our CEO. The dollar amounts reported are the average of the total compensation reported for our NEOs, other than our CEO in the Summary Compensation Table for fiscal years 2026, 2025 and 2024, but also include: (i) the year-end value of equity awards granted during the reported year, (ii) the change in the value of equity awards that were unvested at the end of the prior year, measured through the date the awards vested, or through the end of the reported fiscal year, and (iii) value of equity awards issued and vested during the reported fiscal year. |
| [4] | Reflects the cumulative total stockholder return over the relevant fiscal year, computed in accordance with SEC rules, assuming an investment of $100 in our common stock at a price per share equal to the closing price of our common stock on the last trading day before the commencement of the earliest applicable fiscal year (June 30, 2023) and the measurement end point of the closing price of our common stock on the last trading day in the applicable fiscal year. For 2026, the closing price of our common stock on June 30, 2026 was $2.295 and for 2025 the closing price of our common stock on June 30, 2025 was $17.20. For 2024, the closing price of our common stock on June 30, 2024 was $19.20. For 2023, the closing price of our common stock on June 30, 2023 was $333.60. |
| [5] | For fiscal 2026, the amount represents the fair value at June 30, 2026 of restricted stock awards granted during fiscal 2026 that remained outstanding and unvested at fiscal year-end. For the PEO, this amount was $69,998, representing 30,500 restricted stock awards granted on March 18, 2026. |
| [6] | For fiscal 2025, the amount represents the fair value of restricted stock awards that were granted and vested during the fiscal year. For the PEO, the amount was $68,800, representing 4,000 restricted stock awards. No amounts were included in this category for fiscal 2026 or 2024. |
| [7] | For fiscal 2026, the amount represents the fair value at June 30, 2026 of restricted stock awards granted during fiscal 2026 that remained outstanding and unvested at fiscal year-end. For the Non-PEO NEO, this amount was also $69,998, representing 30,500 restricted stock awards granted on March 18, 2026. |
| [8] | For fiscal 2025, the amount represents the fair value of restricted stock awards that were granted and vested during the fiscal year. For the Non-PEO NEO, the amount was $59,340, representing 3,450 restricted stock awards. No amounts were included in this category for fiscal 2026 or 2024. |