Shareholder Report
Jun. 30, 2026
USD ($)
$ / shares
This report describes changes to the Fund that occurred during the reporting period.
WHAT WERE THE FUND COSTS FOR THE PAST YEAR? (based on a hypothetical $10,000 investment)
|
Fund Name
|
Costs of a $10,000 investment
|
Costs paid as a percentage of a $10,000 investment
|
|
WBI BullBear Value 3000 ETF
|
$190
|
1.70%
|
HOW DID THE FUND PERFORM LAST YEAR AND WHAT AFFECTED ITS PERFORMANCE?
For the 12-month period ended June 30, 2026, the Fund outperformed the S&P 500 Index, returning 23.74% at NAV versus 22.29%, but trailed the Russell 3000 Value Index at 27.72%. WBIF is an actively managed fund that focuses on risk management and value-oriented stocks when fully invested. WBIF had under a quarter of its weight on average in common with the S&P 500, and less than one-third of the names in the index appeared in the Fund during the year. Information Technology and Industrials were the largest contributors to total return, while Consumer Discretionary and Utilities detracted. The Fund’s risk-management process raises cash as downside risk builds, seeking to limit losses in declining markets rather than track a fully invested benchmark; cash averaged approximately 6.00% of net assets. That positioning accounts for much of the gap versus the value index.
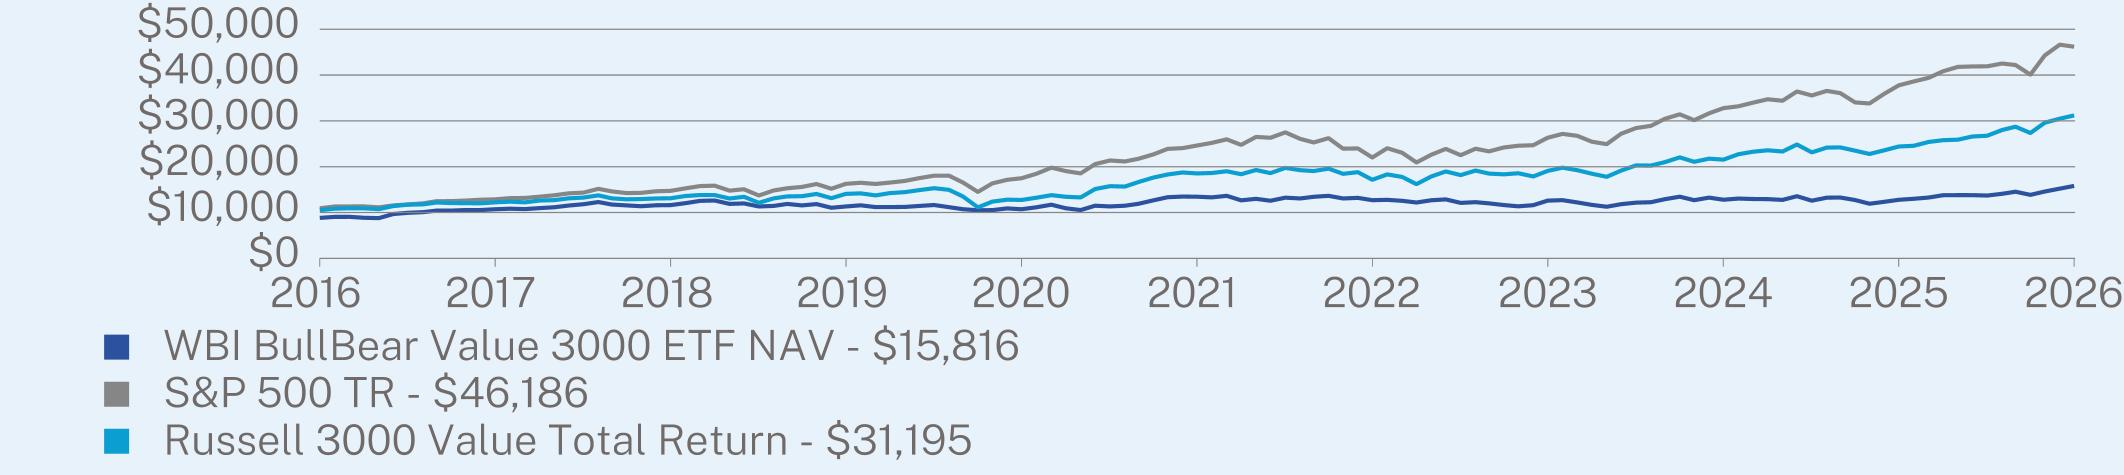
ANNUAL AVERAGE TOTAL RETURN (%)
|
|
1 Year
|
5 Year
|
10 Year
|
|
WBI BullBear Value 3000 ETF NAV
|
23.71
|
3.28
|
5.99
|
|
S&P 500 TR
|
22.32
|
13.41
|
15.51
|
|
Russell 3000 Value Total Return
|
27.78
|
10.97
|
11.48
|
Visit https://wbietfs.com/documents/ for more recent performance information.
KEY FUND STATISTICS (as of June 30, 2026)
|
Net Assets
|
$23,491,652
|
|
Number of Holdings
|
75
|
|
Advisory Fee
|
$189,411
|
|
Portfolio Turnover
|
613%
|
WHAT DID THE FUND INVEST IN? (as of June 30, 2026)
Sector Breakdown (% of net assets)†
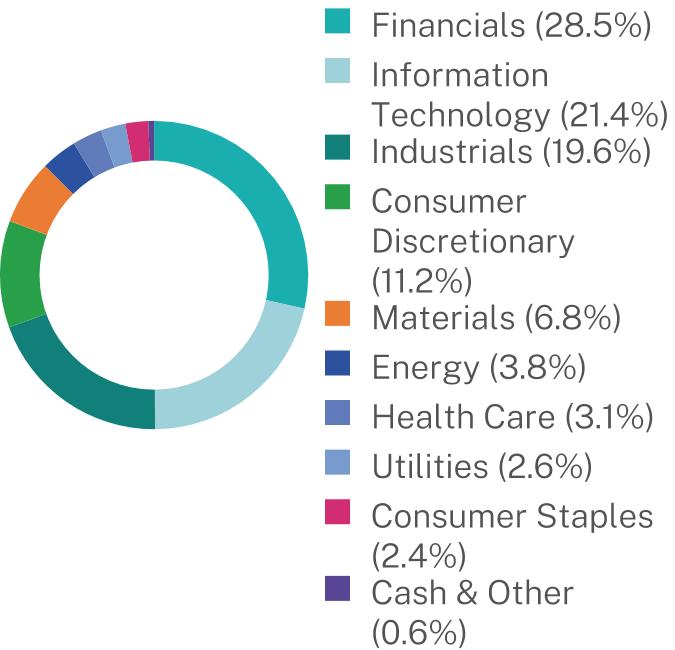
|
Top 10 Issuers
|
(%)
|
|
|
Mount Vernon Liquid Assets Portfolio, LLC
|
20.2
|
%
|
|
Amphenol Corp.
|
3.4
|
%
|
|
Lennox International, Inc.
|
2.7
|
%
|
|
Ball Corp.
|
2.6
|
%
|
|
American Express Co.
|
2.3
|
%
|
|
Kinsale Capital Group, Inc.
|
2.3
|
%
|
|
Interactive Brokers Group, Inc.
|
2.3
|
%
|
|
Piper Sandler Cos.
|
2.1
|
%
|
|
Yum China Holdings, Inc.
|
2.1
|
%
|
|
McKesson Corp.
|
2.0
|
%
|
HOW HAS THE FUND CHANGED?
The Absolute Shares Trust (the “Trust”) has historically engaged KPMG, LLP. to serve as the independent registered public accounting firm for the Trust. On September 25, 2025, the Board of Trustees of the Trust considered and approved the appointment of Cohen & Company, Ltd. as the independent registered public accounting firm for each series of the Trust for the fiscal year ending June 30, 2026.
This report describes changes to the Fund that occurred during the reporting period.
WHAT WERE THE FUND COSTS FOR THE PAST YEAR? (based on a hypothetical $10,000 investment)
|
Fund Name
|
Costs of a $10,000 investment
|
Costs paid as a percentage of a $10,000 investment
|
|
WBI BullBear Yield 3000 ETF
|
$187
|
1.70%
|
HOW DID THE FUND PERFORM LAST YEAR AND WHAT AFFECTED ITS PERFORMANCE?
For the 12-month period ended June 30, 2026, the Fund underperformed its benchmark, the S&P 500 Index, returning 19.50% at NAV versus 22.29%, and trailed the Russell 3000 Value Index, which returned 27.72%. WBIG is an actively managed fund that focuses on risk management and yield-oriented securities. As such, WBIG had under a quarter of its weight on average in common with the S&P 500, and held a sleeve of fixed-income exchange-traded funds consistent with its yield objective. Information Technology, Industrials, and Healthcare were the largest contributors to total return, while Consumer Discretionary detracted the most. The Fund’s risk-management process raises cash as downside risk builds, seeking to limit losses in declining markets; cash averaged approximately 4.70% of net assets. That defensive positioning and the fixed-income allocation both restrained returns in a year when equities advanced broadly.
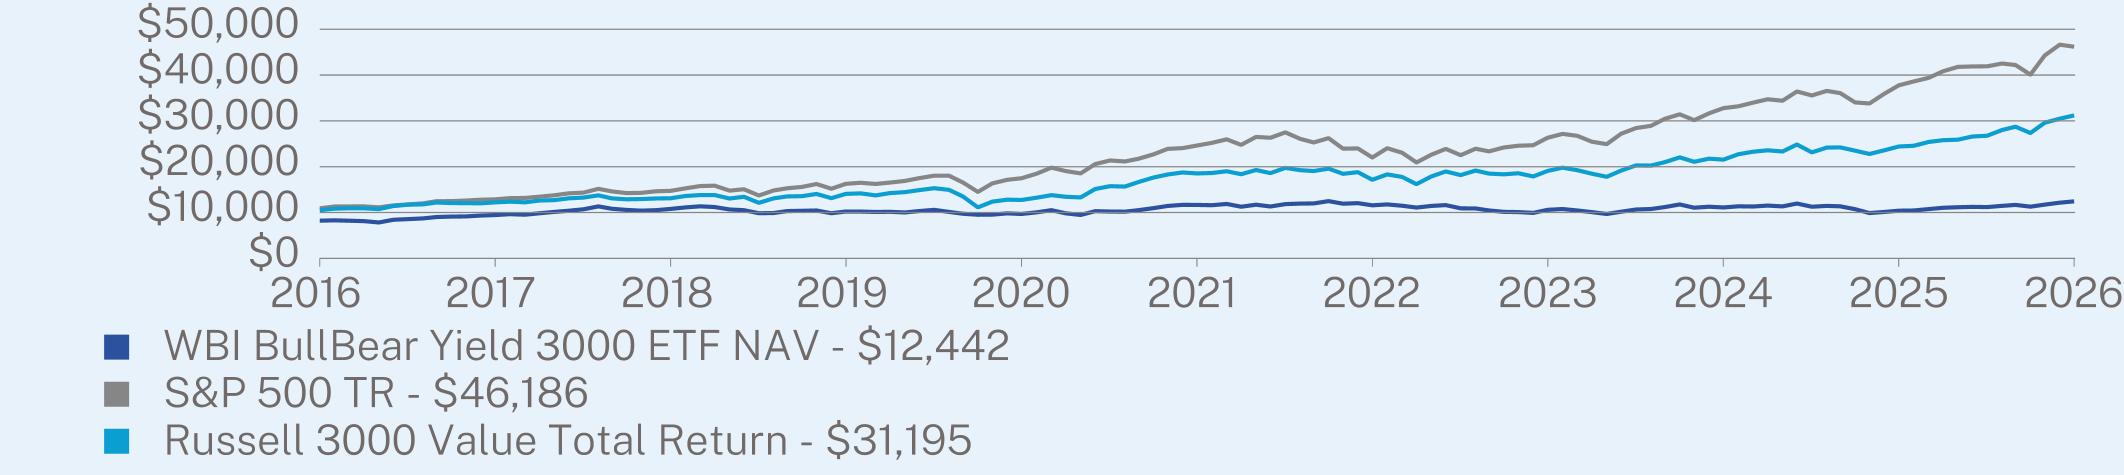
ANNUAL AVERAGE TOTAL RETURN (%)
|
|
1 Year
|
5 Year
|
10 Year
|
|
WBI BullBear Yield 3000 ETF NAV
|
19.50
|
1.30
|
4.22
|
|
S&P 500 TR
|
22.32
|
13.41
|
15.51
|
|
Russell 3000 Value Total Return
|
27.78
|
10.97
|
11.48
|
Visit https://wbietfs.com/documents/ for more recent performance information.
KEY FUND STATISTICS (as of June 30, 2026)
|
Net Assets
|
$27,466,051
|
|
Number of Holdings
|
83
|
|
Advisory Fee
|
$253,482
|
|
Portfolio Turnover
|
576%
|
WHAT DID THE FUND INVEST IN? (as of June 30, 2026)
Sector Breakdown (% of net assets)†
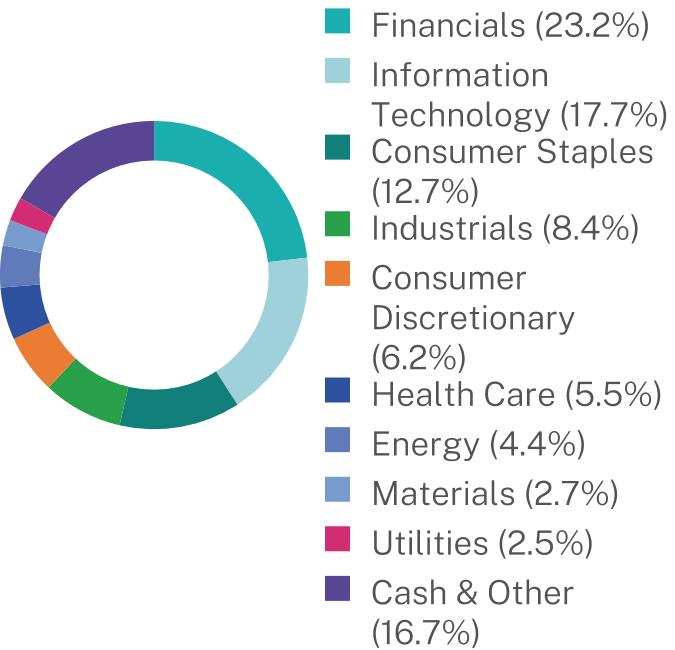
|
Top 10 Issuers
|
(%)
|
|
|
Mount Vernon Liquid Assets Portfolio, LLC
|
19.6
|
%
|
|
WisdomTree Trust WisdomTree Interest Rate Hedged US Aggregate Bond Fund
|
2.6
|
%
|
|
Angel Oak High Yield Opportunities ETF
|
2.4
|
%
|
|
Amphenol Corp.
|
2.4
|
%
|
|
OneMain Holdings, Inc.
|
2.0
|
%
|
|
Kimberly-Clark Corp.
|
2.0
|
%
|
|
Astera Labs, Inc.
|
2.0
|
%
|
|
Lennox International, Inc.
|
1.9
|
%
|
|
Ball Corp.
|
1.9
|
%
|
|
T Rowe Price Group, Inc.
|
1.9
|
%
|
HOW HAS THE FUND CHANGED?
The Absolute Shares Trust (the “Trust”) has historically engaged KPMG, LLP. to serve as the independent registered public accounting firm for the Trust. On September 25, 2025, the Board of Trustees of the Trust considered and approved the appointment of Cohen & Company, Ltd. as the independent registered public accounting firm for each series of the Trust for the fiscal year ending June 30, 2026.
This report describes changes to the Fund that occurred during the reporting period.
WHAT WERE THE FUND COSTS FOR THE PAST YEAR? (based on a hypothetical $10,000 investment)
|
Fund Name
|
Costs of a $10,000 investment
|
Costs paid as a percentage of a $10,000 investment
|
|
WBI BullBear Quality 3000 ETF
|
$190
|
1.70%
|
HOW DID THE FUND PERFORM LAST YEAR AND WHAT AFFECTED ITS PERFORMANCE?
For the 12-month period ended June 30, 2026, the Fund outperformed its benchmark, the S&P 500 Index, returning 23.70% at NAV versus 22. 29%. WBIL is an actively managed fund that focuses on risk management and quality-oriented companies. WBIL had under one-third of its weight on average in common with the S&P 500, and less than one-third of the names in the index appeared in the Fund during the year. Information Technology, Industrials, and Consumer Staples were the largest contributors to total return, while Communication Services and an underweight to Materials were key detractors. The Fund’s risk-management process raises cash as downside risk builds, seeking to limit losses in declining markets; cash averaged approximately 7.91% of net assets. Quality-oriented selection more than offset the cost of that defensive positioning.
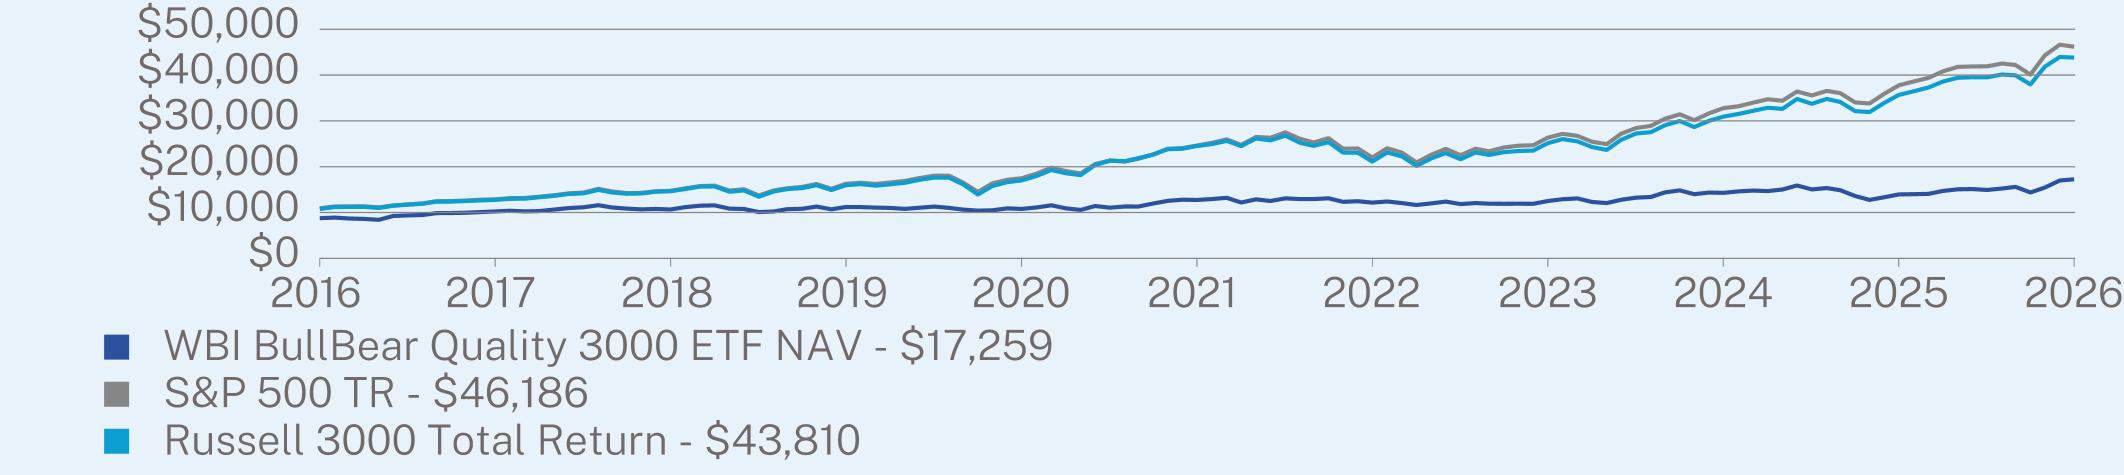
ANNUAL AVERAGE TOTAL RETURN (%)
|
|
1 Year
|
5 Year
|
10 Year
|
|
WBI BullBear Quality 3000 ETF NAV
|
23.68
|
6.24
|
7.00
|
|
S&P 500 TR
|
22.32
|
13.41
|
15.51
|
|
Russell 3000 Total Return
|
22.82
|
12.31
|
15.06
|
Visit https://wbietfs.com/documents/ for more recent performance information.
KEY FUND STATISTICS (as of June 30, 2026)
|
Net Assets
|
$30,461,607
|
|
Number of Holdings
|
62
|
|
Advisory Fee
|
$262,684
|
|
Portfolio Turnover
|
733%
|
WHAT DID THE FUND INVEST IN? (as of June 30, 2026)
Sector Breakdown (% of net assets)†
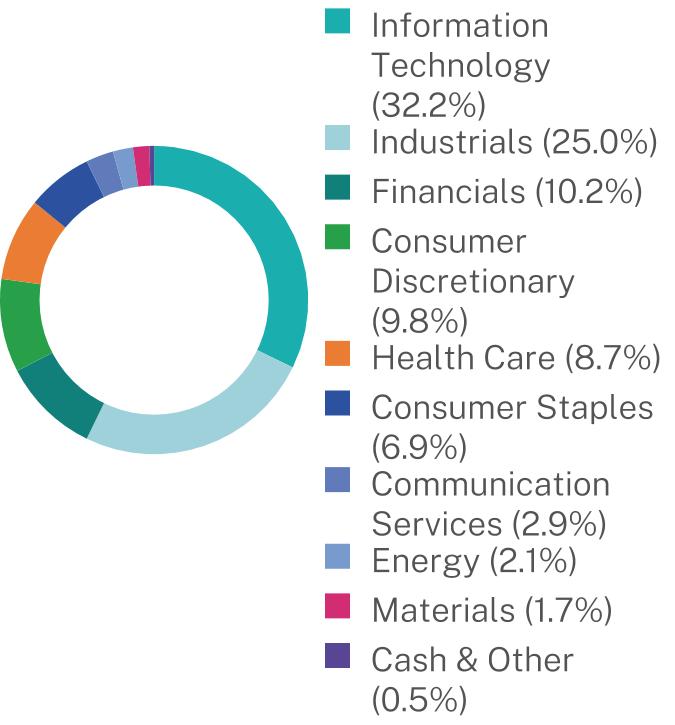
|
Top 10 Issuers
|
(%)
|
|
|
Mount Vernon Liquid Assets Portfolio, LLC
|
21.6
|
%
|
|
Astera Labs, Inc.
|
3.8
|
%
|
|
ARM Holdings PLC
|
3.1
|
%
|
|
Marvell Technology, Inc.
|
3.0
|
%
|
|
Caterpillar, Inc.
|
2.4
|
%
|
|
Crowdstrike Holdings, Inc.
|
2.3
|
%
|
|
Nebius Group NV
|
2.3
|
%
|
|
Datadog, Inc.
|
2.3
|
%
|
|
Expedia Group, Inc.
|
2.2
|
%
|
|
Monster Beverage Corp.
|
2.2
|
%
|
HOW HAS THE FUND CHANGED?
The Absolute Shares Trust (the “Trust”) has historically engaged KPMG, LLP. to serve as the independent registered public accounting firm for the Trust. On September 25, 2025, the Board of Trustees of the Trust considered and approved the appointment of Cohen & Company, Ltd. as the independent registered public accounting firm for each series of the Trust for the fiscal year ending June 30, 2026.
This report describes changes to the Fund that occurred during the reporting period.
WHAT WERE THE FUND COSTS FOR THE PAST YEAR? (based on a hypothetical $10,000 investment)
|
Fund Name
|
Costs of a $10,000 investment
|
Costs paid as a percentage of a $10,000 investment
|
|
WBI Power Factor High Dividend ETF
|
$112
|
1.00%
|
HOW DID THE FUND PERFORM LAST YEAR AND WHAT AFFECTED ITS PERFORMANCE?
For the 12-month period ended June 30, 2026, the Fund outperformed the S&P 500 Index, returning 24.88% at NAV versus 22.29%, and trailed the Solactive Power Factor High Dividend Index, which returned 26.00%. WBIY seeks to invest in high-dividend-yield stocks, focusing on value-oriented companies with strong fundamentals. As a result, WBIY had about 4% of its weight on average in common with the S&P 500, and less than one-tenth of the names in the index appeared in the Fund during the year. Consumer Discretionary, Financials, and Utilities were the top contributors to total return, while Consumer Staples and Real Estate were the largest detractors. The Fund’s rules-based process selects on valuation, dividend coverage and fundamentals, and the Fund remained substantially invested through the period; cash averaged approximately 1.13% of net assets. The Fund’s yield-driven selection participated well in a broadening market.
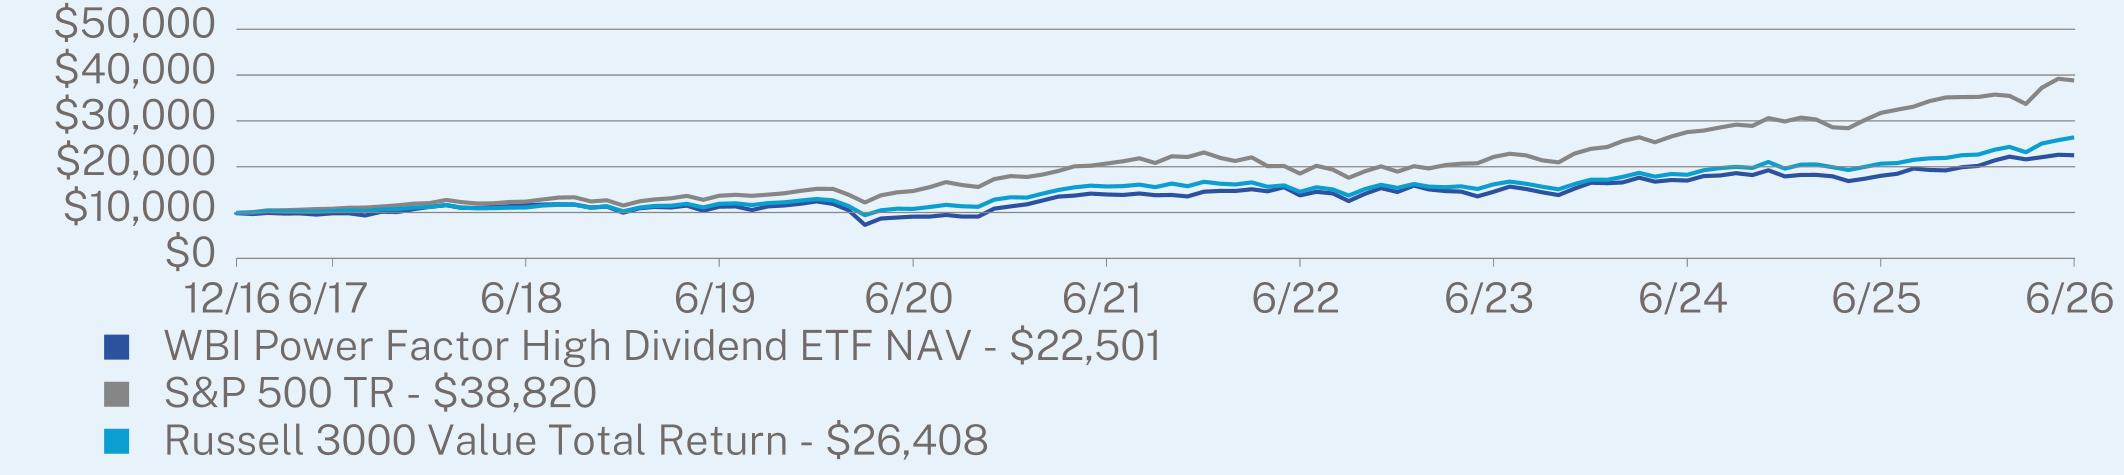
ANNUAL AVERAGE TOTAL RETURN (%)
|
|
1 Year
|
5 Year
|
Since Inception
(12/19/2016) |
|
WBI Power Factor High Dividend ETF NAV
|
24.85
|
10.04
|
8.88
|
|
S&P 500 TR
|
22.32
|
13.41
|
15.30
|
|
Russell 3000 Value Total Return
|
27.78
|
10.97
|
10.73
|
Visit https://wbietfs.com/documents/ for more recent performance information.
KEY FUND STATISTICS (as of June 30, 2026)
|
Net Assets
|
$59,020,221
|
|
Number of Holdings
|
51
|
|
Advisory Fee
|
$259,156
|
|
Portfolio Turnover
|
138%
|
WHAT DID THE FUND INVEST IN? (as of June 30, 2026)
Sector Breakdown (% of net assets)†
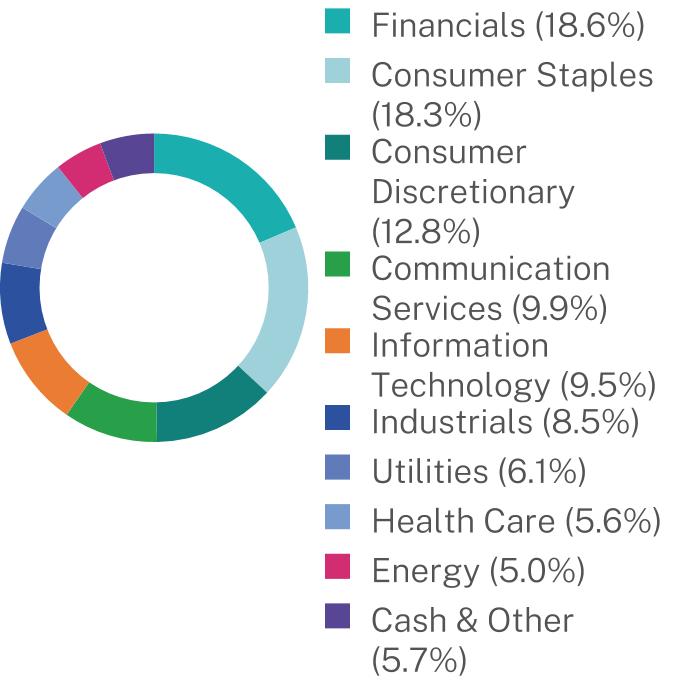
|
Top 10 Issuers
|
(%)
|
|
|
Mount Vernon Liquid Assets Portfolio, LLC
|
27.2
|
%
|
|
Best Buy Co., Inc.
|
5.5
|
%
|
|
HP, Inc.
|
5.3
|
%
|
|
Altria Group, Inc.
|
5.2
|
%
|
|
Campbell’s Co.
|
5.1
|
%
|
|
General Mills, Inc.
|
4.7
|
%
|
|
United Parcel Service, Inc.
|
4.6
|
%
|
|
Verizon Communications, Inc.
|
4.3
|
%
|
|
Skyworks Solutions, Inc.
|
4.2
|
%
|
|
Pfizer, Inc.
|
4.2
|
%
|
HOW HAS THE FUND CHANGED?
The Absolute Shares Trust (the “Trust”) has historically engaged KPMG, LLP. to serve as the independent registered public accounting firm for the Trust. On September 25, 2025, the Board of Trustees of the Trust considered and approved the appointment of Cohen & Company, Ltd. as the independent registered public accounting firm for each series of the Trust for the fiscal year ending June 30, 2026.
| [1] |
|
||
| [2] |
|
||
| [3] |
|
||
| [4] |
|