
#006881 #ACC0C6 #83AFB4 #FEBE10 #5F574F #4D4F53 #C75B12 #5B8F22 #593160 September 30, 2026 Investor Presentation
#006881 #ACC0C6 #83AFB4 #FEBE10 #5F574F #4D4F53 #C75B12 #5B8F22 #593160 Forward-Looking Statements This presentation may contain forward-looking statements within the meaning of the Private Securities Litigation Reform Act of 1995. These statements are based on the current beliefs and expectations of Shore Bancshares, Inc.’s management and are subject to significant risks and uncertainties. Actual results may differ from those set forth in the forward-looking statements. For additional information about factors that could cause actual results to differ materially from those described in the forward-looking statements, refer to the “Forward-Looking Statements” discussion in Shore Bancshares, Inc.’s press release announcing its third quarter 2026 results and its Annual Report on Form 10-K for the year ended December 31, 2025, and any subsequent filings with the Securities and Exchange Commission. Forward-looking statements speak only as of the date they are made, and Shore Bancshares, Inc. undertakes no obligation to update any forward-looking statement to reflect the impact of circumstances or events that arise after the date the forward-looking statement was made. Non-GAAP Financials This presentation includes certain non-GAAP financial measures intended to supplement, not substitute for, comparable GAAP measures and the Company’s reported results prepared in accordance with GAAP. Numbers in this presentation may not sum due to rounding. Pursuant to the requirements of Regulation G, the Company has provided reconciliations within this presentation, as necessary, of the non-GAAP financial measures to the most directly comparable GAAP financial measures. For more details on the Company's non-GAAP measures, refer to the Appendix in this presentation. 2
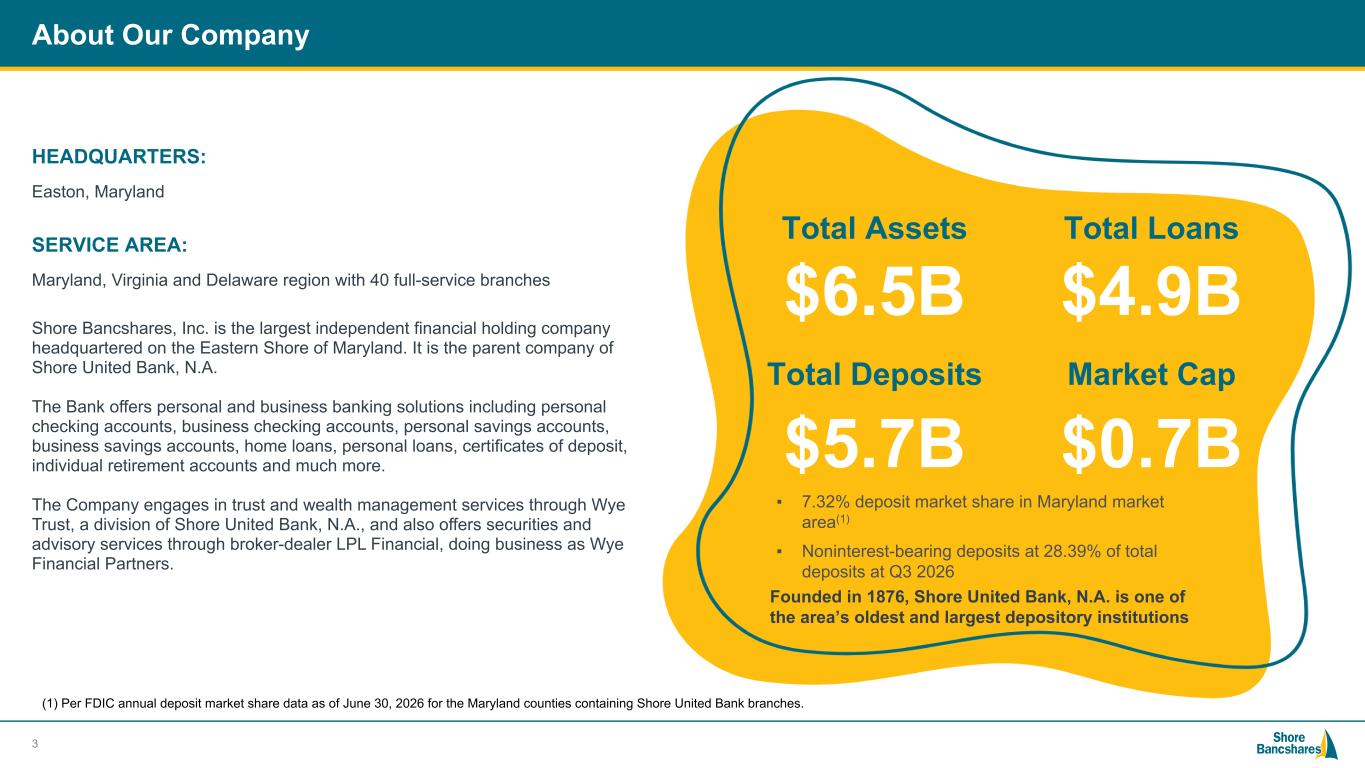
#006881 #ACC0C6 #83AFB4 #FEBE10 #5F574F #4D4F53 #C75B12 #5B8F22 #593160 About Our Company HEADQUARTERS: 3 Shore Bancshares, Inc. is the largest independent financial holding company headquartered on the Eastern Shore of Maryland. It is the parent company of Shore United Bank, N.A. The Bank offers personal and business banking solutions including personal checking accounts, business checking accounts, personal savings accounts, business savings accounts, home loans, personal loans, certificates of deposit, individual retirement accounts and much more. The Company engages in trust and wealth management services through Wye Trust, a division of Shore United Bank, N.A., and also offers securities and advisory services through broker-dealer LPL Financial, doing business as Wye Financial Partners. Easton, Maryland SERVICE AREA: Maryland, Virginia and Delaware region with 40 full-service branches (1) Per FDIC annual deposit market share data as of June 30, 2026 for the Maryland counties containing Shore United Bank branches. Total Assets Total Loans Total Deposits Market Cap $6.5B $4.9B $5.7B $0.7B ▪ 7.32% deposit market share in Maryland market area(1) ▪ Noninterest-bearing deposits at 28.39% of total deposits at Q3 2026 Founded in 1876, Shore United Bank, N.A. is one of the area’s oldest and largest depository institutions
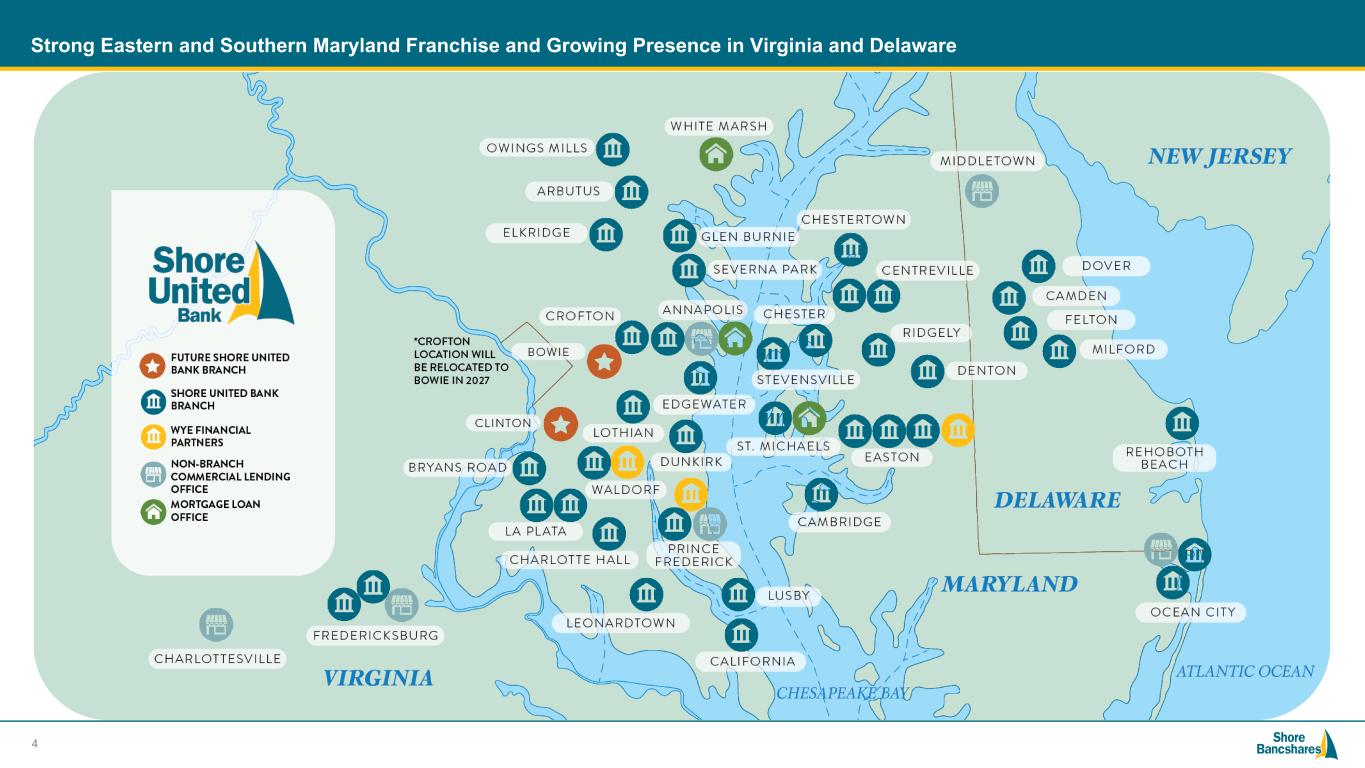
#006881 #ACC0C6 #83AFB4 #FEBE10 #5F574F #4D4F53 #C75B12 #5B8F22 #593160 Strong Eastern and Southern Maryland Franchise and Growing Presence in Virginia and Delaware 4
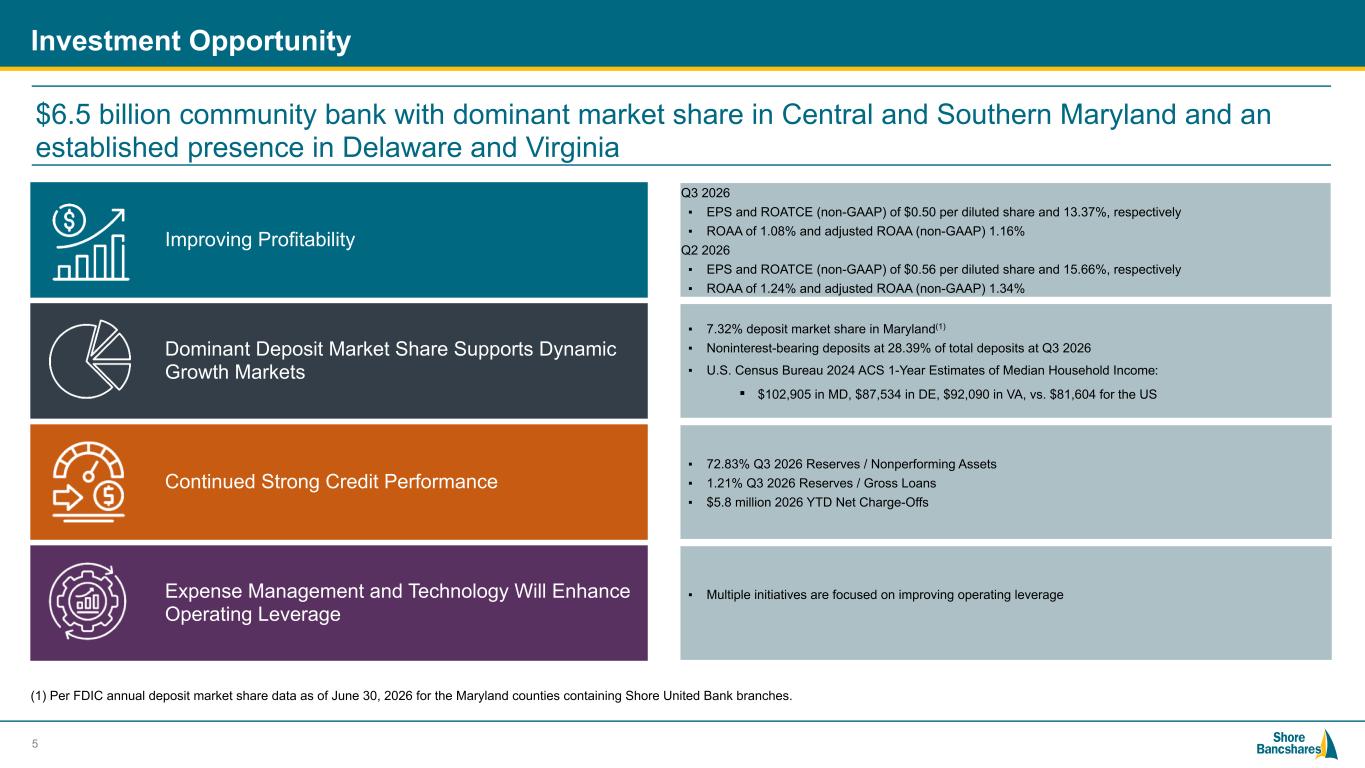
#006881 #ACC0C6 #83AFB4 #FEBE10 #5F574F #4D4F53 #C75B12 #5B8F22 #593160 Investment Opportunity Q3 2026 ▪ EPS and ROATCE (non-GAAP) of $0.50 per diluted share and 13.37%, respectively ▪ ROAA of 1.08% and adjusted ROAA (non-GAAP) 1.16% Q2 2026 ▪ EPS and ROATCE (non-GAAP) of $0.56 per diluted share and 15.66%, respectively ▪ ROAA of 1.24% and adjusted ROAA (non-GAAP) 1.34% Improving Profitability Dominant Deposit Market Share Supports Dynamic Growth Markets Continued Strong Credit Performance Expense Management and Technology Will Enhance Operating Leverage ▪ 7.32% deposit market share in Maryland(1) ▪ Noninterest-bearing deposits at 28.39% of total deposits at Q3 2026 ▪ U.S. Census Bureau 2024 ACS 1-Year Estimates of Median Household Income: ▪ $102,905 in MD, $87,534 in DE, $92,090 in VA, vs. $81,604 for the US ▪ 72.83% Q3 2026 Reserves / Nonperforming Assets ▪ 1.21% Q3 2026 Reserves / Gross Loans ▪ $5.8 million 2026 YTD Net Charge-Offs ▪ Multiple initiatives are focused on improving operating leverage (1) Per FDIC annual deposit market share data as of June 30, 2026 for the Maryland counties containing Shore United Bank branches. 5 $6.5 billion community bank with dominant market share in Central and Southern Maryland and an established presence in Delaware and Virginia
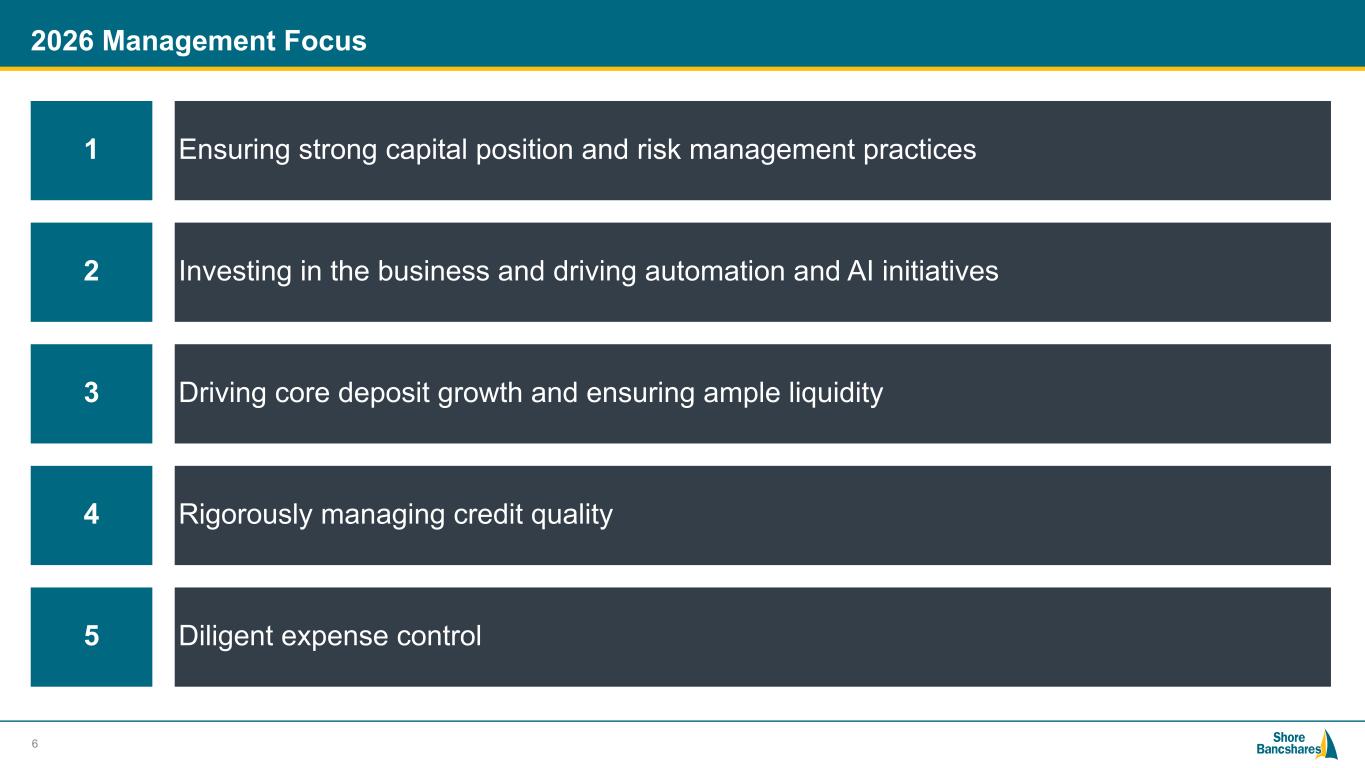
#006881 #ACC0C6 #83AFB4 #FEBE10 #5F574F #4D4F53 #C75B12 #5B8F22 #593160 2026 Management Focus 6 1 Ensuring strong capital position and risk management practices 2 Investing in the business and driving automation and AI initiatives 3 Driving core deposit growth and ensuring ample liquidity 4 Rigorously managing credit quality 5 Diligent expense control
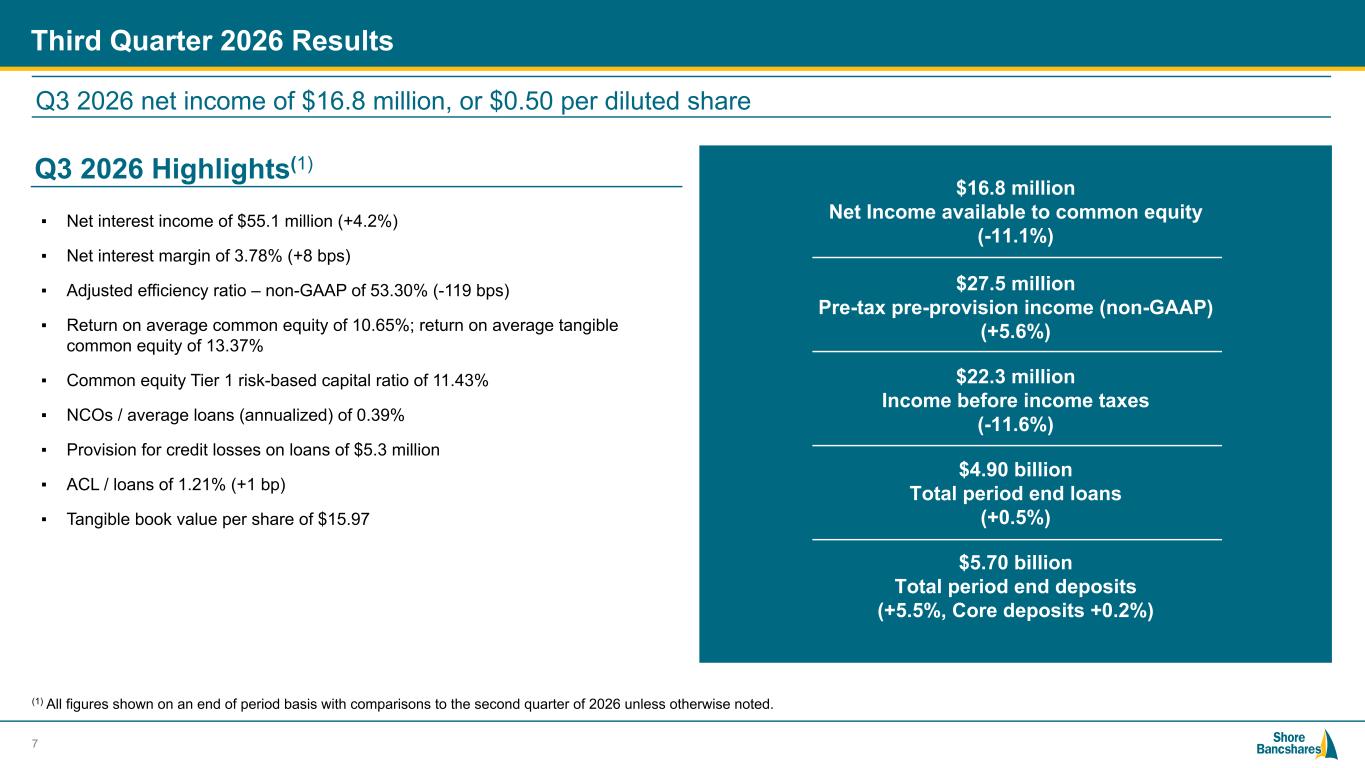
#006881 #ACC0C6 #83AFB4 #FEBE10 #5F574F #4D4F53 #C75B12 #5B8F22 #593160 Third Quarter 2026 Results (1) All figures shown on an end of period basis with comparisons to the second quarter of 2026 unless otherwise noted. 7 Q3 2026 net income of $16.8 million, or $0.50 per diluted share Q3 2026 Highlights(1) $16.8 million Net Income available to common equity (-11.1%) $27.5 million Pre-tax pre-provision income (non-GAAP) (+5.6%) $22.3 million Income before income taxes (-11.6%) $4.90 billion Total period end loans (+0.5%) $5.70 billion Total period end deposits (+5.5%, Core deposits +0.2%) ▪ Net interest income of $55.1 million (+4.2%) ▪ Net interest margin of 3.78% (+8 bps) ▪ Adjusted efficiency ratio – non-GAAP of 53.30% (-119 bps) ▪ Return on average common equity of 10.65%; return on average tangible common equity of 13.37% ▪ Common equity Tier 1 risk-based capital ratio of 11.43% ▪ NCOs / average loans (annualized) of 0.39% ▪ Provision for credit losses on loans of $5.3 million ▪ ACL / loans of 1.21% (+1 bp) ▪ Tangible book value per share of $15.97
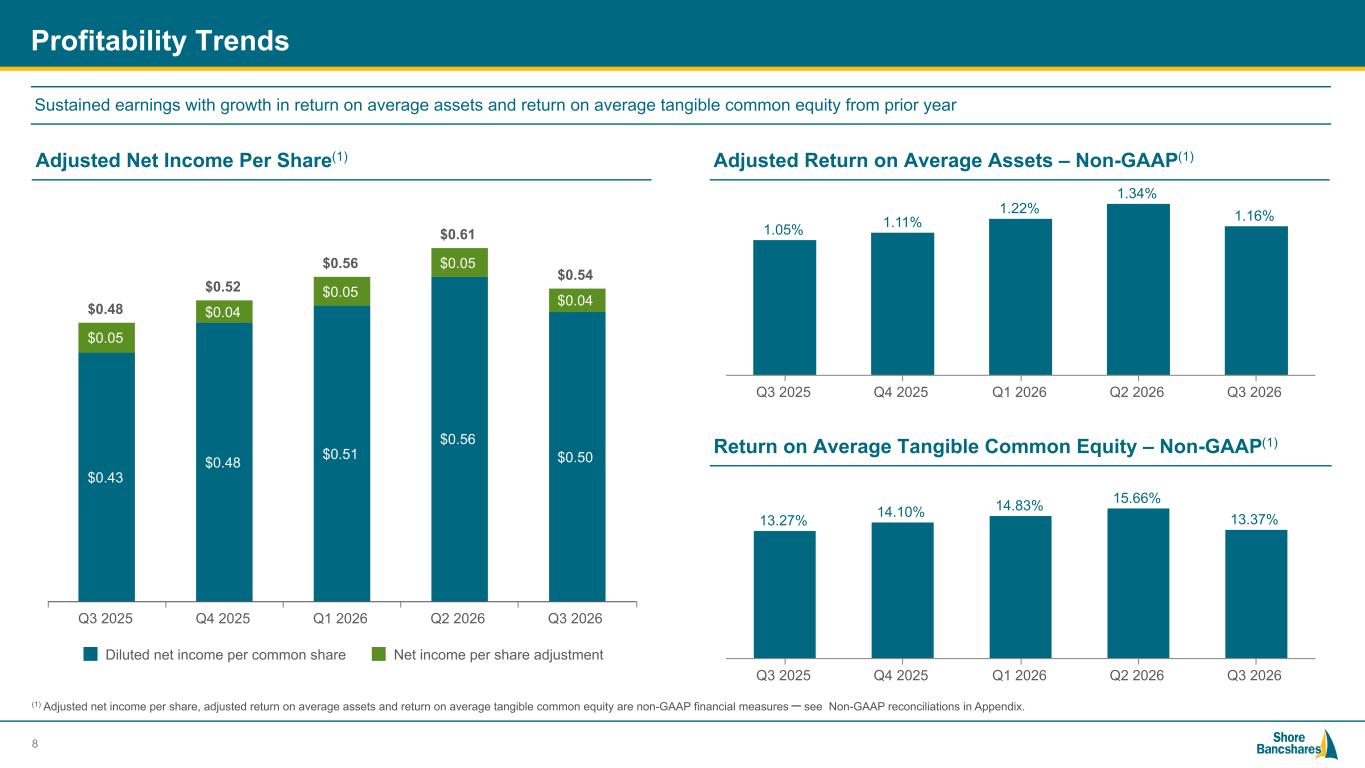
#006881 #ACC0C6 #83AFB4 #FEBE10 #5F574F #4D4F53 #C75B12 #5B8F22 #593160 Profitability Trends (1) Adjusted net income per share, adjusted return on average assets and return on average tangible common equity are non-GAAP financial measures – see Non-GAAP reconciliations in Appendix. 1.05% 1.11% 1.22% 1.34% 1.16% Q3 2025 Q4 2025 Q1 2026 Q2 2026 Q3 2026 13.27% 14.10% 14.83% 15.66% 13.37% Q3 2025 Q4 2025 Q1 2026 Q2 2026 Q3 2026 8 $0.48 $0.52 $0.56 $0.61 $0.54 $0.43 $0.48 $0.51 $0.56 $0.50 $0.05 $0.04 $0.05 $0.05 $0.04 Diluted net income per common share Net income per share adjustment Q3 2025 Q4 2025 Q1 2026 Q2 2026 Q3 2026 Sustained earnings with growth in return on average assets and return on average tangible common equity from prior year Adjusted Net Income Per Share(1) Adjusted Return on Average Assets – Non-GAAP(1) Return on Average Tangible Common Equity – Non-GAAP(1)
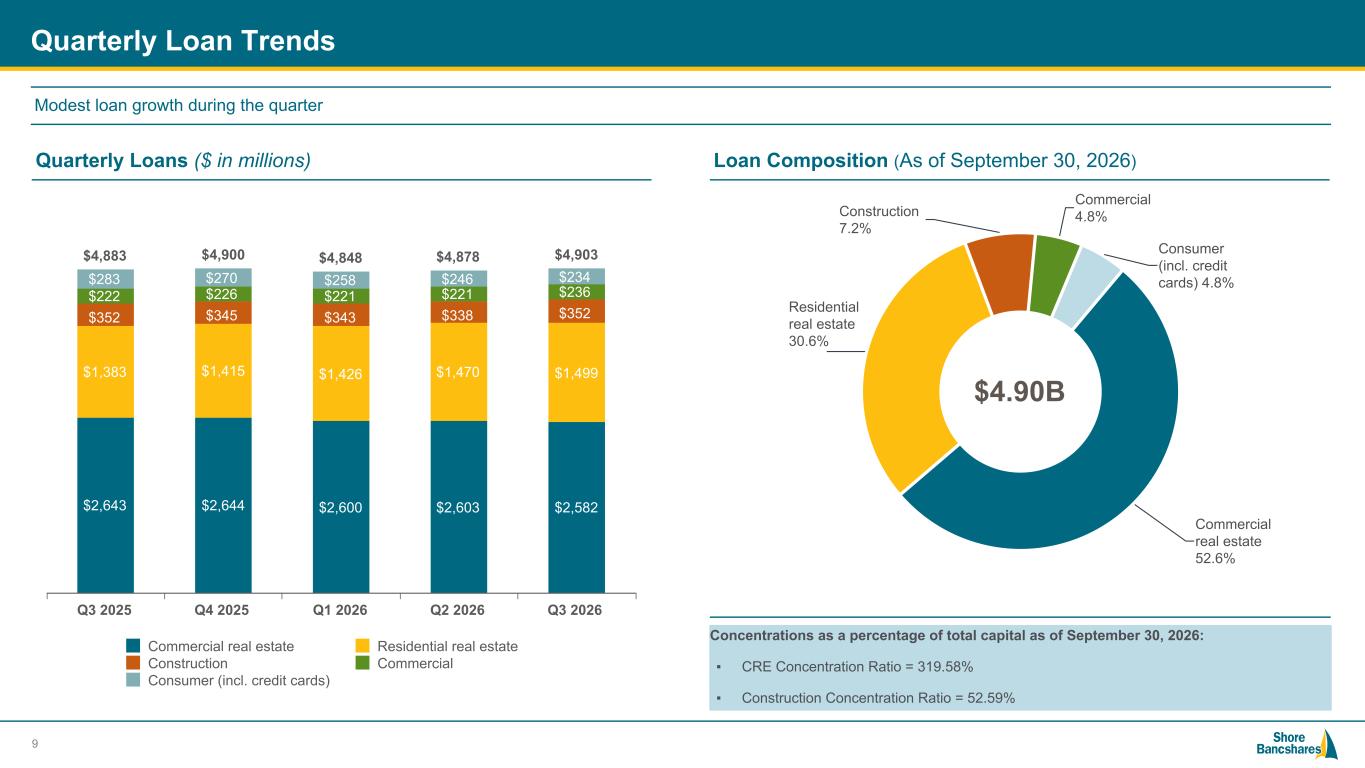
#006881 #ACC0C6 #83AFB4 #FEBE10 #5F574F #4D4F53 #C75B12 #5B8F22 #593160 Commercial real estate 52.6% Residential real estate 30.6% Construction 7.2% Commercial 4.8% Consumer (incl. credit cards) 4.8% Quarterly Loan Trends $4.90B Concentrations as a percentage of total capital as of September 30, 2026: ▪ CRE Concentration Ratio = 319.58% ▪ Construction Concentration Ratio = 52.59% 9 Quarterly Loans ($ in millions) Loan Composition (As of September 30, 2026) $4,883 $4,900 $4,848 $4,878 $4,903 $2,643 $2,644 $2,600 $2,603 $2,582 $1,383 $1,415 $1,426 $1,470 $1,499 $352 $345 $343 $338 $352 $222 $226 $221 $221 $236 $283 $270 $258 $246 $234 Commercial real estate Residential real estate Construction Commercial Consumer (incl. credit cards) Q3 2025 Q4 2025 Q1 2026 Q2 2026 Q3 2026 Modest loan growth during the quarter
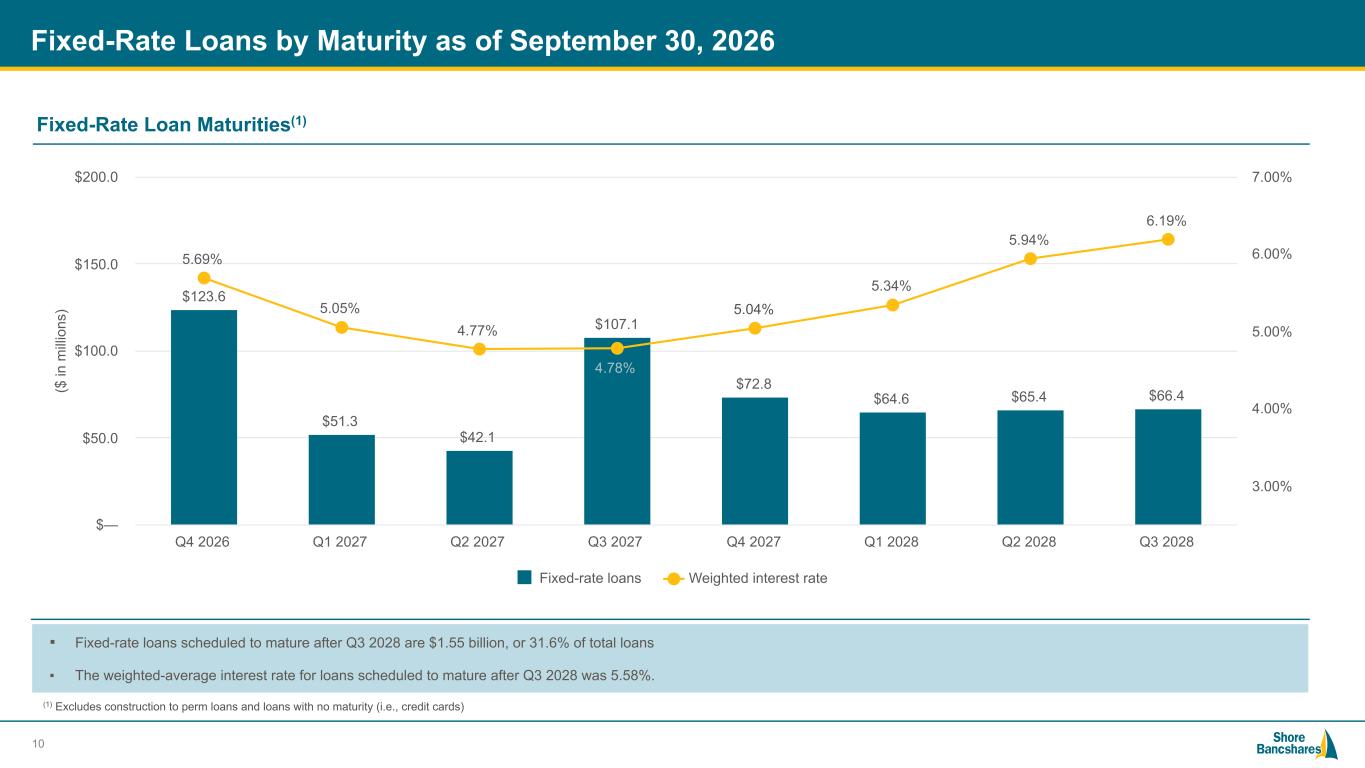
#006881 #ACC0C6 #83AFB4 #FEBE10 #5F574F #4D4F53 #C75B12 #5B8F22 #593160 ▪ Fixed-rate loans scheduled to mature after Q3 2028 are $1.55 billion, or 31.6% of total loans ▪ The weighted-average interest rate for loans scheduled to mature after Q3 2028 was 5.58%. Fixed-Rate Loans by Maturity as of September 30, 2026 10 Fixed-Rate Loan Maturities(1) ($ in m ill io ns ) $123.6 $51.3 $42.1 $107.1 $72.8 $64.6 $65.4 $66.4 5.69% 5.05% 4.77% 4.78% 5.04% 5.34% 5.94% 6.19% Fixed-rate loans Weighted interest rate Q4 2026 Q1 2027 Q2 2027 Q3 2027 Q4 2027 Q1 2028 Q2 2028 Q3 2028 $— $50.0 $100.0 $150.0 $200.0 3.00% 4.00% 5.00% 6.00% 7.00% (1) Excludes construction to perm loans and loans with no maturity (i.e., credit cards)
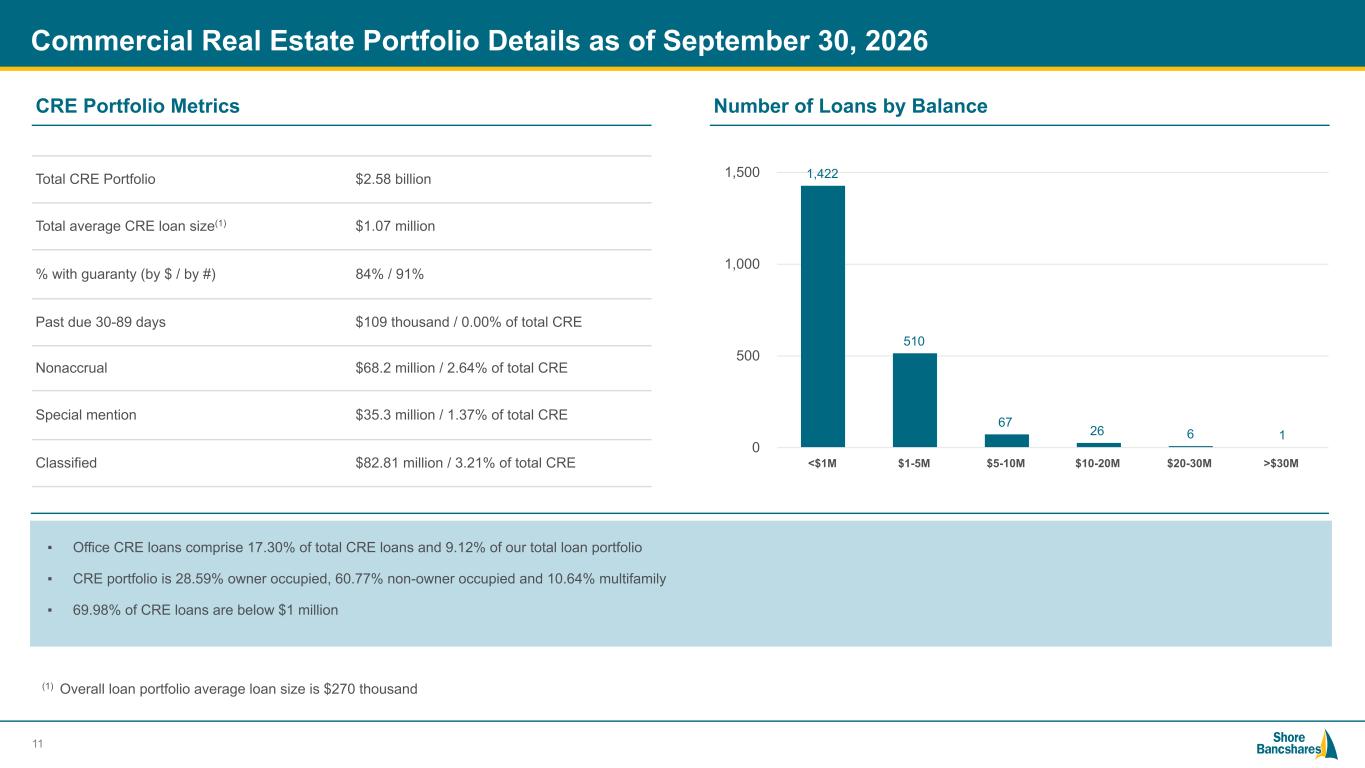
#006881 #ACC0C6 #83AFB4 #FEBE10 #5F574F #4D4F53 #C75B12 #5B8F22 #593160 Commercial Real Estate Portfolio Details as of September 30, 2026 Total CRE Portfolio $2.58 billion Total average CRE loan size(1) $1.07 million % with guaranty (by $ / by #) 84% / 91% Past due 30-89 days $109 thousand / 0.00% of total CRE Nonaccrual $68.2 million / 2.64% of total CRE Special mention $35.3 million / 1.37% of total CRE Classified $82.81 million / 3.21% of total CRE ▪ Office CRE loans comprise 17.30% of total CRE loans and 9.12% of our total loan portfolio ▪ CRE portfolio is 28.59% owner occupied, 60.77% non-owner occupied and 10.64% multifamily ▪ 69.98% of CRE loans are below $1 million 11 CRE Portfolio Metrics Number of Loans by Balance 1,422 510 67 26 6 1 <$1M $1-5M $5-10M $10-20M $20-30M >$30M 0 500 1,000 1,500 (1) Overall loan portfolio average loan size is $270 thousand
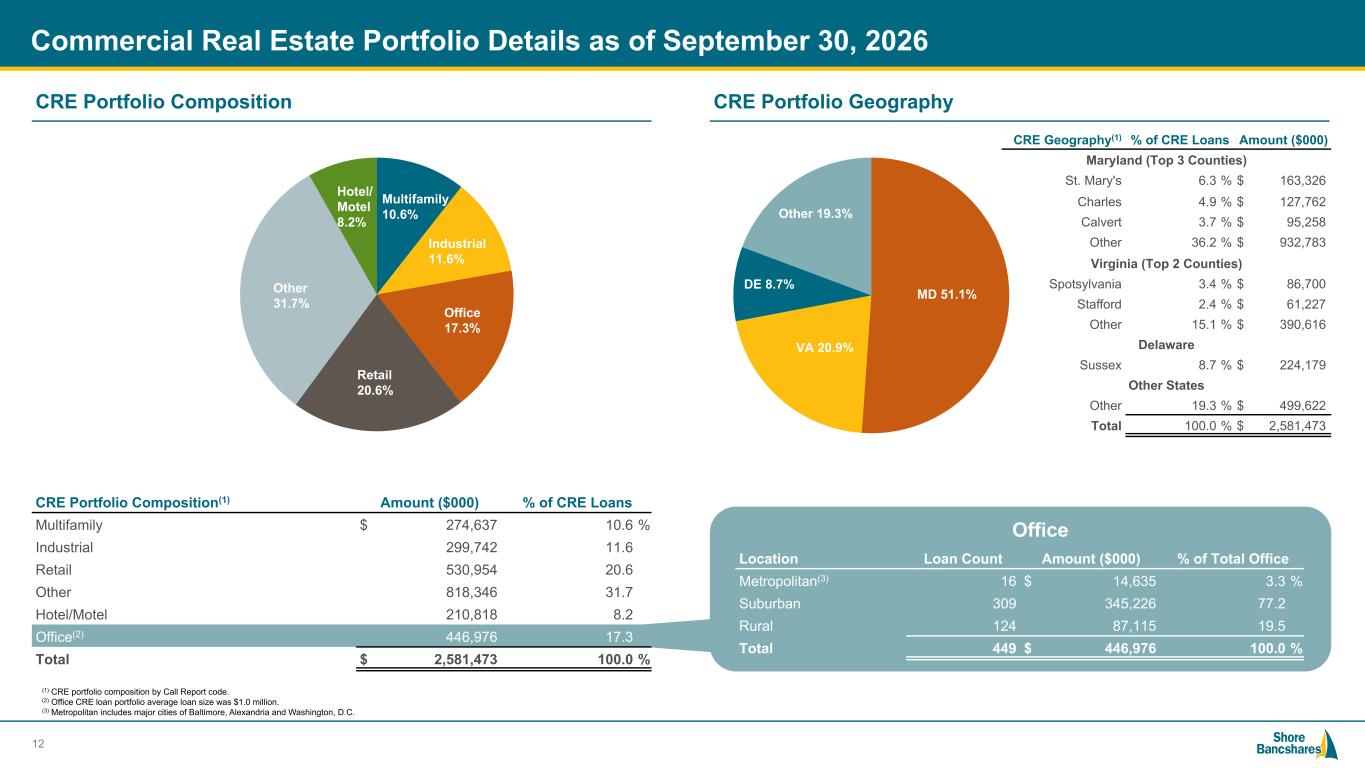
#006881 #ACC0C6 #83AFB4 #FEBE10 #5F574F #4D4F53 #C75B12 #5B8F22 #593160 Commercial Real Estate Portfolio Details as of September 30, 2026 Multifamily 10.6% Industrial 11.6% Office 17.3% Retail 20.6% Other 31.7% Hotel/ Motel 8.2% MD 51.1% VA 20.9% DE 8.7% Other 19.3% CRE Portfolio Composition(1) Amount ($000) % of CRE Loans Multifamily $ 274,637 10.6 % Industrial 299,742 11.6 Retail 530,954 20.6 Other 818,346 31.7 Hotel/Motel 210,818 8.2 Office(2) 446,976 17.3 Total $ 2,581,473 100.0 % Location Loan Count Amount ($000) % of Total Office Metropolitan(3) 16 $ 14,635 3.3 % Suburban 309 345,226 77.2 Rural 124 87,115 19.5 Total 449 $ 446,976 100.0 % (1) CRE portfolio composition by Call Report code. (2) Office CRE loan portfolio average loan size was $1.0 million. (3) Metropolitan includes major cities of Baltimore, Alexandria and Washington, D.C. Office 12 CRE Portfolio Composition CRE Portfolio Geography CRE Geography(1) % of CRE Loans Amount ($000) Maryland (Top 3 Counties) St. Mary's 6.3 % $ 163,326 Charles 4.9 % $ 127,762 Calvert 3.7 % $ 95,258 Other 36.2 % $ 932,783 Virginia (Top 2 Counties) Spotsylvania 3.4 % $ 86,700 Stafford 2.4 % $ 61,227 Other 15.1 % $ 390,616 Delaware Sussex 8.7 % $ 224,179 Other States Other 19.3 % $ 499,622 Total 100.0 % $ 2,581,473
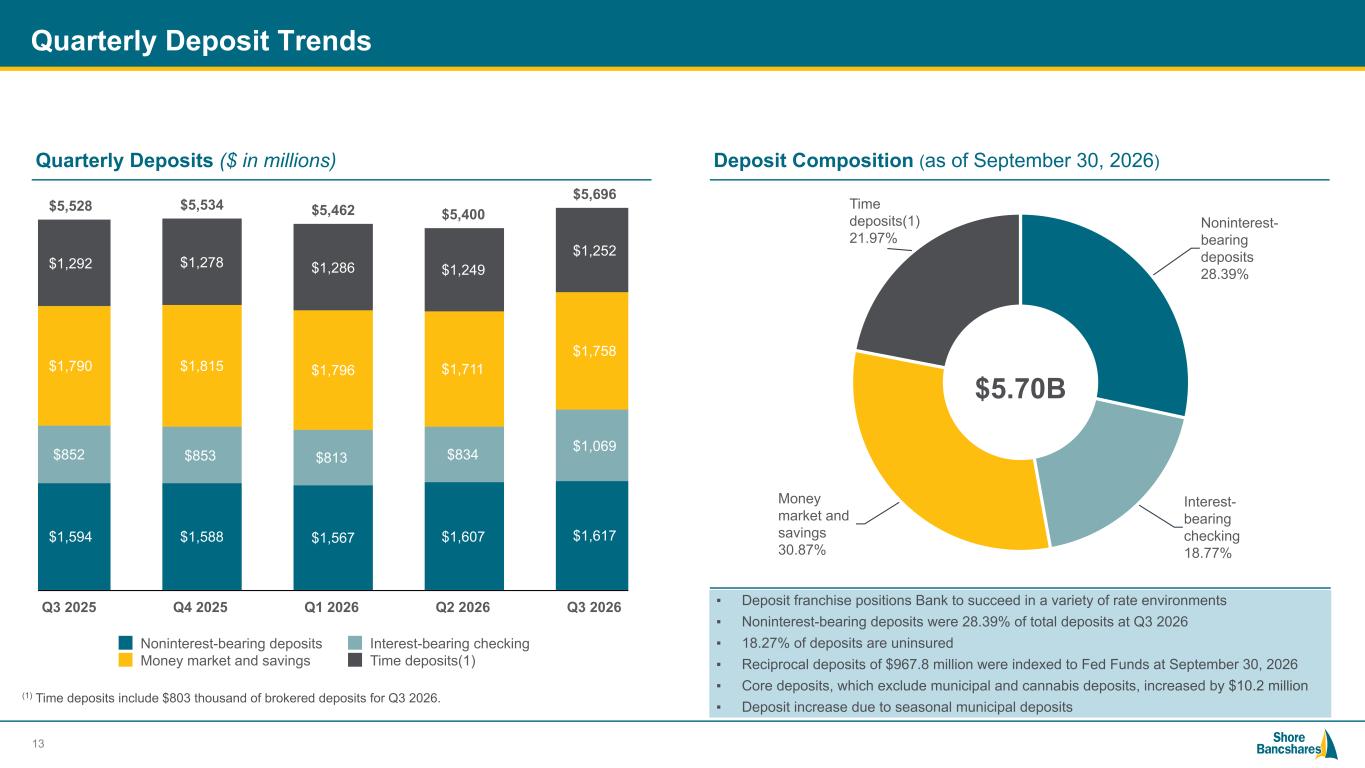
#006881 #ACC0C6 #83AFB4 #FEBE10 #5F574F #4D4F53 #C75B12 #5B8F22 #593160 Quarterly Deposit Trends 13 $5,528 $5,534 $5,462 $5,400 $5,696 $1,594 $1,588 $1,567 $1,607 $1,617 $852 $853 $813 $834 $1,069 $1,790 $1,815 $1,796 $1,711 $1,758 $1,292 $1,278 $1,286 $1,249 $1,252 Noninterest-bearing deposits Interest-bearing checking Money market and savings Time deposits(1) Q3 2025 Q4 2025 Q1 2026 Q2 2026 Q3 2026 Noninterest- bearing deposits 28.39% Interest- bearing checking 18.77% Money market and savings 30.87% Time deposits(1) 21.97% Quarterly Deposits ($ in millions) Deposit Composition (as of September 30, 2026) $5.70B ▪ Deposit franchise positions Bank to succeed in a variety of rate environments ▪ Noninterest-bearing deposits were 28.39% of total deposits at Q3 2026 ▪ 18.27% of deposits are uninsured ▪ Reciprocal deposits of $967.8 million were indexed to Fed Funds at September 30, 2026 ▪ Core deposits, which exclude municipal and cannabis deposits, increased by $10.2 million ▪ Deposit increase due to seasonal municipal deposits (1) Time deposits include $803 thousand of brokered deposits for Q3 2026.
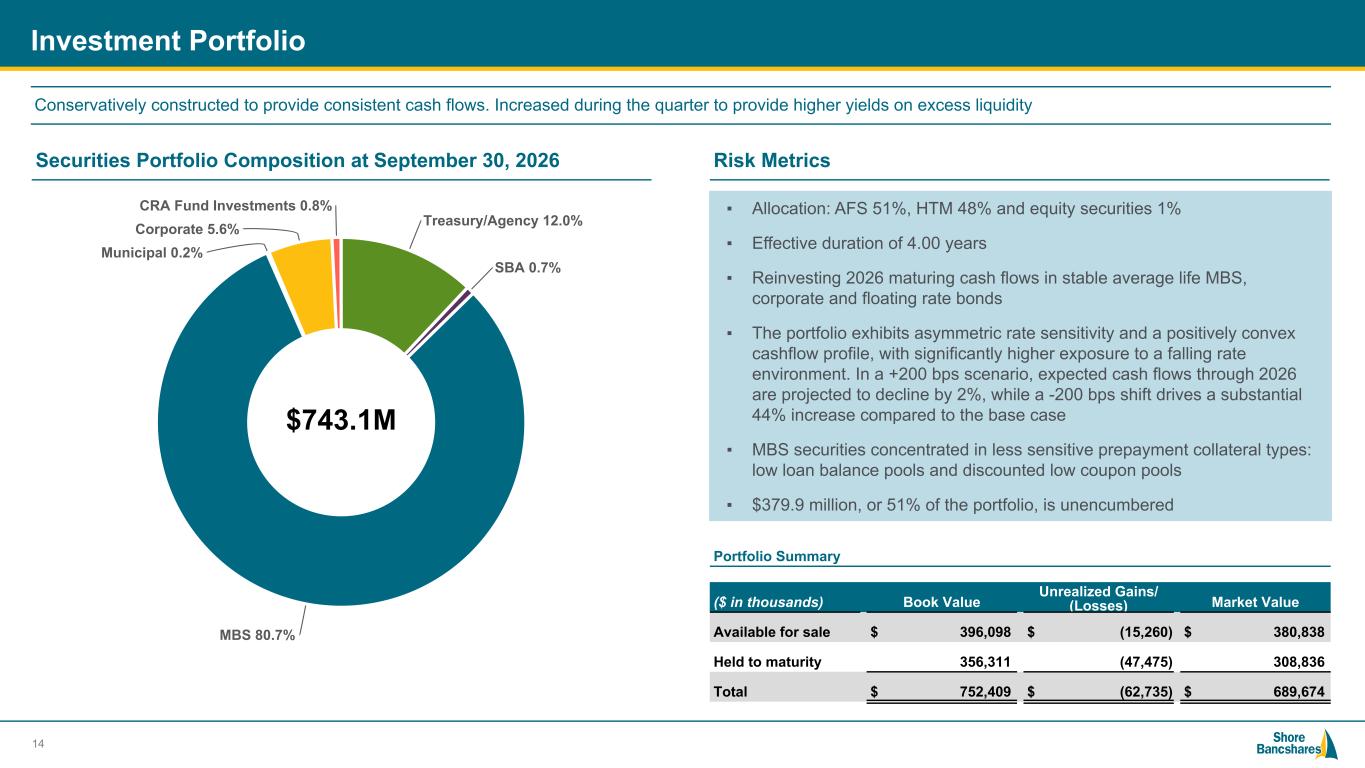
#006881 #ACC0C6 #83AFB4 #FEBE10 #5F574F #4D4F53 #C75B12 #5B8F22 #593160 Investment Portfolio 14 ▪ Allocation: AFS 51%, HTM 48% and equity securities 1% ▪ Effective duration of 4.00 years ▪ Reinvesting 2026 maturing cash flows in stable average life MBS, corporate and floating rate bonds ▪ The portfolio exhibits asymmetric rate sensitivity and a positively convex cashflow profile, with significantly higher exposure to a falling rate environment. In a +200 bps scenario, expected cash flows through 2026 are projected to decline by 2%, while a -200 bps shift drives a substantial 44% increase compared to the base case ▪ MBS securities concentrated in less sensitive prepayment collateral types: low loan balance pools and discounted low coupon pools ▪ $379.9 million, or 51% of the portfolio, is unencumbered Treasury/Agency 12.0% SBA 0.7% MBS 80.7% Municipal 0.2% Corporate 5.6% CRA Fund Investments 0.8% $743.1M Securities Portfolio Composition at September 30, 2026 Risk Metrics Conservatively constructed to provide consistent cash flows. Increased during the quarter to provide higher yields on excess liquidity Portfolio Summary ($ in thousands) Book Value Unrealized Gains/ (Losses) Market Value Available for sale $ 396,098 $ (15,260) $ 380,838 Held to maturity 356,311 (47,475) 308,836 Total $ 752,409 $ (62,735) $ 689,674
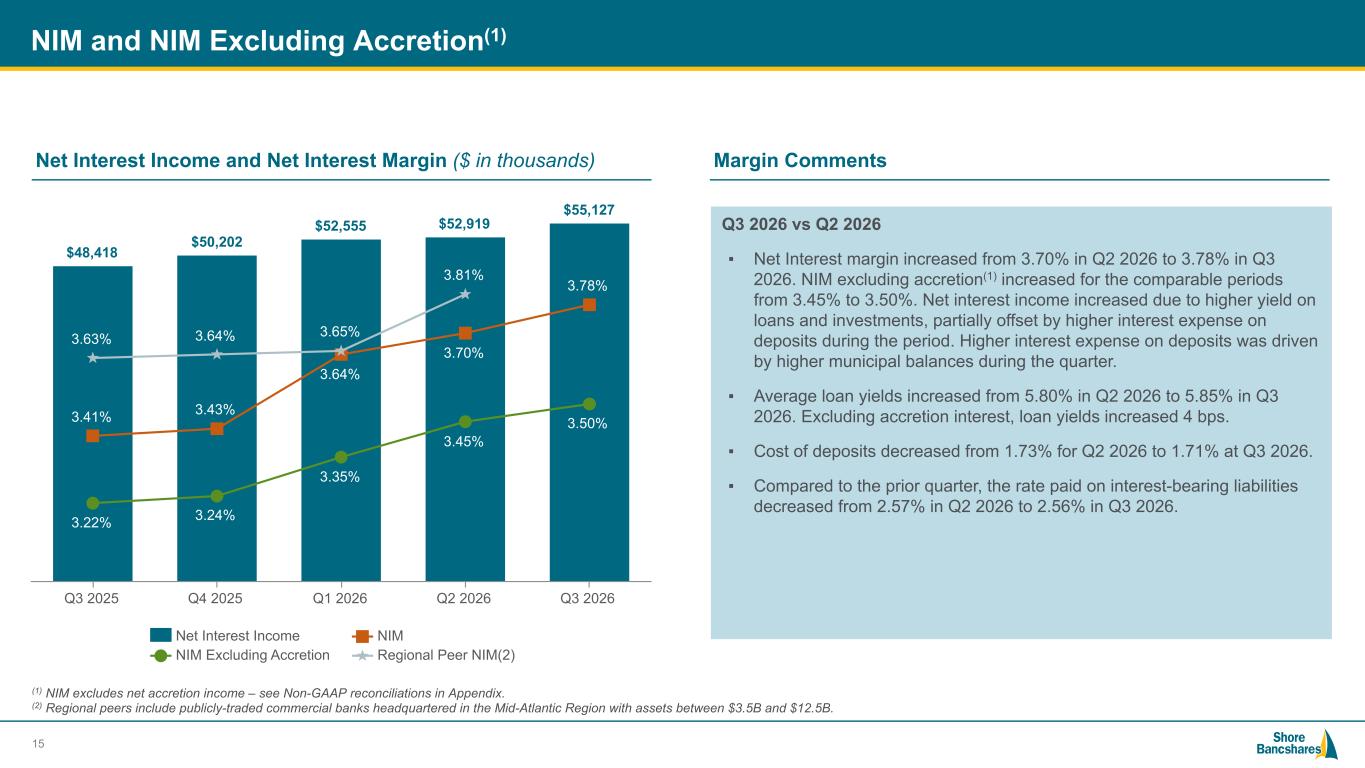
#006881 #ACC0C6 #83AFB4 #FEBE10 #5F574F #4D4F53 #C75B12 #5B8F22 #593160 $48,418 $50,202 $52,555 $52,919 $55,127 3.41% 3.43% 3.64% 3.70% 3.78% 3.22% 3.24% 3.35% 3.45% 3.50% 3.63% 3.64% 3.65% 3.81% Net Interest Income NIM NIM Excluding Accretion Regional Peer NIM(2) Q3 2025 Q4 2025 Q1 2026 Q2 2026 Q3 2026 NIM and NIM Excluding Accretion(1) (1) NIM excludes net accretion income – see Non-GAAP reconciliations in Appendix. (2) Regional peers include publicly-traded commercial banks headquartered in the Mid-Atlantic Region with assets between $3.5B and $12.5B. 15 Net Interest Income and Net Interest Margin ($ in thousands) Margin Comments Q3 2026 vs Q2 2026 ▪ Net Interest margin increased from 3.70% in Q2 2026 to 3.78% in Q3 2026. NIM excluding accretion(1) increased for the comparable periods from 3.45% to 3.50%. Net interest income increased due to higher yield on loans and investments, partially offset by higher interest expense on deposits during the period. Higher interest expense on deposits was driven by higher municipal balances during the quarter. ▪ Average loan yields increased from 5.80% in Q2 2026 to 5.85% in Q3 2026. Excluding accretion interest, loan yields increased 4 bps. ▪ Cost of deposits decreased from 1.73% for Q2 2026 to 1.71% at Q3 2026. ▪ Compared to the prior quarter, the rate paid on interest-bearing liabilities decreased from 2.57% in Q2 2026 to 2.56% in Q3 2026.
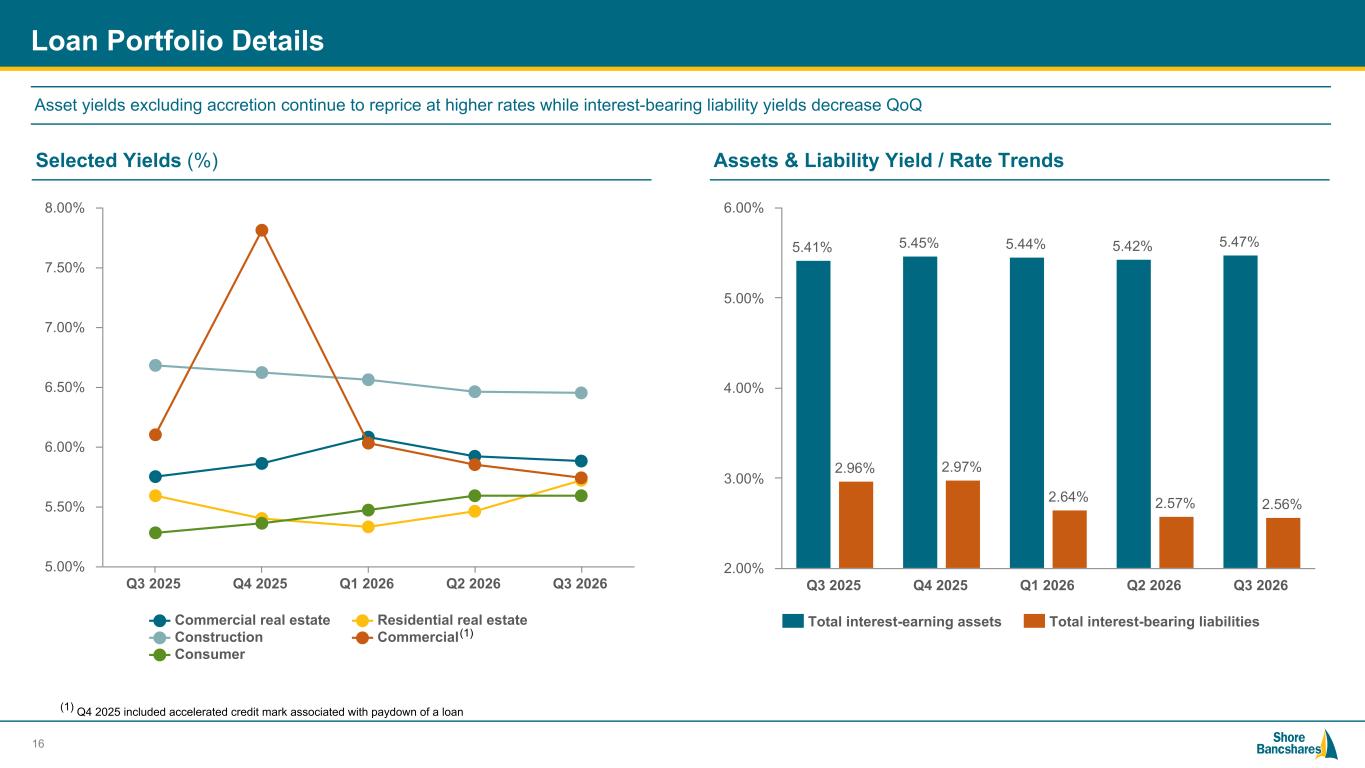
#006881 #ACC0C6 #83AFB4 #FEBE10 #5F574F #4D4F53 #C75B12 #5B8F22 #593160 Loan Portfolio Details Commercial real estate Residential real estate Construction Commercial Consumer Q3 2025 Q4 2025 Q1 2026 Q2 2026 Q3 2026 5.00% 5.50% 6.00% 6.50% 7.00% 7.50% 8.00% 16 Selected Yields (%) 5.41% 5.45% 5.44% 5.42% 5.47% 2.96% 2.97% 2.64% 2.57% 2.56% Total interest-earning assets Total interest-bearing liabilities Q3 2025 Q4 2025 Q1 2026 Q2 2026 Q3 2026 2.00% 3.00% 4.00% 5.00% 6.00% Assets & Liability Yield / Rate Trends Asset yields excluding accretion continue to reprice at higher rates while interest-bearing liability yields decrease QoQ (1) (1) Q4 2025 included accelerated credit mark associated with paydown of a loan
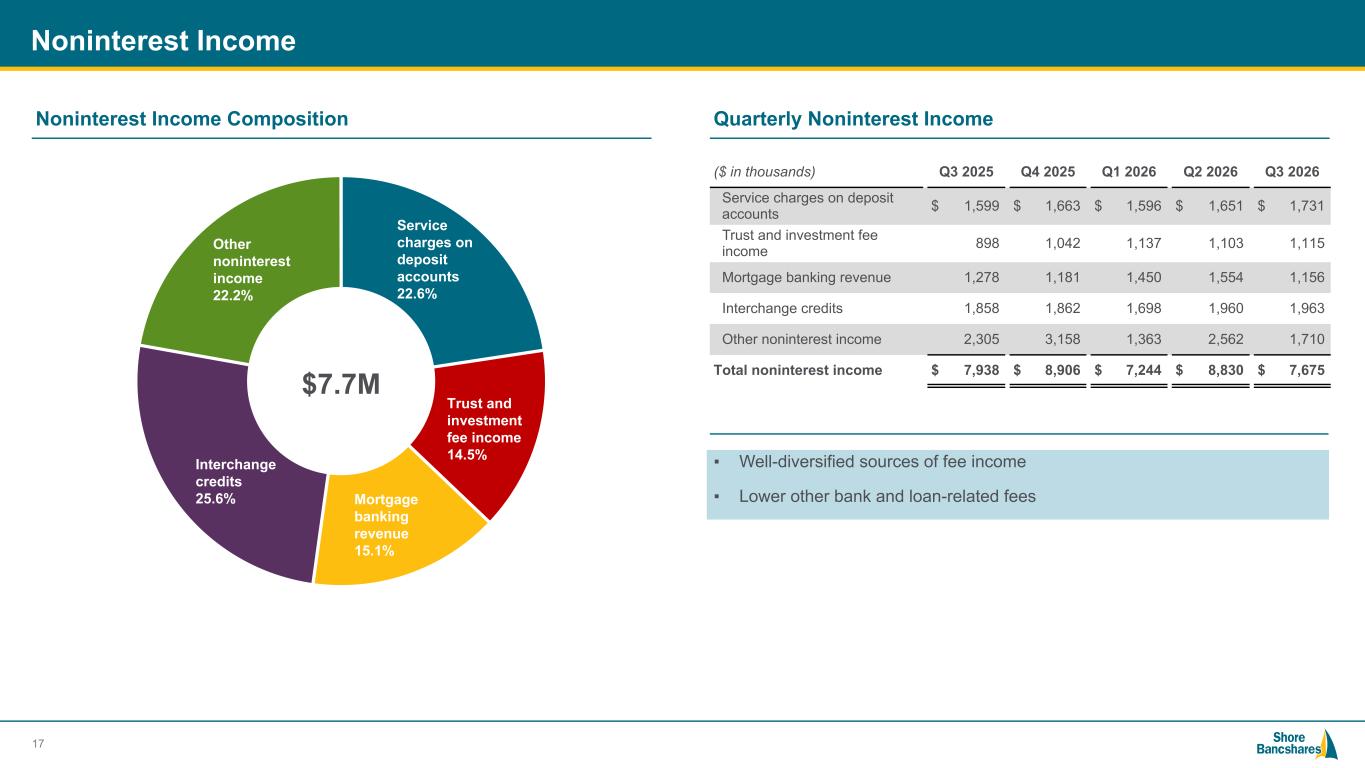
#006881 #ACC0C6 #83AFB4 #FEBE10 #5F574F #4D4F53 #C75B12 #5B8F22 #593160 Noninterest Income 17 Noninterest Income Composition Quarterly Noninterest Income ▪ Well-diversified sources of fee income ▪ Lower other bank and loan-related fees Service charges on deposit accounts 22.6% Trust and investment fee income 14.5% Mortgage banking revenue 15.1% Interchange credits 25.6% Other noninterest income 22.2% $7.7M ($ in thousands) Q3 2025 Q4 2025 Q1 2026 Q2 2026 Q3 2026 Service charges on deposit accounts $ 1,599 $ 1,663 $ 1,596 $ 1,651 $ 1,731 Trust and investment fee income 898 1,042 1,137 1,103 1,115 Mortgage banking revenue 1,278 1,181 1,450 1,554 1,156 Interchange credits 1,858 1,862 1,698 1,960 1,963 Other noninterest income 2,305 3,158 1,363 2,562 1,710 Total noninterest income $ 7,938 $ 8,906 $ 7,244 $ 8,830 $ 7,675
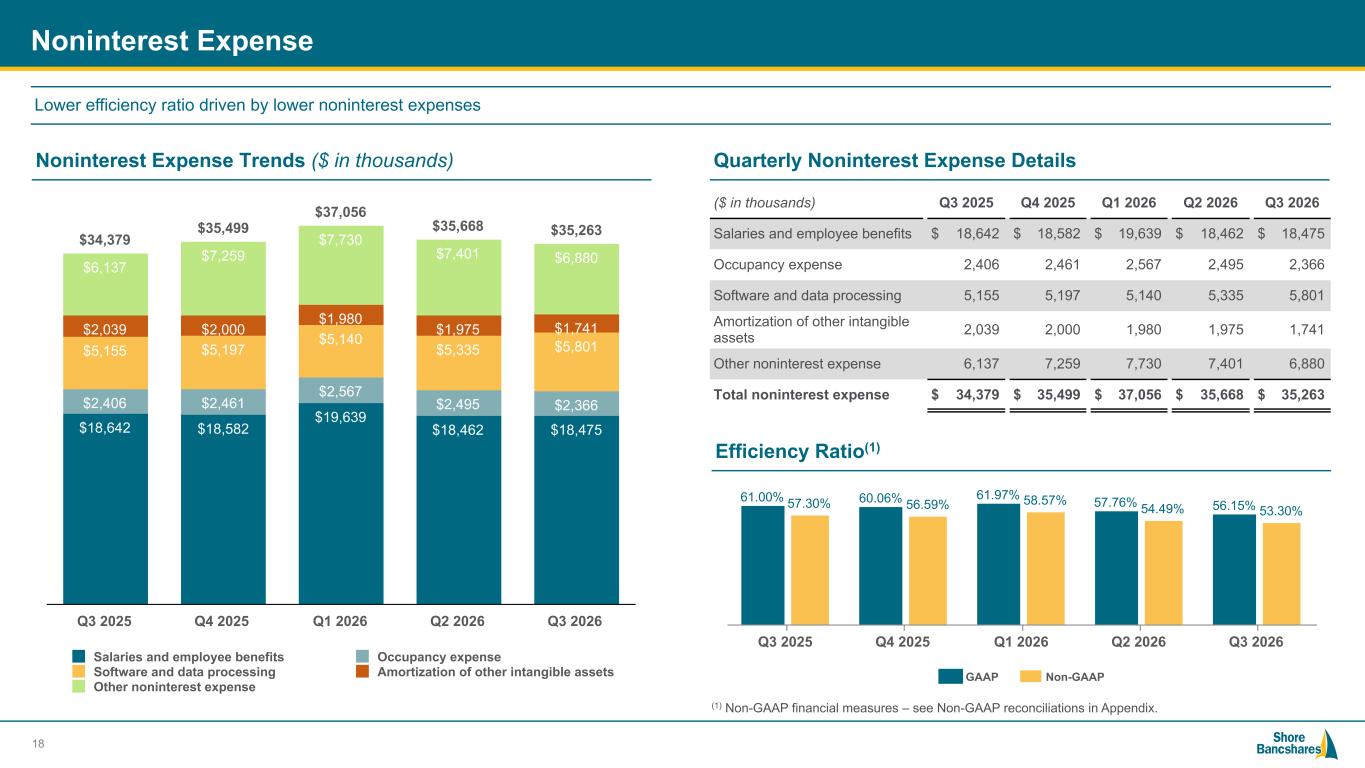
#006881 #ACC0C6 #83AFB4 #FEBE10 #5F574F #4D4F53 #C75B12 #5B8F22 #593160 Noninterest Expense 18 Noninterest Expense Trends ($ in thousands) Quarterly Noninterest Expense Details Lower efficiency ratio driven by lower noninterest expenses ($ in thousands) Q3 2025 Q4 2025 Q1 2026 Q2 2026 Q3 2026 Salaries and employee benefits $ 18,642 $ 18,582 $ 19,639 $ 18,462 $ 18,475 Occupancy expense 2,406 2,461 2,567 2,495 2,366 Software and data processing 5,155 5,197 5,140 5,335 5,801 Amortization of other intangible assets 2,039 2,000 1,980 1,975 1,741 Other noninterest expense 6,137 7,259 7,730 7,401 6,880 Total noninterest expense $ 34,379 $ 35,499 $ 37,056 $ 35,668 $ 35,263 Efficiency Ratio(1) $34,379 $35,499 $37,056 $35,668 $35,263 $18,642 $18,582 $19,639 $18,462 $18,475 $2,406 $2,461 $2,567 $2,495 $2,366 $5,155 $5,197 $5,140 $5,335 $5,801 $2,039 $2,000 $1,980 $1,975 $1,741 $6,137 $7,259 $7,730 $7,401 $6,880 Salaries and employee benefits Occupancy expense Software and data processing Amortization of other intangible assets Other noninterest expense Q3 2025 Q4 2025 Q1 2026 Q2 2026 Q3 2026 61.00% 60.06% 61.97% 57.76% 56.15%57.30% 56.59% 58.57% 54.49% 53.30% GAAP Non-GAAP Q3 2025 Q4 2025 Q1 2026 Q2 2026 Q3 2026 (1) Non-GAAP financial measures – see Non-GAAP reconciliations in Appendix.
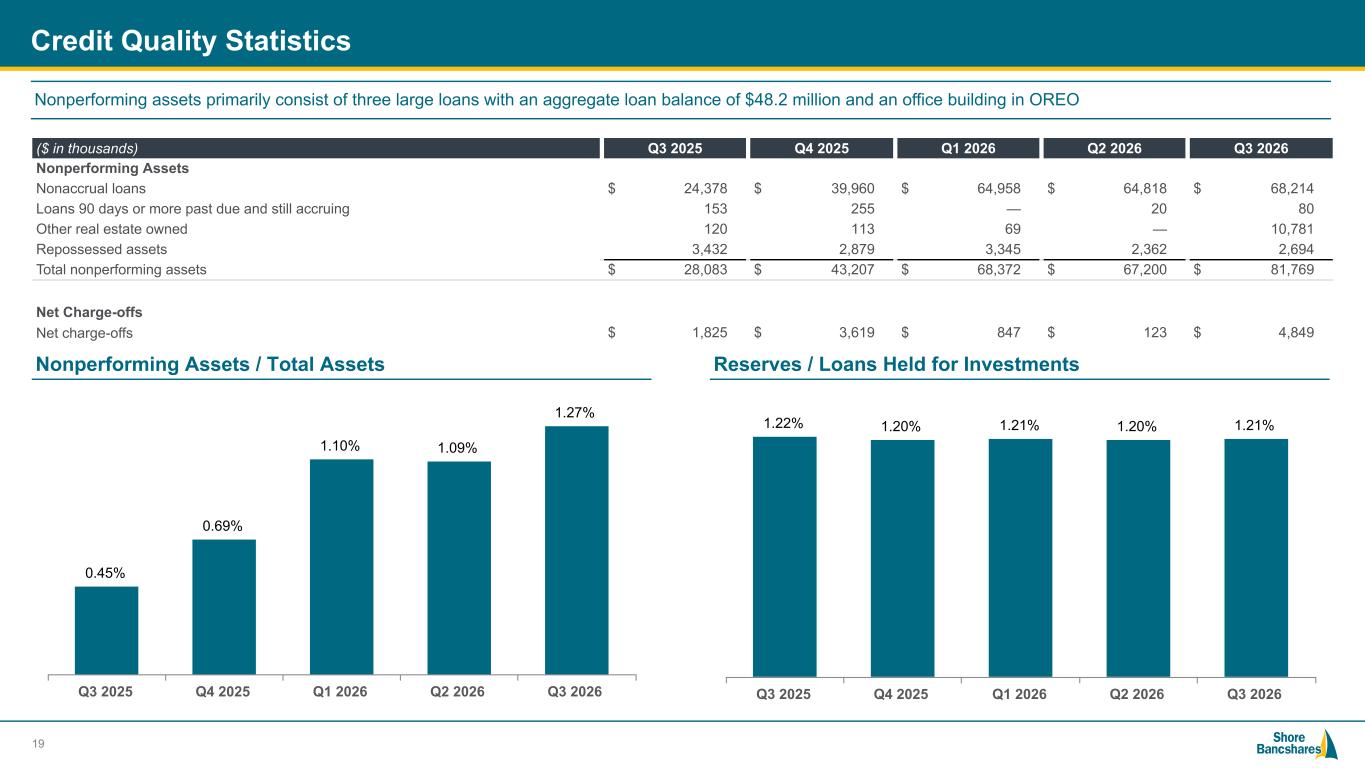
#006881 #ACC0C6 #83AFB4 #FEBE10 #5F574F #4D4F53 #C75B12 #5B8F22 #593160 Credit Quality Statistics ($ in thousands) Q3 2025 Q4 2025 Q1 2026 Q2 2026 Q3 2026 Nonperforming Assets Nonaccrual loans $ 24,378 $ 39,960 $ 64,958 $ 64,818 $ 68,214 Loans 90 days or more past due and still accruing 153 255 — 20 80 Other real estate owned 120 113 69 — 10,781 Repossessed assets 3,432 2,879 3,345 2,362 2,694 Total nonperforming assets $ 28,083 $ 43,207 $ 68,372 $ 67,200 $ 81,769 Net Charge-offs Net charge-offs $ 1,825 $ 3,619 $ 847 $ 123 $ 4,849 19 0.45% 0.69% 1.10% 1.09% 1.27% Q3 2025 Q4 2025 Q1 2026 Q2 2026 Q3 2026 1.22% 1.20% 1.21% 1.20% 1.21% Q3 2025 Q4 2025 Q1 2026 Q2 2026 Q3 2026 Nonperforming Assets / Total Assets Reserves / Loans Held for Investments Nonperforming assets primarily consist of three large loans with an aggregate loan balance of $48.2 million and an office building in OREO
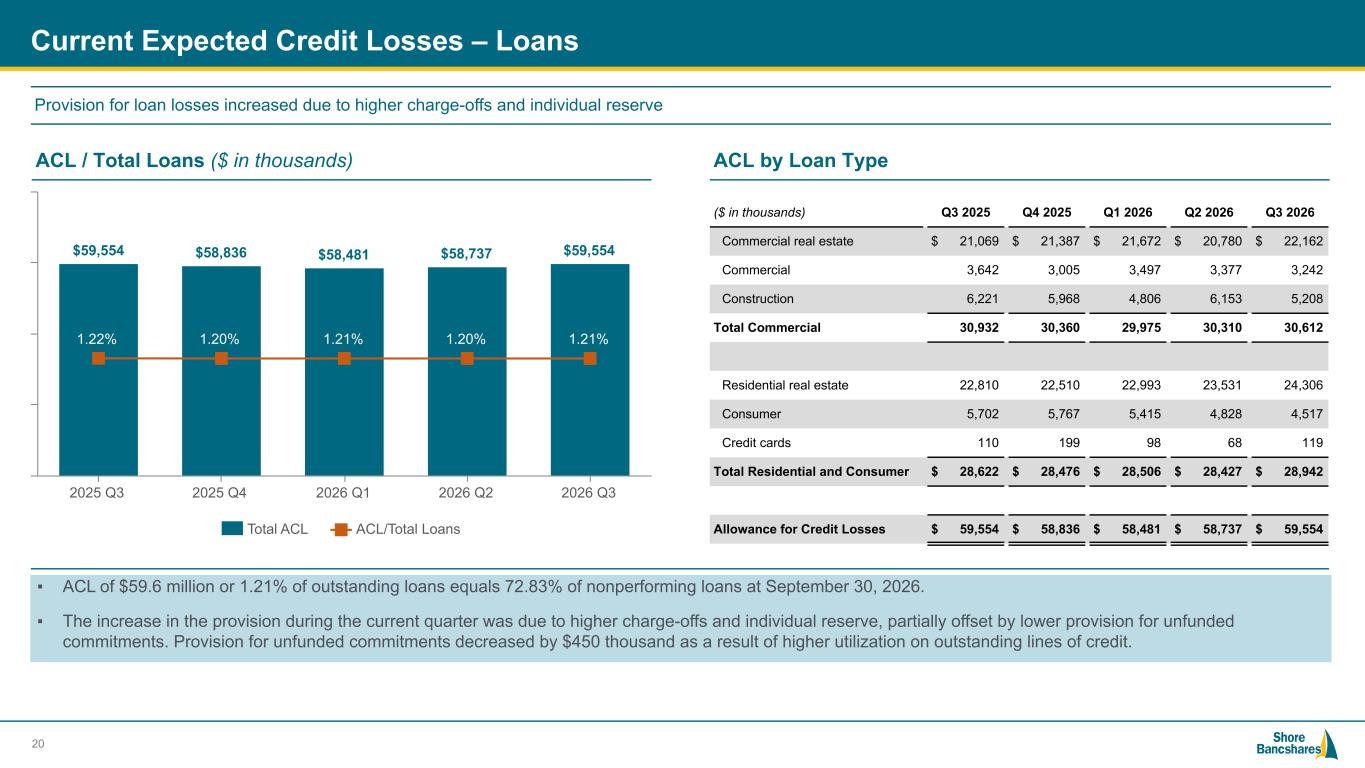
#006881 #ACC0C6 #83AFB4 #FEBE10 #5F574F #4D4F53 #C75B12 #5B8F22 #593160 Current Expected Credit Losses – Loans 20 ACL / Total Loans ($ in thousands) ACL by Loan Type Provision for loan losses increased due to higher charge-offs and individual reserve ▪ ACL of $59.6 million or 1.21% of outstanding loans equals 72.83% of nonperforming loans at September 30, 2026. ▪ The increase in the provision during the current quarter was due to higher charge-offs and individual reserve, partially offset by lower provision for unfunded commitments. Provision for unfunded commitments decreased by $450 thousand as a result of higher utilization on outstanding lines of credit. ($ in thousands) Q3 2025 Q4 2025 Q1 2026 Q2 2026 Q3 2026 Commercial real estate $ 21,069 $ 21,387 $ 21,672 $ 20,780 $ 22,162 Commercial 3,642 3,005 3,497 3,377 3,242 Construction 6,221 5,968 4,806 6,153 5,208 Total Commercial 30,932 30,360 29,975 30,310 30,612 Residential real estate 22,810 22,510 22,993 23,531 24,306 Consumer 5,702 5,767 5,415 4,828 4,517 Credit cards 110 199 98 68 119 Total Residential and Consumer $ 28,622 $ 28,476 $ 28,506 $ 28,427 $ 28,942 Allowance for Credit Losses $ 59,554 $ 58,836 $ 58,481 $ 58,737 $ 59,554 $59,554 $58,836 $58,481 $58,737 $59,554 1.22% 1.20% 1.21% 1.20% 1.21% Total ACL ACL/Total Loans 2025 Q3 2025 Q4 2026 Q1 2026 Q2 2026 Q3
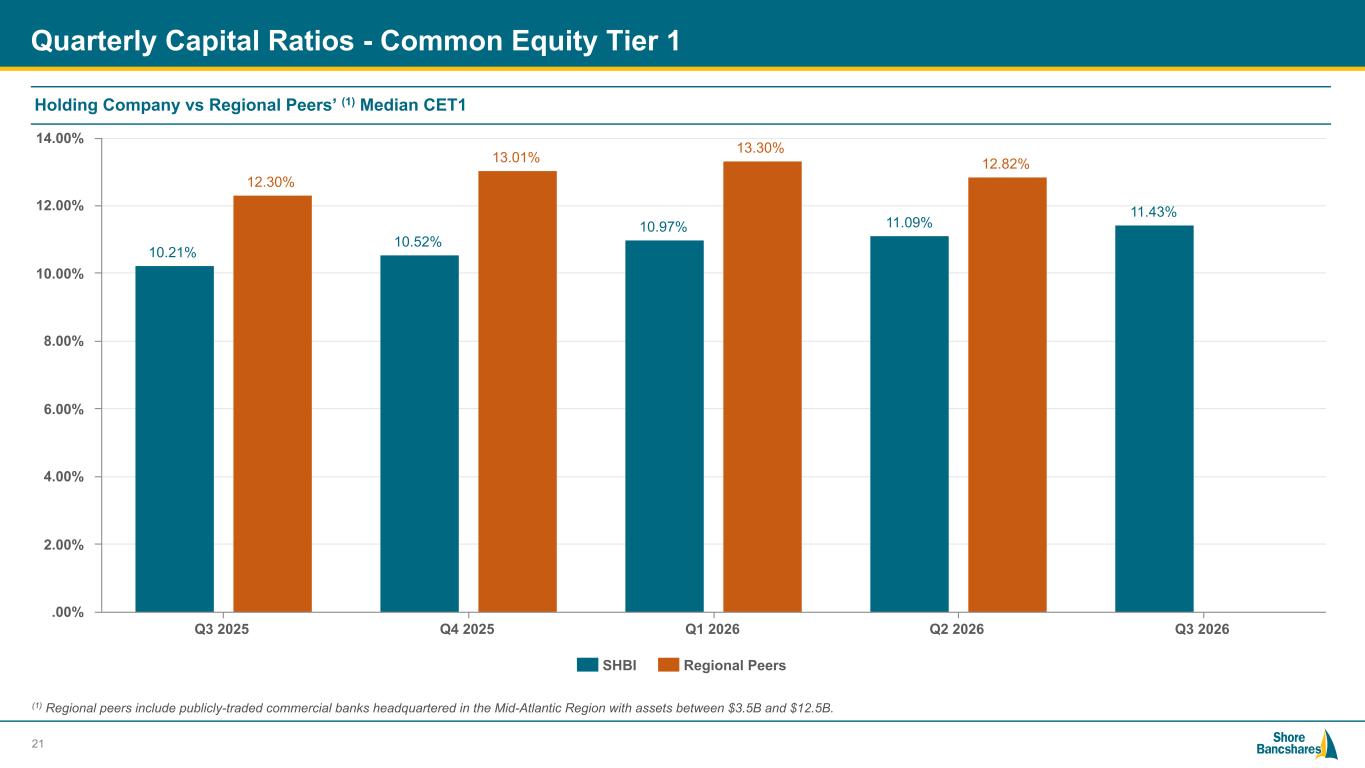
#006881 #ACC0C6 #83AFB4 #FEBE10 #5F574F #4D4F53 #C75B12 #5B8F22 #593160 Quarterly Capital Ratios - Common Equity Tier 1 10.21% 10.52% 10.97% 11.09% 11.43% 12.30% 13.01% 13.30% 12.82% SHBI Regional Peers Q3 2025 Q4 2025 Q1 2026 Q2 2026 Q3 2026 .00% 2.00% 4.00% 6.00% 8.00% 10.00% 12.00% 14.00% 21 Holding Company vs Regional Peers’ (1) Median CET1 (1) Regional peers include publicly-traded commercial banks headquartered in the Mid-Atlantic Region with assets between $3.5B and $12.5B.
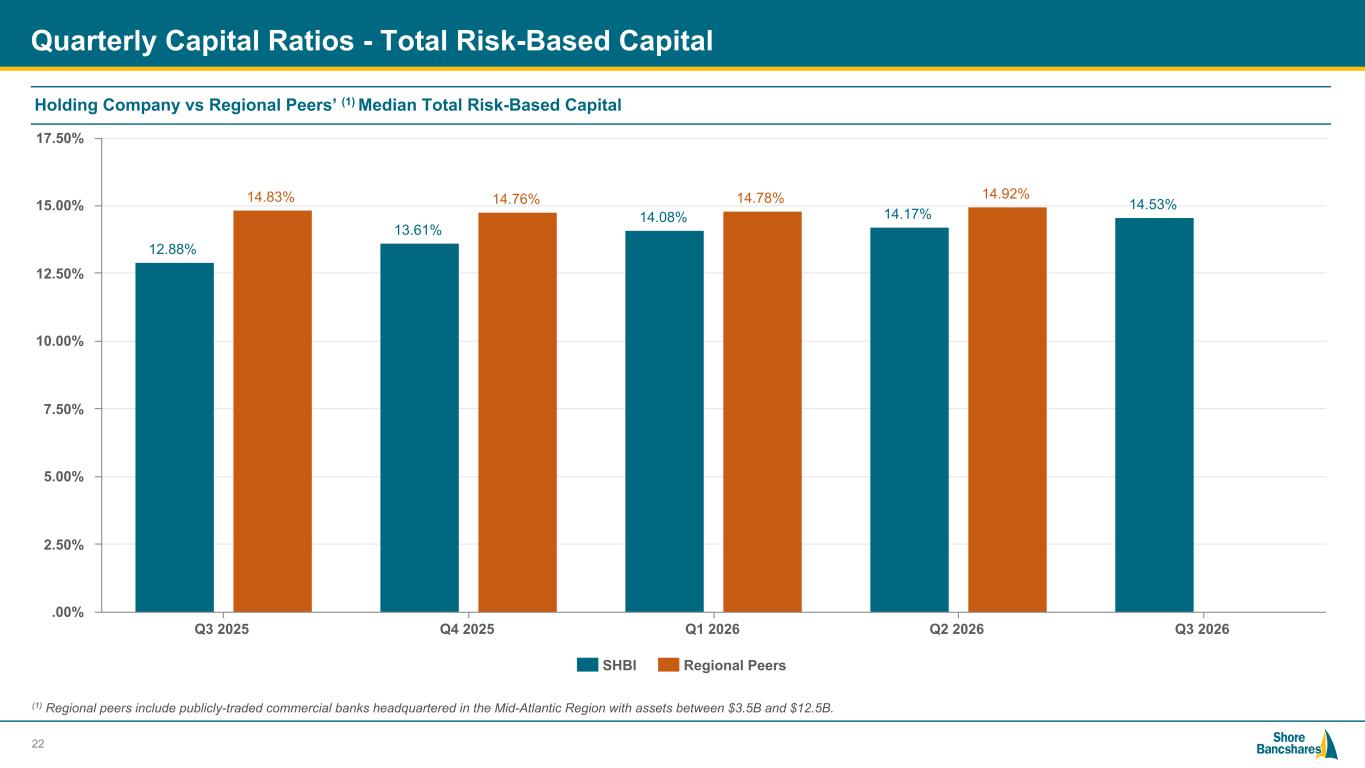
#006881 #ACC0C6 #83AFB4 #FEBE10 #5F574F #4D4F53 #C75B12 #5B8F22 #593160 Quarterly Capital Ratios - Total Risk-Based Capital 12.88% 13.61% 14.08% 14.17% 14.53%14.83% 14.76% 14.78% 14.92% SHBI Regional Peers Q3 2025 Q4 2025 Q1 2026 Q2 2026 Q3 2026 .00% 2.50% 5.00% 7.50% 10.00% 12.50% 15.00% 17.50% 22 Holding Company vs Regional Peers’ (1) Median Total Risk-Based Capital (1) Regional peers include publicly-traded commercial banks headquartered in the Mid-Atlantic Region with assets between $3.5B and $12.5B.
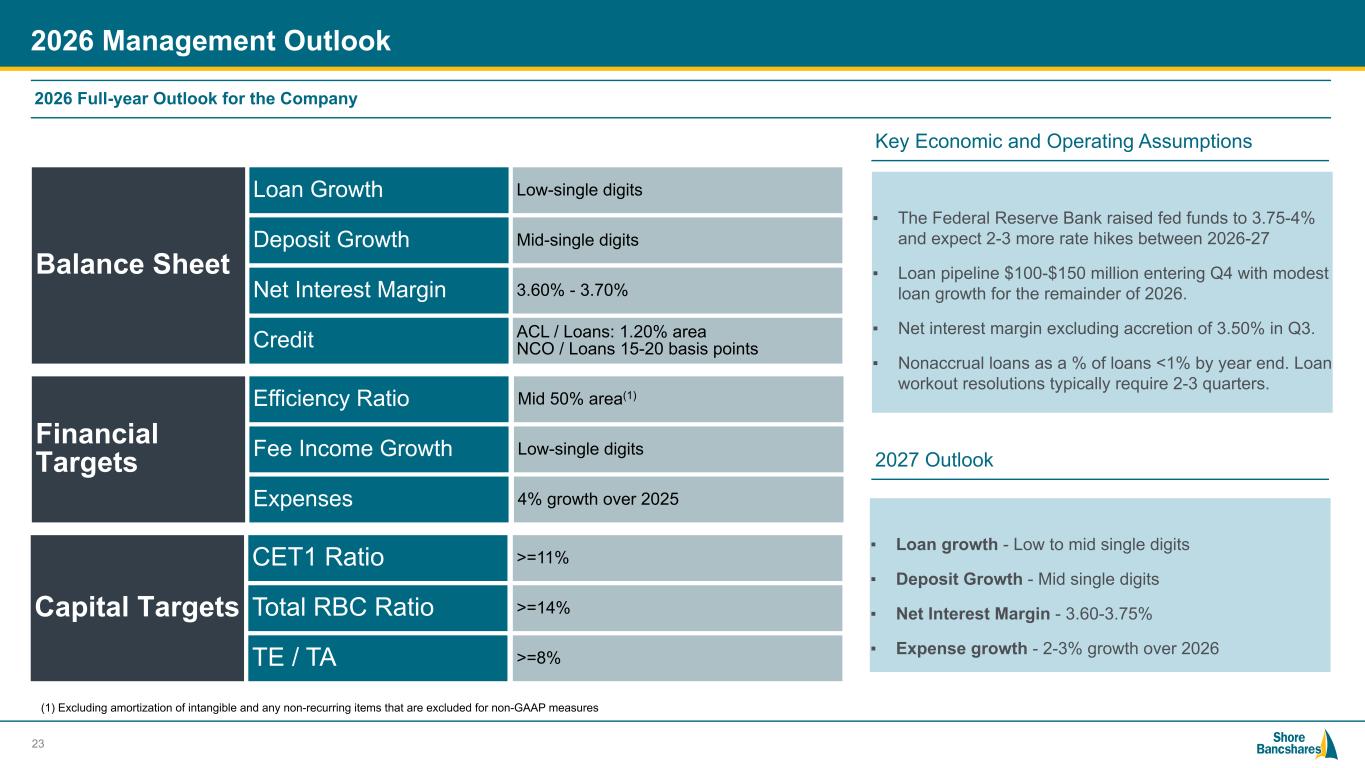
#006881 #ACC0C6 #83AFB4 #FEBE10 #5F574F #4D4F53 #C75B12 #5B8F22 #593160 2026 Management Outlook 23 Key Economic and Operating Assumptions ▪ The Federal Reserve Bank raised fed funds to 3.75-4% and expect 2-3 more rate hikes between 2026-27 ▪ Loan pipeline $100-$150 million entering Q4 with modest loan growth for the remainder of 2026. ▪ Net interest margin excluding accretion of 3.50% in Q3. ▪ Nonaccrual loans as a % of loans <1% by year end. Loan workout resolutions typically require 2-3 quarters. Balance Sheet Loan Growth Low-single digits Deposit Growth Mid-single digits Net Interest Margin 3.60% - 3.70% Credit ACL / Loans: 1.20% area NCO / Loans 15-20 basis points Financial Targets Efficiency Ratio Mid 50% area(1) Fee Income Growth Low-single digits Expenses 4% growth over 2025 Capital Targets CET1 Ratio >=11% Total RBC Ratio >=14% TE / TA >=8% 2026 Full-year Outlook for the Company (1) Excluding amortization of intangible and any non-recurring items that are excluded for non-GAAP measures ▪ Loan growth - Low to mid single digits ▪ Deposit Growth - Mid single digits ▪ Net Interest Margin - 3.60-3.75% ▪ Expense growth - 2-3% growth over 2026 2027 Outlook
Appendix
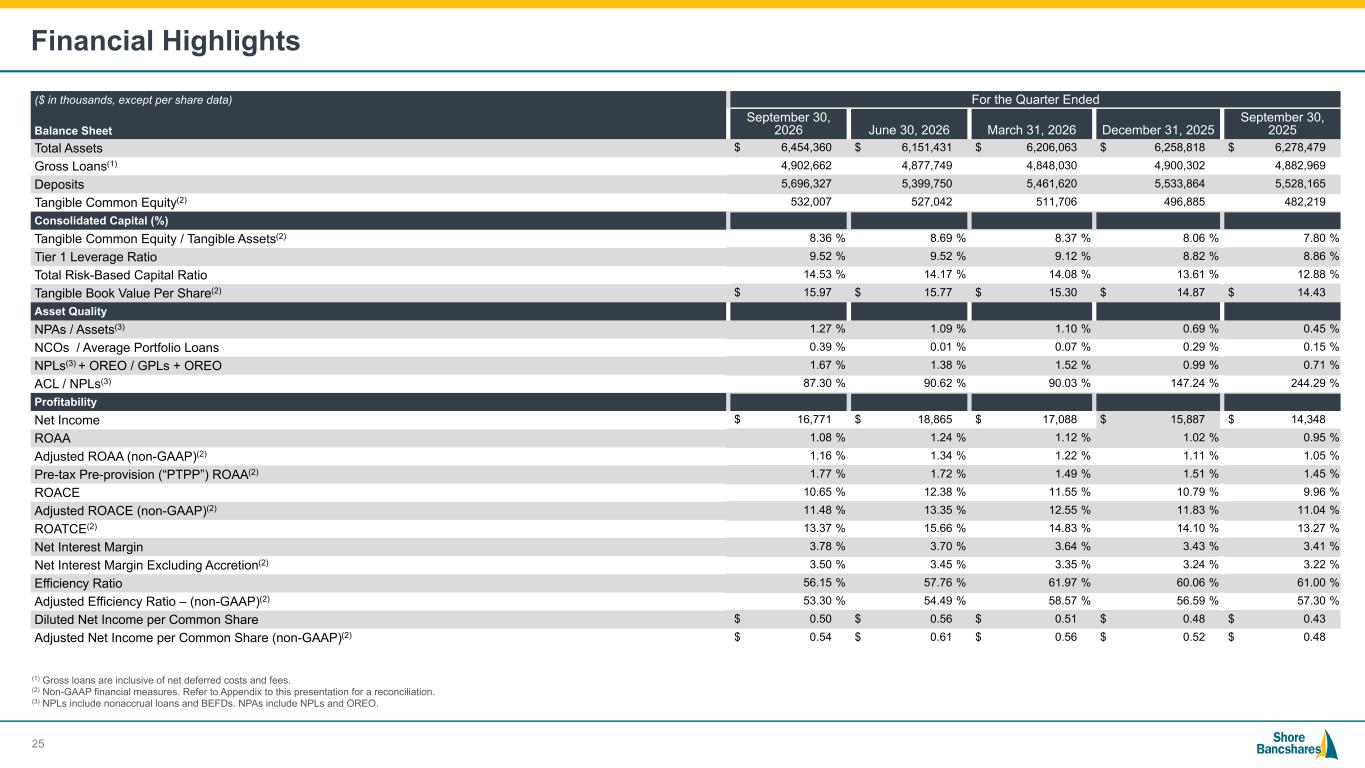
#006881 #ACC0C6 #83AFB4 #FEBE10 #5F574F #4D4F53 #C75B12 #5B8F22 #593160 Financial Highlights ($ in thousands, except per share data) For the Quarter Ended Balance Sheet September 30, 2026 June 30, 2026 March 31, 2026 December 31, 2025 September 30, 2025 Total Assets $ 6,454,360 $ 6,151,431 $ 6,206,063 $ 6,258,818 $ 6,278,479 Gross Loans(1) 4,902,662 4,877,749 4,848,030 4,900,302 4,882,969 Deposits 5,696,327 5,399,750 5,461,620 5,533,864 5,528,165 Tangible Common Equity(2) 532,007 527,042 511,706 496,885 482,219 Consolidated Capital (%) Tangible Common Equity / Tangible Assets(2) 8.36 % 8.69 % 8.37 % 8.06 % 7.80 % Tier 1 Leverage Ratio 9.52 % 9.52 % 9.12 % 8.82 % 8.86 % Total Risk-Based Capital Ratio 14.53 % 14.17 % 14.08 % 13.61 % 12.88 % Tangible Book Value Per Share(2) $ 15.97 $ 15.77 $ 15.30 $ 14.87 $ 14.43 Asset Quality NPAs / Assets(3) 1.27 % 1.09 % 1.10 % 0.69 % 0.45 % NCOs / Average Portfolio Loans 0.39 % 0.01 % 0.07 % 0.29 % 0.15 % NPLs(3) + OREO / GPLs + OREO 1.67 % 1.38 % 1.52 % 0.99 % 0.71 % ACL / NPLs(3) 87.30 % 90.62 % 90.03 % 147.24 % 244.29 % Profitability Net Income $ 16,771 $ 18,865 $ 17,088 $ 15,887 $ 14,348 ROAA 1.08 % 1.24 % 1.12 % 1.02 % 0.95 % Adjusted ROAA (non-GAAP)(2) 1.16 % 1.34 % 1.22 % 1.11 % 1.05 % Pre-tax Pre-provision (“PTPP”) ROAA(2) 1.77 % 1.72 % 1.49 % 1.51 % 1.45 % ROACE 10.65 % 12.38 % 11.55 % 10.79 % 9.96 % Adjusted ROACE (non-GAAP)(2) 11.48 % 13.35 % 12.55 % 11.83 % 11.04 % ROATCE(2) 13.37 % 15.66 % 14.83 % 14.10 % 13.27 % Net Interest Margin 3.78 % 3.70 % 3.64 % 3.43 % 3.41 % Net Interest Margin Excluding Accretion(2) 3.50 % 3.45 % 3.35 % 3.24 % 3.22 % Efficiency Ratio 56.15 % 57.76 % 61.97 % 60.06 % 61.00 % Adjusted Efficiency Ratio – (non-GAAP)(2) 53.30 % 54.49 % 58.57 % 56.59 % 57.30 % Diluted Net Income per Common Share $ 0.50 $ 0.56 $ 0.51 $ 0.48 $ 0.43 Adjusted Net Income per Common Share (non-GAAP)(2) $ 0.54 $ 0.61 $ 0.56 $ 0.52 $ 0.48 (1) Gross loans are inclusive of net deferred costs and fees. (2) Non-GAAP financial measures. Refer to Appendix to this presentation for a reconciliation. (3) NPLs include nonaccrual loans and BEFDs. NPAs include NPLs and OREO. 25
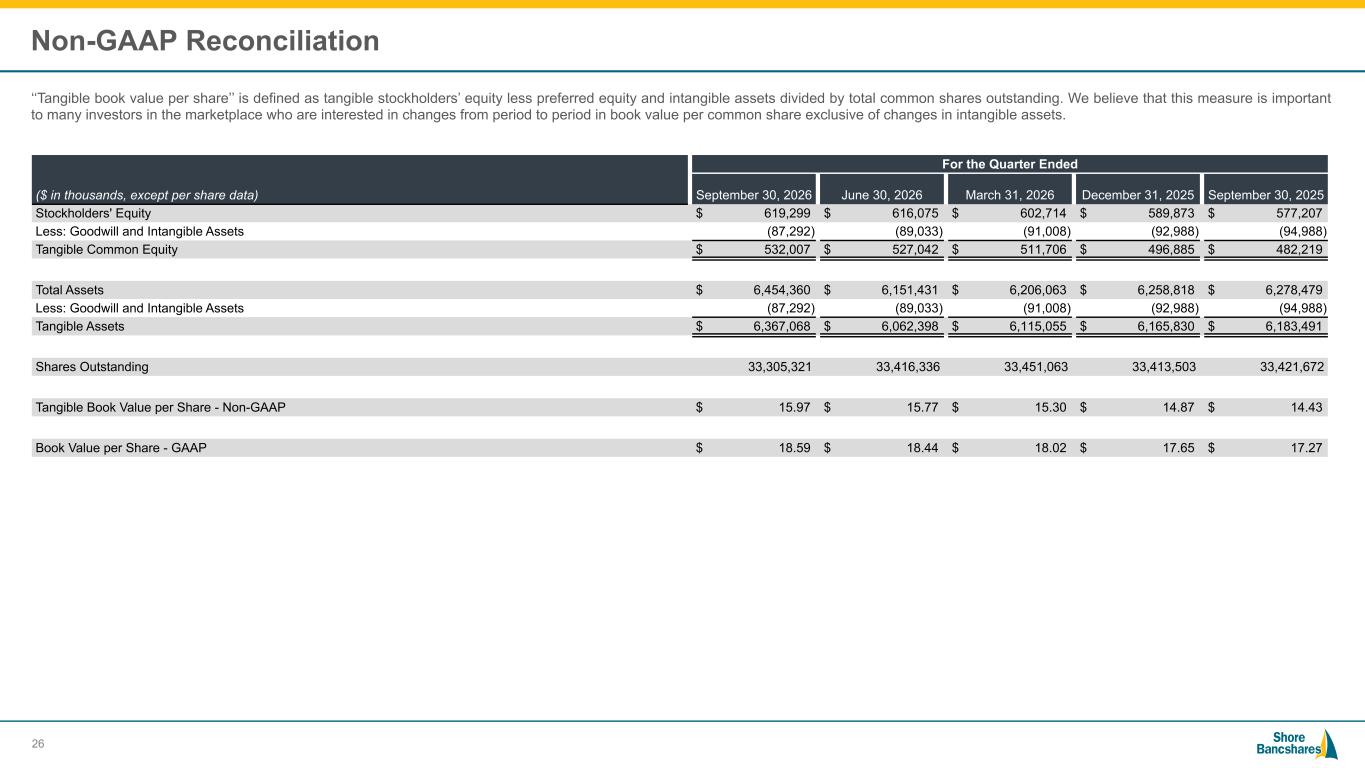
#006881 #ACC0C6 #83AFB4 #FEBE10 #5F574F #4D4F53 #C75B12 #5B8F22 #593160 Non-GAAP Reconciliation ‘‘Tangible book value per share’’ is defined as tangible stockholders’ equity less preferred equity and intangible assets divided by total common shares outstanding. We believe that this measure is important to many investors in the marketplace who are interested in changes from period to period in book value per common share exclusive of changes in intangible assets. ($ in thousands, except per share data) For the Quarter Ended September 30, 2026 June 30, 2026 March 31, 2026 December 31, 2025 September 30, 2025 Stockholders' Equity $ 619,299 $ 616,075 $ 602,714 $ 589,873 $ 577,207 Less: Goodwill and Intangible Assets (87,292) (89,033) (91,008) (92,988) (94,988) Tangible Common Equity $ 532,007 $ 527,042 $ 511,706 $ 496,885 $ 482,219 Total Assets $ 6,454,360 $ 6,151,431 $ 6,206,063 $ 6,258,818 $ 6,278,479 Less: Goodwill and Intangible Assets (87,292) (89,033) (91,008) (92,988) (94,988) Tangible Assets $ 6,367,068 $ 6,062,398 $ 6,115,055 $ 6,165,830 $ 6,183,491 Shares Outstanding 33,305,321 33,416,336 33,451,063 33,413,503 33,421,672 Tangible Book Value per Share - Non-GAAP $ 15.97 $ 15.77 $ 15.30 $ 14.87 $ 14.43 Book Value per Share - GAAP $ 18.59 $ 18.44 $ 18.02 $ 17.65 $ 17.27 26
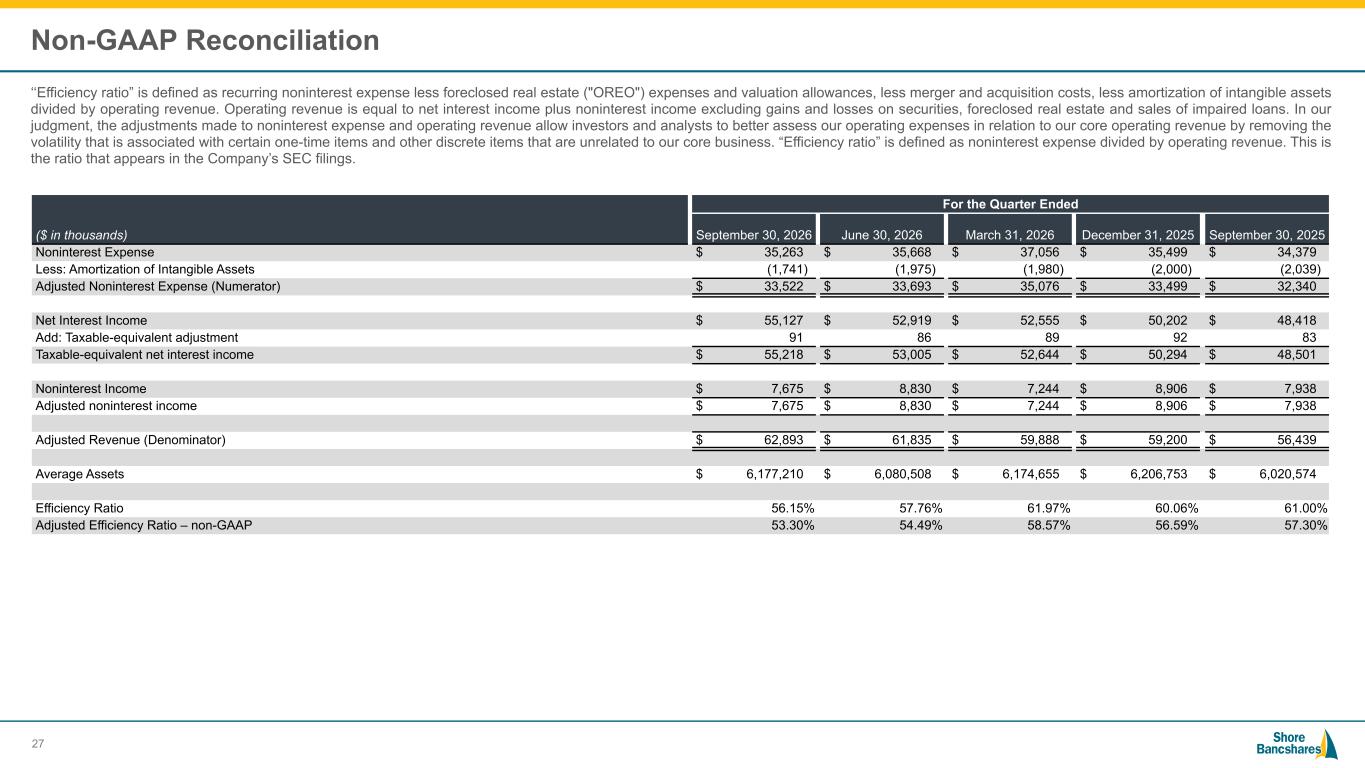
#006881 #ACC0C6 #83AFB4 #FEBE10 #5F574F #4D4F53 #C75B12 #5B8F22 #593160 Non-GAAP Reconciliation ‘‘Efficiency ratio” is defined as recurring noninterest expense less foreclosed real estate ("OREO") expenses and valuation allowances, less merger and acquisition costs, less amortization of intangible assets divided by operating revenue. Operating revenue is equal to net interest income plus noninterest income excluding gains and losses on securities, foreclosed real estate and sales of impaired loans. In our judgment, the adjustments made to noninterest expense and operating revenue allow investors and analysts to better assess our operating expenses in relation to our core operating revenue by removing the volatility that is associated with certain one-time items and other discrete items that are unrelated to our core business. “Efficiency ratio” is defined as noninterest expense divided by operating revenue. This is the ratio that appears in the Company’s SEC filings. ($ in thousands) For the Quarter Ended September 30, 2026 June 30, 2026 March 31, 2026 December 31, 2025 September 30, 2025 Noninterest Expense $ 35,263 $ 35,668 $ 37,056 $ 35,499 $ 34,379 Less: Amortization of Intangible Assets (1,741) (1,975) (1,980) (2,000) (2,039) Adjusted Noninterest Expense (Numerator) $ 33,522 $ 33,693 $ 35,076 $ 33,499 $ 32,340 Net Interest Income $ 55,127 $ 52,919 $ 52,555 $ 50,202 $ 48,418 Add: Taxable-equivalent adjustment 91 86 89 92 83 Taxable-equivalent net interest income $ 55,218 $ 53,005 $ 52,644 $ 50,294 $ 48,501 Noninterest Income $ 7,675 $ 8,830 $ 7,244 $ 8,906 $ 7,938 Adjusted noninterest income $ 7,675 $ 8,830 $ 7,244 $ 8,906 $ 7,938 Adjusted Revenue (Denominator) $ 62,893 $ 61,835 $ 59,888 $ 59,200 $ 56,439 Average Assets $ 6,177,210 $ 6,080,508 $ 6,174,655 $ 6,206,753 $ 6,020,574 Efficiency Ratio 56.15 % 57.76 % 61.97 % 60.06 % 61.00 % Adjusted Efficiency Ratio – non-GAAP 53.30 % 54.49 % 58.57 % 56.59 % 57.30 % 27
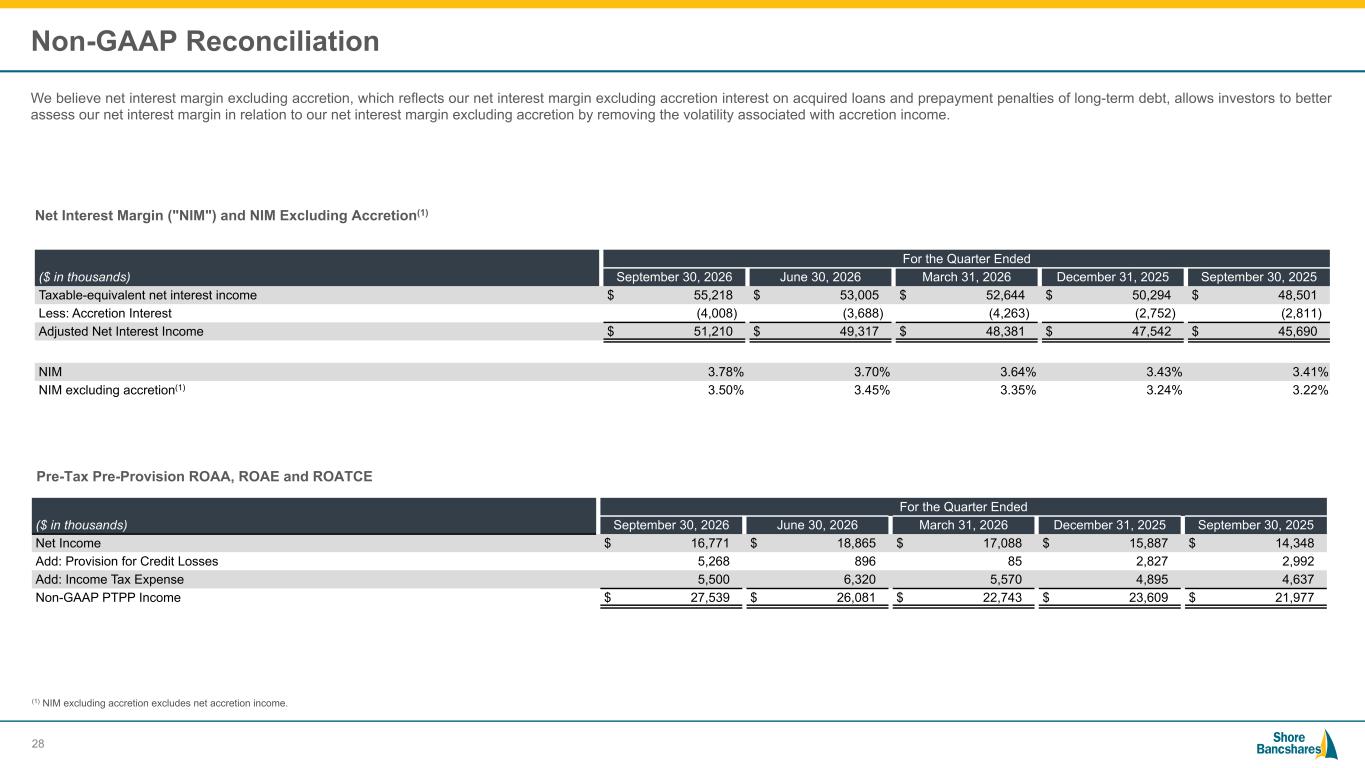
#006881 #ACC0C6 #83AFB4 #FEBE10 #5F574F #4D4F53 #C75B12 #5B8F22 #593160 Non-GAAP Reconciliation We believe net interest margin excluding accretion, which reflects our net interest margin excluding accretion interest on acquired loans and prepayment penalties of long-term debt, allows investors to better assess our net interest margin in relation to our net interest margin excluding accretion by removing the volatility associated with accretion income. Net Interest Margin ("NIM") and NIM Excluding Accretion(1) ($ in thousands) For the Quarter Ended September 30, 2026 June 30, 2026 March 31, 2026 December 31, 2025 September 30, 2025 Taxable-equivalent net interest income $ 55,218 $ 53,005 $ 52,644 $ 50,294 $ 48,501 Less: Accretion Interest (4,008) (3,688) (4,263) (2,752) (2,811) Adjusted Net Interest Income $ 51,210 $ 49,317 $ 48,381 $ 47,542 $ 45,690 NIM 3.78 % 3.70 % 3.64 % 3.43 % 3.41 % NIM excluding accretion(1) 3.50 % 3.45 % 3.35 % 3.24 % 3.22 % (1) NIM excluding accretion excludes net accretion income. 28 Pre-Tax Pre-Provision ROAA, ROAE and ROATCE ($ in thousands) For the Quarter Ended September 30, 2026 June 30, 2026 March 31, 2026 December 31, 2025 September 30, 2025 Net Income $ 16,771 $ 18,865 $ 17,088 $ 15,887 $ 14,348 Add: Provision for Credit Losses 5,268 896 85 2,827 2,992 Add: Income Tax Expense 5,500 6,320 5,570 4,895 4,637 Non-GAAP PTPP Income $ 27,539 $ 26,081 $ 22,743 $ 23,609 $ 21,977
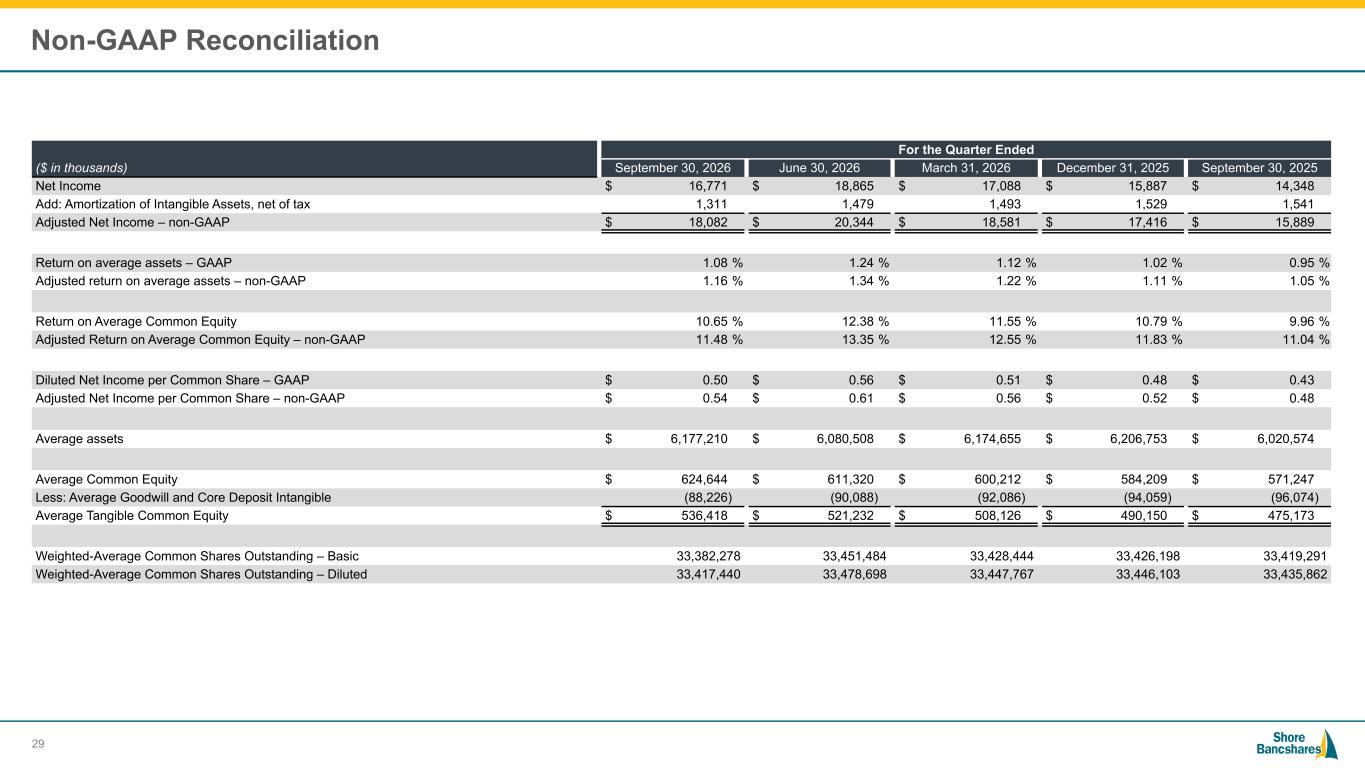
#006881 #ACC0C6 #83AFB4 #FEBE10 #5F574F #4D4F53 #C75B12 #5B8F22 #593160 Non-GAAP Reconciliation ($ in thousands) For the Quarter Ended September 30, 2026 June 30, 2026 March 31, 2026 December 31, 2025 September 30, 2025 Net Income $ 16,771 $ 18,865 $ 17,088 $ 15,887 $ 14,348 Add: Amortization of Intangible Assets, net of tax 1,311 1,479 1,493 1,529 1,541 Adjusted Net Income – non-GAAP $ 18,082 $ 20,344 $ 18,581 $ 17,416 $ 15,889 Return on average assets – GAAP 1.08 % 1.24 % 1.12 % 1.02 % 0.95 % Adjusted return on average assets – non-GAAP 1.16 % 1.34 % 1.22 % 1.11 % 1.05 % Return on Average Common Equity 10.65 % 12.38 % 11.55 % 10.79 % 9.96 % Adjusted Return on Average Common Equity – non-GAAP 11.48 % 13.35 % 12.55 % 11.83 % 11.04 % Diluted Net Income per Common Share – GAAP $ 0.50 $ 0.56 $ 0.51 $ 0.48 $ 0.43 Adjusted Net Income per Common Share – non-GAAP $ 0.54 $ 0.61 $ 0.56 $ 0.52 $ 0.48 Average assets $ 6,177,210 $ 6,080,508 $ 6,174,655 $ 6,206,753 $ 6,020,574 Average Common Equity $ 624,644 $ 611,320 $ 600,212 $ 584,209 $ 571,247 Less: Average Goodwill and Core Deposit Intangible (88,226) (90,088) (92,086) (94,059) (96,074) Average Tangible Common Equity $ 536,418 $ 521,232 $ 508,126 $ 490,150 $ 475,173 Weighted-Average Common Shares Outstanding – Basic 33,382,278 33,451,484 33,428,444 33,426,198 33,419,291 Weighted-Average Common Shares Outstanding – Diluted 33,417,440 33,478,698 33,447,767 33,446,103 33,435,862 29
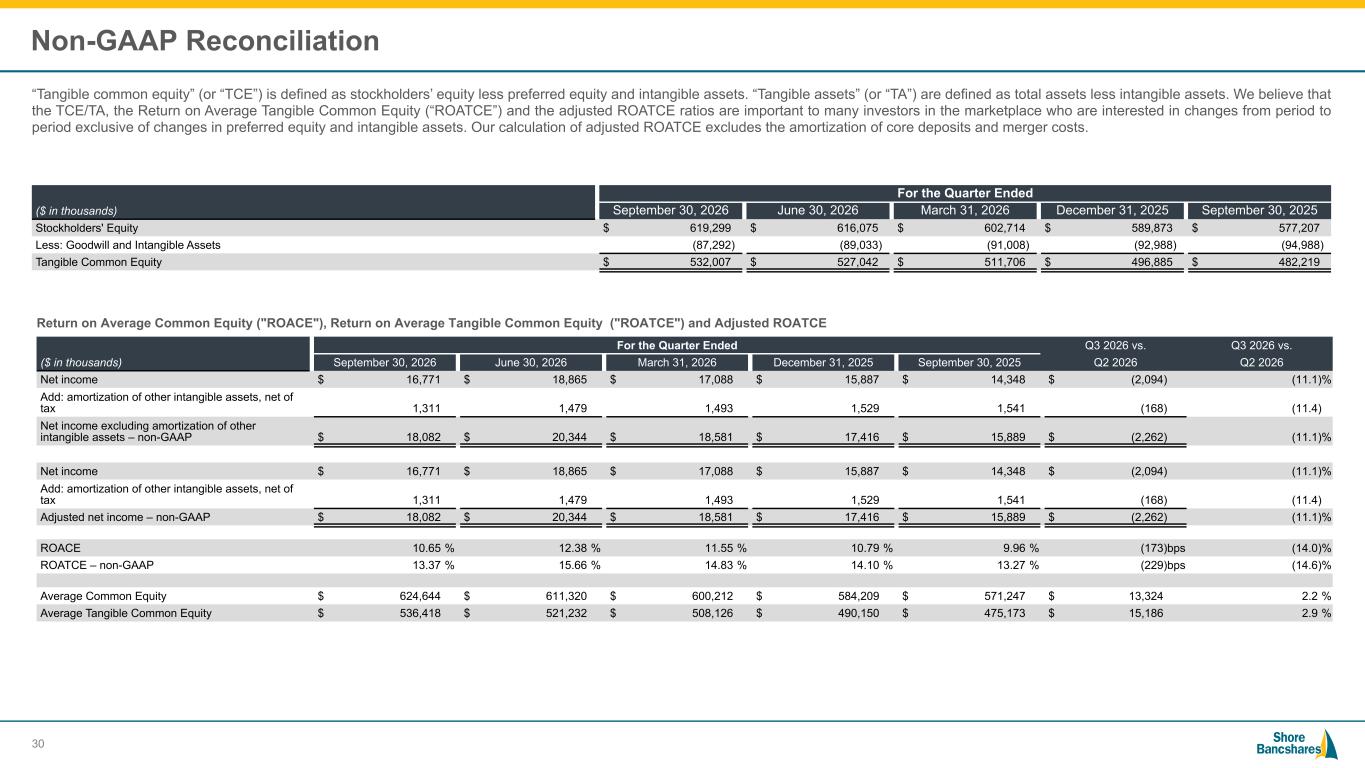
#006881 #ACC0C6 #83AFB4 #FEBE10 #5F574F #4D4F53 #C75B12 #5B8F22 #593160 Non-GAAP Reconciliation “Tangible common equity” (or “TCE”) is defined as stockholders’ equity less preferred equity and intangible assets. “Tangible assets” (or “TA”) are defined as total assets less intangible assets. We believe that the TCE/TA, the Return on Average Tangible Common Equity (“ROATCE”) and the adjusted ROATCE ratios are important to many investors in the marketplace who are interested in changes from period to period exclusive of changes in preferred equity and intangible assets. Our calculation of adjusted ROATCE excludes the amortization of core deposits and merger costs. Return on Average Common Equity ("ROACE"), Return on Average Tangible Common Equity ("ROATCE") and Adjusted ROATCE ($ in thousands) For the Quarter Ended September 30, 2026 June 30, 2026 March 31, 2026 December 31, 2025 September 30, 2025 Stockholders' Equity $ 619,299 $ 616,075 $ 602,714 $ 589,873 $ 577,207 Less: Goodwill and Intangible Assets (87,292) (89,033) (91,008) (92,988) (94,988) Tangible Common Equity $ 532,007 $ 527,042 $ 511,706 $ 496,885 $ 482,219 ($ in thousands) For the Quarter Ended Q3 2026 vs. Q3 2026 vs. September 30, 2026 June 30, 2026 March 31, 2026 December 31, 2025 September 30, 2025 Q2 2026 Q2 2026 Net income $ 16,771 $ 18,865 $ 17,088 $ 15,887 $ 14,348 $ (2,094) (11.1) % Add: amortization of other intangible assets, net of tax 1,311 1,479 1,493 1,529 1,541 (168) (11.4) Net income excluding amortization of other intangible assets – non-GAAP $ 18,082 $ 20,344 $ 18,581 $ 17,416 $ 15,889 $ (2,262) (11.1) % Net income $ 16,771 $ 18,865 $ 17,088 $ 15,887 $ 14,348 $ (2,094) (11.1) % Add: amortization of other intangible assets, net of tax 1,311 1,479 1,493 1,529 1,541 (168) (11.4) Adjusted net income – non-GAAP $ 18,082 $ 20,344 $ 18,581 $ 17,416 $ 15,889 $ (2,262) (11.1) % ROACE 10.65 % 12.38 % 11.55 % 10.79 % 9.96 % (173) bps (14.0) % ROATCE – non-GAAP 13.37 % 15.66 % 14.83 % 14.10 % 13.27 % (229) bps (14.6) % Average Common Equity $ 624,644 $ 611,320 $ 600,212 $ 584,209 $ 571,247 $ 13,324 2.2 % Average Tangible Common Equity $ 536,418 $ 521,232 $ 508,126 $ 490,150 $ 475,173 $ 15,186 2.9 % 30

#006881 #ACC0C6 #83AFB4 #FEBE10 #5F574F #4D4F53 #C75B12 #5B8F22 #593160 NASDAQ: SHBI © 2026 Shore Bancshares, Inc.