Pay vs Performance Disclosure
Aug. 29, 2026
USD ($)
$ / shares
Aug. 30, 2025
USD ($)
$ / shares
Aug. 31, 2024
USD ($)
$ / shares
Aug. 26, 2023
USD ($)
$ / shares
Aug. 27, 2022
USD ($)
$ / shares
Pay Versus Performance Disclosure
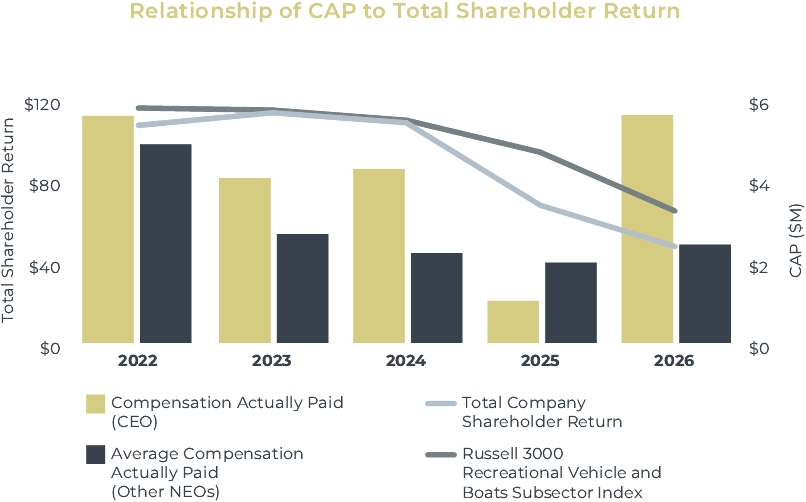
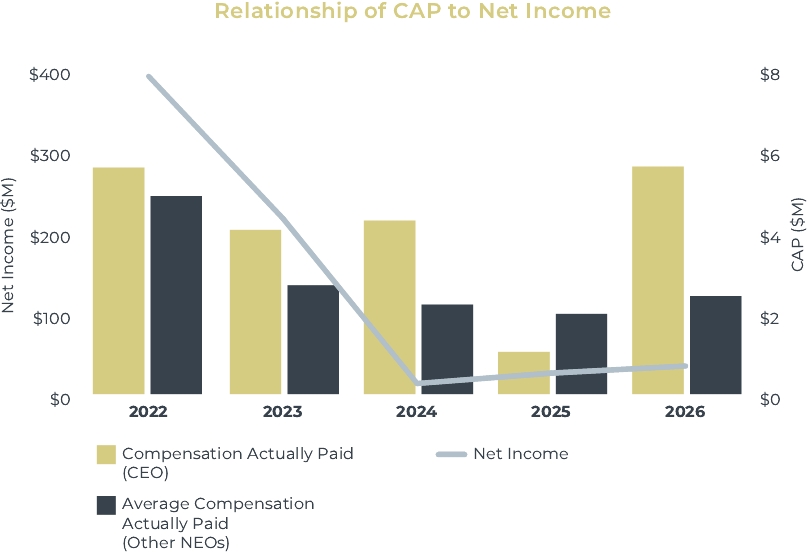
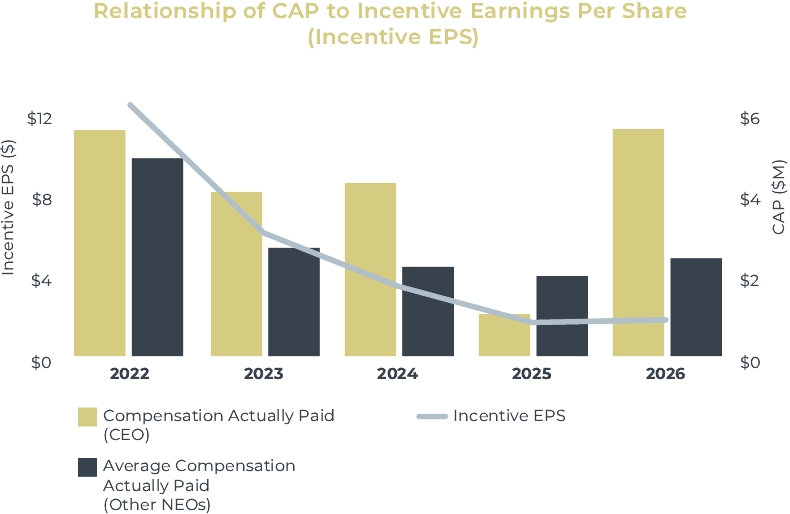
As required by Section 953(a) of the Dodd-Frank Wall Street Reform and Consumer Protection Act and Item 402(v) of Regulation S-K, we are providing the following information about the relationship between executive compensation actually paid and certain financial performance of our Company, illustrating pay versus performance (“PVP”).
Year | Summary Compensation Table Total for CEO(1) ($) | Compensation Actually Paid to CEO ($) | Average Summary Compensation Total for Non-CEO NEOs(1) ($) | Average Compensation Actually Paid to Non-CEO NEOs ($) | Value of Initial Fixed $100 Investment Based on: | Net Income ($ in millions) | Incentive EPS ($)(4) | |||||||||||||||||||
Total Shareholder Return(2) ($) | Russell 3000 Recreational Vehicle and Boats Subsector Index Total Shareholder Return(2)(3) ($) | |||||||||||||||||||||||||
2026 | 8,661,661 | 5,598,320 | 2,641,387 | 2,417,810 | 47.4 | 64.8 | 34.5 | 1.79 | ||||||||||||||||||
2025 | 8,999,898 | 1,035,199 | 2,972,997 | 1,975,298 | 67.5 | 93.5 | 25.7 | 1.66 | ||||||||||||||||||
2024 | 7,217,231 | 4,265,209 | 2,846,983 | 2,206,716 | 108.0 | 109.2 | 13.0 | 3.45 | ||||||||||||||||||
2023 | 6,677,728 | 4,040,446 | 2,946,821 | 2,675,476 | 112.9 | 114.2 | 215.9 | 6.07 | ||||||||||||||||||
2022 | 6,676,569 | 5,569,618 | 4,824,469 | 4,871,036 | 106.7 | 115.2 | 390.6 | 12.39 | ||||||||||||||||||
(1) | The CEO reflected above is Mr. Happe. The non-CEO NEOs reflect the following individuals in each year: |
2026: Messrs. Clark, Hughes and Tubman, and Ms. Bogart
2025: Messrs. Clark, Hughes and Tubman, and Ms. Bogart
2024: Messrs. Bower, Clark, Hughes and Tubman
2023: Ms. Bogart and Messrs. Bower, Clark and Hughes
2022: Ms. Bogart and Messrs. Bower, Clark and Hughes
(2) | Company and peer group Total Shareholder Return (“TSR”) for each year reflects what the cumulative value of a $100 investment would be, including reinvestment of dividends, if such an amount were invested on August 27, 2021, the last trading day of Fiscal 2021. |
(3) | Peer group TSR is calculated using the Russell 3000 Recreational Vehicles and Boats Subsector Index. |
(4) | Our company-selected measure, which is the measure we believe represents the most important financial performance metric used to link compensation paid to our NEOs in Fiscal 2026 to our performance is Incentive EPS. This is a non-GAAP measure, which is defined above under “Compensation Discussion and Analysis – Fiscal 2026 Equity Awards.” |
Compensation Actually Paid (“CAP”) illustrated in the table above is calculated by making the following adjustments from the Summary Compensation Table (“SCT”) totals as follows:
Item and Value Added (Deducted)
For CEO: | 2026 ($) | ||||
- SCT “Stock Awards” column value | 5,185,003 | ||||
- SCT “Option Awards” column value | 914,997 | ||||
+ Fiscal 2026 year end fair value of awards granted in Fiscal 2026 that are outstanding and unvested at the end of Fiscal 2026 | 5,006,474 | ||||
+/- difference between the fair value of awards from the end of Fiscal 2025 to the end of Fiscal 2026 for awards granted in any fiscal year prior to Fiscal 2026 that are outstanding and unvested at the end of Fiscal 2026 | (1,632,185) | ||||
+/- change in fair value from the end of Fiscal 2025 to the vesting date for awards granted in any fiscal year prior to Fiscal 2026 which vested during Fiscal 2026 | (337,630) | ||||
For Other Named Executive Officers (Average) | 2026 ($) | ||||
- SCT “Stock Awards” column value | 662,025 | ||||
- SCT “Option Awards” column value | 116,827 | ||||
+ Fiscal 2026 year end fair value of awards granted in Fiscal 2026 that are outstanding and unvested at the end of Fiscal 2026 | 852,306 | ||||
+/- difference between the fair value of awards from the end of Fiscal 2025 to the end of Fiscal 2026 for awards granted in any fiscal year prior to Fiscal 2026 that are outstanding and unvested at the end of Fiscal 2026 | (246,167) | ||||
+/- change in fair value from the end of Fiscal 2025 to the vesting date for awards granted in any fiscal year prior to Fiscal 2026 which vested during Fiscal 2026 | (50,864) | ||||
None of our NEOs participate in a pension plan; therefore, no adjustment from the SCT total related to pension value was made.
(1) | The CEO reflected above is Mr. Happe. The non-CEO NEOs reflect the following individuals in each year: |
2026: Messrs. Clark, Hughes and Tubman, and Ms. Bogart
2025: Messrs. Clark, Hughes and Tubman, and Ms. Bogart
2024: Messrs. Bower, Clark, Hughes and Tubman
2023: Ms. Bogart and Messrs. Bower, Clark and Hughes
2022: Ms. Bogart and Messrs. Bower, Clark and Hughes
(3) | Peer group TSR is calculated using the Russell 3000 Recreational Vehicles and Boats Subsector Index. |
Compensation Actually Paid (“CAP”) illustrated in the table above is calculated by making the following adjustments from the Summary Compensation Table (“SCT”) totals as follows:
Item and Value Added (Deducted)
For CEO: | 2026 ($) | ||||
- SCT “Stock Awards” column value | 5,185,003 | ||||
- SCT “Option Awards” column value | 914,997 | ||||
+ Fiscal 2026 year end fair value of awards granted in Fiscal 2026 that are outstanding and unvested at the end of Fiscal 2026 | 5,006,474 | ||||
+/- difference between the fair value of awards from the end of Fiscal 2025 to the end of Fiscal 2026 for awards granted in any fiscal year prior to Fiscal 2026 that are outstanding and unvested at the end of Fiscal 2026 | (1,632,185) | ||||
+/- change in fair value from the end of Fiscal 2025 to the vesting date for awards granted in any fiscal year prior to Fiscal 2026 which vested during Fiscal 2026 | (337,630) | ||||
None of our NEOs participate in a pension plan; therefore, no adjustment from the SCT total related to pension value was made.
Compensation Actually Paid (“CAP”) illustrated in the table above is calculated by making the following adjustments from the Summary Compensation Table (“SCT”) totals as follows:
Item and Value Added (Deducted)
For Other Named Executive Officers (Average) | 2026 ($) | ||||
- SCT “Stock Awards” column value | 662,025 | ||||
- SCT “Option Awards” column value | 116,827 | ||||
+ Fiscal 2026 year end fair value of awards granted in Fiscal 2026 that are outstanding and unvested at the end of Fiscal 2026 | 852,306 | ||||
+/- difference between the fair value of awards from the end of Fiscal 2025 to the end of Fiscal 2026 for awards granted in any fiscal year prior to Fiscal 2026 that are outstanding and unvested at the end of Fiscal 2026 | (246,167) | ||||
+/- change in fair value from the end of Fiscal 2025 to the vesting date for awards granted in any fiscal year prior to Fiscal 2026 which vested during Fiscal 2026 | (50,864) | ||||
None of our NEOs participate in a pension plan; therefore, no adjustment from the SCT total related to pension value was made.
The following table lists the five financial performance measures that we believe represent the most important financial performance measures we used to link compensation actually paid to our NEOs to our performance.
Most Important Performance Measures
Incentive EPS(1) | |||||
Net Revenue | |||||
Operating Income | |||||
Net Working Capital | |||||
Incentive ROIC(1) | |||||
(1) | Denotes non-GAAP financial measure described above under “Compensation Discussion and Analysis – Fiscal 2026 Equity Awards – LTIP / Performance Share Units.” |
(4) | Our company-selected measure, which is the measure we believe represents the most important financial performance metric used to link compensation paid to our NEOs in Fiscal 2026 to our performance is Incentive EPS. This is a non-GAAP measure, which is defined above under “Compensation Discussion and Analysis – Fiscal 2026 Equity Awards.” |