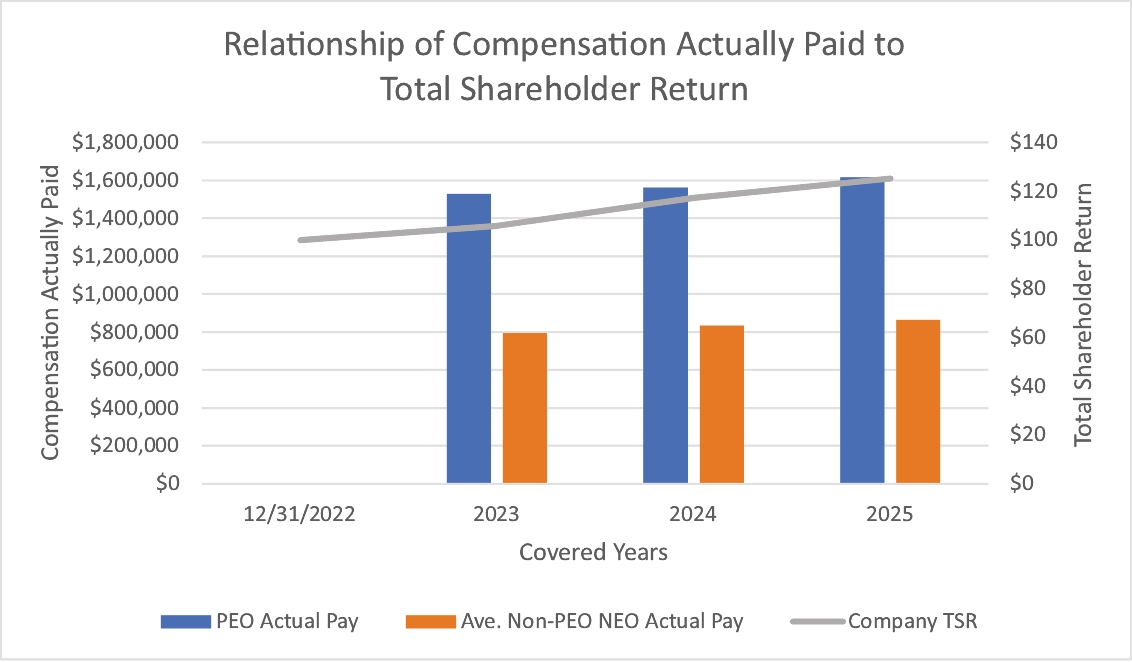
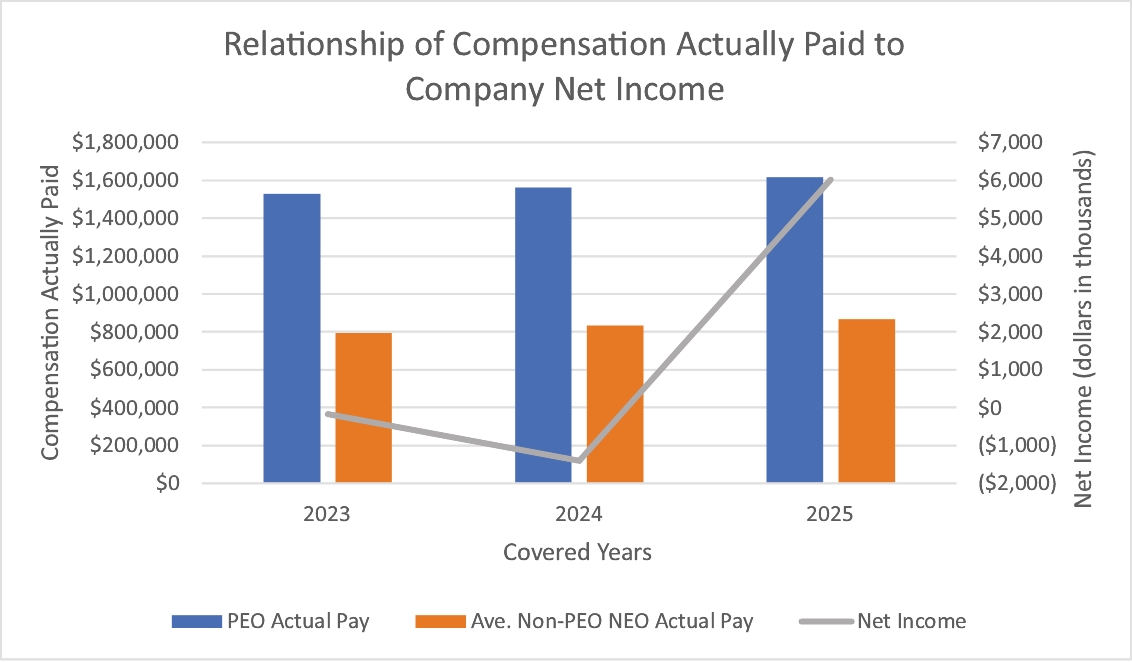
Pay vs Performance Disclosure - USD ($)
Dec. 31, 2025
Dec. 31, 2024
Dec. 31, 2023
Pay Versus Performance Disclosure
Pay Versus Performance(1) | ||||||||||||||||||
Year (a) | Summary Compensation Table (“SCT”) Total for PEO (b) | Compensation Actually Paid to PEO (c)(2) | Average Summary Compensation Table Total for Non-PEO Named Executive Officers (d) | Average Compensation Actually Paid to Non-PEO Named Executive Officers (e)(2) | Value of Initial Fixed $100 Investment Based On: | Net Income (loss) (in thousands) (g)(4) | ||||||||||||
Total Shareholder Return (f)(3) | ||||||||||||||||||
2025 | $1,615,566 | $1,615,566 | $864,890 | $864,890 | $125.15 | $6,017 | ||||||||||||
2024 | $1,559,908 | $1,559,908 | $832,765 | $832,765 | $117.22 | $(1,393) | ||||||||||||
2023 | $1,529,391 | $1,529,391 | $794,296 | $794,296 | $105.80 | $(171) | ||||||||||||
(1) | Hilton H. Howell, Jr. was our principal executive officer (“PEO”) for the full year for each of 2025, 2024 and 2023. For each of 2025, 2024 and 2023, our only non-PEO named executive officer was J. Ross Franklin. Throughout this Pay Versus Performance Disclosure, we refer to certain “average” amounts for the non-PEO named executive officers, in accordance with SEC rules. However, in each such instance, the amounts disclosed are solely with respect to Mr. Franklin. |
(2) | For each of 2025, 2024 and 2023 (each, a “Covered Year”), in determining both the compensation actually paid (“CAP”) to our PEO and the average CAP to our non-PEO named executive officers for purposes of this Pay Versus Performance table (“PVP Table”), we deducted from or added back to the total amounts of compensation reported in column (b) or column (d) for such Covered Year certain amounts to the extent required by SEC rules. As illustrated in the table below, no such adjustments were required for 2025, because neither of the applicable NEOs received or held equity compensation awards at any time during such year: |
Item and Value Added (Deducted) | 2025 | ||
For Mr. Howell: | |||
- SCT “Stock Awards” column value | — | ||
- SCT “Option Awards” column value | — | ||
+ year-end fair value of outstanding equity awards granted in Covered Year | — | ||
+/- change in fair value (from prior year-end to covered year-end) of outstanding equity awards granted in prior years | — | ||
+ vesting date fair value of equity awards granted and vested in Covered Year | — | ||
+/- change in fair value (from prior year-end to vesting date) of prior-year equity awards vested in Covered Year | — | ||
- prior year-end fair value of prior-year equity awards forfeited in Covered Year | — | ||
+ includable dividends/earnings on equity awards during Covered Year | — | ||
For Non-PEO Named Executive Officers (Average): | |||
- SCT “Stock Awards” column value | — | ||
- SCT “Option Awards” column value | — | ||
+ year-end fair value of outstanding equity awards granted in Covered Year | — | ||
+/- change in fair value (from prior year-end to covered year-end) of outstanding equity awards granted in prior years | — | ||
+ vesting date fair value of equity awards granted and vested in Covered Year | — | ||
+/- change in fair value (from prior year-end to vesting date) of prior-year equity awards vested in Covered Year | — | ||
- prior year-end fair value of prior-year equity awards forfeited in Covered Year | — | ||
+ includable dividends/earnings on equity awards during Covered Year | — | ||
(3) | For each Covered Year, our total shareholder return was calculated as the yearly percentage change in our cumulative total shareholder return on our common stock, par value $1.00 per share, measured as the quotient of (a) the sum of (i) the cumulative amount of dividends for a period beginning with our closing price on the Nasdaq Global Market on December 31, 2022 through and including the last day of the fiscal year covered (each one-year, two-year and three-year period, the “Measurement Period”), assuming dividend reinvestment, plus (ii) the difference between our closing stock price at the end versus the beginning of the Measurement Period, divided by (b) our closing share price at the beginning of the Measurement Period. Each of these yearly percentage changes was then applied to a deemed fixed investment of $100 at the beginning of the Measurement Period to produce the Covered Year-end values of such investment as of the end of 2025, 2024, and 2023, as applicable. Because Covered Years are presented in the table in reverse chronological order (from top to bottom), the table should be read from bottom to top for purposes of understanding cumulative returns over time. |
(4) | Net income is calculated in accordance with United States Generally Accepted Accounting Principles. The amount reported in this column for fiscal year 2024 has been updated from prior Pay Versus Performance disclosure to reflect the accounting restatement described above under “Recovery Analysis Under Clawback Policy.” |
(1) | Hilton H. Howell, Jr. was our principal executive officer (“PEO”) for the full year for each of 2025, 2024 and 2023. For each of 2025, 2024 and 2023, our only non-PEO named executive officer was J. Ross Franklin. Throughout this Pay Versus Performance Disclosure, we refer to certain “average” amounts for the non-PEO named executive officers, in accordance with SEC rules. However, in each such instance, the amounts disclosed are solely with respect to Mr. Franklin. |
(2) | For each of 2025, 2024 and 2023 (each, a “Covered Year”), in determining both the compensation actually paid (“CAP”) to our PEO and the average CAP to our non-PEO named executive officers for purposes of this Pay Versus Performance table (“PVP Table”), we deducted from or added back to the total amounts of compensation reported in column (b) or column (d) for such Covered Year certain amounts to the extent required by SEC rules. As illustrated in the table below, no such adjustments were required for 2025, because neither of the applicable NEOs received or held equity compensation awards at any time during such year: |
Item and Value Added (Deducted) | 2025 | ||
For Mr. Howell: | |||
- SCT “Stock Awards” column value | — | ||
- SCT “Option Awards” column value | — | ||
+ year-end fair value of outstanding equity awards granted in Covered Year | — | ||
+/- change in fair value (from prior year-end to covered year-end) of outstanding equity awards granted in prior years | — | ||
+ vesting date fair value of equity awards granted and vested in Covered Year | — | ||
+/- change in fair value (from prior year-end to vesting date) of prior-year equity awards vested in Covered Year | — | ||
- prior year-end fair value of prior-year equity awards forfeited in Covered Year | — | ||
+ includable dividends/earnings on equity awards during Covered Year | — | ||
For Non-PEO Named Executive Officers (Average): | |||
- SCT “Stock Awards” column value | — | ||
- SCT “Option Awards” column value | — | ||
+ year-end fair value of outstanding equity awards granted in Covered Year | — | ||
+/- change in fair value (from prior year-end to covered year-end) of outstanding equity awards granted in prior years | — | ||
+ vesting date fair value of equity awards granted and vested in Covered Year | — | ||
+/- change in fair value (from prior year-end to vesting date) of prior-year equity awards vested in Covered Year | — | ||
- prior year-end fair value of prior-year equity awards forfeited in Covered Year | — | ||
+ includable dividends/earnings on equity awards during Covered Year | — | ||