First Citizens BancShares, Inc. Third Quarter 2026 Earnings Conference Call October 23, 2026
2 Table of Contents Pages Section I – Third Quarter Overview & Strategic Priorities 4 – 7 Section II – Third Quarter 2026 Financial Results 8 – 27 Financial Highlights 9 – 10 Earnings Highlights 11 Net interest income and margin 12 – 13 Noninterest income and expense 14 – 15 Balance Sheet Highlights 16 Loans and Leases 17 – 18 Deposits 19 – 20 Commercial Bank Funding Trends 21 Funding Mix 22 FDIC Purchase Money Note Principal Balance Prepayment 23 Credit Quality Trends and Allowance 24 – 25 Capital & Share Repurchase Plan Update 26 – 27 Section III – Financial Outlook 28 – 29 Section IV – Appendix 30 – 41 Section V – Non-GAAP Reconciliations 42 – 50
3 Forward Looking Statements This communication contains “forward-looking statements” within the meaning of the Private Securities Litigation Reform Act of 1995 regarding the financial condition, results of operations, business plans, asset quality, future performance, and other strategic goals of BancShares. Words such as “anticipates,” “believes,” “estimates,” “expects,” “predicts,” “forecasts,” “intends,” “plans,” “projects,” “targets,” “designed,” “could,” “may,” “should,” “will,” “potential,” “continue,” “aims” or other similar words and expressions are intended to identify these forward-looking statements. These forward-looking statements are based on BancShares’ current expectations and assumptions regarding BancShares’ business, the economy, and other future conditions. Because forward-looking statements relate to future results and occurrences, they are subject to inherent risks, uncertainties, changes in circumstances and other factors that are difficult to predict. Many possible events or factors could affect BancShares’ future financial results and performance and could cause actual results, performance or achievements of BancShares to differ materially from any anticipated results expressed or implied by such forward-looking statements. Such risks and uncertainties include, among others, general competitive, economic (including the imposition of tariffs, retaliatory tariff measures, trade barriers on trading partners, and supply chain disruptions), political (including impacts of any U.S. government shutdown), geopolitical events (including conflicts or developments in Ukraine, the Middle East and Latin America), natural disasters and market conditions, including changes in competitive pressures among financial institutions and the impacts related to or resulting from previous bank failures, the risks and impacts of future bank failures and other volatility in the banking industry, public perceptions of our business practices, including our deposit pricing and acquisition activity, the financial success or changing conditions or strategies of BancShares’ vendors or customers, including changes in demand for deposits, loans and other financial services, fluctuations in interest rates, changes in the quality or composition of BancShares’ loan or investment portfolio, actions of government regulators, including interest rate decisions by the Board of Governors of the Federal Reserve Board (the “Federal Reserve”), changes to estimates of future costs and benefits of actions taken by BancShares, BancShares’ ability to maintain adequate sources of funding and liquidity, the timing and amount of any prepayments of the Purchase Money Note, which depend on deposit growth, market conditions and the availability and cost of alternative funding, the potential impact of decisions by the Federal Reserve on BancShares’ capital plans, adverse developments with respect to U.S. or global economic conditions, including significant turbulence in the capital or financial markets, the impact of any sustained or elevated inflationary environment, the impact of any cyberattack, information or security breach, the effect of technological change, including artificial intelligence and digital assets, the impact of implementation and compliance with current or proposed laws, regulations and regulatory interpretations, including potential increased regulatory requirements, limitations, and costs, such as FDIC special assessments, increases to FDIC deposit insurance premiums, changes in regulatory capital requirements, or limitations on credit card interest rates, along with the risk that such laws, regulations and regulatory interpretations may change, the availability of capital and personnel, changes or enhancements BancShares implements with respect to risk management, technology, personnel, financial service offerings, or other areas, and the risks associated with BancShares’ previously completed acquisition transactions, including the integration of, and retention of deposits and clients acquired in, the BMO Branch Acquisition, or any future transactions. BancShares’ Share Repurchase Plan announced in July 2025 (“2025 SRP”) allows BancShares to repurchase shares of its Class A common stock through 2026, and the Share Repurchase Plan announced in October 2026 (“2027 SRP”) allows BancShares to repurchase shares of its Class A common stock in 2027. BancShares is not obligated under the 2025 SRP or the 2027 SRP to repurchase any minimum or particular number of shares, and repurchases may be suspended or discontinued at any time (subject to the terms of any Rule 10b5-1 plan in effect) without prior notice. The authorization to repurchase Class A common stock will be utilized at management’s discretion. The actual timing and amount of Class A common stock that may be repurchased under the 2025 SRP or the 2027 SRP will depend on a number of factors, including the terms of any Rule 10b5-1 plan then in effect, price, general business and market conditions, regulatory requirements, and alternative investment opportunities or capital needs. Except to the extent required by applicable laws or regulations, BancShares disclaims any obligation to update forward-looking statements or to publicly announce the results of any revisions to any of the forward-looking statements included herein to reflect future events or developments. Additional factors which could affect the forward-looking statements can be found in BancShares’ Annual Report on Form 10-K for the fiscal year ended December 31, 2025 and its other filings with the SEC. Non-GAAP Measures Certain measures in this presentation, including those referenced as “adjusted” or “excluding PAA,” are “non-GAAP,” meaning they are numerical measures of BancShares’ financial performance, financial position or cash flows that are not presented in accordance with generally accepted accounting principles in the U.S. (“GAAP”) because they exclude or include amounts or are adjusted in some way so as to be different than the most direct comparable measures calculated and presented in accordance with GAAP in BancShares’ statements of income, balance sheets or statements of cash flows and also are not codified in U.S. banking regulations currently applicable to BancShares. BancShares management believes that non-GAAP financial measures, when reviewed in conjunction with GAAP financial information, can provide transparency about or an alternative means of assessing its operating results, financial position or cash flows to its investors, analysts and management. These non-GAAP measures should be considered in addition to, and not superior to or a substitute for, GAAP measures. Each non-GAAP measure is reconciled to the most comparable GAAP measure in the non-GAAP reconciliation in Section V of this presentation. Certain financial results referenced as “Adjusted” in this presentation exclude notable items. The Adjusted financial measures are non-GAAP. Refer to Section V of this presentation for a reconciliation of Non-GAAP financial measures to the most directly comparable GAAP measure. Reclassifications See Section IV entitled Appendix for information on reclassifications. Important Notices

Third Quarter Overview & Strategic Priorities Section I
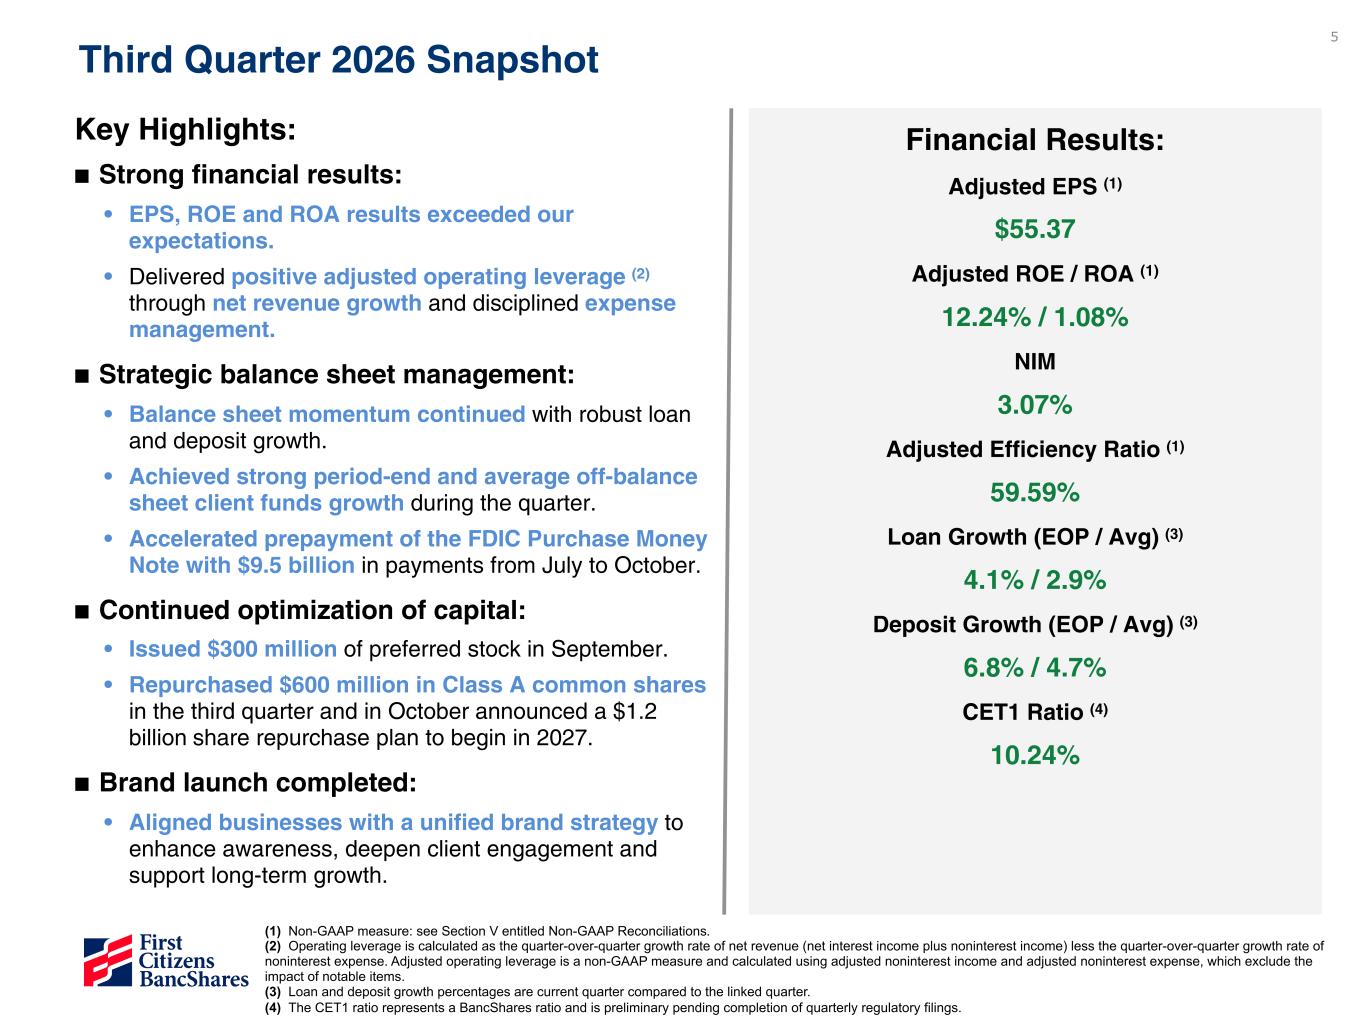
5 Third Quarter 2026 Snapshot Key Highlights: ■ Strong financial results: • EPS, ROE and ROA results exceeded our expectations. • Delivered positive adjusted operating leverage (2) through net revenue growth and disciplined expense management. ■ Strategic balance sheet management: • Balance sheet momentum continued with robust loan and deposit growth. • Achieved strong period-end and average off-balance sheet client funds growth during the quarter. • Accelerated prepayment of the FDIC Purchase Money Note with $9.5 billion in payments from July to October. ■ Continued optimization of capital: • Issued $300 million of preferred stock in September. • Repurchased $600 million in Class A common shares in the third quarter and in October announced a $1.2 billion share repurchase plan to begin in 2027. ■ Brand launch completed: • Aligned businesses with a unified brand strategy to enhance awareness, deepen client engagement and support long-term growth. Financial Results: Adjusted EPS (1) $55.37 Adjusted ROE / ROA (1) 12.24% / 1.08% NIM 3.07% Adjusted Efficiency Ratio (1) 59.59% Loan Growth (EOP / Avg) (3) 4.1% / 2.9% Deposit Growth (EOP / Avg) (3) 6.8% / 4.7% CET1 Ratio (4) 10.24% (1) Non-GAAP measure: see Section V entitled Non-GAAP Reconciliations. (2) Operating leverage is calculated as the quarter-over-quarter growth rate of net revenue (net interest income plus noninterest income) less the quarter-over-quarter growth rate of noninterest expense. Adjusted operating leverage is a non-GAAP measure and calculated using adjusted noninterest income and adjusted noninterest expense, which exclude the impact of notable items. (3) Loan and deposit growth percentages are current quarter compared to the linked quarter. (4) The CET1 ratio represents a BancShares ratio and is preliminary pending completion of quarterly regulatory filings.
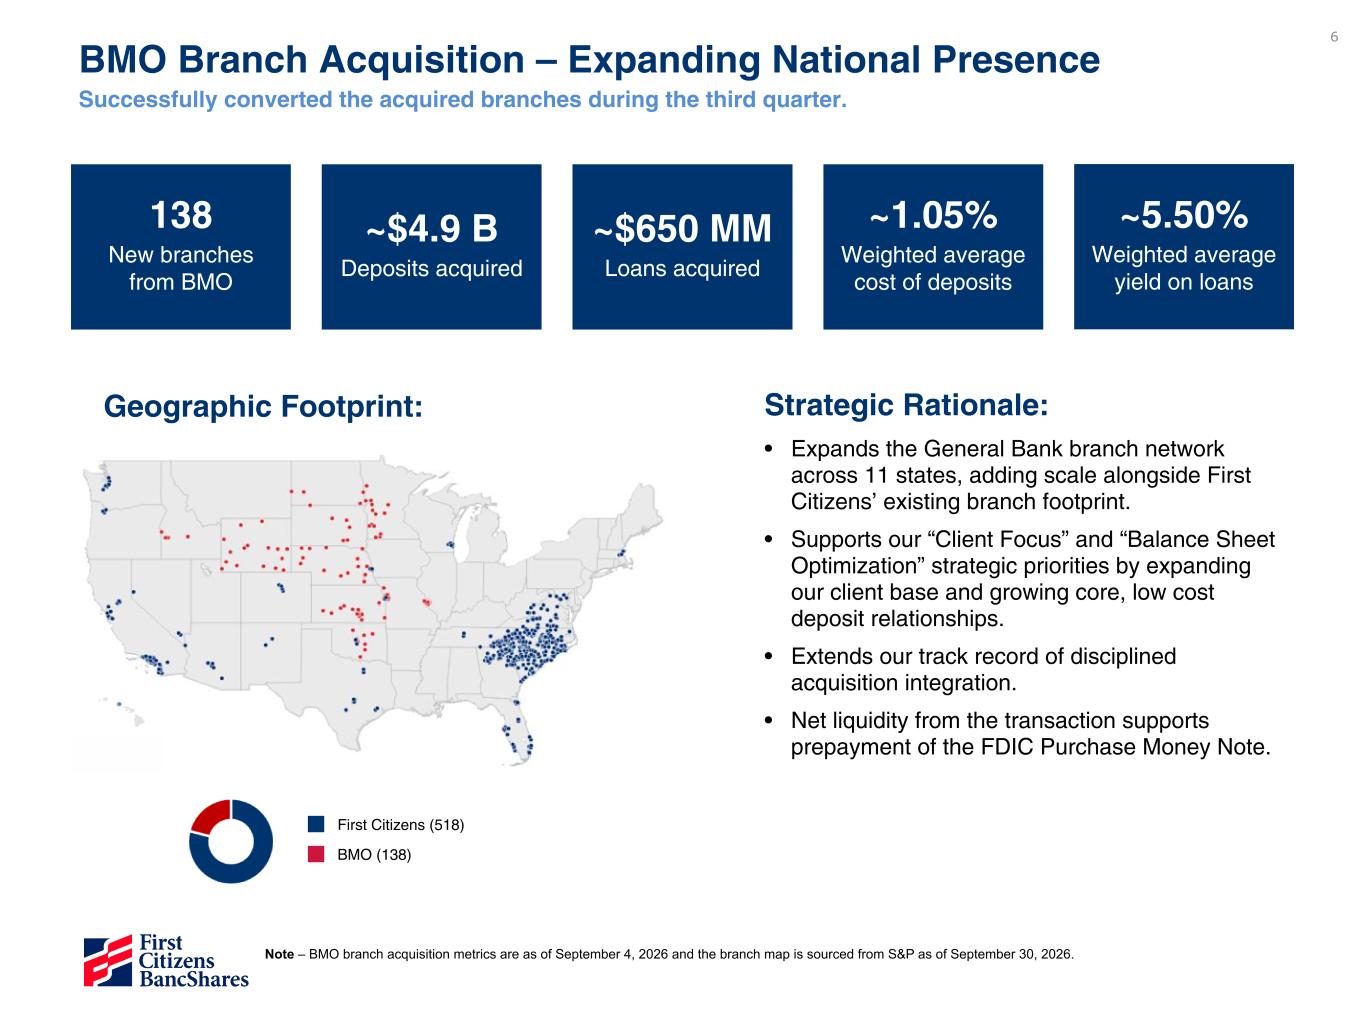
6 BMO Branch Acquisition – Expanding National Presence Successfully converted the acquired branches during the third quarter. 138 New branches from BMO ~$4.9 B Deposits acquired ~$650 MM Loans acquired ~1.05% Weighted average cost of deposits ~5.50% Weighted average yield on loans Geographic Footprint: Strategic Rationale: • Expands the General Bank branch network across 11 states, adding scale alongside First Citizens’ existing branch footprint. • Supports our “Client Focus” and “Balance Sheet Optimization” strategic priorities by expanding our client base and growing core, low cost deposit relationships. • Extends our track record of disciplined acquisition integration. • Net liquidity from the transaction supports prepayment of the FDIC Purchase Money Note. Note – BMO branch acquisition metrics are as of September 4, 2026 and the branch map is sourced from S&P as of September 30, 2026. First Citizens (518) BMO (138)
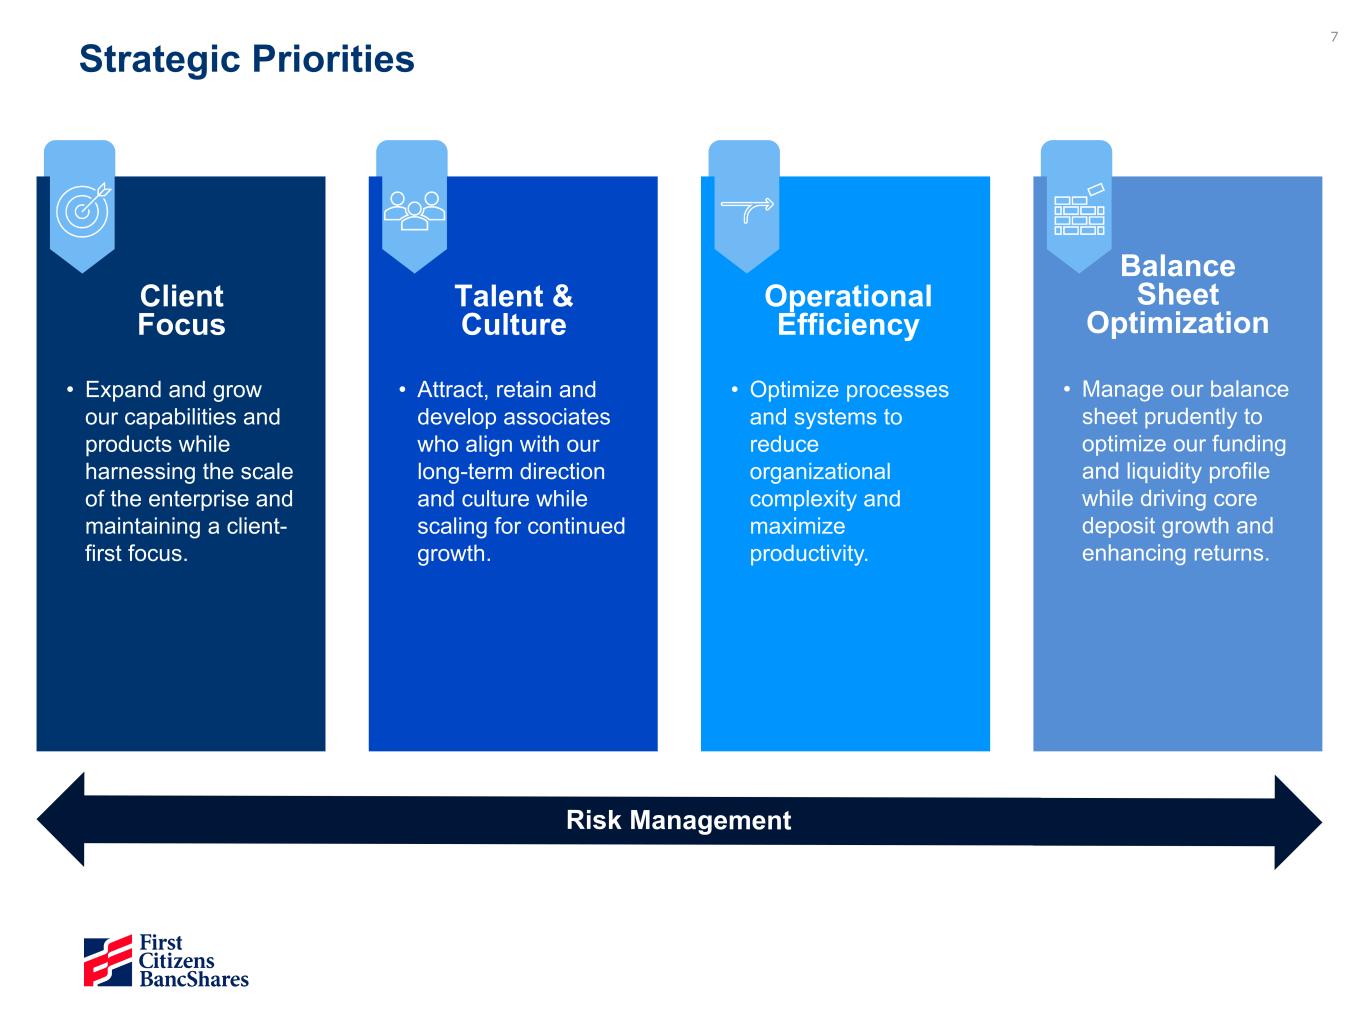
7 Strategic Priorities • Expand and grow our capabilities and products while harnessing the scale of the enterprise and maintaining a client- first focus. Client Focus • Attract, retain and develop associates who align with our long-term direction and culture while scaling for continued growth. Talent & Culture • Optimize processes and systems to reduce organizational complexity and maximize productivity. Operational Efficiency • Manage our balance sheet prudently to optimize our funding and liquidity profile while driving core deposit growth and enhancing returns. Balance Sheet Optimization Risk Management
Third Quarter 2026 Financial Results Section II
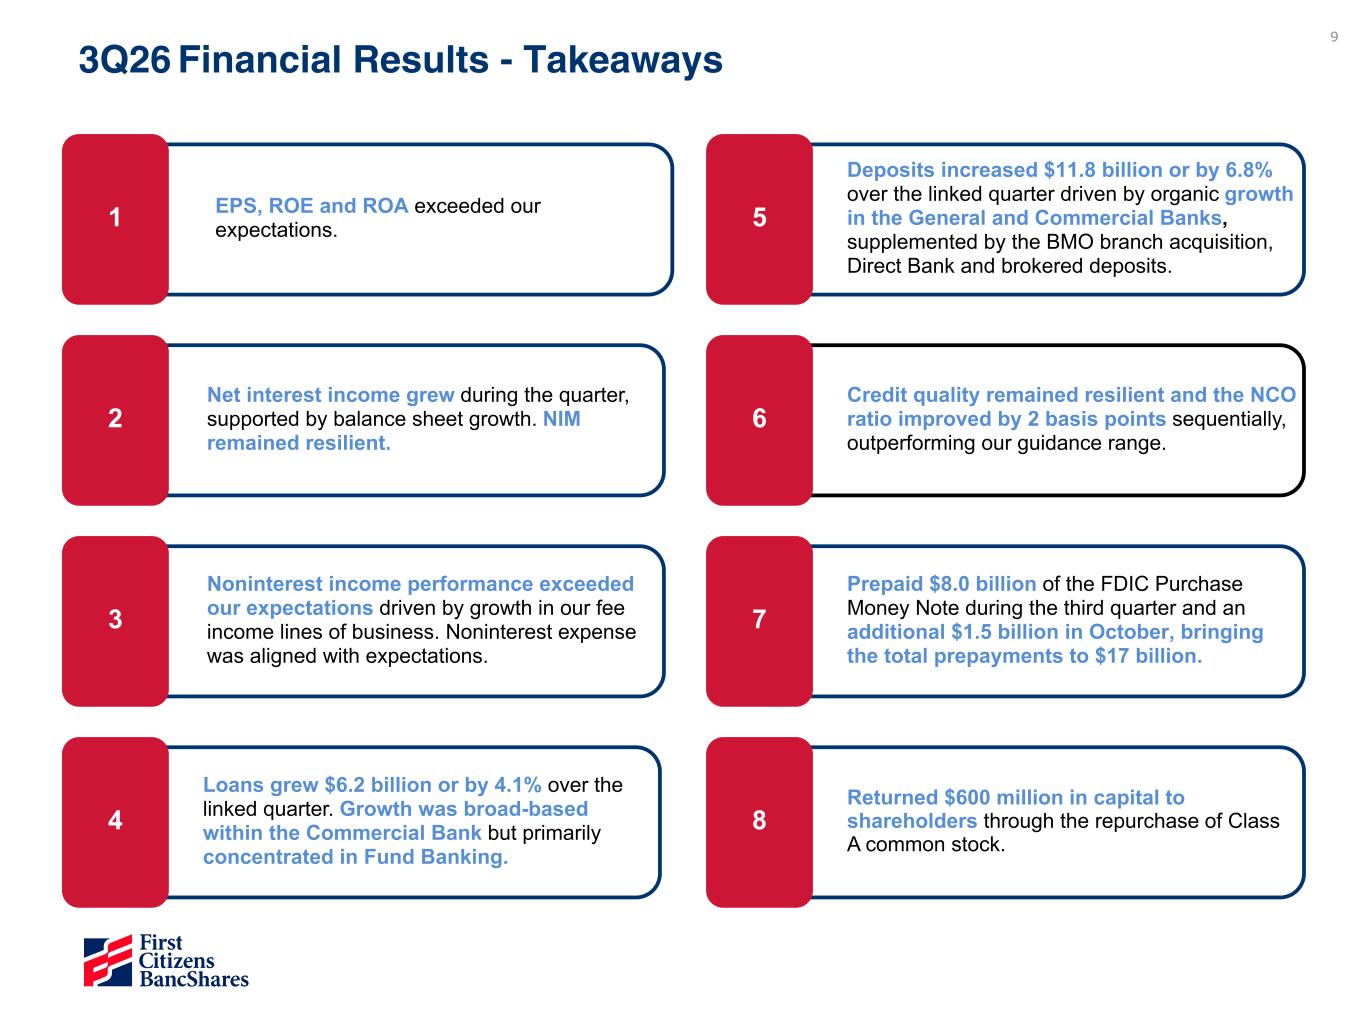
9 3Q26 Financial Results - Takeaways EPS, ROE and ROA exceeded our expectations.1 Returned $600 million in capital to shareholders through the repurchase of Class A common stock. 8 Prepaid $8.0 billion of the FDIC Purchase Money Note during the third quarter and an additional $1.5 billion in October, bringing the total prepayments to $17 billion. 7 Net interest income grew during the quarter, supported by balance sheet growth. NIM remained resilient. 2 Noninterest income performance exceeded our expectations driven by growth in our fee income lines of business. Noninterest expense was aligned with expectations. 3 Credit quality remained resilient and the NCO ratio improved by 2 basis points sequentially, outperforming our guidance range. 6 Loans grew $6.2 billion or by 4.1% over the linked quarter. Growth was broad-based within the Commercial Bank but primarily concentrated in Fund Banking. 4 Deposits increased $11.8 billion or by 6.8% over the linked quarter driven by organic growth in the General and Commercial Banks, supplemented by the BMO branch acquisition, Direct Bank and brokered deposits. 5
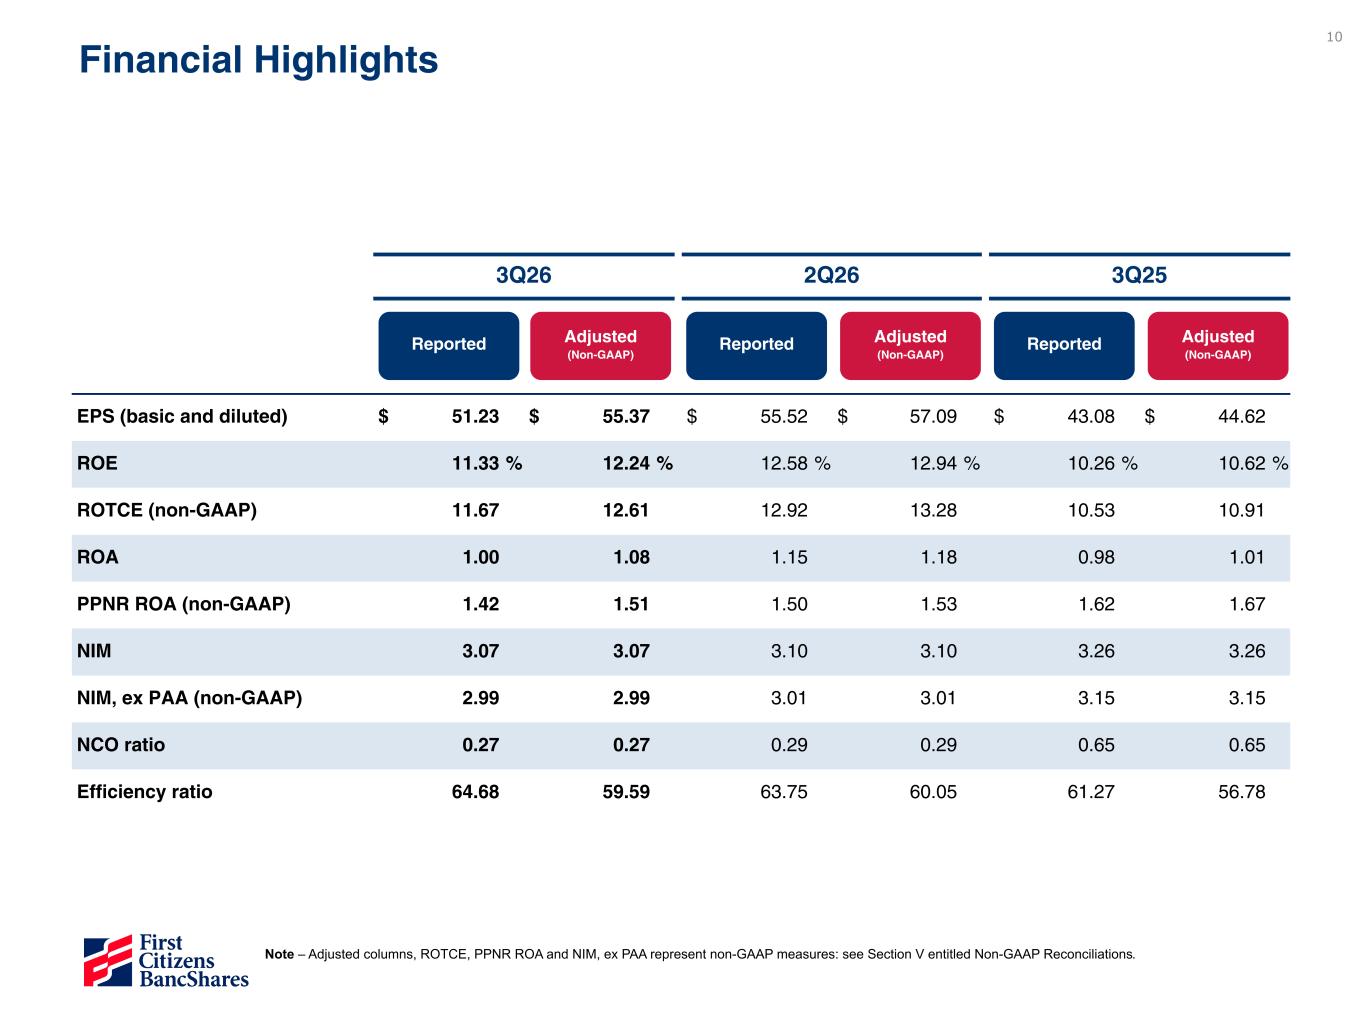
10 3Q26 2Q26 3Q25 EPS (basic and diluted) $ 51.23 $ 55.37 $ 55.52 $ 57.09 $ 43.08 $ 44.62 ROE 11.33 % 12.24 % 12.58 % 12.94 % 10.26 % 10.62 % ROTCE (non-GAAP) 11.67 12.61 12.92 13.28 10.53 10.91 ROA 1.00 1.08 1.15 1.18 0.98 1.01 PPNR ROA (non-GAAP) 1.42 1.51 1.50 1.53 1.62 1.67 NIM 3.07 3.07 3.10 3.10 3.26 3.26 NIM, ex PAA (non-GAAP) 2.99 2.99 3.01 3.01 3.15 3.15 NCO ratio 0.27 0.27 0.29 0.29 0.65 0.65 Efficiency ratio 64.68 59.59 63.75 60.05 61.27 56.78 Reported Adjusted (Non-GAAP) Reported Adjusted (Non-GAAP) Reported Adjusted (Non-GAAP) Financial Highlights Note – Adjusted columns, ROTCE, PPNR ROA and NIM, ex PAA represent non-GAAP measures: see Section V entitled Non-GAAP Reconciliations.
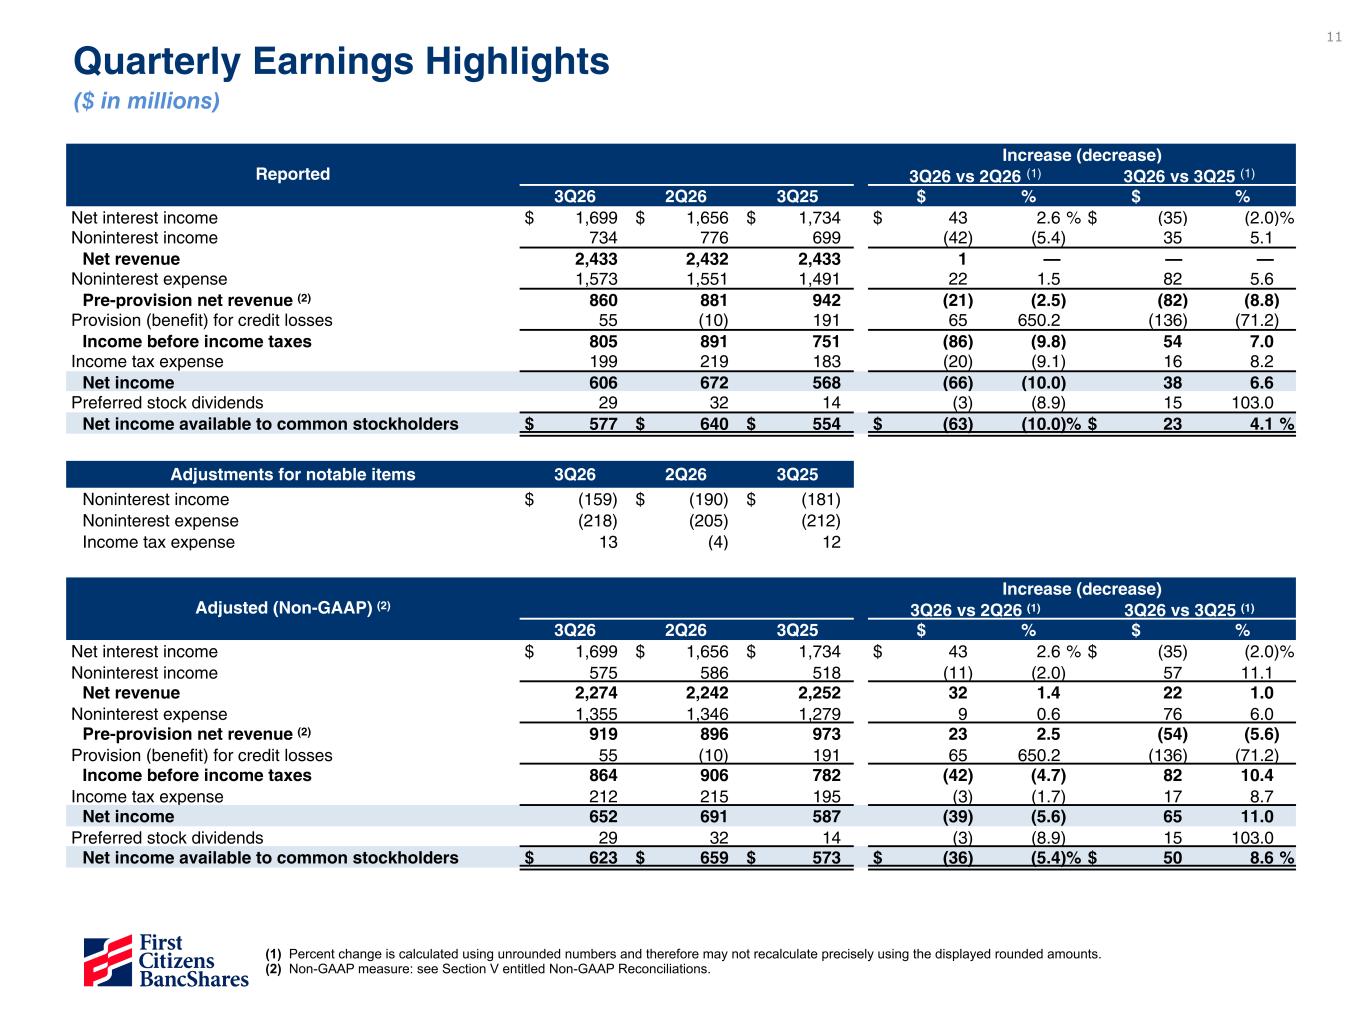
11 Reported Increase (decrease) 3Q26 vs 2Q26 (1) 3Q26 vs 3Q25 (1) 3Q26 2Q26 3Q25 $ % $ % Net interest income $ 1,699 $ 1,656 $ 1,734 $ 43 2.6 % $ (35) (2.0) % Noninterest income 734 776 699 (42) (5.4) 35 5.1 Net revenue 2,433 2,432 2,433 1 — — — Noninterest expense 1,573 1,551 1,491 22 1.5 82 5.6 Pre-provision net revenue (2) 860 881 942 (21) (2.5) (82) (8.8) Provision (benefit) for credit losses 55 (10) 191 65 650.2 (136) (71.2) Income before income taxes 805 891 751 (86) (9.8) 54 7.0 Income tax expense 199 219 183 (20) (9.1) 16 8.2 Net income 606 672 568 (66) (10.0) 38 6.6 Preferred stock dividends 29 32 14 (3) (8.9) 15 103.0 Net income available to common stockholders $ 577 $ 640 $ 554 $ (63) (10.0) % $ 23 4.1 % Adjustments for notable items 3Q26 2Q26 3Q25 Noninterest income $ (159) $ (190) $ (181) Noninterest expense (218) (205) (212) Income tax expense 13 (4) 12 Adjusted (Non-GAAP) (2) Increase (decrease) 3Q26 vs 2Q26 (1) 3Q26 vs 3Q25 (1) 3Q26 2Q26 3Q25 $ % $ % Net interest income $ 1,699 $ 1,656 $ 1,734 $ 43 2.6 % $ (35) (2.0) % Noninterest income 575 586 518 (11) (2.0) 57 11.1 Net revenue 2,274 2,242 2,252 32 1.4 22 1.0 Noninterest expense 1,355 1,346 1,279 9 0.6 76 6.0 Pre-provision net revenue (2) 919 896 973 23 2.5 (54) (5.6) Provision (benefit) for credit losses 55 (10) 191 65 650.2 (136) (71.2) Income before income taxes 864 906 782 (42) (4.7) 82 10.4 Income tax expense 212 215 195 (3) (1.7) 17 8.7 Net income 652 691 587 (39) (5.6) 65 11.0 Preferred stock dividends 29 32 14 (3) (8.9) 15 103.0 Net income available to common stockholders $ 623 $ 659 $ 573 $ (36) (5.4) % $ 50 8.6 % Quarterly Earnings Highlights ($ in millions) (1) Percent change is calculated using unrounded numbers and therefore may not recalculate precisely using the displayed rounded amounts. (2) Non-GAAP measure: see Section V entitled Non-GAAP Reconciliations.
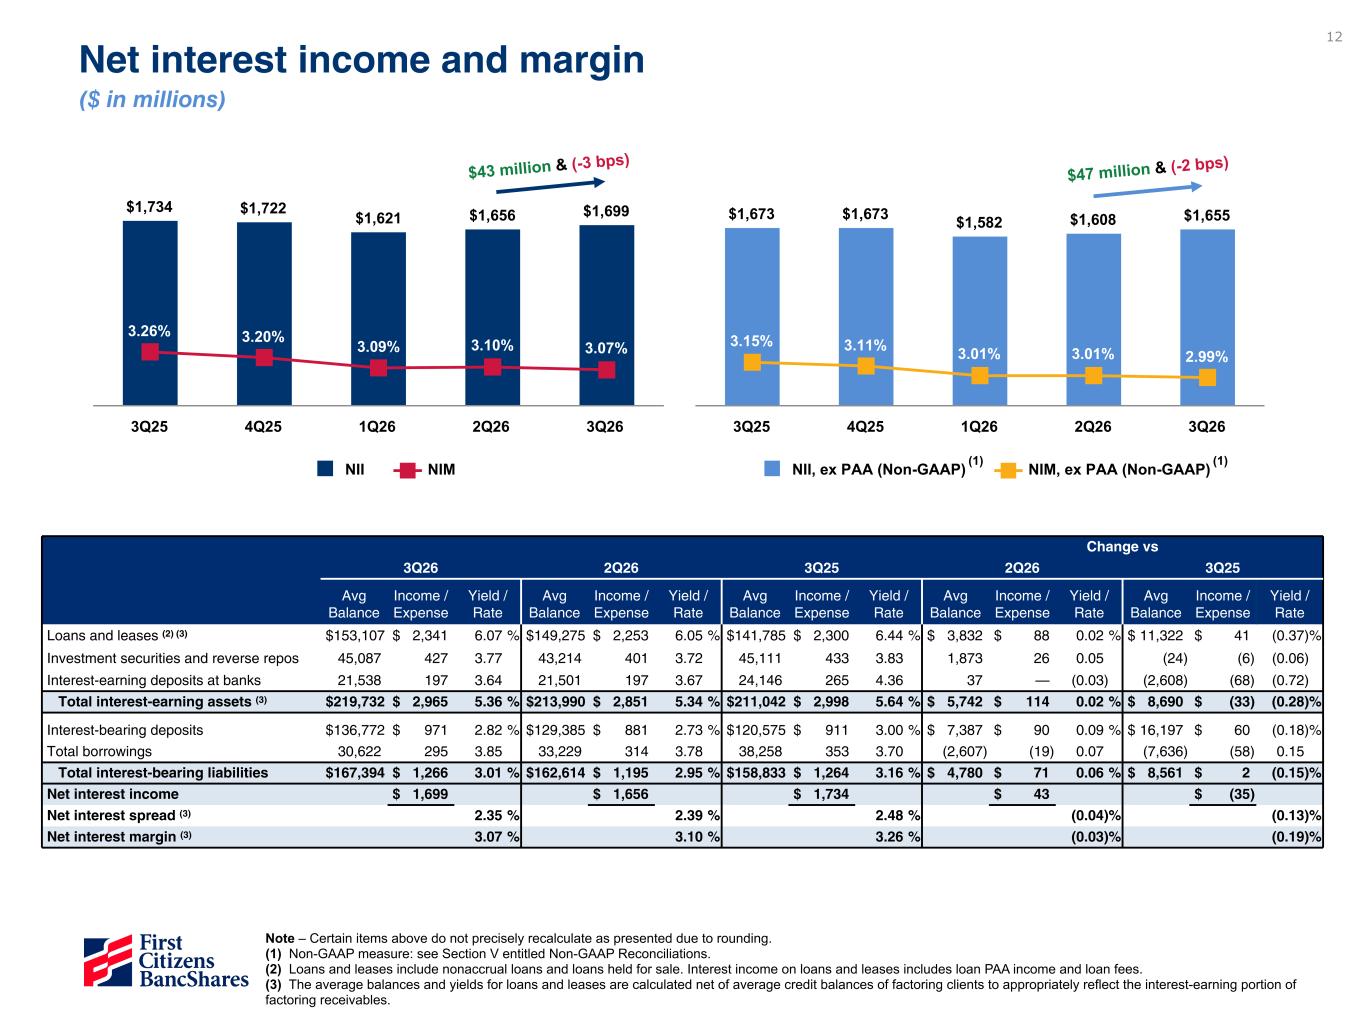
12 $1,673 $1,673 $1,582 $1,608 $1,655 3.15% 3.11% 3.01% 3.01% 2.99% NII, ex PAA (Non-GAAP) NIM, ex PAA (Non-GAAP) 3Q25 4Q25 1Q26 2Q26 3Q26 $1,734 $1,722 $1,621 $1,656 $1,699 3.26% 3.20% 3.09% 3.10% 3.07% NII NIM 3Q25 4Q25 1Q26 2Q26 3Q26 $43 million & (-3 bps) Net interest income and margin ($ in millions) $47 million & (-2 bps) (1) (1) Change vs 3Q26 2Q26 3Q25 2Q26 3Q25 Avg Balance Income / Expense Yield / Rate Avg Balance Income / Expense Yield / Rate Avg Balance Income / Expense Yield / Rate Avg Balance Income / Expense Yield / Rate Avg Balance Income / Expense Yield / Rate Loans and leases (2) (3) $ 153,107 $ 2,341 6.07 % $ 149,275 $ 2,253 6.05 % $ 141,785 $ 2,300 6.44 % $ 3,832 $ 88 0.02 % $ 11,322 $ 41 (0.37) % Investment securities and reverse repos 45,087 427 3.77 43,214 401 3.72 45,111 433 3.83 1,873 26 0.05 (24) (6) (0.06) Interest-earning deposits at banks 21,538 197 3.64 21,501 197 3.67 24,146 265 4.36 37 — (0.03) (2,608) (68) (0.72) Total interest-earning assets (3) $ 219,732 $ 2,965 5.36 % $ 213,990 $ 2,851 5.34 % $ 211,042 $ 2,998 5.64 % $ 5,742 $ 114 0.02 % $ 8,690 $ (33) (0.28) % Interest-bearing deposits $ 136,772 $ 971 2.82 % $ 129,385 $ 881 2.73 % $ 120,575 $ 911 3.00 % $ 7,387 $ 90 0.09 % $ 16,197 $ 60 (0.18) % Total borrowings 30,622 295 3.85 33,229 314 3.78 38,258 353 3.70 (2,607) (19) 0.07 (7,636) (58) 0.15 Total interest-bearing liabilities $ 167,394 $ 1,266 3.01 % $ 162,614 $ 1,195 2.95 % $ 158,833 $ 1,264 3.16 % $ 4,780 $ 71 0.06 % $ 8,561 $ 2 (0.15) % Net interest income $ 1,699 $ 1,656 $ 1,734 $ 43 $ (35) Net interest spread (3) 2.35 % 2.39 % 2.48 % (0.04) % (0.13) % Net interest margin (3) 3.07 % 3.10 % 3.26 % (0.03) % (0.19) % Note – Certain items above do not precisely recalculate as presented due to rounding. (1) Non-GAAP measure: see Section V entitled Non-GAAP Reconciliations. (2) Loans and leases include nonaccrual loans and loans held for sale. Interest income on loans and leases includes loan PAA income and loan fees. (3) The average balances and yields for loans and leases are calculated net of average credit balances of factoring clients to appropriately reflect the interest-earning portion of factoring receivables.
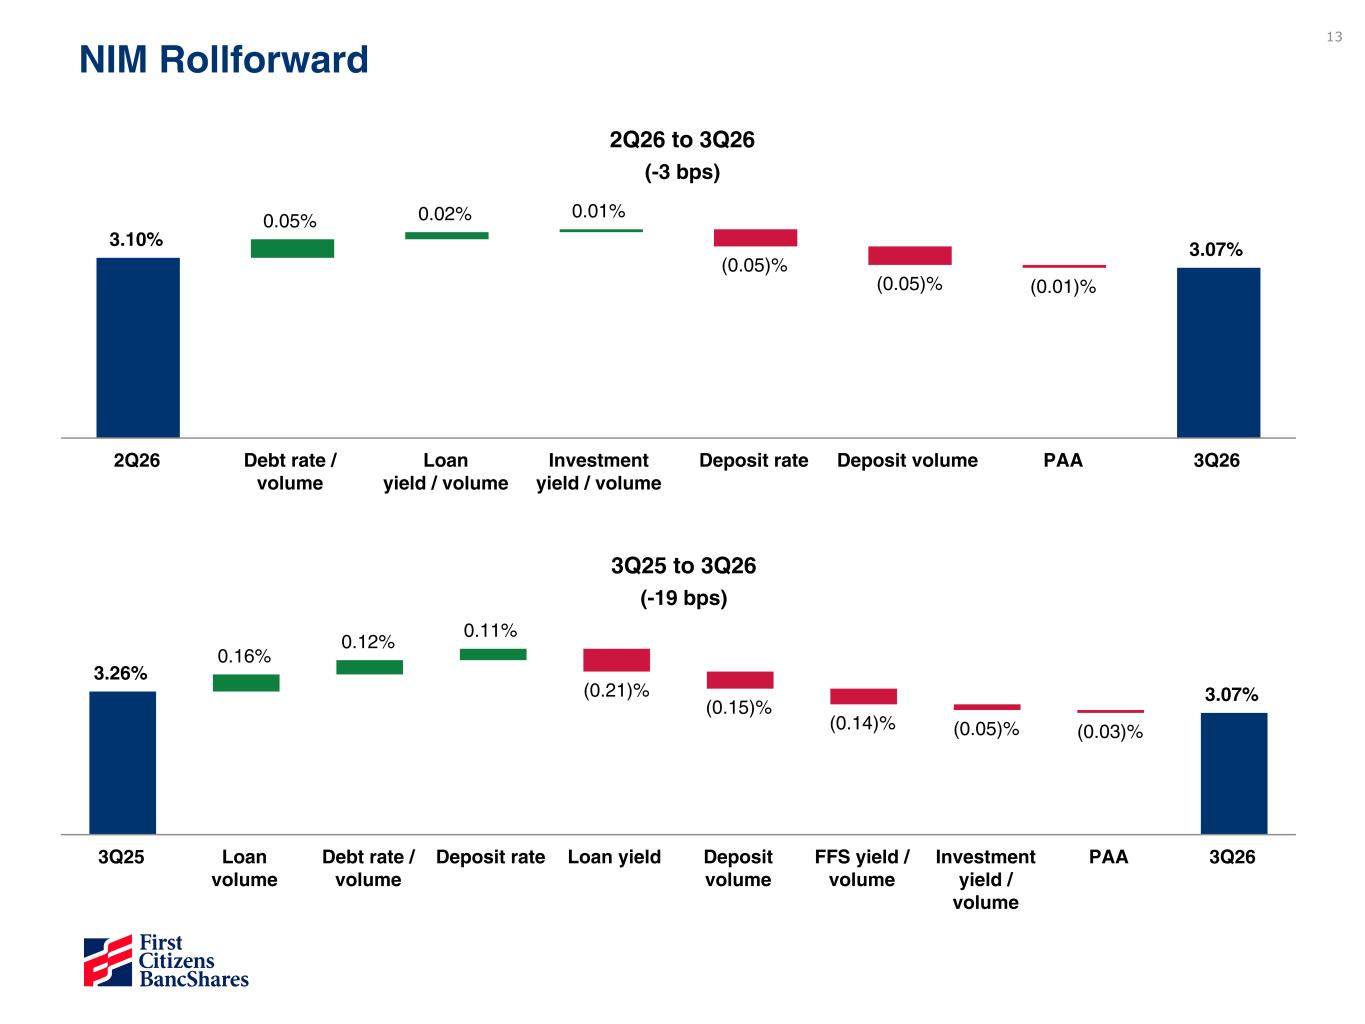
13 3.26% 0.16% 0.12% 0.11% (0.21)% (0.15)% (0.14)% (0.05)% (0.03)% 3.07% 3Q25 Loan volume Debt rate / volume Deposit rate Loan yield Deposit volume FFS yield / volume Investment yield / volume PAA 3Q26 3Q25 to 3Q26 (-19 bps) NIM Rollforward 3.10% 0.05% 0.02% 0.01% (0.05)% (0.05)% (0.01)% 3.07% 2Q26 Debt rate / volume Loan yield / volume Investment yield / volume Deposit rate Deposit volume PAA 3Q26 2Q26 to 3Q26 (-3 bps)
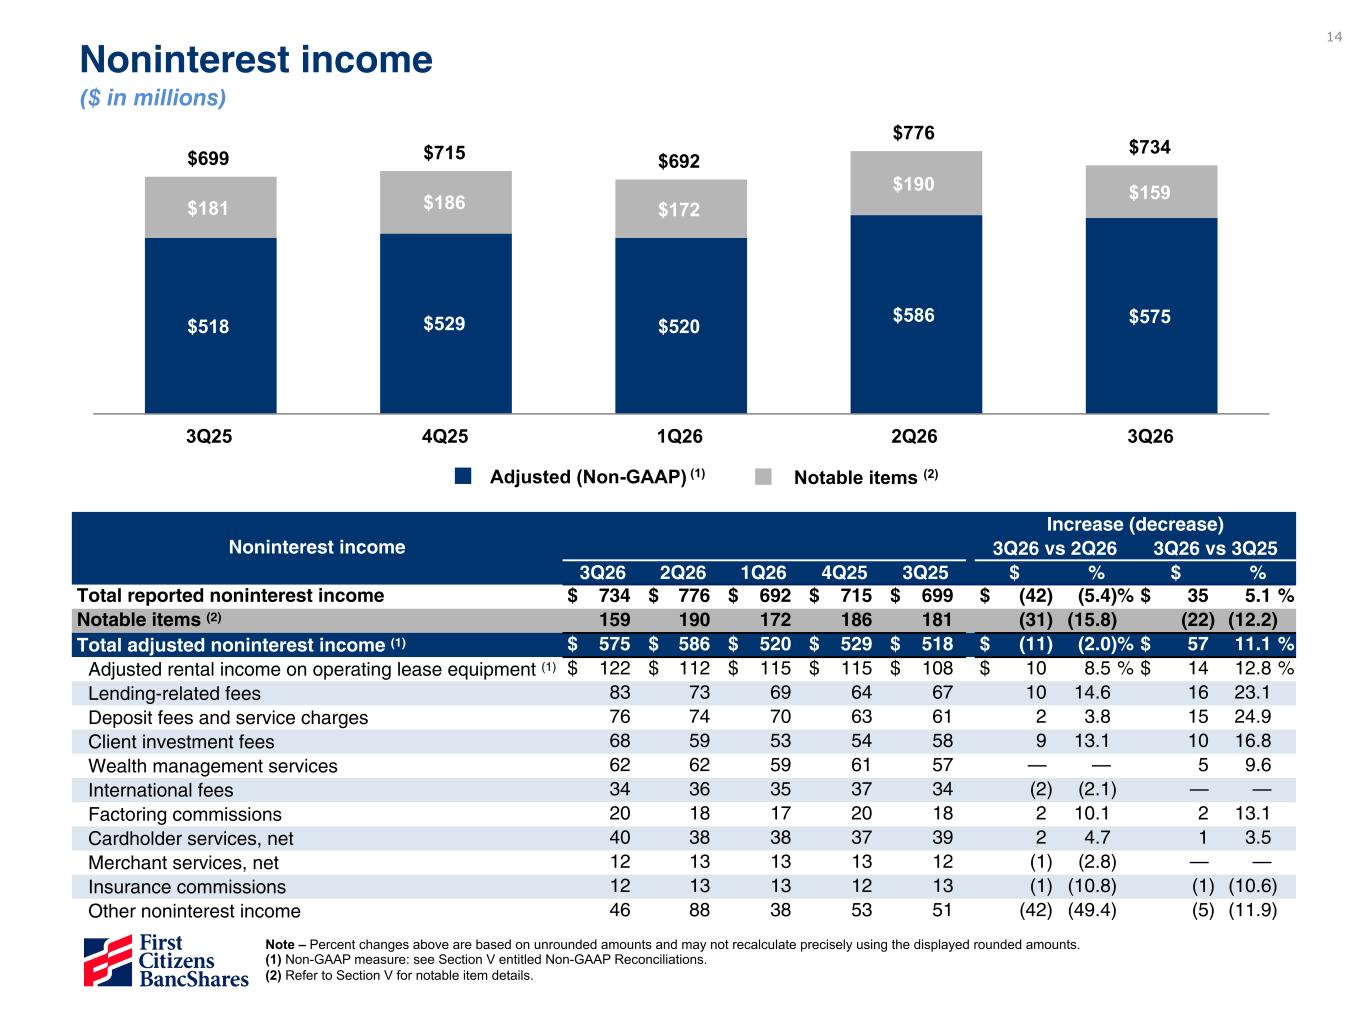
14 $699 $715 $692 $776 $734 $518 $529 $520 $586 $575 $181 $186 $172 $190 $159 3Q25 4Q25 1Q26 2Q26 3Q26 Noninterest income ($ in millions) Adjusted (Non-GAAP) (1) Notable items (2) Note – Percent changes above are based on unrounded amounts and may not recalculate precisely using the displayed rounded amounts. (1) Non-GAAP measure: see Section V entitled Non-GAAP Reconciliations. (2) Refer to Section V for notable item details. Noninterest income Increase (decrease) 3Q26 vs 2Q26 3Q26 vs 3Q25 3Q26 2Q26 1Q26 4Q25 3Q25 $ % $ % Total reported noninterest income $ 734 $ 776 $ 692 $ 715 $ 699 $ (42) (5.4) % $ 35 5.1 % Notable items (2) 159 190 172 186 181 (31) (15.8) (22) (12.2) Total adjusted noninterest income (1) $ 575 $ 586 $ 520 $ 529 $ 518 $ (11) (2.0) % $ 57 11.1 % Adjusted rental income on operating lease equipment (1) $ 122 $ 112 $ 115 $ 115 $ 108 $ 10 8.5 % $ 14 12.8 % Lending-related fees 83 73 69 64 67 10 14.6 16 23.1 Deposit fees and service charges 76 74 70 63 61 2 3.8 15 24.9 Client investment fees 68 59 53 54 58 9 13.1 10 16.8 Wealth management services 62 62 59 61 57 — — 5 9.6 International fees 34 36 35 37 34 (2) (2.1) — — Factoring commissions 20 18 17 20 18 2 10.1 2 13.1 Cardholder services, net 40 38 38 37 39 2 4.7 1 3.5 Merchant services, net 12 13 13 13 12 (1) (2.8) — — Insurance commissions 12 13 13 12 13 (1) (10.8) (1) (10.6) Other noninterest income 46 88 38 53 51 (42) (49.4) (5) (11.9)
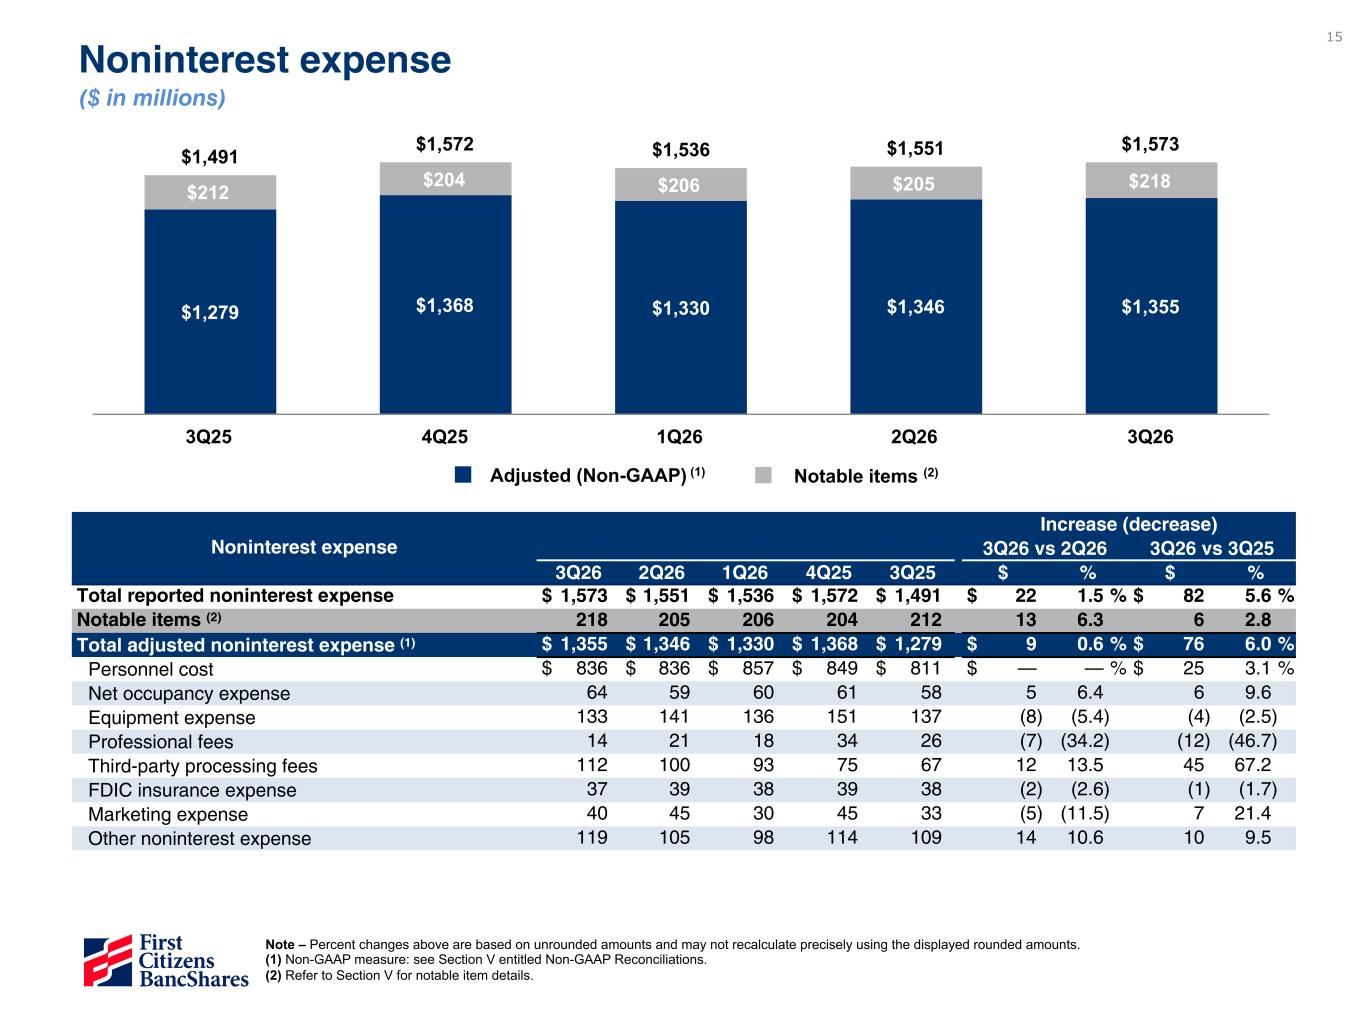
15 $1,491 $1,572 $1,536 $1,551 $1,573 $1,279 $1,368 $1,330 $1,346 $1,355 $212 $204 $206 $205 $218 3Q25 4Q25 1Q26 2Q26 3Q26 Noninterest expense ($ in millions) Adjusted (Non-GAAP) (1) Notable items (2) Noninterest expense Increase (decrease) 3Q26 vs 2Q26 3Q26 vs 3Q25 3Q26 2Q26 1Q26 4Q25 3Q25 $ % $ % Total reported noninterest expense $ 1,573 $ 1,551 $ 1,536 $ 1,572 $ 1,491 $ 22 1.5 % $ 82 5.6 % Notable items (2) 218 205 206 204 212 13 6.3 6 2.8 Total adjusted noninterest expense (1) $ 1,355 $ 1,346 $ 1,330 $ 1,368 $ 1,279 $ 9 0.6 % $ 76 6.0 % Personnel cost $ 836 $ 836 $ 857 $ 849 $ 811 $ — — % $ 25 3.1 % Net occupancy expense 64 59 60 61 58 5 6.4 6 9.6 Equipment expense 133 141 136 151 137 (8) (5.4) (4) (2.5) Professional fees 14 21 18 34 26 (7) (34.2) (12) (46.7) Third-party processing fees 112 100 93 75 67 12 13.5 45 67.2 FDIC insurance expense 37 39 38 39 38 (2) (2.6) (1) (1.7) Marketing expense 40 45 30 45 33 (5) (11.5) 7 21.4 Other noninterest expense 119 105 98 114 109 14 10.6 10 9.5 Note – Percent changes above are based on unrounded amounts and may not recalculate precisely using the displayed rounded amounts. (1) Non-GAAP measure: see Section V entitled Non-GAAP Reconciliations. (2) Refer to Section V for notable item details.
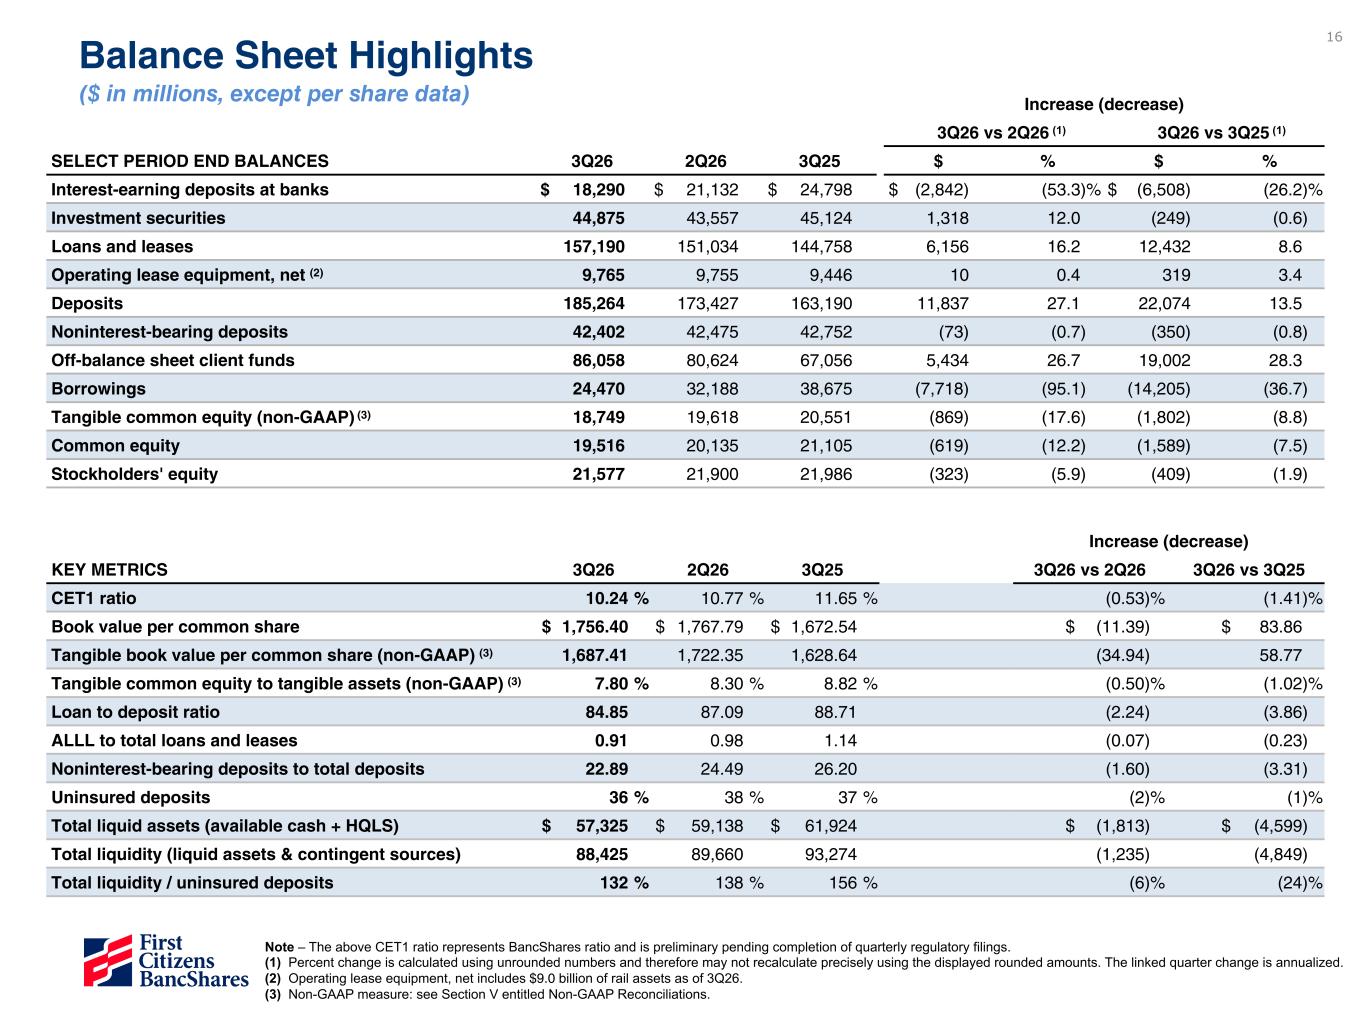
16 Increase (decrease) 3Q26 vs 2Q26 3Q26 vs 3Q25 SELECT PERIOD END BALANCES 3Q26 2Q26 3Q25 $ % $ % Interest-earning deposits at banks $ 18,290 $ 21,132 $ 24,798 $ (2,842) (53.3) % $ (6,508) (26.2) % Investment securities 44,875 43,557 45,124 1,318 12.0 (249) (0.6) Loans and leases 157,190 151,034 144,758 6,156 16.2 12,432 8.6 Operating lease equipment, net (2) 9,765 9,755 9,446 10 0.4 319 3.4 Deposits 185,264 173,427 163,190 11,837 27.1 22,074 13.5 Noninterest-bearing deposits 42,402 42,475 42,752 (73) (0.7) (350) (0.8) Off-balance sheet client funds 86,058 80,624 67,056 5,434 26.7 19,002 28.3 Borrowings 24,470 32,188 38,675 (7,718) (95.1) (14,205) (36.7) Tangible common equity (non-GAAP) (3) 18,749 19,618 20,551 (869) (17.6) (1,802) (8.8) Common equity 19,516 20,135 21,105 (619) (12.2) (1,589) (7.5) Stockholders' equity 21,577 21,900 21,986 (323) (5.9) (409) (1.9) Increase (decrease) KEY METRICS 3Q26 2Q26 3Q25 3Q26 vs 2Q26 3Q26 vs 3Q25 CET1 ratio 10.24 % 10.77 % 11.65 % (0.53) % (1.41) % Book value per common share $ 1,756.40 $ 1,767.79 $ 1,672.54 $ (11.39) $ 83.86 Tangible book value per common share (non-GAAP) (3) 1,687.41 1,722.35 1,628.64 (34.94) 58.77 Tangible common equity to tangible assets (non-GAAP) (3) 7.80 % 8.30 % 8.82 % (0.50) % (1.02) % Loan to deposit ratio 84.85 87.09 88.71 (2.24) (3.86) ALLL to total loans and leases 0.91 0.98 1.14 (0.07) (0.23) Noninterest-bearing deposits to total deposits 22.89 24.49 26.20 (1.60) (3.31) Uninsured deposits 36 % 38 % 37 % (2) % (1) % Total liquid assets (available cash + HQLS) $ 57,325 $ 59,138 $ 61,924 $ (1,813) $ (4,599) Total liquidity (liquid assets & contingent sources) 88,425 89,660 93,274 (1,235) (4,849) Total liquidity / uninsured deposits 132 % 138 % 156 % (6) % (24) % Balance Sheet Highlights ($ in millions, except per share data) (1) (1) Note – The above CET1 ratio represents BancShares ratio and is preliminary pending completion of quarterly regulatory filings. (1) Percent change is calculated using unrounded numbers and therefore may not recalculate precisely using the displayed rounded amounts. The linked quarter change is annualized. (2) Operating lease equipment, net includes $9.0 billion of rail assets as of 3Q26. (3) Non-GAAP measure: see Section V entitled Non-GAAP Reconciliations.
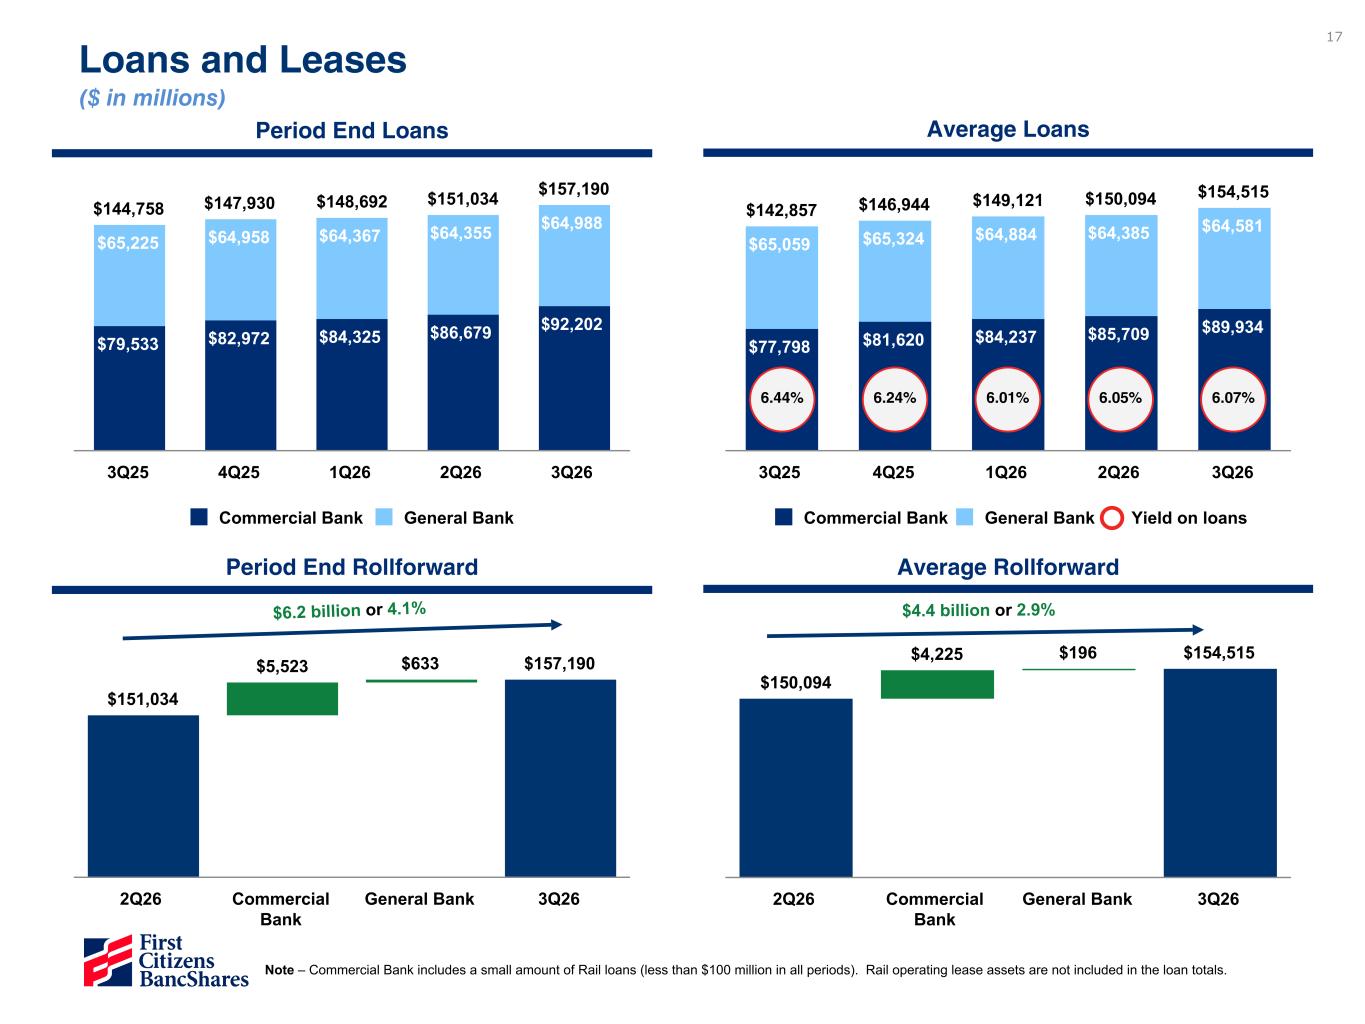
17 $151,034 $5,523 $633 $157,190 2Q26 Commercial Bank General Bank 3Q26 $142,857 $146,944 $149,121 $150,094 $154,515 $77,798 $81,620 $84,237 $85,709 $89,934 $65,059 $65,324 $64,884 $64,385 $64,581 Commercial Bank General Bank Yield on loans 3Q25 4Q25 1Q26 2Q26 3Q26 6.24% 6.01% 6.05% 6.07%6.44% $144,758 $147,930 $148,692 $151,034 $157,190 $79,533 $82,972 $84,325 $86,679 $92,202 $65,225 $64,958 $64,367 $64,355 $64,988 Commercial Bank General Bank 3Q25 4Q25 1Q26 2Q26 3Q26 Note – Commercial Bank includes a small amount of Rail loans (less than $100 million in all periods). Rail operating lease assets are not included in the loan totals. $150,094 $4,225 $196 $154,515 2Q26 Commercial Bank General Bank 3Q26 Average RollforwardPeriod End Rollforward Average LoansPeriod End Loans Loans and Leases ($ in millions) $6.2 billion or 4.1% $4.4 billion or 2.9%
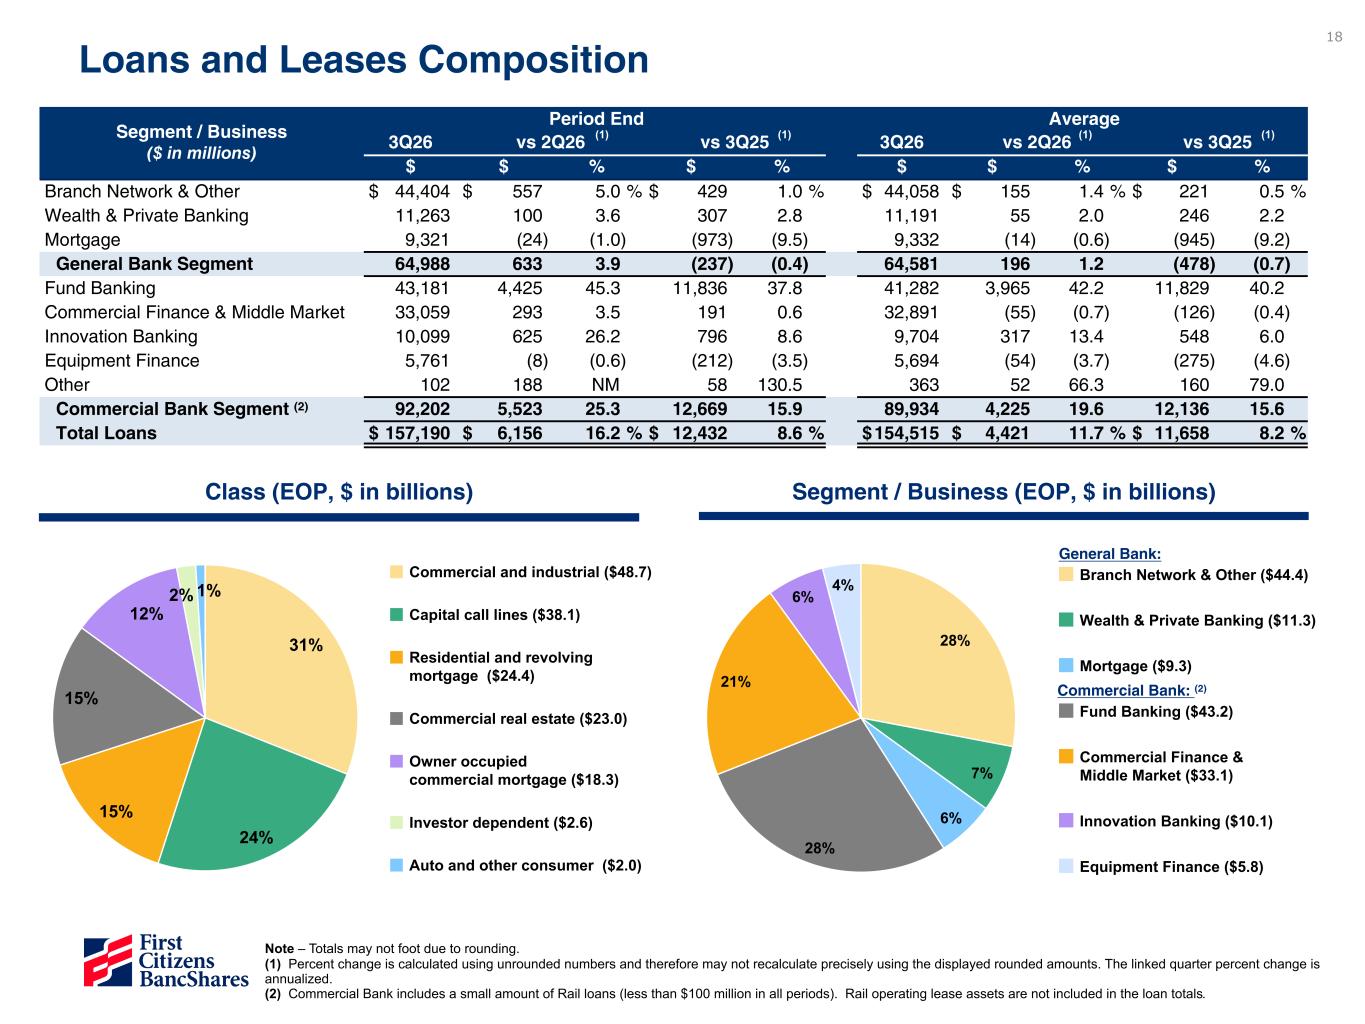
18 31% 24% 15% 15% 12% 2% 1% Commercial and industrial ($48.7) Capital call lines ($38.1) Residential and revolving mortgage ($24.4) Commercial real estate ($23.0) Owner occupied commercial mortgage ($18.3) Investor dependent ($2.6) Auto and other consumer ($2.0) 28% 7% 6% 28% 21% 6% 4% Branch Network & Other ($44.4) Wealth & Private Banking ($11.3) Mortgage ($9.3) Fund Banking ($43.2) Commercial Finance & Middle Market ($33.1) Innovation Banking ($10.1) Equipment Finance ($5.8) Loans and Leases Composition Note – Totals may not foot due to rounding. (1) Percent change is calculated using unrounded numbers and therefore may not recalculate precisely using the displayed rounded amounts. The linked quarter percent change is annualized. (2) Commercial Bank includes a small amount of Rail loans (less than $100 million in all periods). Rail operating lease assets are not included in the loan totals. Segment / Business (EOP, $ in billions) Commercial Bank: (2) General Bank: Class (EOP, $ in billions) (1)Segment / Business ($ in millions) Period End Average 3Q26 vs 2Q26 vs 3Q25 3Q26 vs 2Q26 vs 3Q25 $ $ % $ % $ $ % $ % Branch Network & Other $ 44,404 $ 557 5.0 % $ 429 1.0 % $ 44,058 $ 155 1.4 % $ 221 0.5 % Wealth & Private Banking 11,263 100 3.6 307 2.8 11,191 55 2.0 246 2.2 Mortgage 9,321 (24) (1.0) (973) (9.5) 9,332 (14) (0.6) (945) (9.2) General Bank Segment 64,988 633 3.9 (237) (0.4) 64,581 196 1.2 (478) (0.7) Fund Banking 43,181 4,425 45.3 11,836 37.8 41,282 3,965 42.2 11,829 40.2 Commercial Finance & Middle Market 33,059 293 3.5 191 0.6 32,891 (55) (0.7) (126) (0.4) Innovation Banking 10,099 625 26.2 796 8.6 9,704 317 13.4 548 6.0 Equipment Finance 5,761 (8) (0.6) (212) (3.5) 5,694 (54) (3.7) (275) (4.6) Other 102 188 NM 58 130.5 363 52 66.3 160 79.0 Commercial Bank Segment (2) 92,202 5,523 25.3 12,669 15.9 89,934 4,225 19.6 12,136 15.6 Total Loans $ 157,190 $ 6,156 16.2 % $ 12,432 8.6 % $ 154,515 $ 4,421 11.7 % $ 11,658 8.2 % (1) (1) (1) (1)
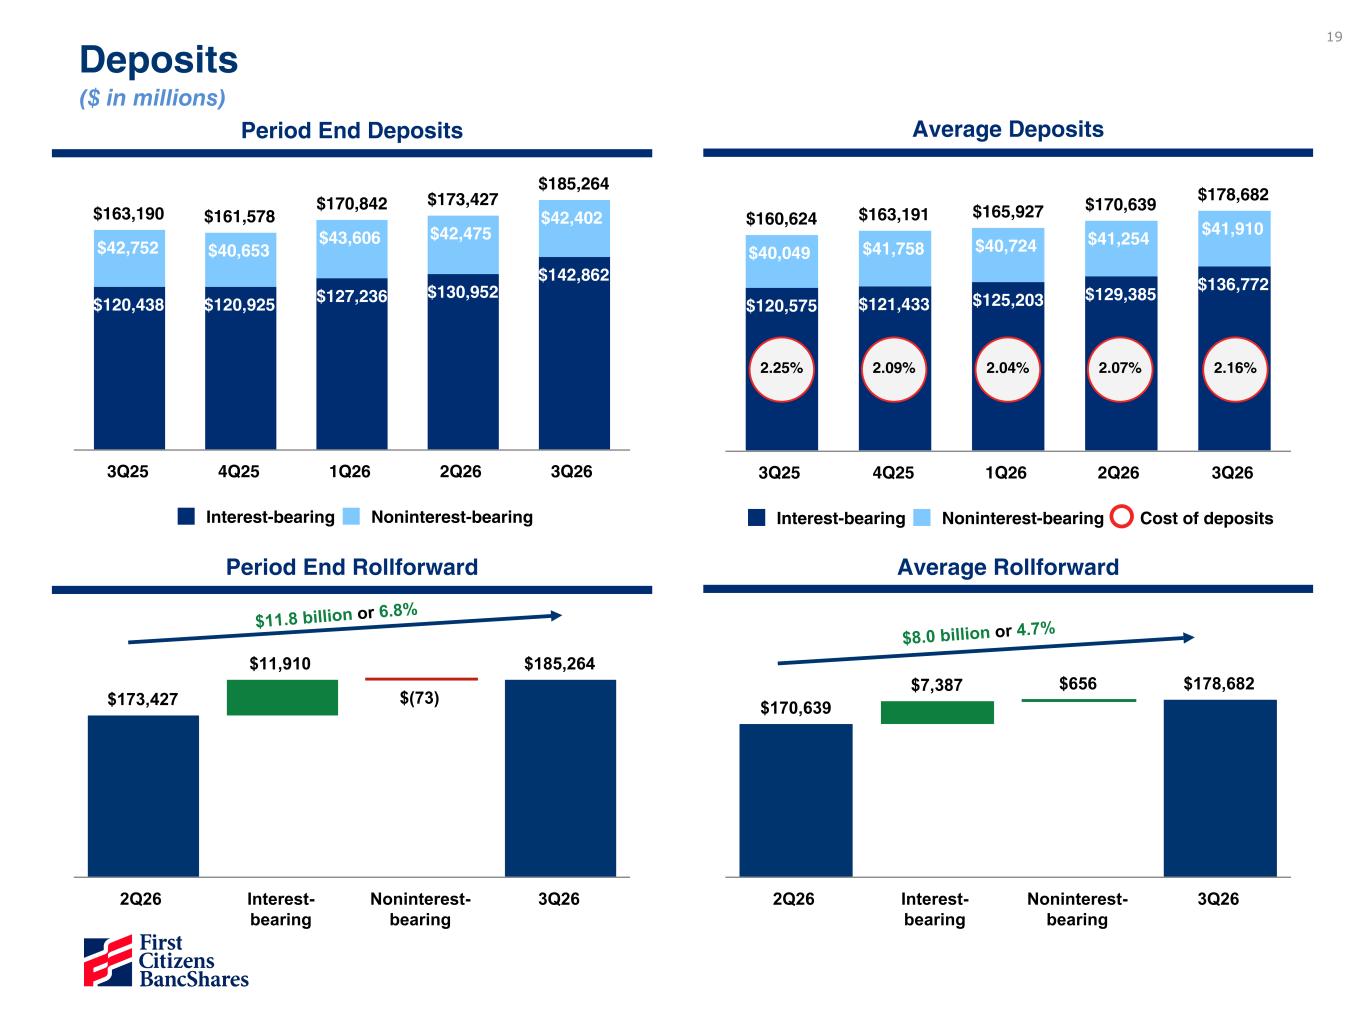
19 $170,639 $7,387 $656 $178,682 2Q26 Interest- bearing Noninterest- bearing 3Q26 $160,624 $163,191 $165,927 $170,639 $178,682 $120,575 $121,433 $125,203 $129,385 $136,772 $40,049 $41,758 $40,724 $41,254 $41,910 Interest-bearing Noninterest-bearing Cost of deposits 3Q25 4Q25 1Q26 2Q26 3Q26 $163,190 $161,578 $170,842 $173,427 $185,264 $120,438 $120,925 $127,236 $130,952 $142,862 $42,752 $40,653 $43,606 $42,475 $42,402 Interest-bearing Noninterest-bearing 3Q25 4Q25 1Q26 2Q26 3Q26 Average RollforwardPeriod End Rollforward Average DepositsPeriod End Deposits $173,427 $11,910 $(73) $185,264 2Q26 Interest- bearing Noninterest- bearing 3Q26 Deposits ($ in millions) 2.09% 2.04% 2.07% 2.16%2.25% $11.8 billion or 6.8% $8.0 billion or 4.7%
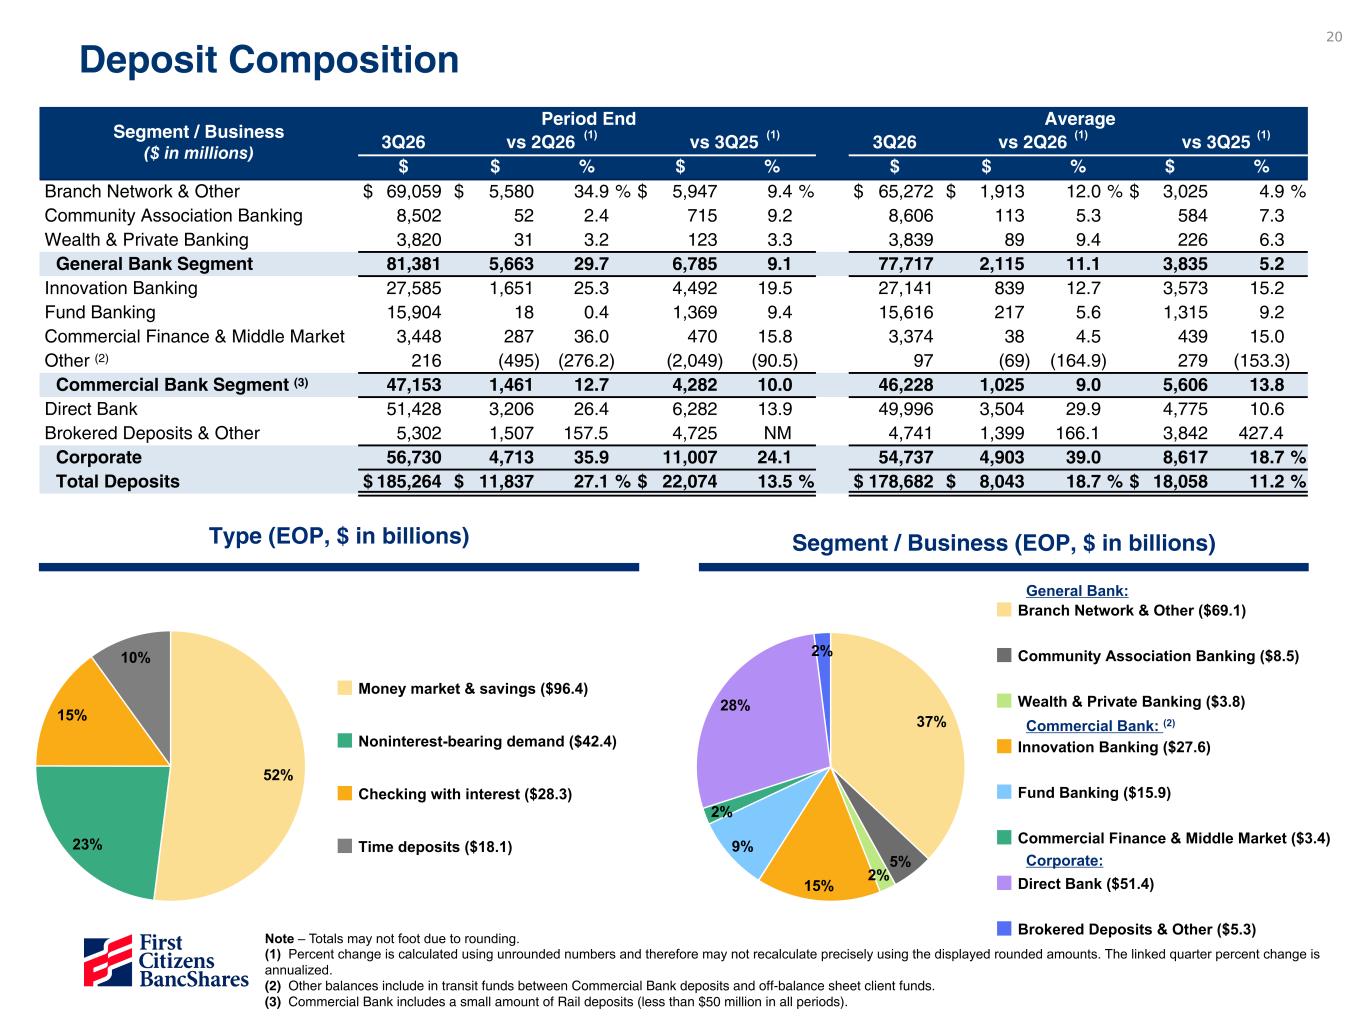
20 52% 23% 15% 10% Money market & savings ($96.4) Noninterest-bearing demand ($42.4) Checking with interest ($28.3) Time deposits ($18.1) 37% 5% 2% 15% 9% 2% 28% 2% Branch Network & Other ($69.1) Community Association Banking ($8.5) Wealth & Private Banking ($3.8) Innovation Banking ($27.6) Fund Banking ($15.9) Commercial Finance & Middle Market ($3.4) Direct Bank ($51.4) Brokered Deposits & Other ($5.3) Segment / Business (EOP, $ in billions)Type (EOP, $ in billions) Commercial Bank: (2) General Bank: Corporate: Deposit Composition Note – Totals may not foot due to rounding. (1) Percent change is calculated using unrounded numbers and therefore may not recalculate precisely using the displayed rounded amounts. The linked quarter percent change is annualized. (2) Other balances include in transit funds between Commercial Bank deposits and off-balance sheet client funds. (3) Commercial Bank includes a small amount of Rail deposits (less than $50 million in all periods). (1) (1)Segment / Business ($ in millions) Period End Average 3Q26 vs 2Q26 vs 3Q25 3Q26 vs 2Q26 vs 3Q25 $ $ % $ % $ $ % $ % Branch Network & Other $ 69,059 $ 5,580 34.9 % $ 5,947 9.4 % $ 65,272 $ 1,913 12.0 % $ 3,025 4.9 % Community Association Banking 8,502 52 2.4 715 9.2 8,606 113 5.3 584 7.3 Wealth & Private Banking 3,820 31 3.2 123 3.3 3,839 89 9.4 226 6.3 General Bank Segment 81,381 5,663 29.7 6,785 9.1 77,717 2,115 11.1 3,835 5.2 Innovation Banking 27,585 1,651 25.3 4,492 19.5 27,141 839 12.7 3,573 15.2 Fund Banking 15,904 18 0.4 1,369 9.4 15,616 217 5.6 1,315 9.2 Commercial Finance & Middle Market 3,448 287 36.0 470 15.8 3,374 38 4.5 439 15.0 Other (2) 216 (495) (276.2) (2,049) (90.5) 97 (69) (164.9) 279 (153.3) Commercial Bank Segment (3) 47,153 1,461 12.7 4,282 10.0 46,228 1,025 9.0 5,606 13.8 Direct Bank 51,428 3,206 26.4 6,282 13.9 49,996 3,504 29.9 4,775 10.6 Brokered Deposits & Other 5,302 1,507 157.5 4,725 NM 4,741 1,399 166.1 3,842 427.4 Corporate 56,730 4,713 35.9 11,007 24.1 54,737 4,903 39.0 8,617 18.7 % Total Deposits $ 185,264 $ 11,837 27.1 % $ 22,074 13.5 % $ 178,682 $ 8,043 18.7 % $ 18,058 11.2 % (1) (1) (1) (1)
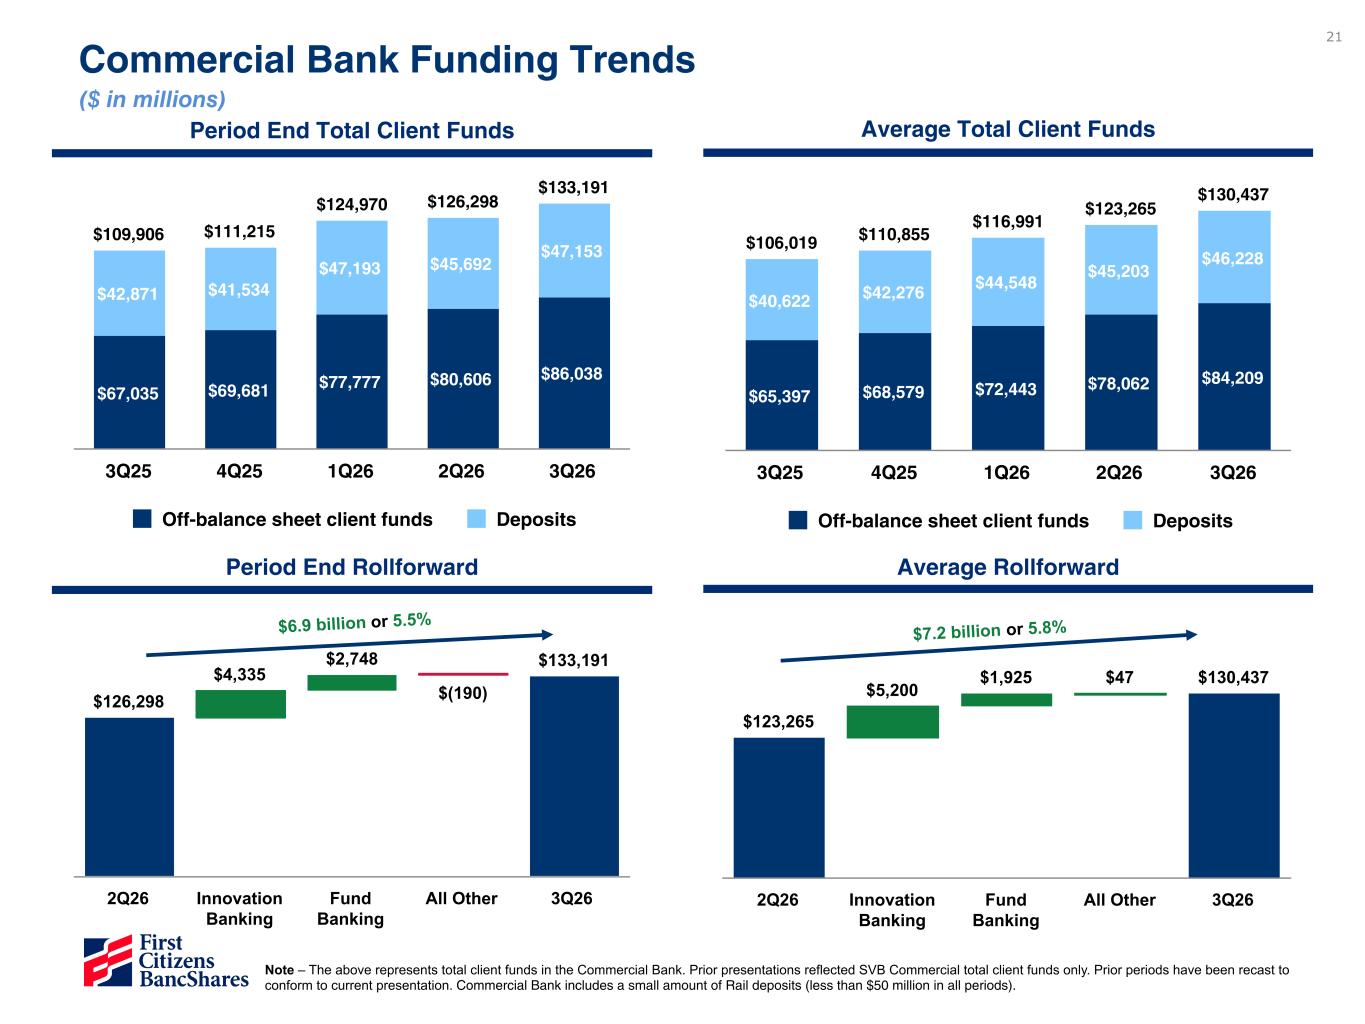
21 $106,019 $110,855 $116,991 $123,265 $130,437 $65,397 $68,579 $72,443 $78,062 $84,209 $40,622 $42,276 $44,548 $45,203 $46,228 Off-balance sheet client funds Deposits 3Q25 4Q25 1Q26 2Q26 3Q26 $109,906 $111,215 $124,970 $126,298 $133,191 $67,035 $69,681 $77,777 $80,606 $86,038 $42,871 $41,534 $47,193 $45,692 $47,153 Off-balance sheet client funds Deposits 3Q25 4Q25 1Q26 2Q26 3Q26 $123,265 $5,200 $1,925 $47 $130,437 2Q26 Innovation Banking Fund Banking All Other 3Q26 $126,298 $4,335 $2,748 $(190) $133,191 2Q26 Innovation Banking Fund Banking All Other 3Q26 Commercial Bank Funding Trends ($ in millions) $6.9 billion or 5.5% $7.2 billion or 5.8% Note – The above represents total client funds in the Commercial Bank. Prior presentations reflected SVB Commercial total client funds only. Prior periods have been recast to conform to current presentation. Commercial Bank includes a small amount of Rail deposits (less than $50 million in all periods). Average Total Client FundsPeriod End Total Client Funds Average RollforwardPeriod End Rollforward
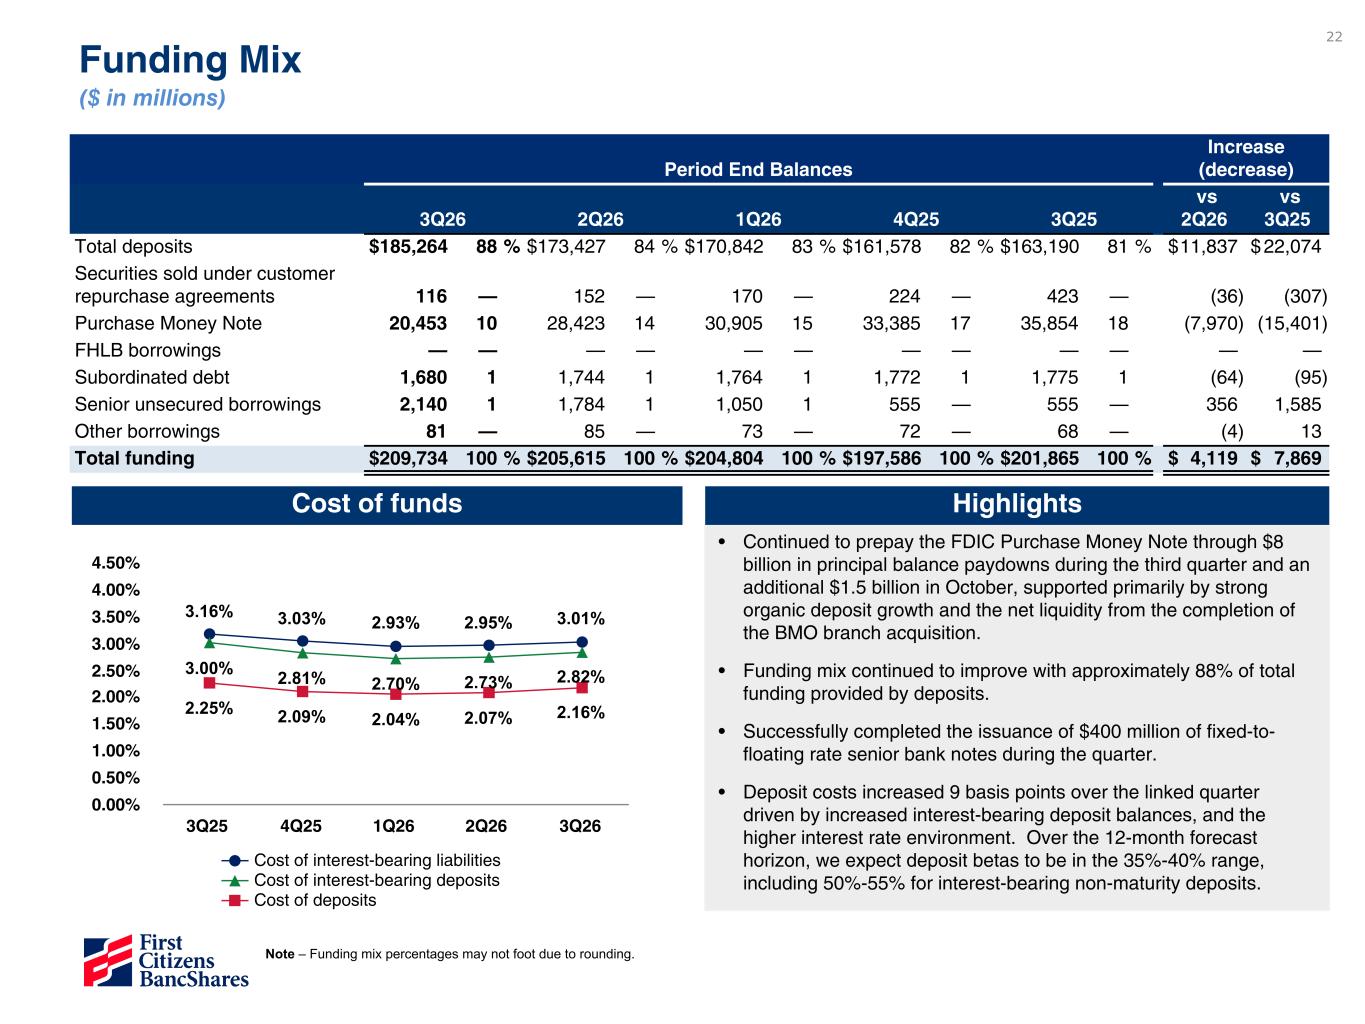
22 3.16% 3.03% 2.93% 2.95% 3.01% 3.00% 2.81% 2.70% 2.73% 2.82% 2.25% 2.09% 2.04% 2.07% 2.16% Cost of interest-bearing liabilities Cost of interest-bearing deposits Cost of deposits 3Q25 4Q25 1Q26 2Q26 3Q26 0.00% 0.50% 1.00% 1.50% 2.00% 2.50% 3.00% 3.50% 4.00% 4.50% Cost of funds Period End Balances Increase (decrease) 3Q26 2Q26 1Q26 4Q25 3Q25 vs 2Q26 vs 3Q25 Total deposits $ 185,264 88 % $ 173,427 84 % $ 170,842 83 % $ 161,578 82 % $ 163,190 81 % $ 11,837 $ 22,074 Securities sold under customer repurchase agreements 116 — 152 — 170 — 224 — 423 — (36) (307) Purchase Money Note 20,453 10 28,423 14 30,905 15 33,385 17 35,854 18 (7,970) (15,401) FHLB borrowings — — — — — — — — — — — — Subordinated debt 1,680 1 1,744 1 1,764 1 1,772 1 1,775 1 (64) (95) Senior unsecured borrowings 2,140 1 1,784 1 1,050 1 555 — 555 — 356 1,585 Other borrowings 81 — 85 — 73 — 72 — 68 — (4) 13 Total funding $ 209,734 100 % $ 205,615 100 % $ 204,804 100 % $ 197,586 100 % $ 201,865 100 % $ 4,119 $ 7,869 Funding Mix ($ in millions) • Continued to prepay the FDIC Purchase Money Note through $8 billion in principal balance paydowns during the third quarter and an additional $1.5 billion in October, supported primarily by strong organic deposit growth and the net liquidity from the completion of the BMO branch acquisition. • Funding mix continued to improve with approximately 88% of total funding provided by deposits. • Successfully completed the issuance of $400 million of fixed-to- floating rate senior bank notes during the quarter. • Deposit costs increased 9 basis points over the linked quarter driven by increased interest-bearing deposit balances, and the higher interest rate environment. Over the 12-month forecast horizon, we expect deposit betas to be in the 35%-40% range, including 50%-55% for interest-bearing non-maturity deposits. Note – Funding mix percentages may not foot due to rounding. Highlights
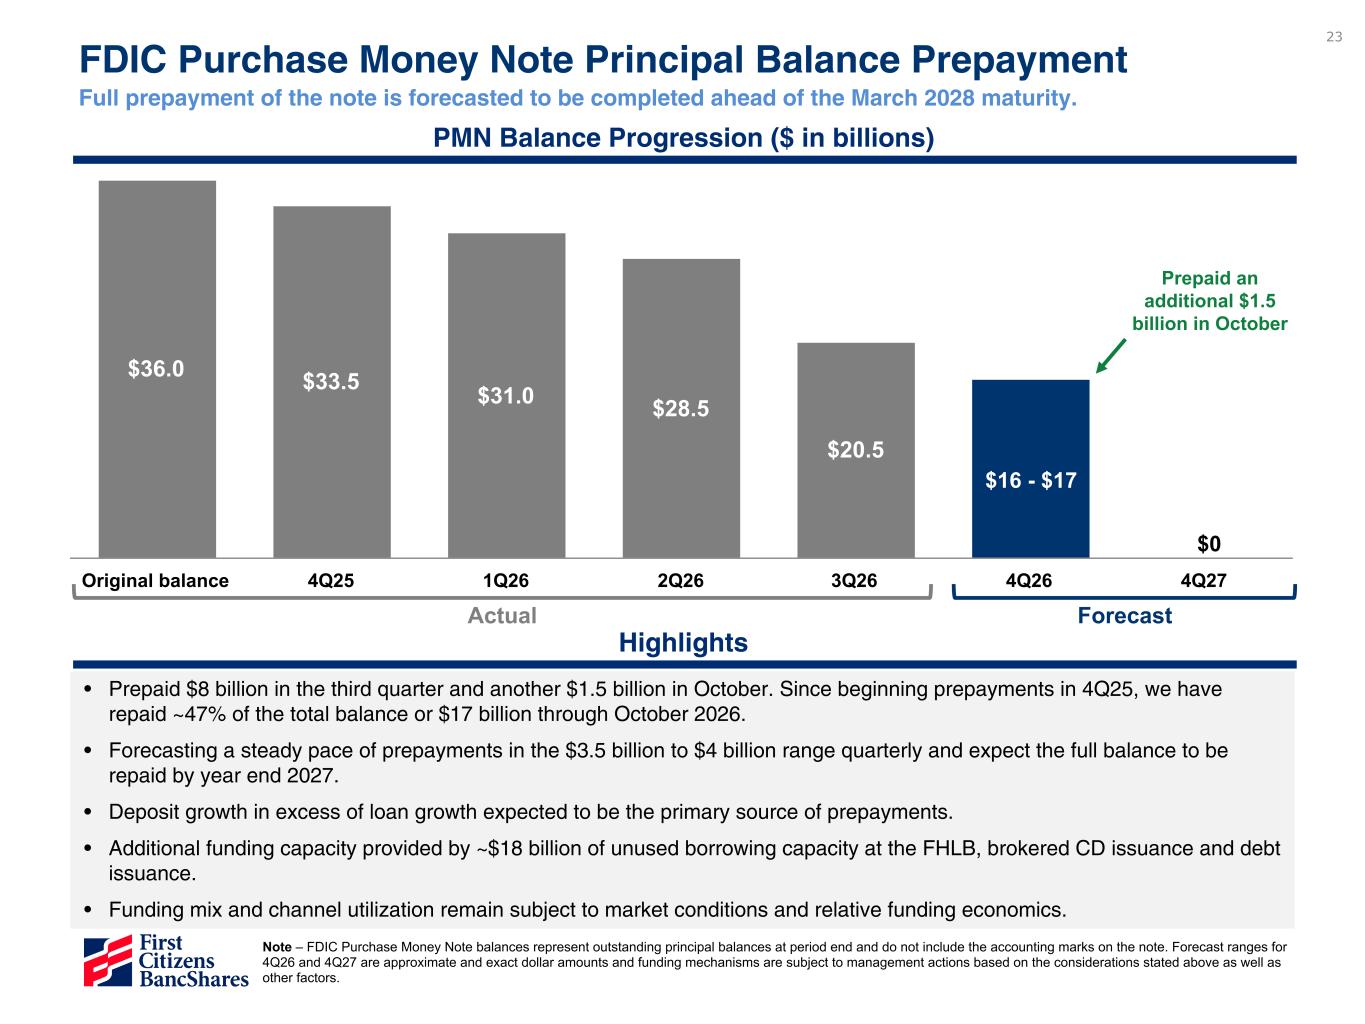
23 FDIC Purchase Money Note Principal Balance Prepayment Full prepayment of the note is forecasted to be completed ahead of the March 2028 maturity. $36.0 $33.5 $31.0 $28.5 $20.5 Original balance 4Q25 1Q26 2Q26 3Q26 4Q26 4Q27 Actual Forecast Highlights • Prepaid $8 billion in the third quarter and another $1.5 billion in October. Since beginning prepayments in 4Q25, we have repaid ~47% of the total balance or $17 billion through October 2026. • Forecasting a steady pace of prepayments in the $3.5 billion to $4 billion range quarterly and expect the full balance to be repaid by year end 2027. • Deposit growth in excess of loan growth expected to be the primary source of prepayments. • Additional funding capacity provided by ~$18 billion of unused borrowing capacity at the FHLB, brokered CD issuance and debt issuance. • Funding mix and channel utilization remain subject to market conditions and relative funding economics. Note – FDIC Purchase Money Note balances represent outstanding principal balances at period end and do not include the accounting marks on the note. Forecast ranges for 4Q26 and 4Q27 are approximate and exact dollar amounts and funding mechanisms are subject to management actions based on the considerations stated above as well as other factors. $16 - $17 PMN Balance Progression ($ in billions) Prepaid an additional $1.5 billion in October $0
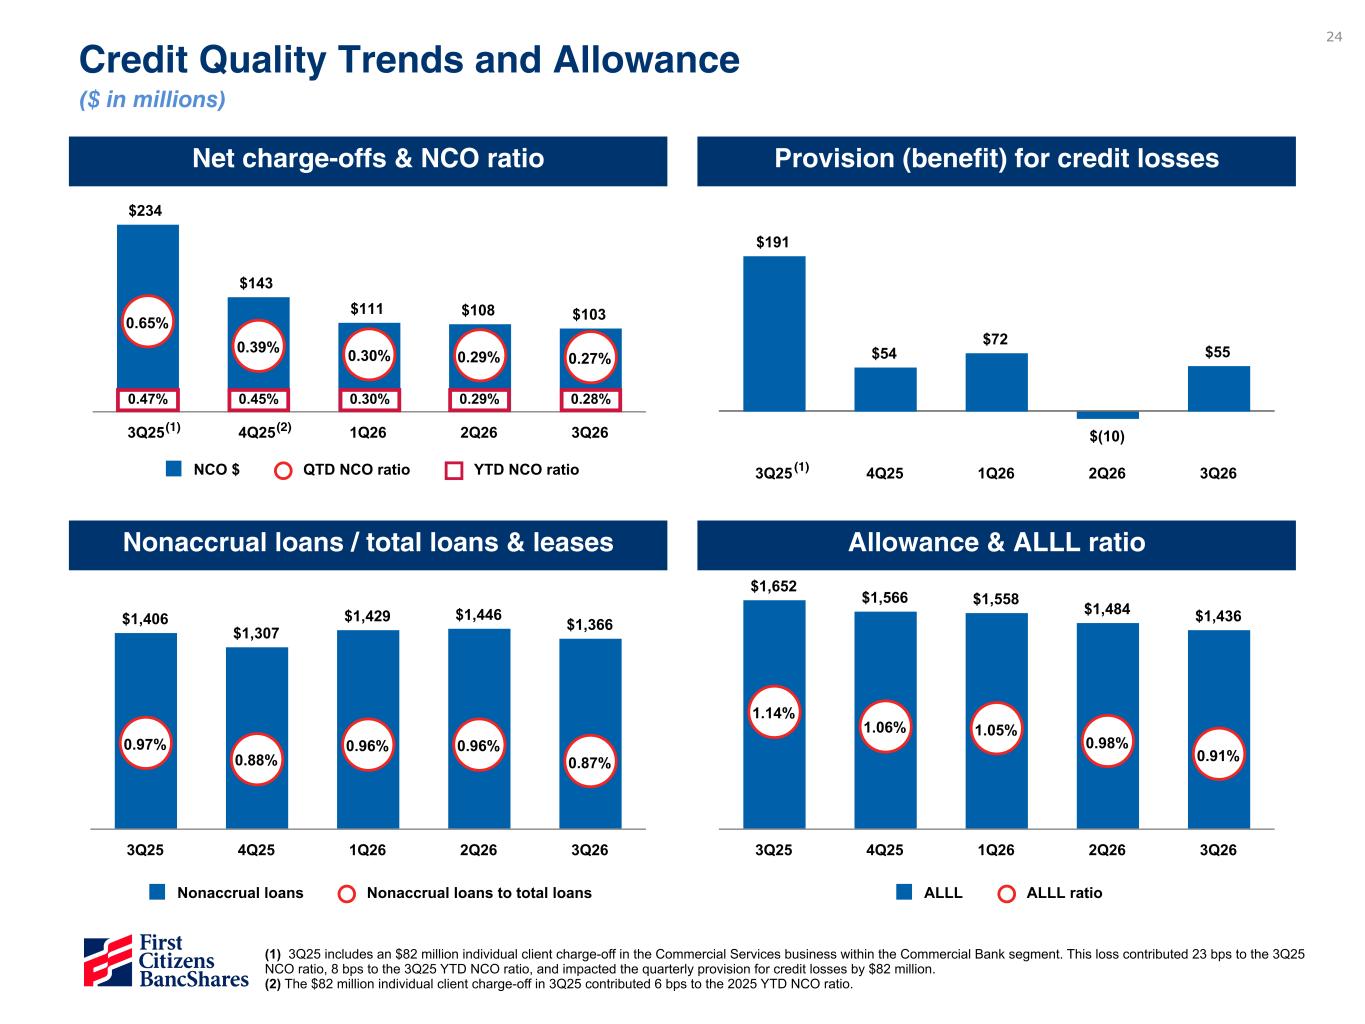
24 $191 $54 $72 $(10) $55 3Q25 4Q25 1Q26 2Q26 3Q26 Credit Quality Trends and Allowance ($ in millions) Net charge-offs & NCO ratio Provision (benefit) for credit losses $234 $143 $111 $108 $1030.65% 0.39% 0.30% 0.29% 0.27% NCO $ QTD NCO ratio YTD NCO ratio 3Q25 4Q25 1Q26 2Q26 3Q26 Nonaccrual loans / total loans & leases Allowance & ALLL ratio $1,652 $1,566 $1,558 $1,484 $1,436 1.14% 1.06% 1.05% 0.98% 0.91% ALLL ALLL ratio 3Q25 4Q25 1Q26 2Q26 3Q26 0.28%0.47% 0.45% 0.30% 0.29% $1,406 $1,307 $1,429 $1,446 $1,366 0.97% 0.88% 0.96% 0.96% 0.87% Nonaccrual loans Nonaccrual loans to total loans 3Q25 4Q25 1Q26 2Q26 3Q26 (1) 3Q25 includes an $82 million individual client charge-off in the Commercial Services business within the Commercial Bank segment. This loss contributed 23 bps to the 3Q25 NCO ratio, 8 bps to the 3Q25 YTD NCO ratio, and impacted the quarterly provision for credit losses by $82 million. (2) The $82 million individual client charge-off in 3Q25 contributed 6 bps to the 2025 YTD NCO ratio. (1) (1) (2)
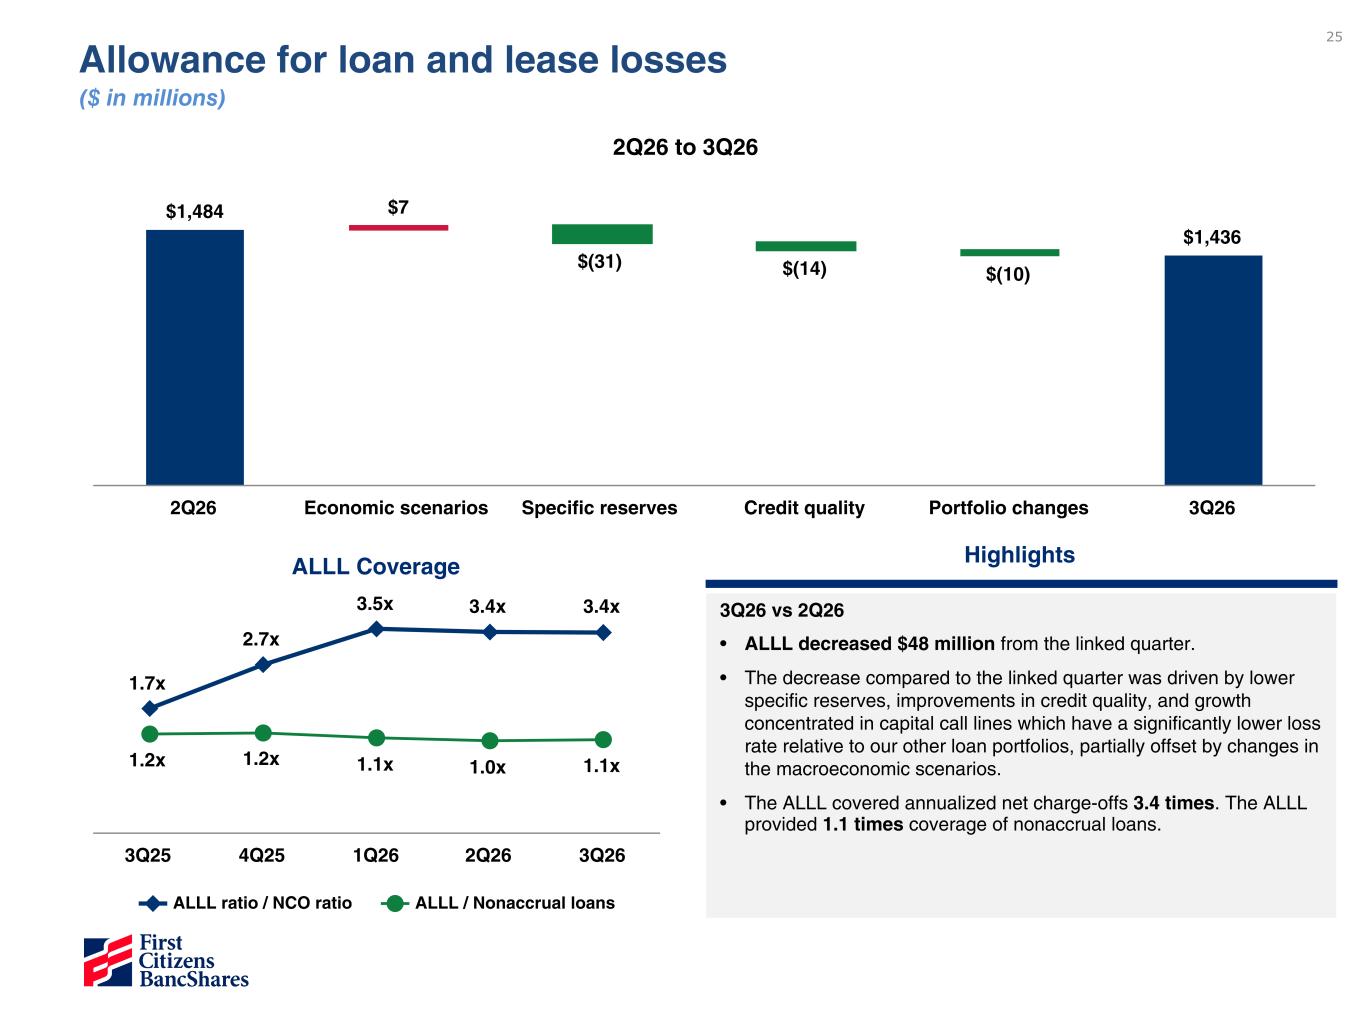
25 $1,484 $7 $(31) $(14) $(10) $1,436 2Q26 Economic scenarios Specific reserves Credit quality Portfolio changes 3Q26 Highlights 3Q26 vs 2Q26 • ALLL decreased $48 million from the linked quarter. • The decrease compared to the linked quarter was driven by lower specific reserves, improvements in credit quality, and growth concentrated in capital call lines which have a significantly lower loss rate relative to our other loan portfolios, partially offset by changes in the macroeconomic scenarios. • The ALLL covered annualized net charge-offs 3.4 times. The ALLL provided 1.1 times coverage of nonaccrual loans. ALLL Coverage 1.7x 2.7x 3.5x 3.4x 3.4x 1.2x 1.2x 1.1x 1.0x 1.1x ALLL ratio / NCO ratio ALLL / Nonaccrual loans 3Q25 4Q25 1Q26 2Q26 3Q26 2Q26 to 3Q26 Allowance for loan and lease losses ($ in millions)
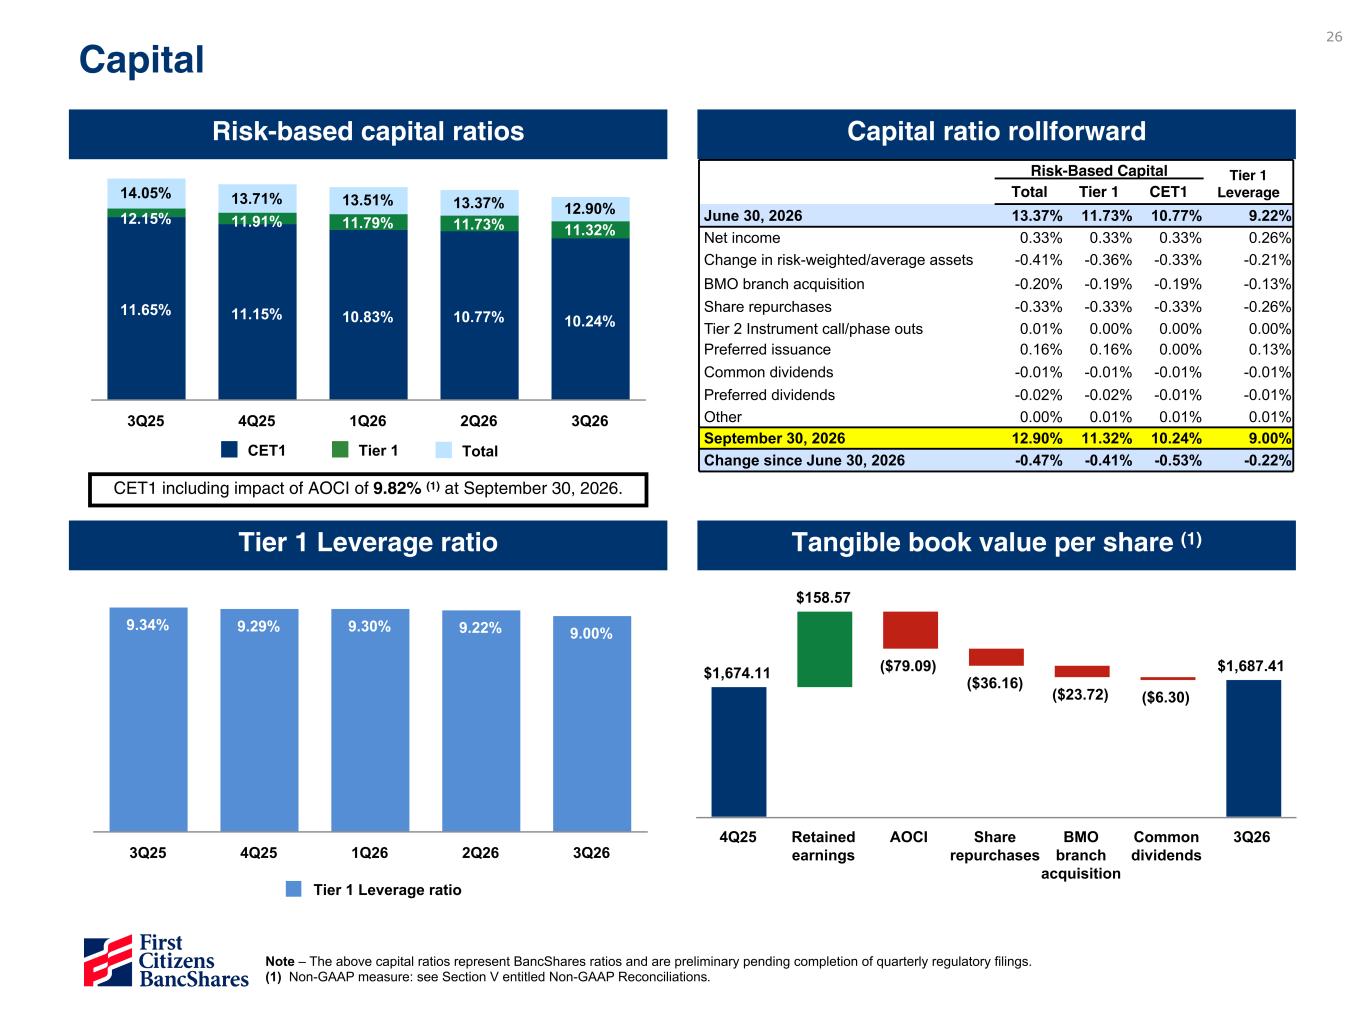
26 Risk-based capital ratios Capital ratio rollforward Tier 1 Leverage ratio Tangible book value per share (1) Capital Risk-Based Capital Tier 1 Leverage Total Tier 1 CET1 June 30, 2026 13.37 % 11.73 % 10.77 % 9.22 % Net income 0.33 % 0.33 % 0.33 % 0.26 % Change in risk-weighted/average assets -0.41 % -0.36 % -0.33 % -0.21 % BMO branch acquisition -0.20 % -0.19 % -0.19 % -0.13 % Share repurchases -0.33 % -0.33 % -0.33 % -0.26 % Tier 2 Instrument call/phase outs 0.01 % 0.00 % 0.00 % 0.00 % Preferred issuance 0.16 % 0.16 % 0.00 % 0.13 % Common dividends -0.01 % -0.01 % -0.01 % -0.01 % Preferred dividends -0.02 % -0.02 % -0.01 % -0.01 % Other 0.00 % 0.01 % 0.01 % 0.01 % September 30, 2026 12.90 % 11.32 % 10.24 % 9.00 % Change since June 30, 2026 -0.47 % -0.41 % -0.53 % -0.22 % 11.65% 11.15% 10.83% 10.77% 10.24% 12.15% 11.91% 11.79% 11.73% 11.32% 14.05% 13.71% 13.51% 13.37% 12.90% 3Q25 4Q25 1Q26 2Q26 3Q26 $1,674.11 $158.57 ($79.09) ($36.16) ($23.72) ($6.30) $1,687.41 4Q25 Retained earnings AOCI Share repurchases BMO branch acquisition Common dividends 3Q26 Note – The above capital ratios represent BancShares ratios and are preliminary pending completion of quarterly regulatory filings. (1) Non-GAAP measure: see Section V entitled Non-GAAP Reconciliations. 9.34% 9.29% 9.30% 9.22% 9.00% Tier 1 Leverage ratio 3Q25 4Q25 1Q26 2Q26 3Q26 CET1 Tier 1 Total CET1 including impact of AOCI of 9.82% (1) at September 30, 2026.
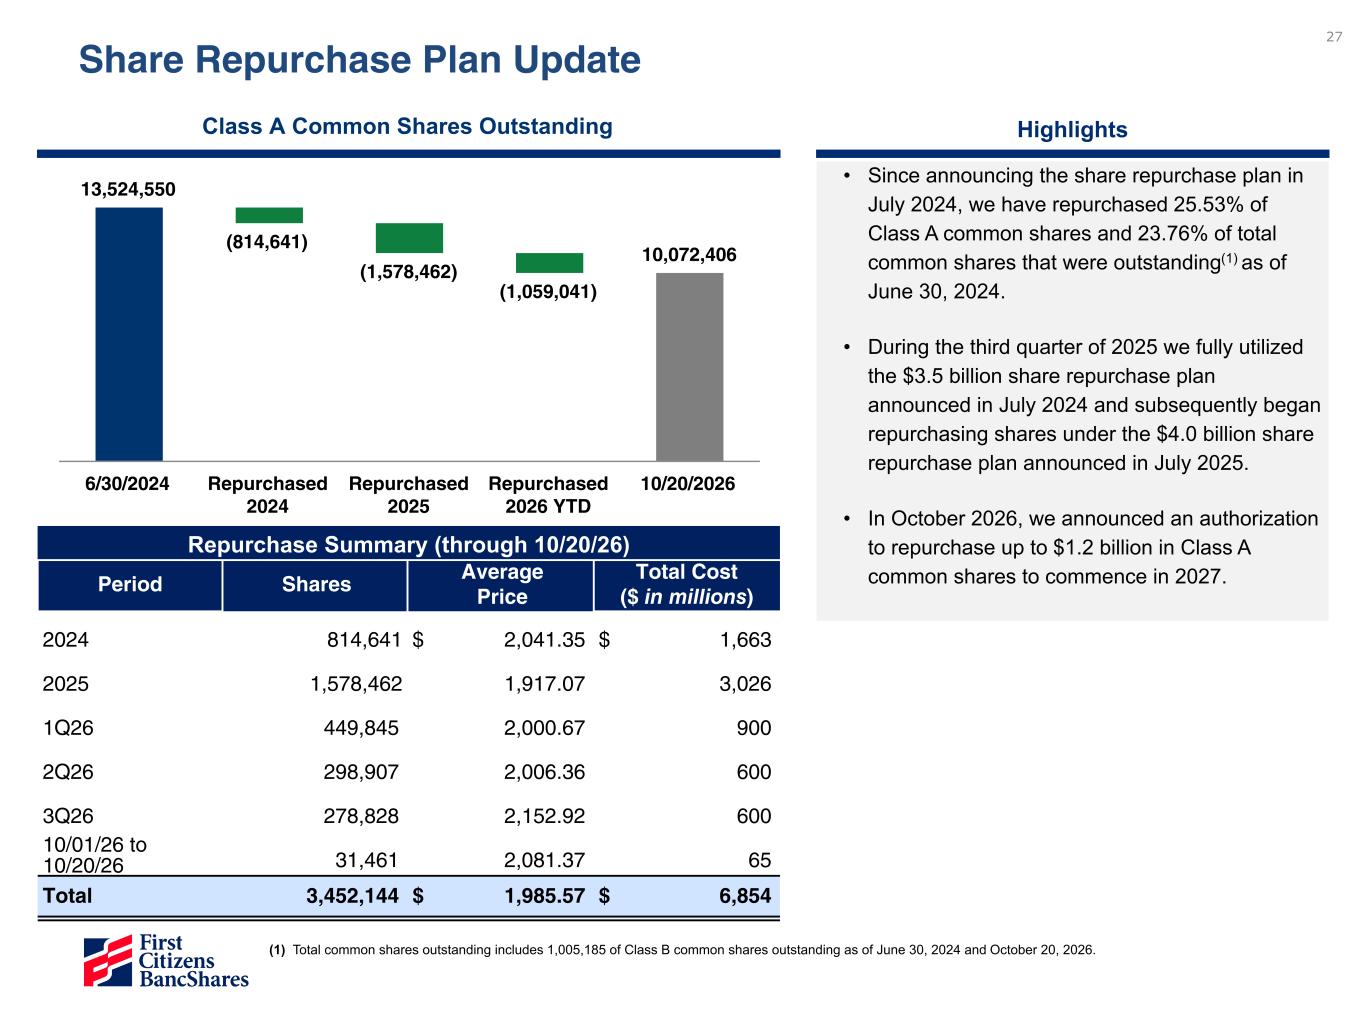
27 Share Repurchase Plan Update • Since announcing the share repurchase plan in July 2024, we have repurchased 25.53% of Class A common shares and 23.76% of total common shares that were outstanding(1) as of June 30, 2024. • During the third quarter of 2025 we fully utilized the $3.5 billion share repurchase plan announced in July 2024 and subsequently began repurchasing shares under the $4.0 billion share repurchase plan announced in July 2025. • In October 2026, we announced an authorization to repurchase up to $1.2 billion in Class A common shares to commence in 2027. Highlights Class A Common Shares Outstanding Repurchase Summary (through 10/20/26) Period Shares Average Price Total Cost ($ in millions) 2024 814,641 $ 2,041.35 $ 1,663 2025 1,578,462 1,917.07 3,026 1Q26 449,845 2,000.67 900 2Q26 298,907 2,006.36 600 3Q26 278,828 2,152.92 600 10/01/26 to 10/20/26 31,461 2,081.37 65 Total 3,452,144 $ 1,985.57 $ 6,854 13,524,550 (814,641) (1,578,462) (1,059,041) 10,072,406 6/30/2024 Repurchased 2024 Repurchased 2025 Repurchased 2026 YTD 10/20/2026 (1) Total common shares outstanding includes 1,005,185 of Class B common shares outstanding as of June 30, 2024 and October 20, 2026.

Financial Outlook Section III
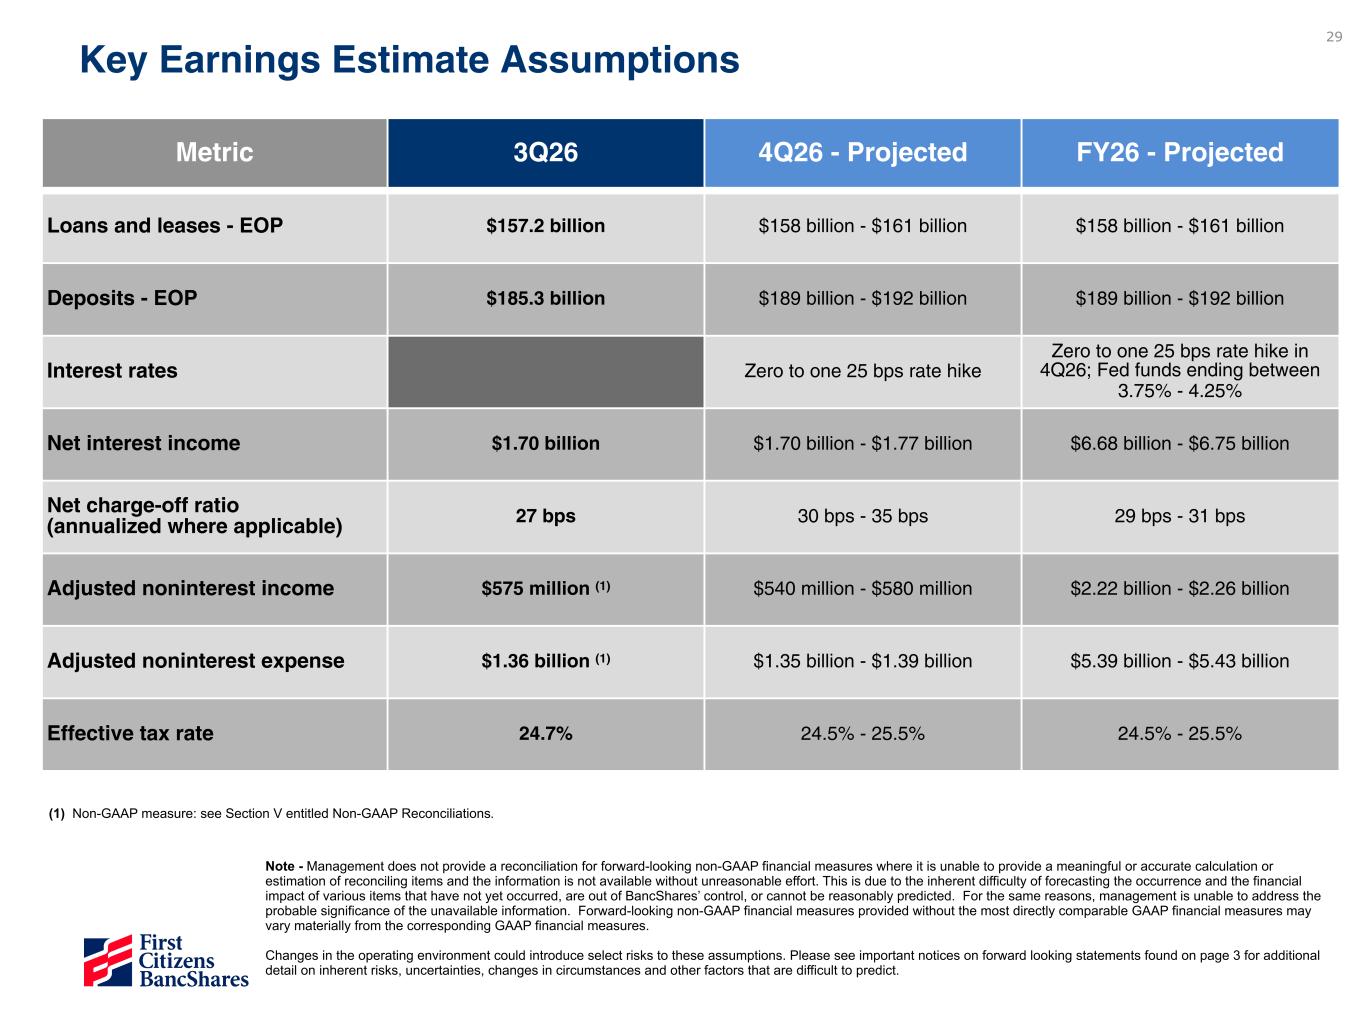
29 Metric 3Q26 4Q26 - Projected FY26 - Projected Loans and leases - EOP $157.2 billion $158 billion - $161 billion $158 billion - $161 billion Deposits - EOP $185.3 billion $189 billion - $192 billion $189 billion - $192 billion Interest rates Zero to one 25 bps rate hike Zero to one 25 bps rate hike in 4Q26; Fed funds ending between 3.75% - 4.25% Net interest income $1.70 billion $1.70 billion - $1.77 billion $6.68 billion - $6.75 billion Net charge-off ratio (annualized where applicable) 27 bps 30 bps - 35 bps 29 bps - 31 bps Adjusted noninterest income $575 million (1) $540 million - $580 million $2.22 billion - $2.26 billion Adjusted noninterest expense $1.36 billion (1) $1.35 billion - $1.39 billion $5.39 billion - $5.43 billion Effective tax rate 24.7% 24.5% - 25.5% 24.5% - 25.5% Key Earnings Estimate Assumptions (1) Non-GAAP measure: see Section V entitled Non-GAAP Reconciliations. Note - Management does not provide a reconciliation for forward-looking non-GAAP financial measures where it is unable to provide a meaningful or accurate calculation or estimation of reconciling items and the information is not available without unreasonable effort. This is due to the inherent difficulty of forecasting the occurrence and the financial impact of various items that have not yet occurred, are out of BancShares’ control, or cannot be reasonably predicted. For the same reasons, management is unable to address the probable significance of the unavailable information. Forward-looking non-GAAP financial measures provided without the most directly comparable GAAP financial measures may vary materially from the corresponding GAAP financial measures. Changes in the operating environment could introduce select risks to these assumptions. Please see important notices on forward looking statements found on page 3 for additional detail on inherent risks, uncertainties, changes in circumstances and other factors that are difficult to predict.

Appendix Section IV
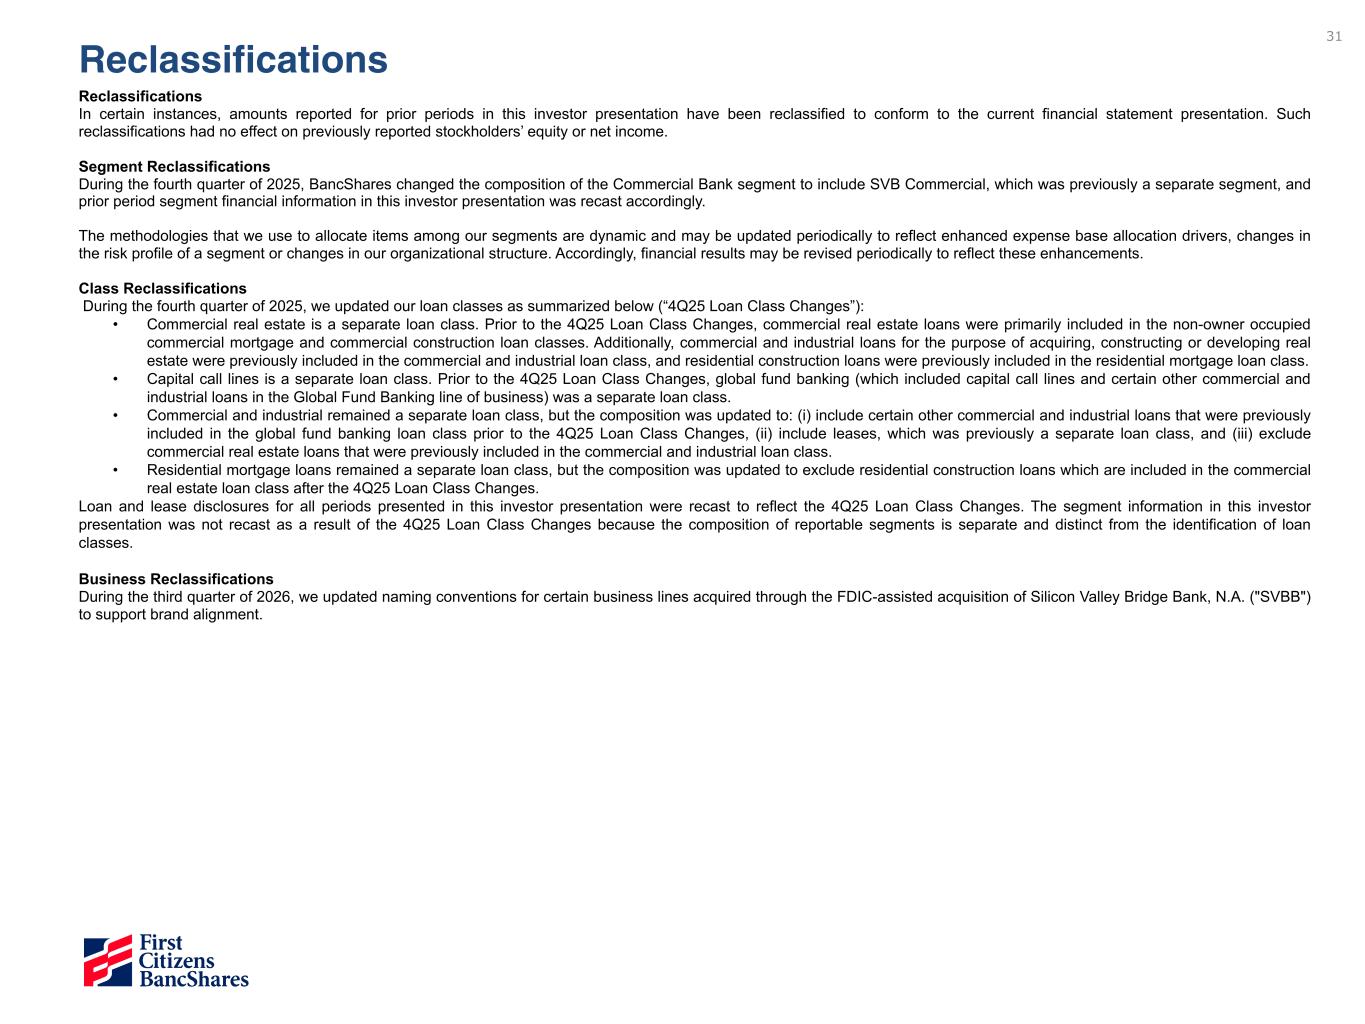
31 Reclassifications In certain instances, amounts reported for prior periods in this investor presentation have been reclassified to conform to the current financial statement presentation. Such reclassifications had no effect on previously reported stockholders’ equity or net income. Segment Reclassifications During the fourth quarter of 2025, BancShares changed the composition of the Commercial Bank segment to include SVB Commercial, which was previously a separate segment, and prior period segment financial information in this investor presentation was recast accordingly. The methodologies that we use to allocate items among our segments are dynamic and may be updated periodically to reflect enhanced expense base allocation drivers, changes in the risk profile of a segment or changes in our organizational structure. Accordingly, financial results may be revised periodically to reflect these enhancements. Class Reclassifications During the fourth quarter of 2025, we updated our loan classes as summarized below (“4Q25 Loan Class Changes”): • Commercial real estate is a separate loan class. Prior to the 4Q25 Loan Class Changes, commercial real estate loans were primarily included in the non-owner occupied commercial mortgage and commercial construction loan classes. Additionally, commercial and industrial loans for the purpose of acquiring, constructing or developing real estate were previously included in the commercial and industrial loan class, and residential construction loans were previously included in the residential mortgage loan class. • Capital call lines is a separate loan class. Prior to the 4Q25 Loan Class Changes, global fund banking (which included capital call lines and certain other commercial and industrial loans in the Global Fund Banking line of business) was a separate loan class. • Commercial and industrial remained a separate loan class, but the composition was updated to: (i) include certain other commercial and industrial loans that were previously included in the global fund banking loan class prior to the 4Q25 Loan Class Changes, (ii) include leases, which was previously a separate loan class, and (iii) exclude commercial real estate loans that were previously included in the commercial and industrial loan class. • Residential mortgage loans remained a separate loan class, but the composition was updated to exclude residential construction loans which are included in the commercial real estate loan class after the 4Q25 Loan Class Changes. Loan and lease disclosures for all periods presented in this investor presentation were recast to reflect the 4Q25 Loan Class Changes. The segment information in this investor presentation was not recast as a result of the 4Q25 Loan Class Changes because the composition of reportable segments is separate and distinct from the identification of loan classes. Business Reclassifications During the third quarter of 2026, we updated naming conventions for certain business lines acquired through the FDIC-assisted acquisition of Silicon Valley Bridge Bank, N.A. ("SVBB") to support brand alignment. Reclassifications
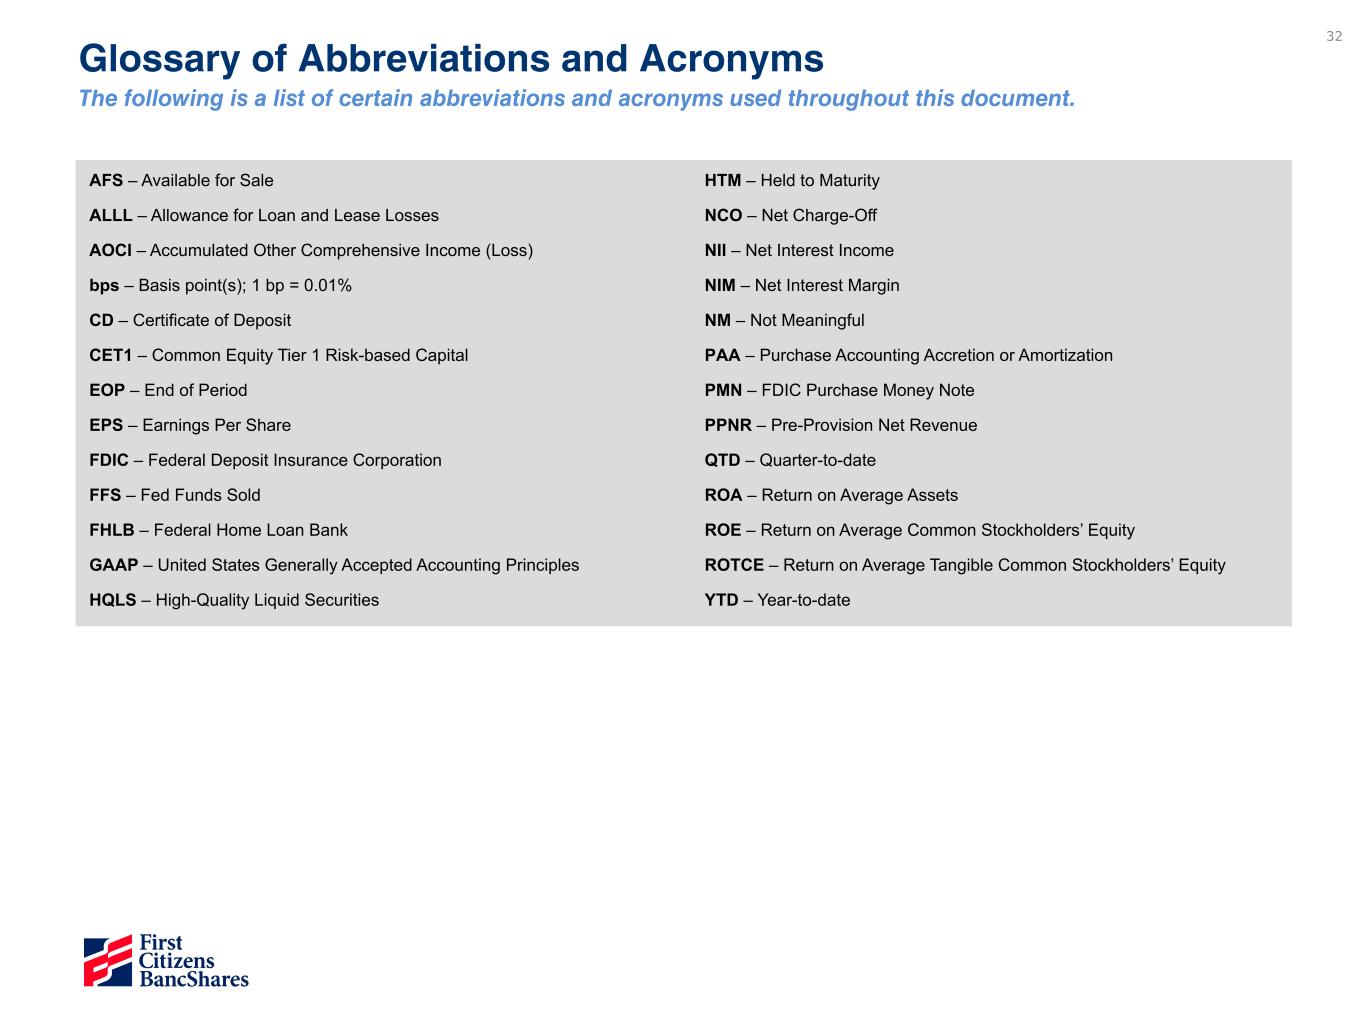
32 Glossary of Abbreviations and Acronyms The following is a list of certain abbreviations and acronyms used throughout this document. AFS – Available for Sale ALLL – Allowance for Loan and Lease Losses AOCI – Accumulated Other Comprehensive Income (Loss) bps – Basis point(s); 1 bp = 0.01% CD – Certificate of Deposit CET1 – Common Equity Tier 1 Risk-based Capital EOP – End of Period EPS – Earnings Per Share FDIC – Federal Deposit Insurance Corporation FFS – Fed Funds Sold FHLB – Federal Home Loan Bank GAAP – United States Generally Accepted Accounting Principles HQLS – High-Quality Liquid Securities HTM – Held to Maturity NCO – Net Charge-Off NII – Net Interest Income NIM – Net Interest Margin NM – Not Meaningful PAA – Purchase Accounting Accretion or Amortization PMN – FDIC Purchase Money Note PPNR – Pre-Provision Net Revenue QTD – Quarter-to-date ROA – Return on Average Assets ROE – Return on Average Common Stockholders’ Equity ROTCE – Return on Average Tangible Common Stockholders’ Equity YTD – Year-to-date
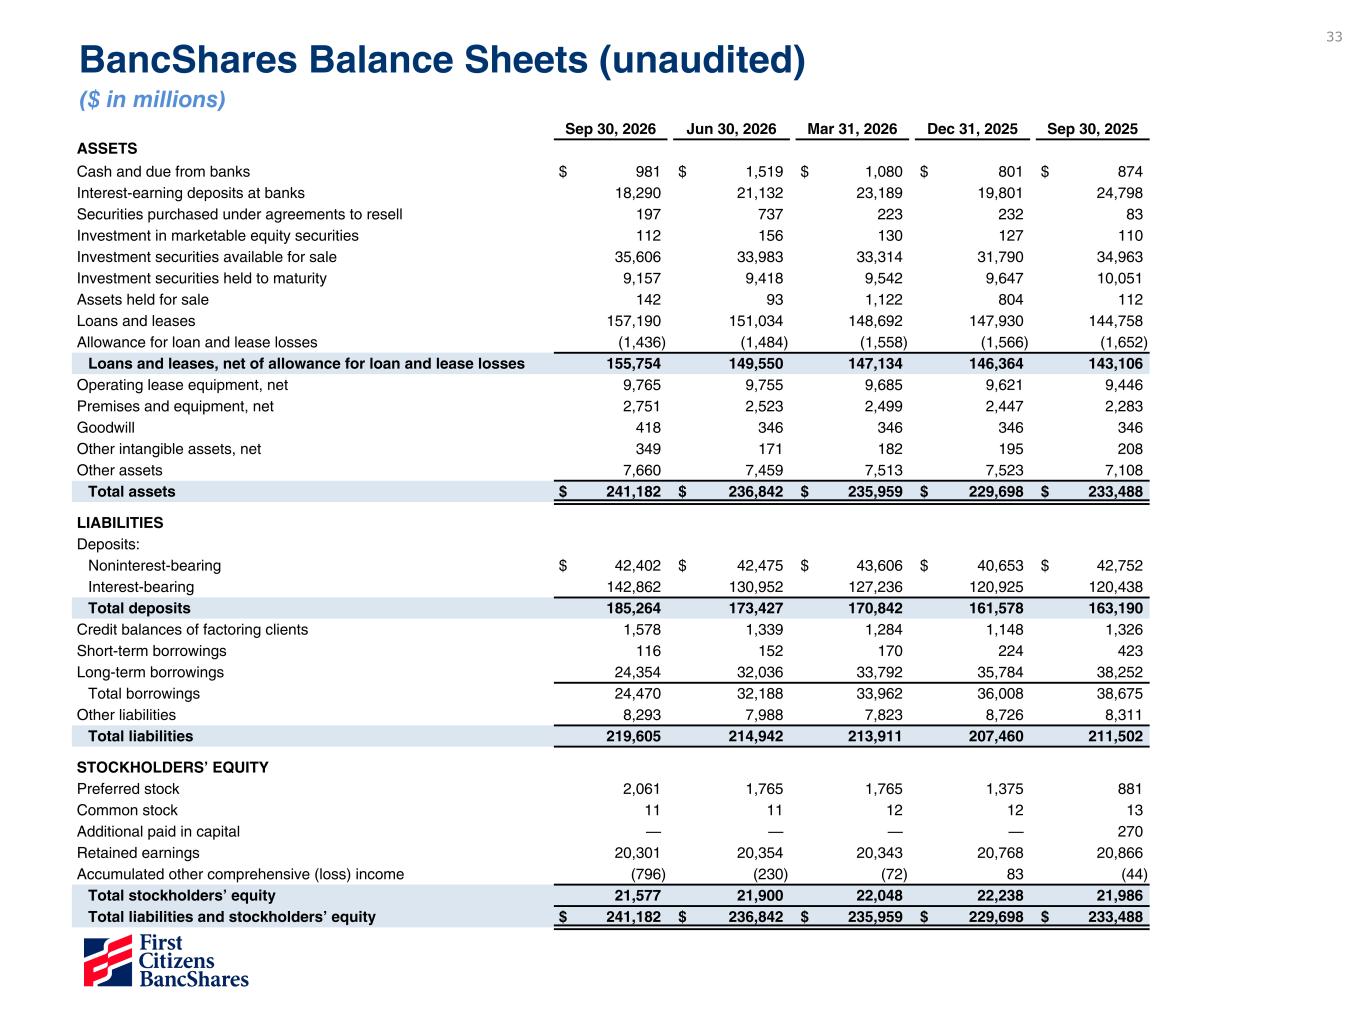
33 Sep 30, 2026 Jun 30, 2026 Mar 31, 2026 Dec 31, 2025 Sep 30, 2025 ASSETS Cash and due from banks $ 981 $ 1,519 $ 1,080 $ 801 $ 874 Interest-earning deposits at banks 18,290 21,132 23,189 19,801 24,798 Securities purchased under agreements to resell 197 737 223 232 83 Investment in marketable equity securities 112 156 130 127 110 Investment securities available for sale 35,606 33,983 33,314 31,790 34,963 Investment securities held to maturity 9,157 9,418 9,542 9,647 10,051 Assets held for sale 142 93 1,122 804 112 Loans and leases 157,190 151,034 148,692 147,930 144,758 Allowance for loan and lease losses (1,436) (1,484) (1,558) (1,566) (1,652) Loans and leases, net of allowance for loan and lease losses 155,754 149,550 147,134 146,364 143,106 Operating lease equipment, net 9,765 9,755 9,685 9,621 9,446 Premises and equipment, net 2,751 2,523 2,499 2,447 2,283 Goodwill 418 346 346 346 346 Other intangible assets, net 349 171 182 195 208 Other assets 7,660 7,459 7,513 7,523 7,108 Total assets $ 241,182 $ 236,842 $ 235,959 $ 229,698 $ 233,488 LIABILITIES Deposits: Noninterest-bearing $ 42,402 $ 42,475 $ 43,606 $ 40,653 $ 42,752 Interest-bearing 142,862 130,952 127,236 120,925 120,438 Total deposits 185,264 173,427 170,842 161,578 163,190 Credit balances of factoring clients 1,578 1,339 1,284 1,148 1,326 Short-term borrowings 116 152 170 224 423 Long-term borrowings 24,354 32,036 33,792 35,784 38,252 Total borrowings 24,470 32,188 33,962 36,008 38,675 Other liabilities 8,293 7,988 7,823 8,726 8,311 Total liabilities 219,605 214,942 213,911 207,460 211,502 STOCKHOLDERS’ EQUITY Preferred stock 2,061 1,765 1,765 1,375 881 Common stock 11 11 12 12 13 Additional paid in capital — — — — 270 Retained earnings 20,301 20,354 20,343 20,768 20,866 Accumulated other comprehensive (loss) income (796) (230) (72) 83 (44) Total stockholders’ equity 21,577 21,900 22,048 22,238 21,986 Total liabilities and stockholders’ equity $ 241,182 $ 236,842 $ 235,959 $ 229,698 $ 233,488 BancShares Balance Sheets (unaudited) ($ in millions)
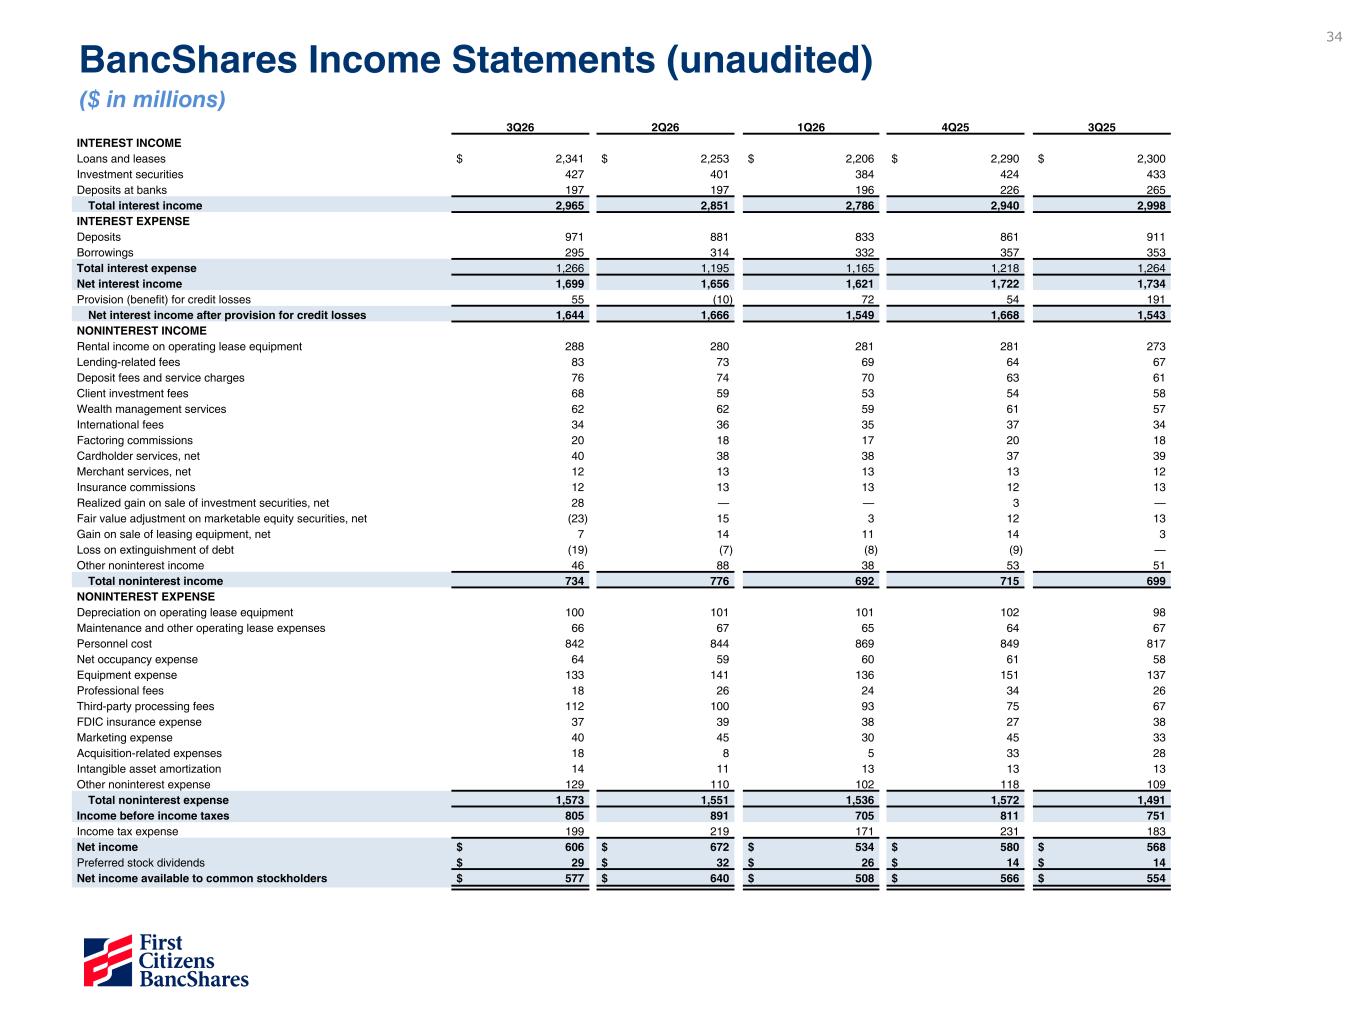
34 3Q26 2Q26 1Q26 4Q25 3Q25 INTEREST INCOME Loans and leases $ 2,341 $ 2,253 $ 2,206 $ 2,290 $ 2,300 Investment securities 427 401 384 424 433 Deposits at banks 197 197 196 226 265 Total interest income 2,965 2,851 2,786 2,940 2,998 INTEREST EXPENSE Deposits 971 881 833 861 911 Borrowings 295 314 332 357 353 Total interest expense 1,266 1,195 1,165 1,218 1,264 Net interest income 1,699 1,656 1,621 1,722 1,734 Provision (benefit) for credit losses 55 (10) 72 54 191 Net interest income after provision for credit losses 1,644 1,666 1,549 1,668 1,543 NONINTEREST INCOME Rental income on operating lease equipment 288 280 281 281 273 Lending-related fees 83 73 69 64 67 Deposit fees and service charges 76 74 70 63 61 Client investment fees 68 59 53 54 58 Wealth management services 62 62 59 61 57 International fees 34 36 35 37 34 Factoring commissions 20 18 17 20 18 Cardholder services, net 40 38 38 37 39 Merchant services, net 12 13 13 13 12 Insurance commissions 12 13 13 12 13 Realized gain on sale of investment securities, net 28 — — 3 — Fair value adjustment on marketable equity securities, net (23) 15 3 12 13 Gain on sale of leasing equipment, net 7 14 11 14 3 Loss on extinguishment of debt (19) (7) (8) (9) — Other noninterest income 46 88 38 53 51 Total noninterest income 734 776 692 715 699 NONINTEREST EXPENSE Depreciation on operating lease equipment 100 101 101 102 98 Maintenance and other operating lease expenses 66 67 65 64 67 Personnel cost 842 844 869 849 817 Net occupancy expense 64 59 60 61 58 Equipment expense 133 141 136 151 137 Professional fees 18 26 24 34 26 Third-party processing fees 112 100 93 75 67 FDIC insurance expense 37 39 38 27 38 Marketing expense 40 45 30 45 33 Acquisition-related expenses 18 8 5 33 28 Intangible asset amortization 14 11 13 13 13 Other noninterest expense 129 110 102 118 109 Total noninterest expense 1,573 1,551 1,536 1,572 1,491 Income before income taxes 805 891 705 811 751 Income tax expense 199 219 171 231 183 Net income $ 606 $ 672 $ 534 $ 580 $ 568 Preferred stock dividends $ 29 $ 32 $ 26 $ 14 $ 14 Net income available to common stockholders $ 577 $ 640 $ 508 $ 566 $ 554 BancShares Income Statements (unaudited) ($ in millions)
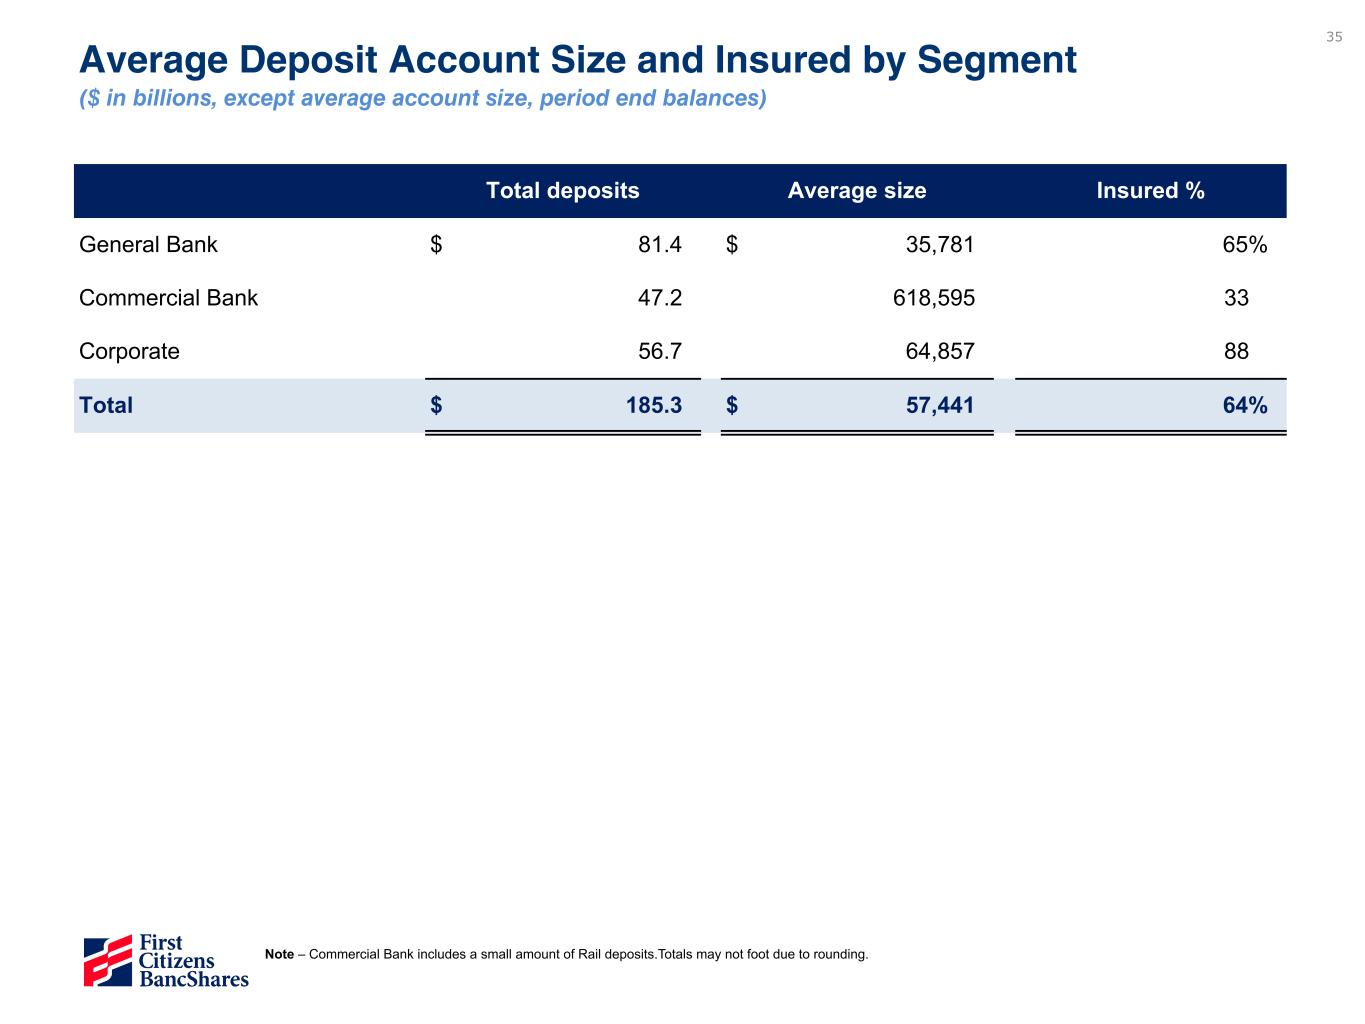
35 Average Deposit Account Size and Insured by Segment ($ in billions, except average account size, period end balances) Total deposits Average size Insured % General Bank $ 81.4 $ 35,781 65 % Commercial Bank 47.2 618,595 33 Corporate 56.7 64,857 88 Total $ 185.3 $ 57,441 64 % Note – Commercial Bank includes a small amount of Rail deposits.Totals may not foot due to rounding.
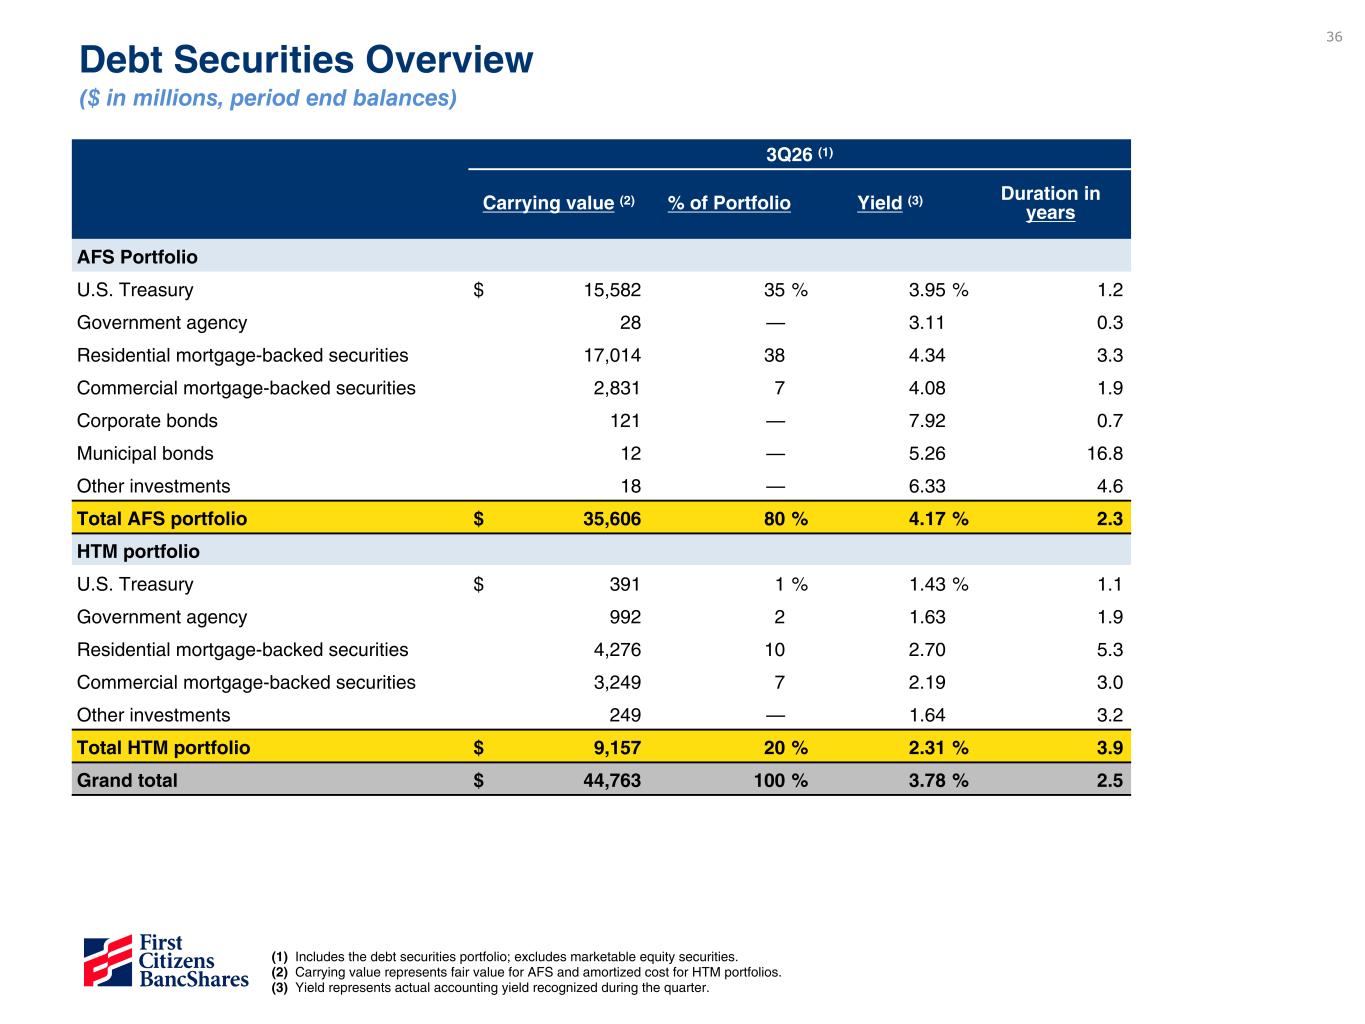
36 (1) 3Q26 (1) Carrying value (2) % of Portfolio Yield (3) Duration in years AFS Portfolio U.S. Treasury $ 15,582 35 % 3.95 % 1.2 Government agency 28 — 3.11 0.3 Residential mortgage-backed securities 17,014 38 4.34 3.3 Commercial mortgage-backed securities 2,831 7 4.08 1.9 Corporate bonds 121 — 7.92 0.7 Municipal bonds 12 — 5.26 16.8 Other investments 18 — 6.33 4.6 Total AFS portfolio $ 35,606 80 % 4.17 % 2.3 HTM portfolio U.S. Treasury $ 391 1 % 1.43 % 1.1 Government agency 992 2 1.63 1.9 Residential mortgage-backed securities 4,276 10 2.70 5.3 Commercial mortgage-backed securities 3,249 7 2.19 3.0 Other investments 249 — 1.64 3.2 Total HTM portfolio $ 9,157 20 % 2.31 % 3.9 Grand total $ 44,763 100 % 3.78 % 2.5 Debt Securities Overview ($ in millions, period end balances) (1) Includes the debt securities portfolio; excludes marketable equity securities. (2) Carrying value represents fair value for AFS and amortized cost for HTM portfolios. (3) Yield represents actual accounting yield recognized during the quarter.
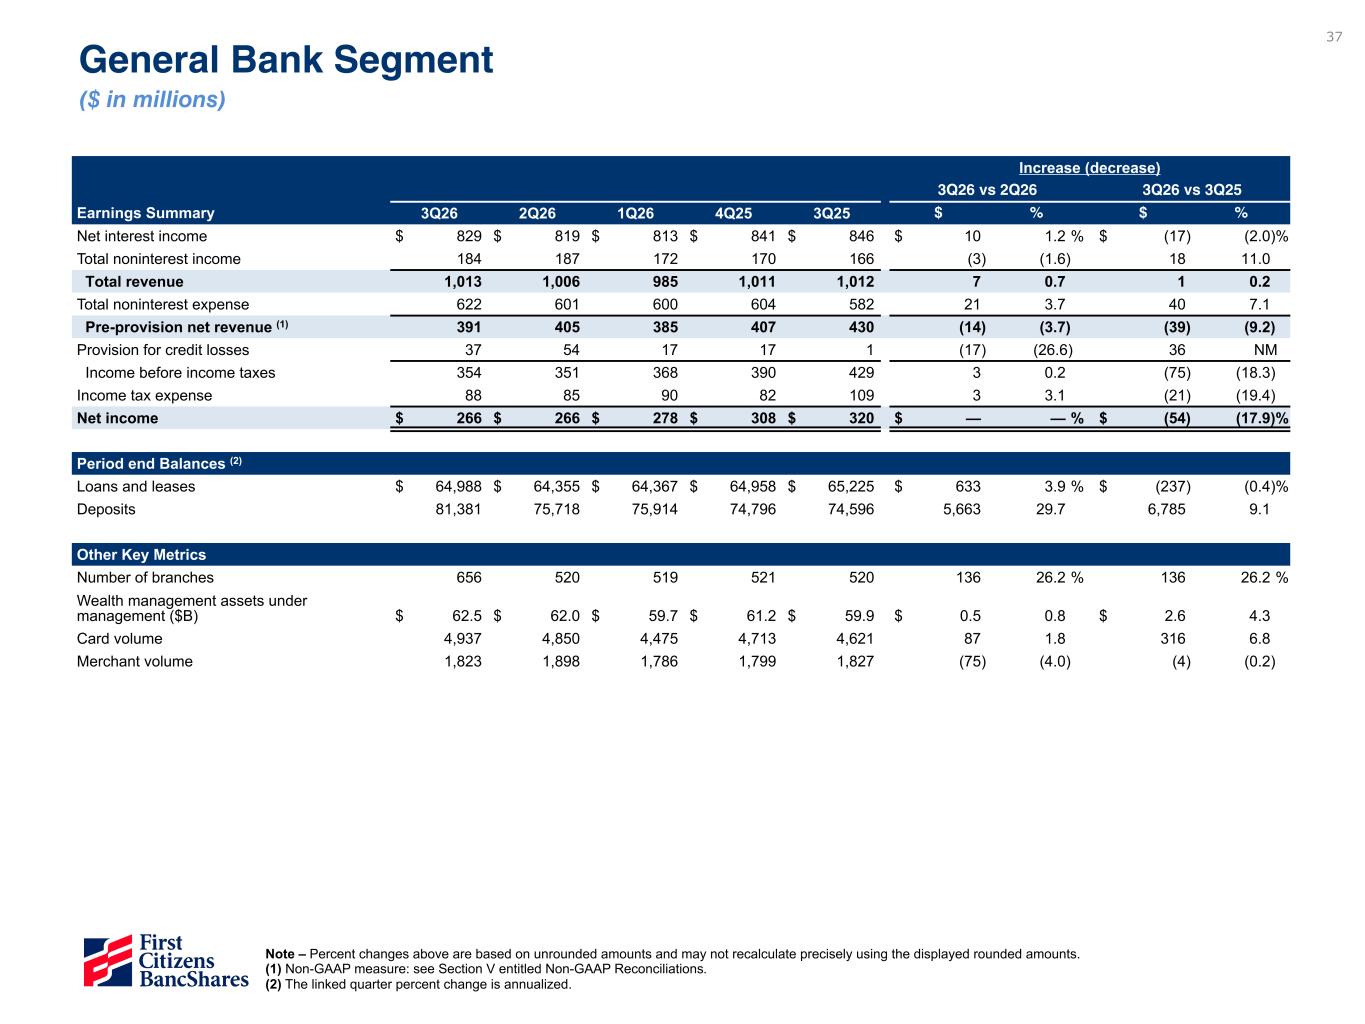
37 General Bank Segment ($ in millions) Note – Percent changes above are based on unrounded amounts and may not recalculate precisely using the displayed rounded amounts. (1) Non-GAAP measure: see Section V entitled Non-GAAP Reconciliations. (2) The linked quarter percent change is annualized. Increase (decrease) 3Q26 vs 2Q26 3Q26 vs 3Q25 Earnings Summary 3Q26 2Q26 1Q26 4Q25 3Q25 $ % $ % Net interest income $ 829 $ 819 $ 813 $ 841 $ 846 $ 10 1.2 % $ (17) (2.0) % Total noninterest income 184 187 172 170 166 (3) (1.6) 18 11.0 Total revenue 1,013 1,006 985 1,011 1,012 7 0.7 1 0.2 Total noninterest expense 622 601 600 604 582 21 3.7 40 7.1 Pre-provision net revenue (1) 391 405 385 407 430 (14) (3.7) (39) (9.2) Provision for credit losses 37 54 17 17 1 (17) (26.6) 36 NM Income before income taxes 354 351 368 390 429 3 0.2 (75) (18.3) Income tax expense 88 85 90 82 109 3 3.1 (21) (19.4) Net income $ 266 $ 266 $ 278 $ 308 $ 320 $ — — % $ (54) (17.9) % Period end Balances (2) Loans and leases $ 64,988 $ 64,355 $ 64,367 $ 64,958 $ 65,225 $ 633 3.9 % $ (237) (0.4) % Deposits 81,381 75,718 75,914 74,796 74,596 5,663 29.7 6,785 9.1 Other Key Metrics Number of branches 656 520 519 521 520 136 26.2 % 136 26.2 % Wealth management assets under management ($B) $ 62.5 $ 62.0 $ 59.7 $ 61.2 $ 59.9 $ 0.5 0.8 $ 2.6 4.3 Card volume 4,937 4,850 4,475 4,713 4,621 87 1.8 316 6.8 Merchant volume 1,823 1,898 1,786 1,799 1,827 (75) (4.0) (4) (0.2)
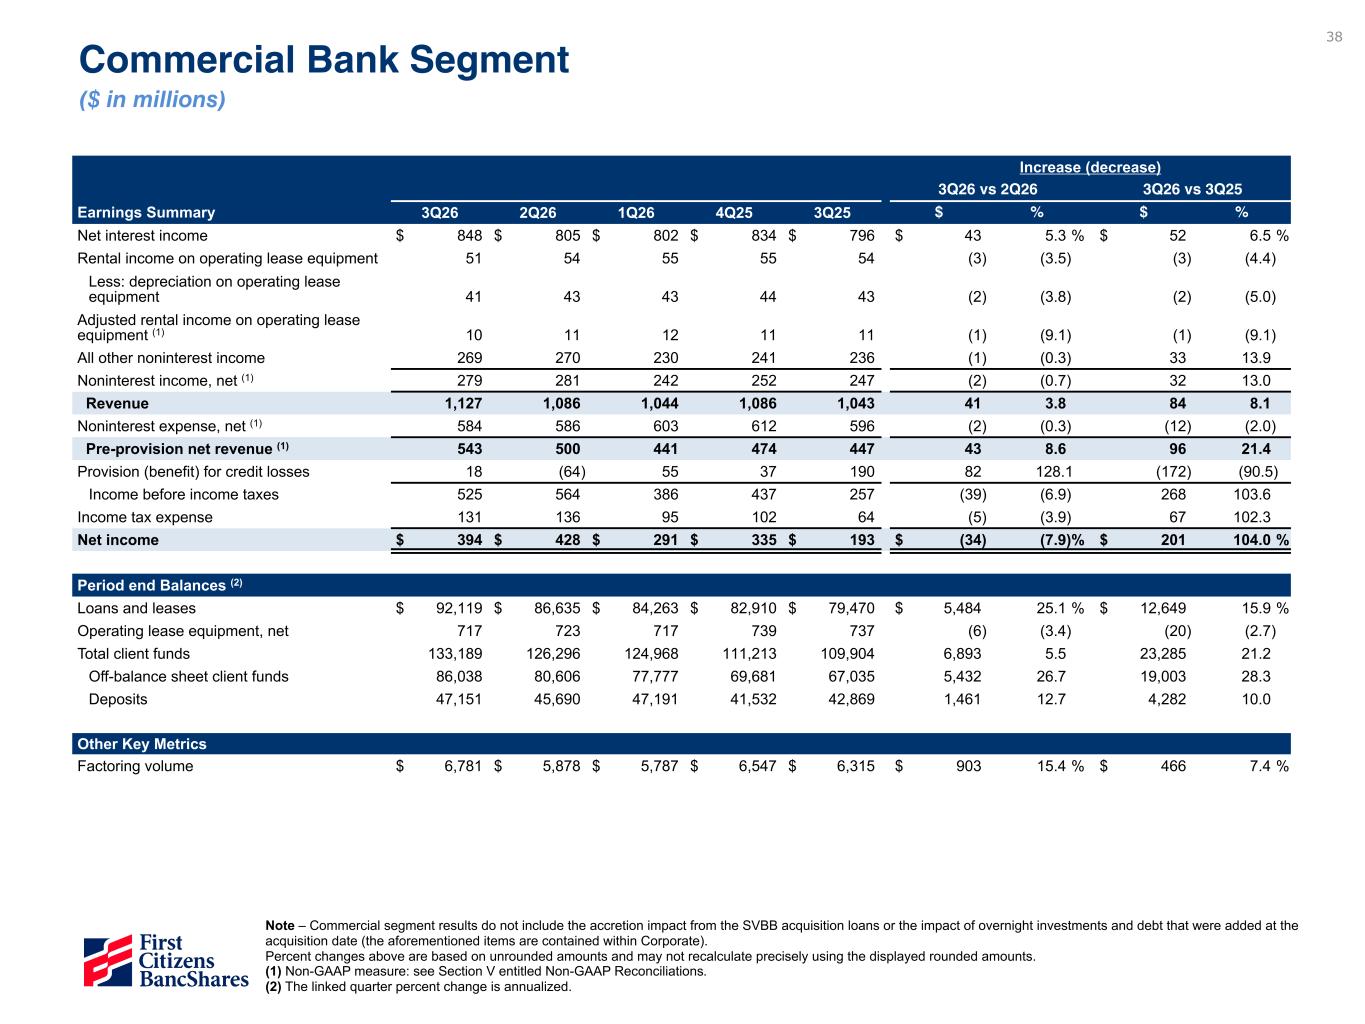
38 Increase (decrease) 3Q26 vs 2Q26 3Q26 vs 3Q25 Earnings Summary 3Q26 2Q26 1Q26 4Q25 3Q25 $ % $ % Net interest income $ 848 $ 805 $ 802 $ 834 $ 796 $ 43 5.3 % $ 52 6.5 % Rental income on operating lease equipment 51 54 55 55 54 (3) (3.5) (3) (4.4) Less: depreciation on operating lease equipment 41 43 43 44 43 (2) (3.8) (2) (5.0) Adjusted rental income on operating lease equipment (1) 10 11 12 11 11 (1) (9.1) (1) (9.1) All other noninterest income 269 270 230 241 236 (1) (0.3) 33 13.9 Noninterest income, net (1) 279 281 242 252 247 (2) (0.7) 32 13.0 Revenue 1,127 1,086 1,044 1,086 1,043 41 3.8 84 8.1 Noninterest expense, net (1) 584 586 603 612 596 (2) (0.3) (12) (2.0) Pre-provision net revenue (1) 543 500 441 474 447 43 8.6 96 21.4 Provision (benefit) for credit losses 18 (64) 55 37 190 82 128.1 (172) (90.5) Income before income taxes 525 564 386 437 257 (39) (6.9) 268 103.6 Income tax expense 131 136 95 102 64 (5) (3.9) 67 102.3 Net income $ 394 $ 428 $ 291 $ 335 $ 193 $ (34) (7.9) % $ 201 104.0 % Period end Balances (2) Loans and leases $ 92,119 $ 86,635 $ 84,263 $ 82,910 $ 79,470 $ 5,484 25.1 % $ 12,649 15.9 % Operating lease equipment, net 717 723 717 739 737 (6) (3.4) (20) (2.7) Total client funds 133,189 126,296 124,968 111,213 109,904 6,893 5.5 23,285 21.2 Off-balance sheet client funds 86,038 80,606 77,777 69,681 67,035 5,432 26.7 19,003 28.3 Deposits 47,151 45,690 47,191 41,532 42,869 1,461 12.7 4,282 10.0 Other Key Metrics Factoring volume $ 6,781 $ 5,878 $ 5,787 $ 6,547 $ 6,315 $ 903 15.4 % $ 466 7.4 % Commercial Bank Segment ($ in millions) Note – Commercial segment results do not include the accretion impact from the SVBB acquisition loans or the impact of overnight investments and debt that were added at the acquisition date (the aforementioned items are contained within Corporate). Percent changes above are based on unrounded amounts and may not recalculate precisely using the displayed rounded amounts. (1) Non-GAAP measure: see Section V entitled Non-GAAP Reconciliations. (2) The linked quarter percent change is annualized.
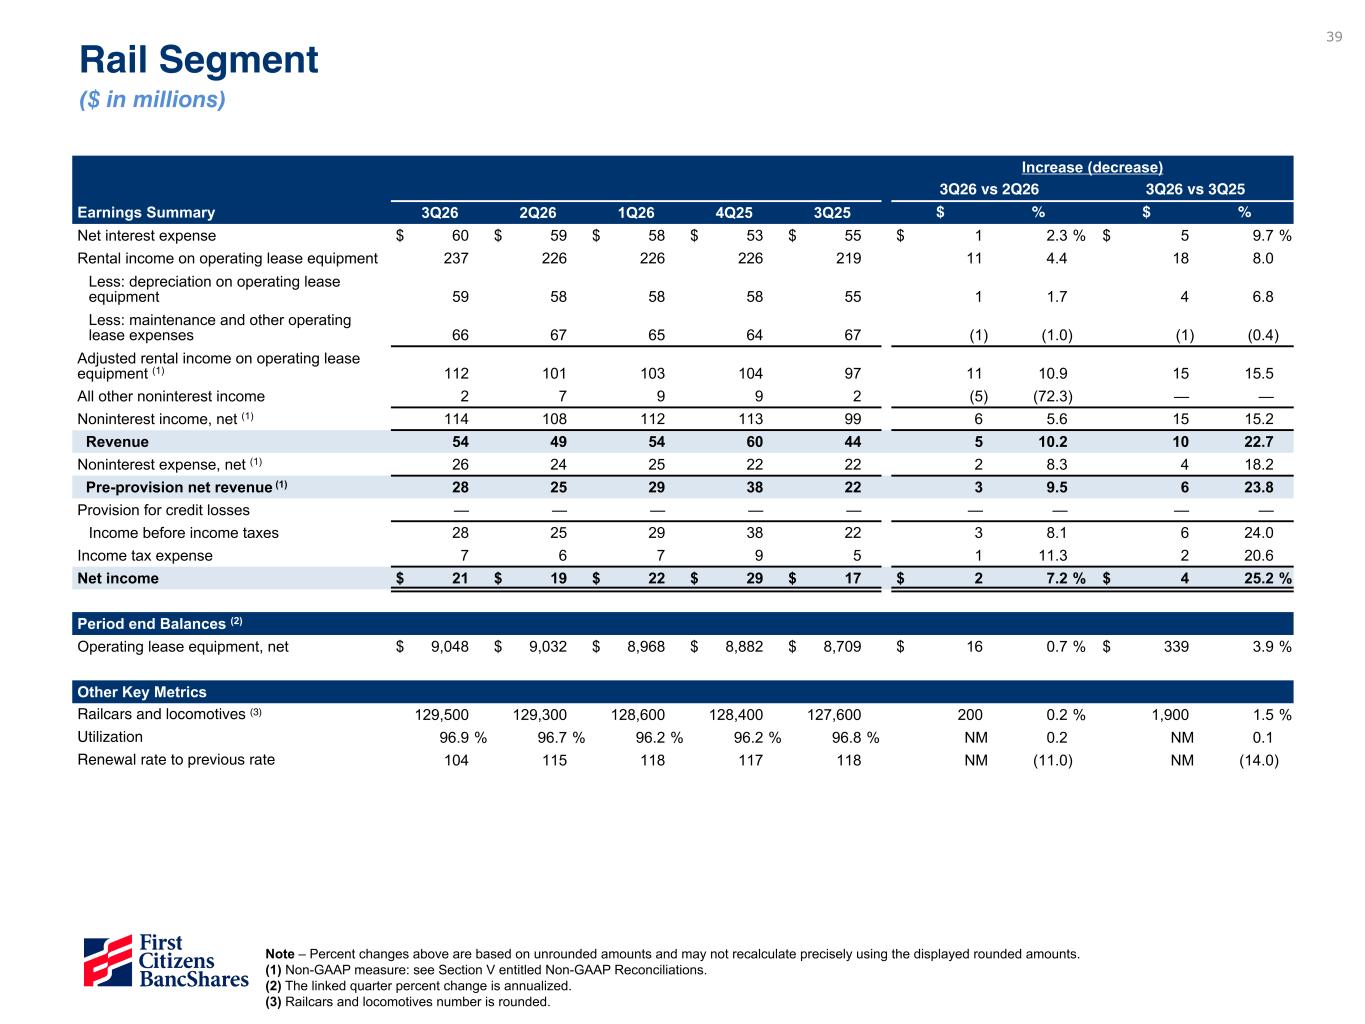
39 Increase (decrease) 3Q26 vs 2Q26 3Q26 vs 3Q25 Earnings Summary 3Q26 2Q26 1Q26 4Q25 3Q25 $ % $ % Net interest expense $ 60 $ 59 $ 58 $ 53 $ 55 $ 1 2.3 % $ 5 9.7 % Rental income on operating lease equipment 237 226 226 226 219 11 4.4 18 8.0 Less: depreciation on operating lease equipment 59 58 58 58 55 1 1.7 4 6.8 Less: maintenance and other operating lease expenses 66 67 65 64 67 (1) (1.0) (1) (0.4) Adjusted rental income on operating lease equipment (1) 112 101 103 104 97 11 10.9 15 15.5 All other noninterest income 2 7 9 9 2 (5) (72.3) — — Noninterest income, net (1) 114 108 112 113 99 6 5.6 15 15.2 Revenue 54 49 54 60 44 5 10.2 10 22.7 Noninterest expense, net (1) 26 24 25 22 22 2 8.3 4 18.2 Pre-provision net revenue (1) 28 25 29 38 22 3 9.5 6 23.8 Provision for credit losses — — — — — — — — — Income before income taxes 28 25 29 38 22 3 8.1 6 24.0 Income tax expense 7 6 7 9 5 1 11.3 2 20.6 Net income $ 21 $ 19 $ 22 $ 29 $ 17 $ 2 7.2 % $ 4 25.2 % Period end Balances (2) Operating lease equipment, net $ 9,048 $ 9,032 $ 8,968 $ 8,882 $ 8,709 $ 16 0.7 % $ 339 3.9 % Other Key Metrics Railcars and locomotives (3) 129,500 129,300 128,600 128,400 127,600 200 0.2 % 1,900 1.5 % Utilization 96.9 % 96.7 % 96.2 % 96.2 % 96.8 % NM 0.2 NM 0.1 Renewal rate to previous rate 104 115 118 117 118 NM (11.0) NM (14.0) Rail Segment ($ in millions) Note – Percent changes above are based on unrounded amounts and may not recalculate precisely using the displayed rounded amounts. (1) Non-GAAP measure: see Section V entitled Non-GAAP Reconciliations. (2) The linked quarter percent change is annualized. (3) Railcars and locomotives number is rounded.
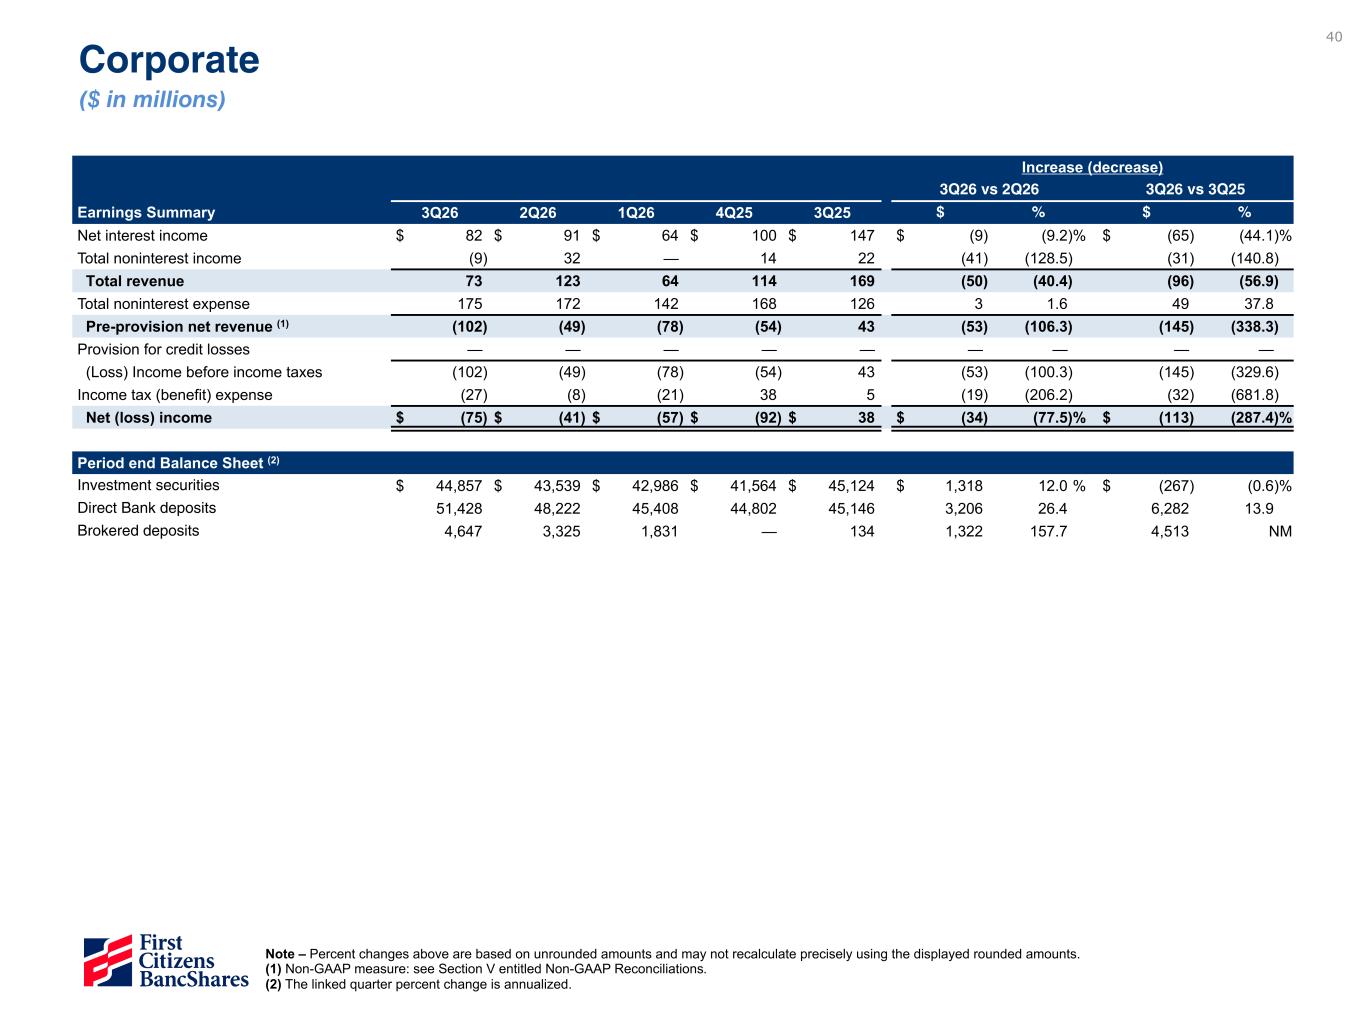
40 Corporate ($ in millions) Note – Percent changes above are based on unrounded amounts and may not recalculate precisely using the displayed rounded amounts. (1) Non-GAAP measure: see Section V entitled Non-GAAP Reconciliations. (2) The linked quarter percent change is annualized. Increase (decrease) 3Q26 vs 2Q26 3Q26 vs 3Q25 Earnings Summary 3Q26 2Q26 1Q26 4Q25 3Q25 $ % $ % Net interest income $ 82 $ 91 $ 64 $ 100 $ 147 $ (9) (9.2) % $ (65) (44.1) % Total noninterest income (9) 32 — 14 22 (41) (128.5) (31) (140.8) Total revenue 73 123 64 114 169 (50) (40.4) (96) (56.9) Total noninterest expense 175 172 142 168 126 3 1.6 49 37.8 Pre-provision net revenue (1) (102) (49) (78) (54) 43 (53) (106.3) (145) (338.3) Provision for credit losses — — — — — — — — — (Loss) Income before income taxes (102) (49) (78) (54) 43 (53) (100.3) (145) (329.6) Income tax (benefit) expense (27) (8) (21) 38 5 (19) (206.2) (32) (681.8) Net (loss) income $ (75) $ (41) $ (57) $ (92) $ 38 $ (34) (77.5) % $ (113) (287.4) % Period end Balance Sheet (2) Investment securities $ 44,857 $ 43,539 $ 42,986 $ 41,564 $ 45,124 $ 1,318 12.0 % $ (267) (0.6) % Direct Bank deposits 51,428 48,222 45,408 44,802 45,146 3,206 26.4 6,282 13.9 Brokered deposits 4,647 3,325 1,831 — 134 1,322 157.7 4,513 NM
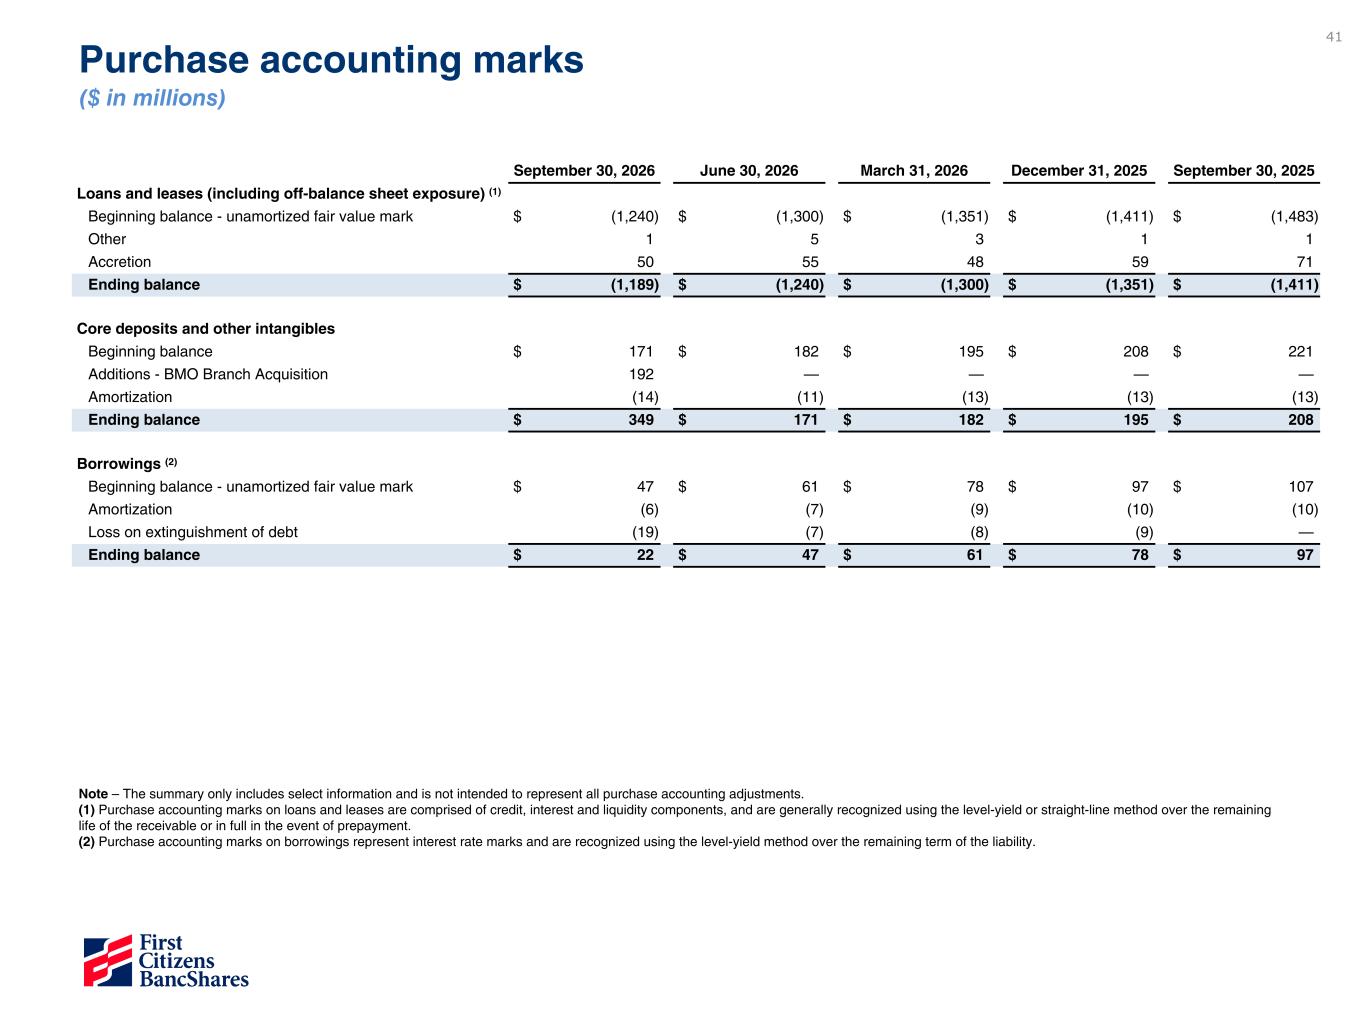
41 September 30, 2026 June 30, 2026 March 31, 2026 December 31, 2025 September 30, 2025 Loans and leases (including off-balance sheet exposure) (1) Beginning balance - unamortized fair value mark $ (1,240) $ (1,300) $ (1,351) $ (1,411) $ (1,483) Other 1 5 3 1 1 Accretion 50 55 48 59 71 Ending balance $ (1,189) $ (1,240) $ (1,300) $ (1,351) $ (1,411) Core deposits and other intangibles Beginning balance $ 171 $ 182 $ 195 $ 208 $ 221 Additions - BMO Branch Acquisition 192 — — — — Amortization (14) (11) (13) (13) (13) Ending balance $ 349 $ 171 $ 182 $ 195 $ 208 Borrowings (2) Beginning balance - unamortized fair value mark $ 47 $ 61 $ 78 $ 97 $ 107 Amortization (6) (7) (9) (10) (10) Loss on extinguishment of debt (19) (7) (8) (9) — Ending balance $ 22 $ 47 $ 61 $ 78 $ 97 Purchase accounting marks ($ in millions) Note – The summary only includes select information and is not intended to represent all purchase accounting adjustments. (1) Purchase accounting marks on loans and leases are comprised of credit, interest and liquidity components, and are generally recognized using the level-yield or straight-line method over the remaining life of the receivable or in full in the event of prepayment. (2) Purchase accounting marks on borrowings represent interest rate marks and are recognized using the level-yield method over the remaining term of the liability.
Non-GAAP Reconciliations Section V
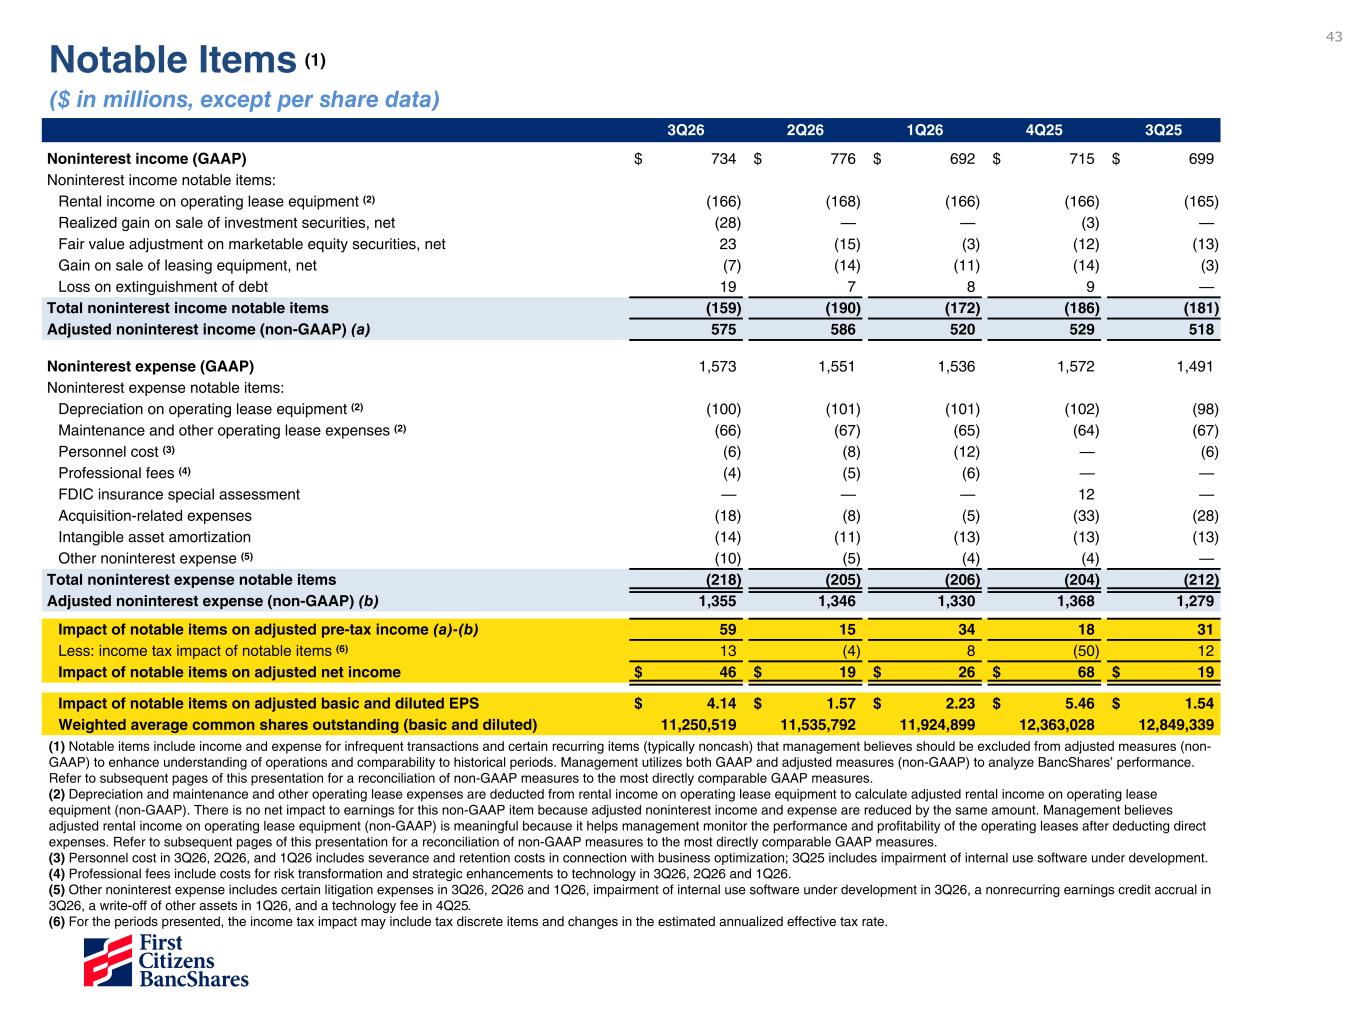
43 Notable Items (1) ($ in millions, except per share data) 3Q26 2Q26 1Q26 4Q25 3Q25 Noninterest income (GAAP) $ 734 $ 776 $ 692 $ 715 $ 699 Noninterest income notable items: Rental income on operating lease equipment (2) (166) (168) (166) (166) (165) Realized gain on sale of investment securities, net (28) — — (3) — Fair value adjustment on marketable equity securities, net 23 (15) (3) (12) (13) Gain on sale of leasing equipment, net (7) (14) (11) (14) (3) Loss on extinguishment of debt 19 7 8 9 — Total noninterest income notable items (159) (190) (172) (186) (181) Adjusted noninterest income (non-GAAP) (a) 575 586 520 529 518 Noninterest expense (GAAP) 1,573 1,551 1,536 1,572 1,491 Noninterest expense notable items: Depreciation on operating lease equipment (2) (100) (101) (101) (102) (98) Maintenance and other operating lease expenses (2) (66) (67) (65) (64) (67) Personnel cost (3) (6) (8) (12) — (6) Professional fees (4) (4) (5) (6) — — FDIC insurance special assessment — — — 12 — Acquisition-related expenses (18) (8) (5) (33) (28) Intangible asset amortization (14) (11) (13) (13) (13) Other noninterest expense (5) (10) (5) (4) (4) — Total noninterest expense notable items (218) (205) (206) (204) (212) Adjusted noninterest expense (non-GAAP) (b) 1,355 1,346 1,330 1,368 1,279 Impact of notable items on adjusted pre-tax income (a)-(b) 59 15 34 18 31 Less: income tax impact of notable items (6) 13 (4) 8 (50) 12 Impact of notable items on adjusted net income $ 46 $ 19 $ 26 $ 68 $ 19 Impact of notable items on adjusted basic and diluted EPS $ 4.14 $ 1.57 $ 2.23 $ 5.46 $ 1.54 Weighted average common shares outstanding (basic and diluted) 11,250,519 11,535,792 11,924,899 12,363,028 12,849,339 (1) Notable items include income and expense for infrequent transactions and certain recurring items (typically noncash) that management believes should be excluded from adjusted measures (non- GAAP) to enhance understanding of operations and comparability to historical periods. Management utilizes both GAAP and adjusted measures (non-GAAP) to analyze BancShares’ performance. Refer to subsequent pages of this presentation for a reconciliation of non-GAAP measures to the most directly comparable GAAP measures. (2) Depreciation and maintenance and other operating lease expenses are deducted from rental income on operating lease equipment to calculate adjusted rental income on operating lease equipment (non-GAAP). There is no net impact to earnings for this non-GAAP item because adjusted noninterest income and expense are reduced by the same amount. Management believes adjusted rental income on operating lease equipment (non-GAAP) is meaningful because it helps management monitor the performance and profitability of the operating leases after deducting direct expenses. Refer to subsequent pages of this presentation for a reconciliation of non-GAAP measures to the most directly comparable GAAP measures. (3) Personnel cost in 3Q26, 2Q26, and 1Q26 includes severance and retention costs in connection with business optimization; 3Q25 includes impairment of internal use software under development. (4) Professional fees include costs for risk transformation and strategic enhancements to technology in 3Q26, 2Q26 and 1Q26. (5) Other noninterest expense includes certain litigation expenses in 3Q26, 2Q26 and 1Q26, impairment of internal use software under development in 3Q26, a nonrecurring earnings credit accrual in 3Q26, a write-off of other assets in 1Q26, and a technology fee in 4Q25. (6) For the periods presented, the income tax impact may include tax discrete items and changes in the estimated annualized effective tax rate.
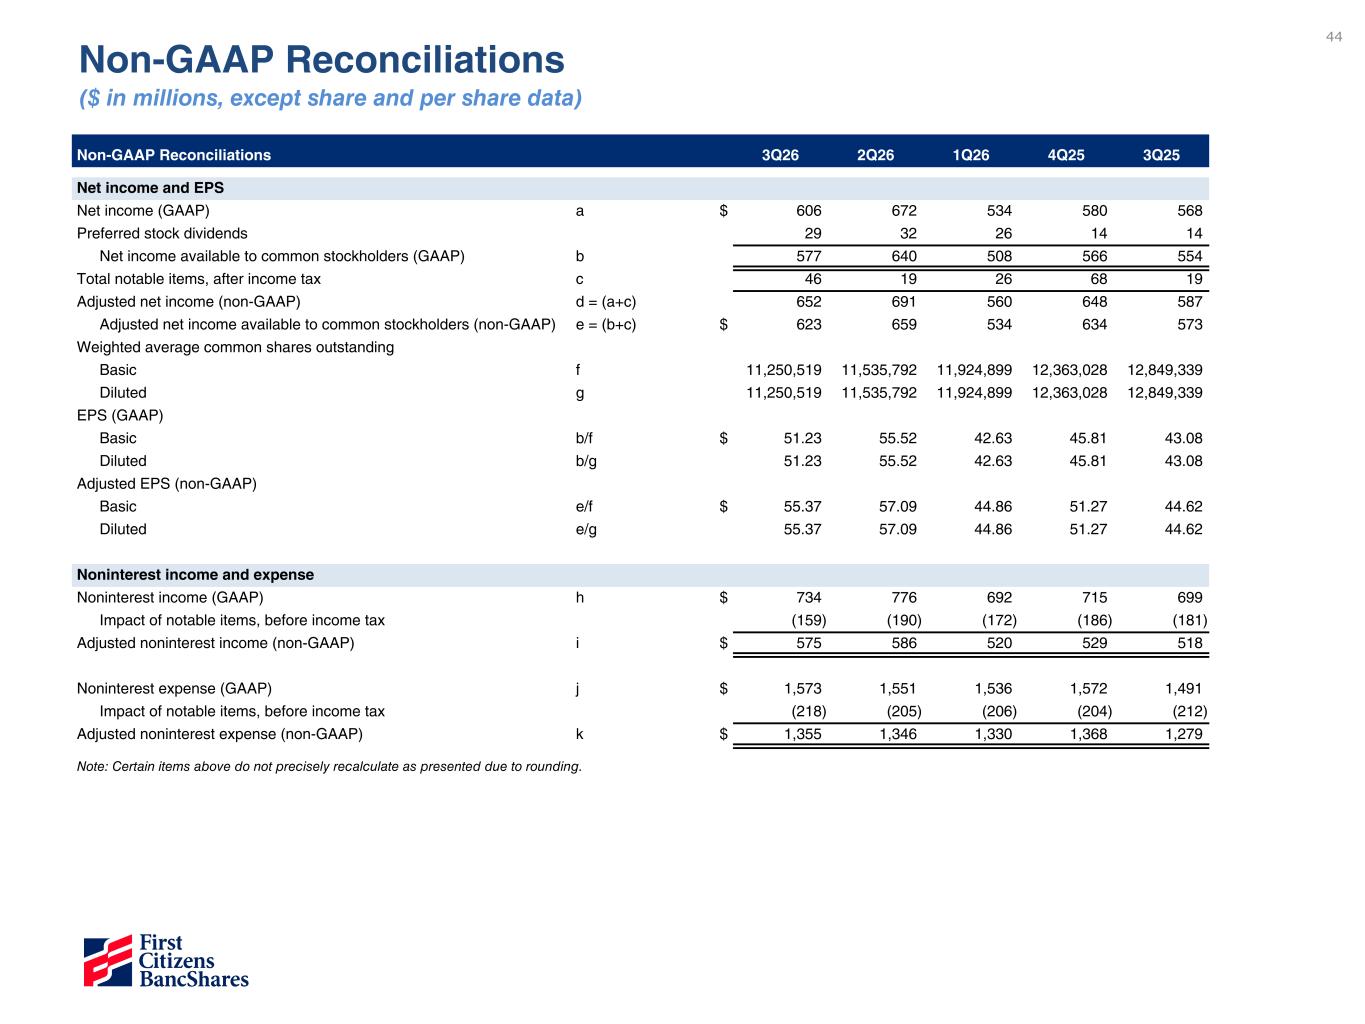
44 Non-GAAP Reconciliations 3Q26 2Q26 1Q26 4Q25 3Q25 Net income and EPS Net income (GAAP) a $ 606 672 534 580 568 Preferred stock dividends 29 32 26 14 14 Net income available to common stockholders (GAAP) b 577 640 508 566 554 Total notable items, after income tax c 46 19 26 68 19 Adjusted net income (non-GAAP) d = (a+c) 652 691 560 648 587 Adjusted net income available to common stockholders (non-GAAP) e = (b+c) $ 623 659 534 634 573 Weighted average common shares outstanding Basic f 11,250,519 11,535,792 11,924,899 12,363,028 12,849,339 Diluted g 11,250,519 11,535,792 11,924,899 12,363,028 12,849,339 EPS (GAAP) Basic b/f $ 51.23 55.52 42.63 45.81 43.08 Diluted b/g 51.23 55.52 42.63 45.81 43.08 Adjusted EPS (non-GAAP) Basic e/f $ 55.37 57.09 44.86 51.27 44.62 Diluted e/g 55.37 57.09 44.86 51.27 44.62 Noninterest income and expense Noninterest income (GAAP) h $ 734 776 692 715 699 Impact of notable items, before income tax (159) (190) (172) (186) (181) Adjusted noninterest income (non-GAAP) i $ 575 586 520 529 518 Noninterest expense (GAAP) j $ 1,573 1,551 1,536 1,572 1,491 Impact of notable items, before income tax (218) (205) (206) (204) (212) Adjusted noninterest expense (non-GAAP) k $ 1,355 1,346 1,330 1,368 1,279 Note: Certain items above do not precisely recalculate as presented due to rounding. Non-GAAP Reconciliations ($ in millions, except share and per share data)
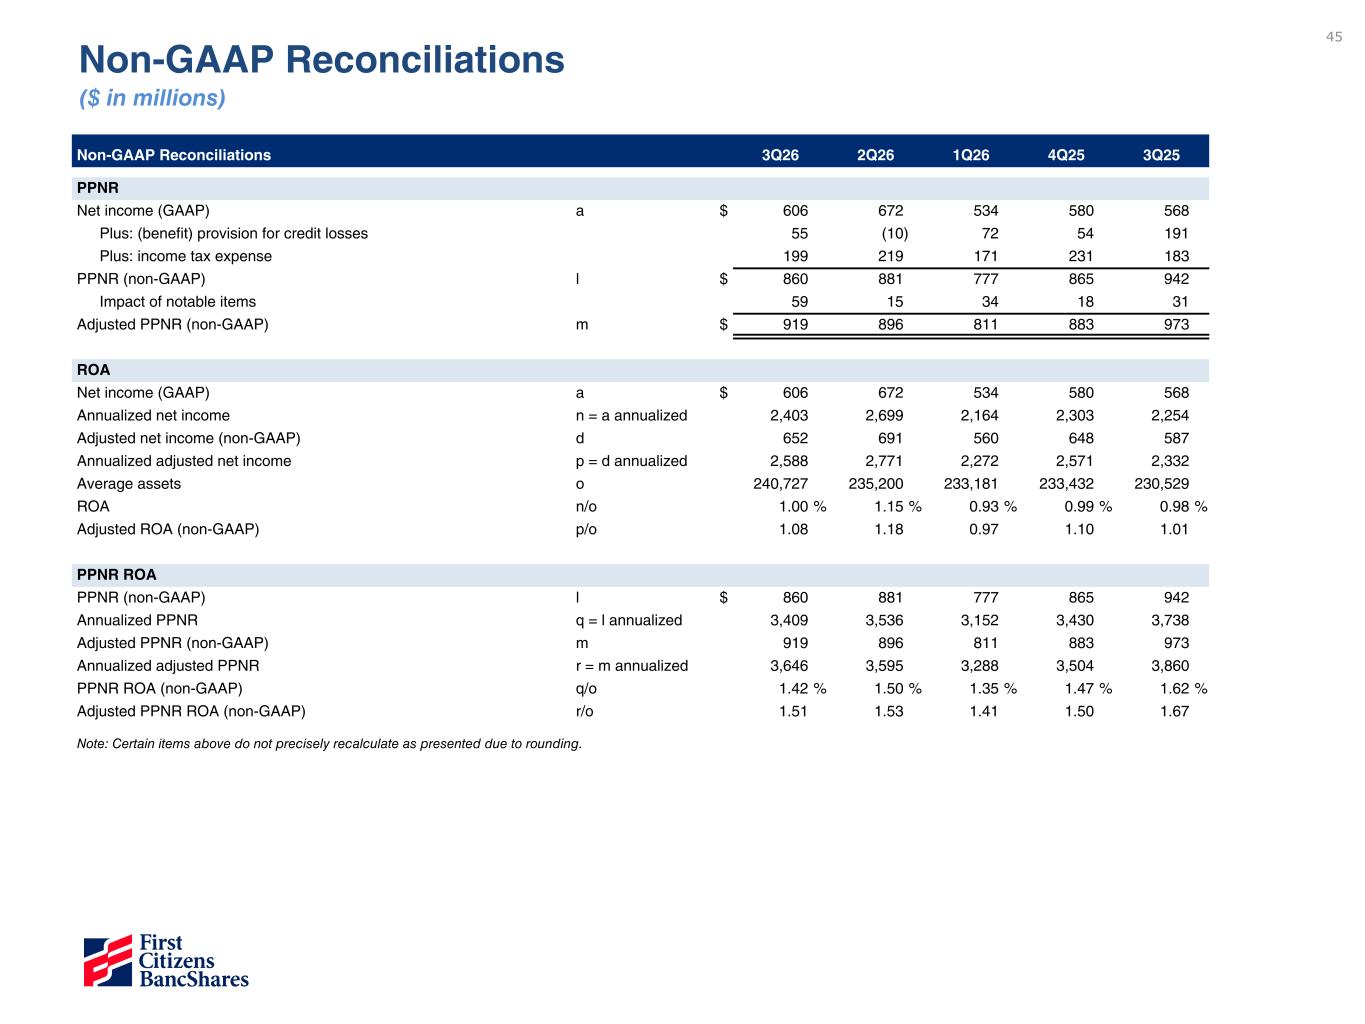
45 Non-GAAP Reconciliations ($ in millions) Non-GAAP Reconciliations 3Q26 2Q26 1Q26 4Q25 3Q25 PPNR Net income (GAAP) a $ 606 672 534 580 568 Plus: (benefit) provision for credit losses 55 (10) 72 54 191 Plus: income tax expense 199 219 171 231 183 PPNR (non-GAAP) l $ 860 881 777 865 942 Impact of notable items 59 15 34 18 31 Adjusted PPNR (non-GAAP) m $ 919 896 811 883 973 ROA Net income (GAAP) a $ 606 672 534 580 568 Annualized net income n = a annualized 2,403 2,699 2,164 2,303 2,254 Adjusted net income (non-GAAP) d 652 691 560 648 587 Annualized adjusted net income p = d annualized 2,588 2,771 2,272 2,571 2,332 Average assets o 240,727 235,200 233,181 233,432 230,529 ROA n/o 1.00 % 1.15 % 0.93 % 0.99 % 0.98 % Adjusted ROA (non-GAAP) p/o 1.08 1.18 0.97 1.10 1.01 PPNR ROA PPNR (non-GAAP) l $ 860 881 777 865 942 Annualized PPNR q = l annualized 3,409 3,536 3,152 3,430 3,738 Adjusted PPNR (non-GAAP) m 919 896 811 883 973 Annualized adjusted PPNR r = m annualized 3,646 3,595 3,288 3,504 3,860 PPNR ROA (non-GAAP) q/o 1.42 % 1.50 % 1.35 % 1.47 % 1.62 % Adjusted PPNR ROA (non-GAAP) r/o 1.51 1.53 1.41 1.50 1.67 Note: Certain items above do not precisely recalculate as presented due to rounding.
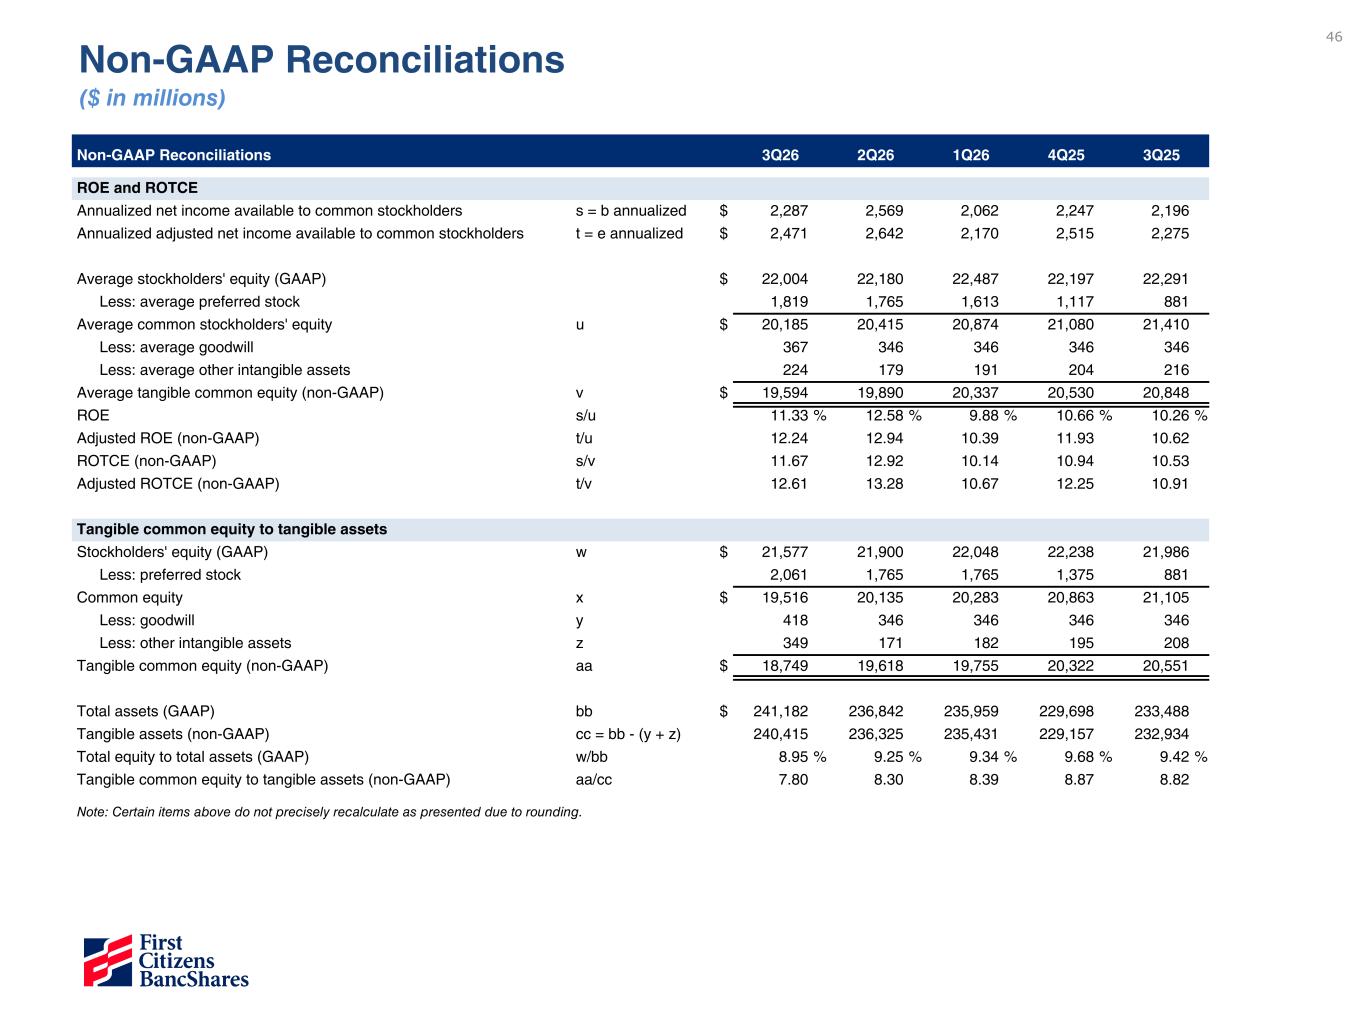
46 Non-GAAP Reconciliations ($ in millions) Non-GAAP Reconciliations 3Q26 2Q26 1Q26 4Q25 3Q25 ROE and ROTCE Annualized net income available to common stockholders s = b annualized $ 2,287 2,569 2,062 2,247 2,196 Annualized adjusted net income available to common stockholders t = e annualized $ 2,471 2,642 2,170 2,515 2,275 Average stockholders' equity (GAAP) $ 22,004 22,180 22,487 22,197 22,291 Less: average preferred stock 1,819 1,765 1,613 1,117 881 Average common stockholders' equity u $ 20,185 20,415 20,874 21,080 21,410 Less: average goodwill 367 346 346 346 346 Less: average other intangible assets 224 179 191 204 216 Average tangible common equity (non-GAAP) v $ 19,594 19,890 20,337 20,530 20,848 ROE s/u 11.33 % 12.58 % 9.88 % 10.66 % 10.26 % Adjusted ROE (non-GAAP) t/u 12.24 12.94 10.39 11.93 10.62 ROTCE (non-GAAP) s/v 11.67 12.92 10.14 10.94 10.53 Adjusted ROTCE (non-GAAP) t/v 12.61 13.28 10.67 12.25 10.91 Tangible common equity to tangible assets Stockholders' equity (GAAP) w $ 21,577 21,900 22,048 22,238 21,986 Less: preferred stock 2,061 1,765 1,765 1,375 881 Common equity x $ 19,516 20,135 20,283 20,863 21,105 Less: goodwill y 418 346 346 346 346 Less: other intangible assets z 349 171 182 195 208 Tangible common equity (non-GAAP) aa $ 18,749 19,618 19,755 20,322 20,551 Total assets (GAAP) bb $ 241,182 236,842 235,959 229,698 233,488 Tangible assets (non-GAAP) cc = bb - (y + z) 240,415 236,325 235,431 229,157 232,934 Total equity to total assets (GAAP) w/bb 8.95 % 9.25 % 9.34 % 9.68 % 9.42 % Tangible common equity to tangible assets (non-GAAP) aa/cc 7.80 8.30 8.39 8.87 8.82 Note: Certain items above do not precisely recalculate as presented due to rounding.
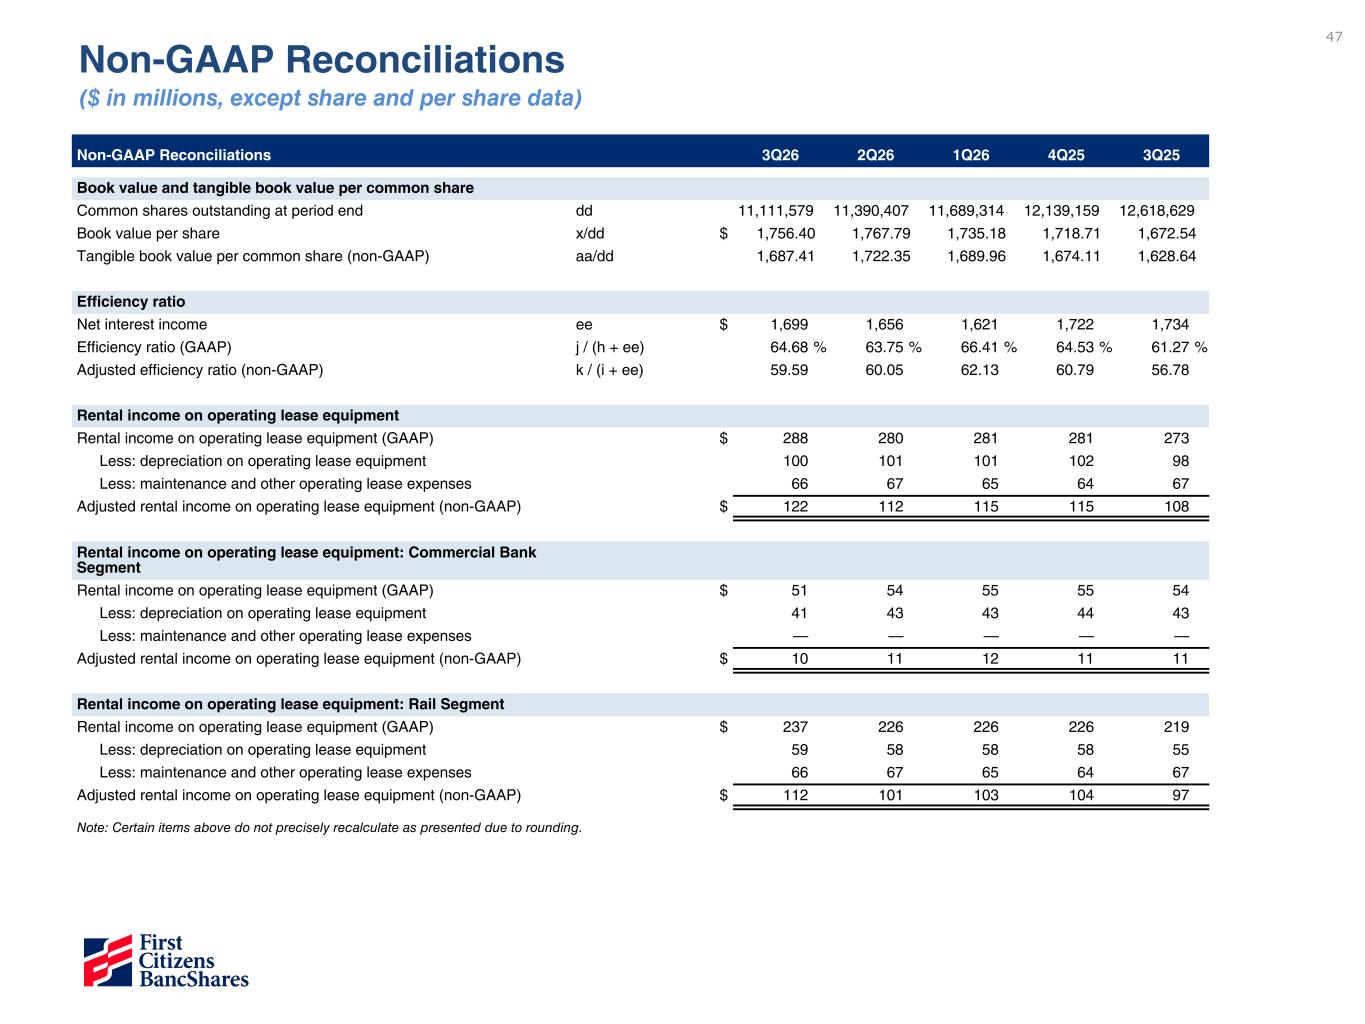
47 Non-GAAP Reconciliations ($ in millions, except share and per share data) Non-GAAP Reconciliations 3Q26 2Q26 1Q26 4Q25 3Q25 Book value and tangible book value per common share Common shares outstanding at period end dd 11,111,579 11,390,407 11,689,314 12,139,159 12,618,629 Book value per share x/dd $ 1,756.40 1,767.79 1,735.18 1,718.71 1,672.54 Tangible book value per common share (non-GAAP) aa/dd 1,687.41 1,722.35 1,689.96 1,674.11 1,628.64 Efficiency ratio Net interest income ee $ 1,699 1,656 1,621 1,722 1,734 Efficiency ratio (GAAP) j / (h + ee) 64.68 % 63.75 % 66.41 % 64.53 % 61.27 % Adjusted efficiency ratio (non-GAAP) k / (i + ee) 59.59 60.05 62.13 60.79 56.78 Rental income on operating lease equipment Rental income on operating lease equipment (GAAP) $ 288 280 281 281 273 Less: depreciation on operating lease equipment 100 101 101 102 98 Less: maintenance and other operating lease expenses 66 67 65 64 67 Adjusted rental income on operating lease equipment (non-GAAP) $ 122 112 115 115 108 Rental income on operating lease equipment: Commercial Bank Segment Rental income on operating lease equipment (GAAP) $ 51 54 55 55 54 Less: depreciation on operating lease equipment 41 43 43 44 43 Less: maintenance and other operating lease expenses — — — — — Adjusted rental income on operating lease equipment (non-GAAP) $ 10 11 12 11 11 Rental income on operating lease equipment: Rail Segment Rental income on operating lease equipment (GAAP) $ 237 226 226 226 219 Less: depreciation on operating lease equipment 59 58 58 58 55 Less: maintenance and other operating lease expenses 66 67 65 64 67 Adjusted rental income on operating lease equipment (non-GAAP) $ 112 101 103 104 97 Note: Certain items above do not precisely recalculate as presented due to rounding.
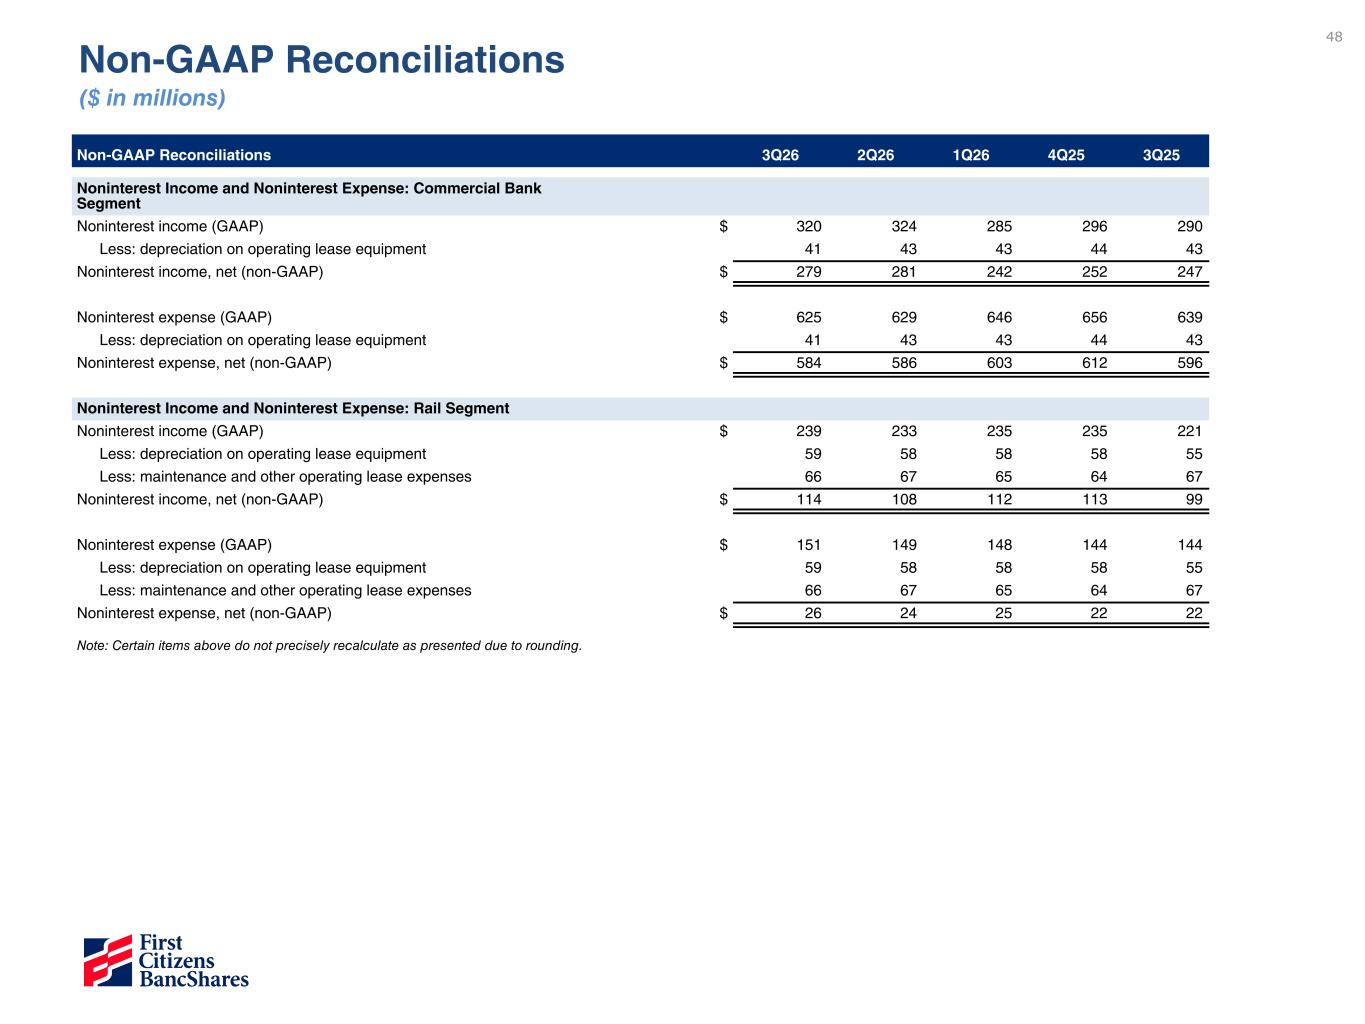
48 Non-GAAP Reconciliations ($ in millions) Non-GAAP Reconciliations 3Q26 2Q26 1Q26 4Q25 3Q25 Noninterest Income and Noninterest Expense: Commercial Bank Segment Noninterest income (GAAP) $ 320 324 285 296 290 Less: depreciation on operating lease equipment 41 43 43 44 43 Noninterest income, net (non-GAAP) $ 279 281 242 252 247 Noninterest expense (GAAP) $ 625 629 646 656 639 Less: depreciation on operating lease equipment 41 43 43 44 43 Noninterest expense, net (non-GAAP) $ 584 586 603 612 596 Noninterest Income and Noninterest Expense: Rail Segment Noninterest income (GAAP) $ 239 233 235 235 221 Less: depreciation on operating lease equipment 59 58 58 58 55 Less: maintenance and other operating lease expenses 66 67 65 64 67 Noninterest income, net (non-GAAP) $ 114 108 112 113 99 Noninterest expense (GAAP) $ 151 149 148 144 144 Less: depreciation on operating lease equipment 59 58 58 58 55 Less: maintenance and other operating lease expenses 66 67 65 64 67 Noninterest expense, net (non-GAAP) $ 26 24 25 22 22 Note: Certain items above do not precisely recalculate as presented due to rounding.
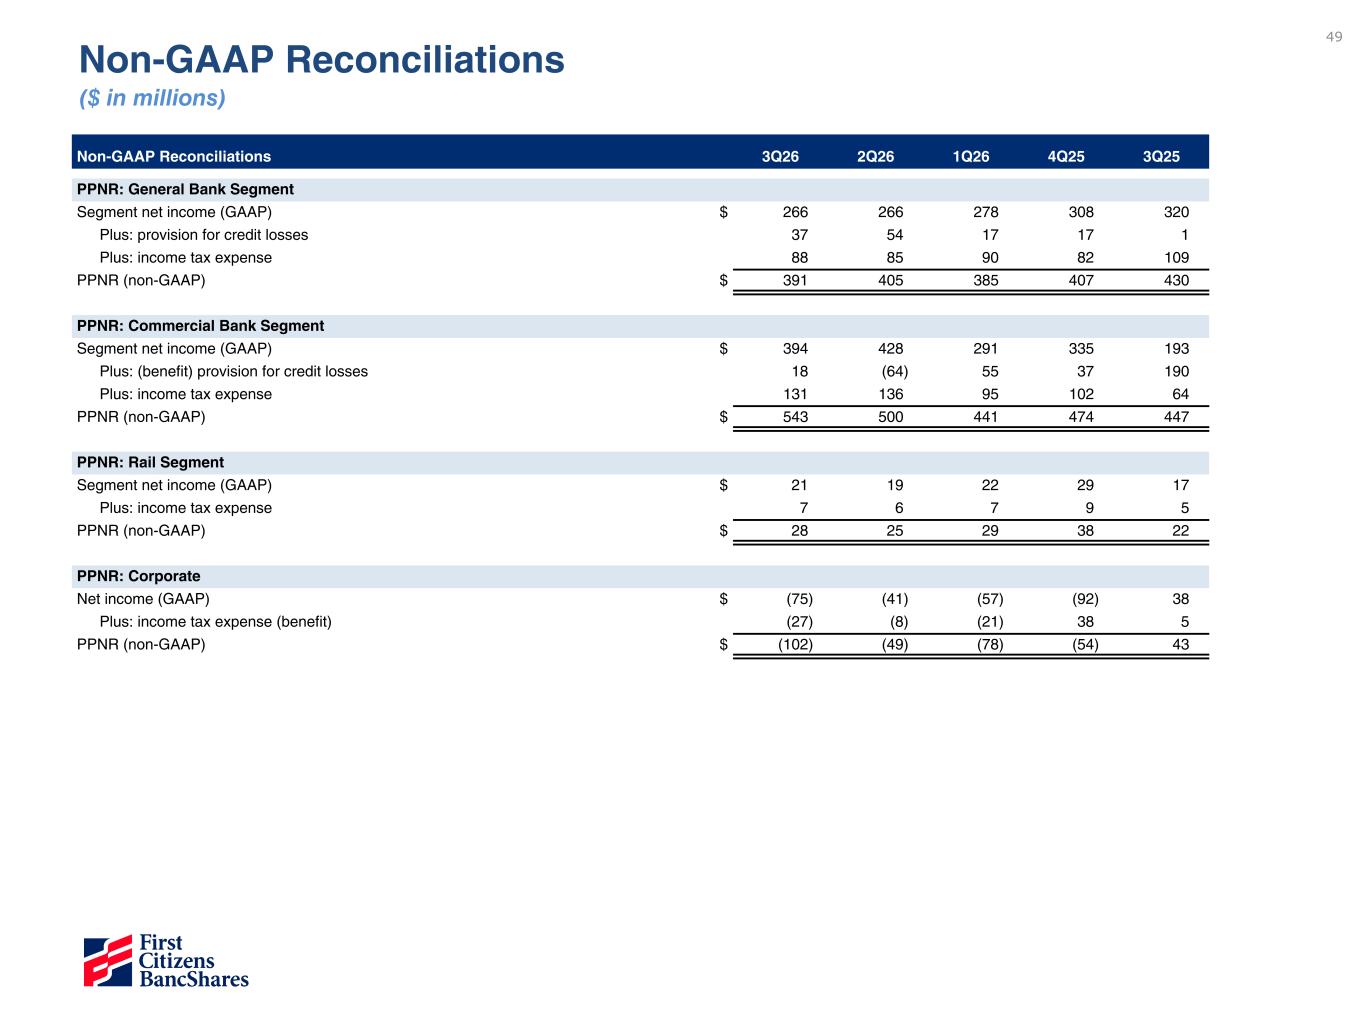
49 Non-GAAP Reconciliations ($ in millions) Non-GAAP Reconciliations 3Q26 2Q26 1Q26 4Q25 3Q25 PPNR: General Bank Segment Segment net income (GAAP) $ 266 266 278 308 320 Plus: provision for credit losses 37 54 17 17 1 Plus: income tax expense 88 85 90 82 109 PPNR (non-GAAP) $ 391 405 385 407 430 PPNR: Commercial Bank Segment Segment net income (GAAP) $ 394 428 291 335 193 Plus: (benefit) provision for credit losses 18 (64) 55 37 190 Plus: income tax expense 131 136 95 102 64 PPNR (non-GAAP) $ 543 500 441 474 447 PPNR: Rail Segment Segment net income (GAAP) $ 21 19 22 29 17 Plus: income tax expense 7 6 7 9 5 PPNR (non-GAAP) $ 28 25 29 38 22 PPNR: Corporate Net income (GAAP) $ (75) (41) (57) (92) 38 Plus: income tax expense (benefit) (27) (8) (21) 38 5 PPNR (non-GAAP) $ (102) (49) (78) (54) 43
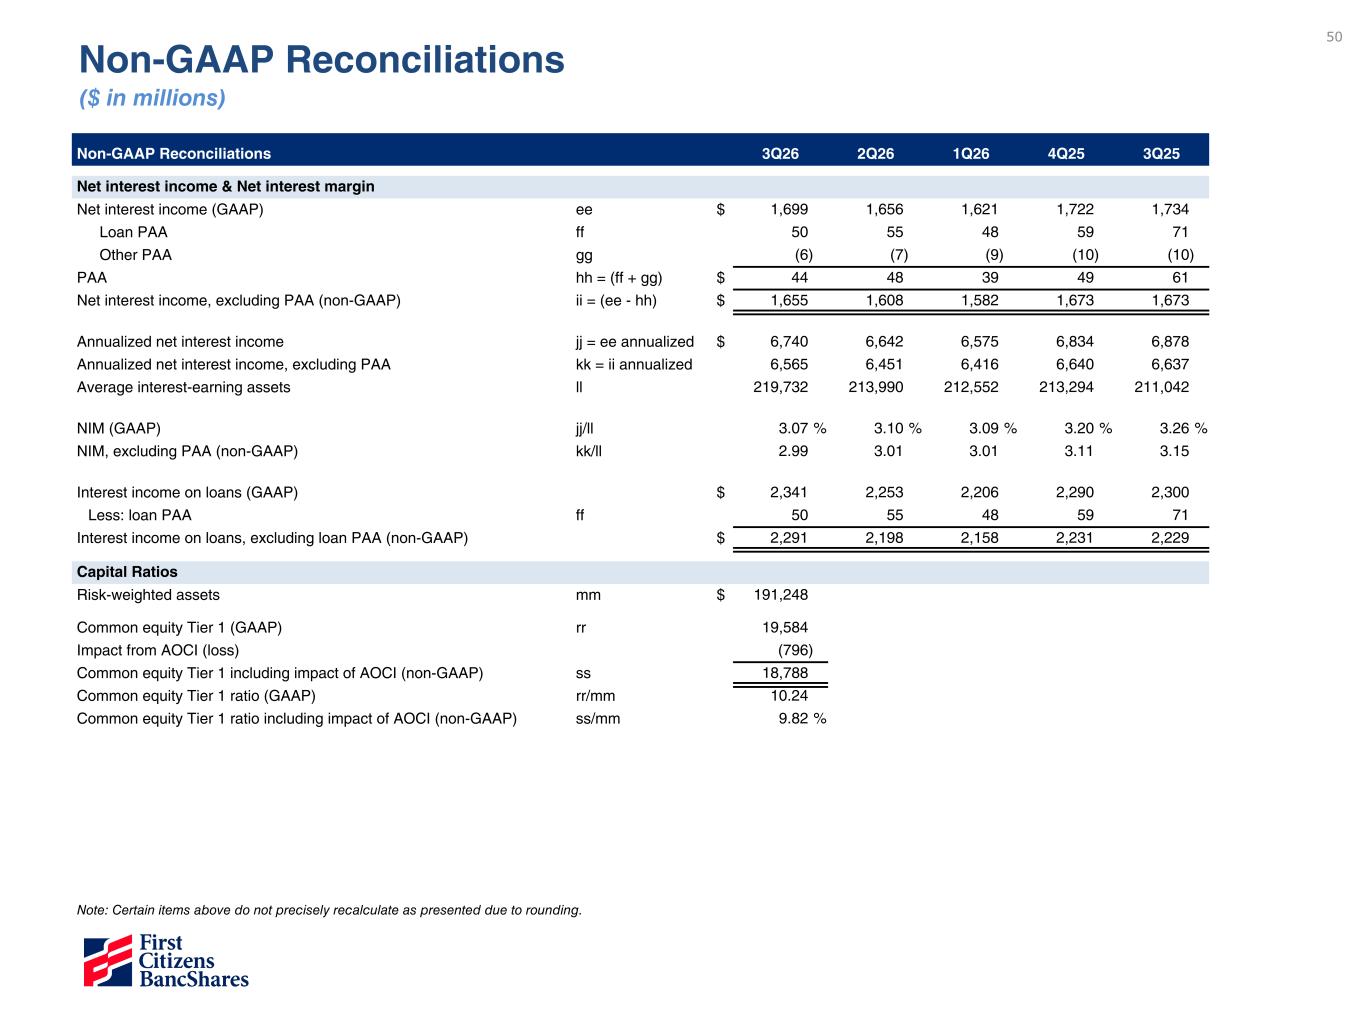
50 Non-GAAP Reconciliations ($ in millions) Non-GAAP Reconciliations 3Q26 2Q26 1Q26 4Q25 3Q25 Net interest income & Net interest margin Net interest income (GAAP) ee $ 1,699 1,656 1,621 1,722 1,734 Loan PAA ff 50 55 48 59 71 Other PAA gg (6) (7) (9) (10) (10) PAA hh = (ff + gg) $ 44 48 39 49 61 Net interest income, excluding PAA (non-GAAP) ii = (ee - hh) $ 1,655 1,608 1,582 1,673 1,673 Annualized net interest income jj = ee annualized $ 6,740 6,642 6,575 6,834 6,878 Annualized net interest income, excluding PAA kk = ii annualized 6,565 6,451 6,416 6,640 6,637 Average interest-earning assets ll 219,732 213,990 212,552 213,294 211,042 NIM (GAAP) jj/ll 3.07 % 3.10 % 3.09 % 3.20 % 3.26 % NIM, excluding PAA (non-GAAP) kk/ll 2.99 3.01 3.01 3.11 3.15 Interest income on loans (GAAP) $ 2,341 2,253 2,206 2,290 2,300 Less: loan PAA ff 50 55 48 59 71 Interest income on loans, excluding loan PAA (non-GAAP) $ 2,291 2,198 2,158 2,231 2,229 Capital Ratios Risk-weighted assets mm $ 191,248 Common equity Tier 1 (GAAP) rr 19,584 Impact from AOCI (loss) (796) Common equity Tier 1 including impact of AOCI (non-GAAP) ss 18,788 Common equity Tier 1 ratio (GAAP) rr/mm 10.24 Common equity Tier 1 ratio including impact of AOCI (non-GAAP) ss/mm 9.82 % Note: Certain items above do not precisely recalculate as presented due to rounding.