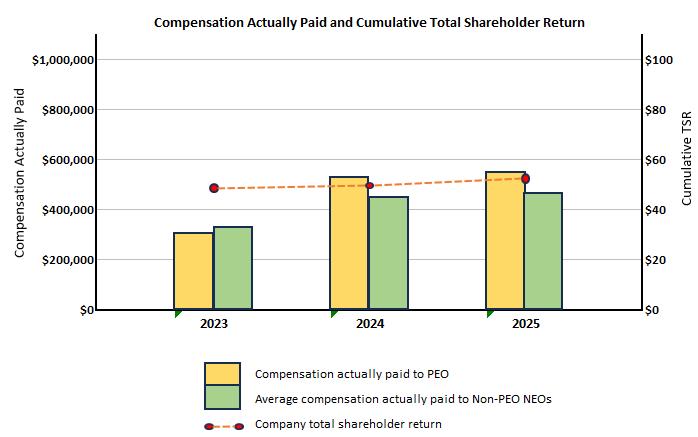
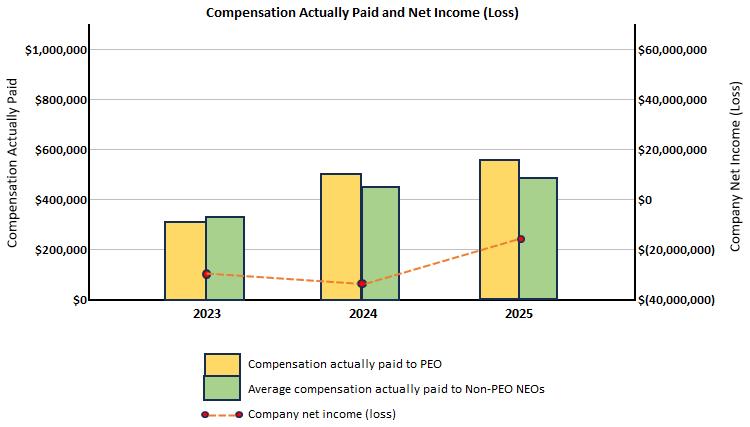
The following table sets forth information regarding the compensation received by our Principal Executive Officer (PEO) and our other named executive officers compared to compensation actually paid to such officers, and certain financial performance measures during the last three completed fiscal years.
|
|
|
|
|
|
|
Year | Summary Compensation Table Total for PEO (1)
(b) | Compensation Actually Paid to PEO (2)
(c) | Average Summary Compensation Table Total for Non-PEO NEOs (3)
(d) | Average Compensation Actually Paid to Non-PEO NEOs (4) | Total Shareholder Return (5) | Net Income |
2025 | 1,055,178 | 587,406 | 581,938 | 473,129 | $ 55 | (14,652,000) |
2024 | 1,004,760 | 536,451 | 585,458 | 444,928 | $ 48 | (35,898,000) |
2023 | 1,020,580 | 318,935 | 678,357 | 353,107 | $ 47 | (31,185,000) |
(1) The dollar amounts reported represent the amount of total compensation reported for Ms. Ellen Cotter, who served as our PEO in 2023, 2024 and 2025 for each corresponding fiscal year in the "Total($)" column of the Summary Compensation Table for the covered fiscal year. Refer to the "Summary Compensation Table" for the covered fiscal year for more information.
(2) The dollar amounts reported represent the amount of “compensation actually paid” to our PEO, as computed in accordance with Item 402(v) of Regulation S-K, in fiscal years 2023, 2024 and 2025. The dollar amounts do not reflect the actual amount of compensation earned by or paid to our PEO during the applicable fiscal year. In accordance with the requirements of Item 402(v) of Regulation S- K, the following adjustments were made to our PEO’s total compensation for each fiscal year to determine the compensation actually paid:
|
|
|
|
|
|
|
|
|
Year | Summary Compensation Table Total for PEO
($) | Deduction for Option Awards
($) | Deduction for SCT "Restricted Stock Awards"
($) | Change in fair value of equity awards granted in prior years that vested at the end of or during the covered fiscal year
($) | Change in fair value of equity awards granted in prior years that are outstanding and unvested as of the end of the covered fiscal year
($) | Fair value at the end of the prior fiscal year of equity awards granted in the prior year that were forfeited during the covered fiscal year
($) | Increase for service cost and prior service cost for pension plans
($) | Compensation Actually Paid to PEO
($) |
2025 | 1,055,178 | (432,600) | -- | (6,701) | (28,471) | -- | -- | 587,406 |
2024 | 1,004,760 | (384,180) | -- | (17,335) | (66,794) | -- | -- | 536,451 |
2023 | 1,020,580 | -- | (400,000) | (43,575) | (258,071) | -- | -- | 318,935 |
|
|
|
|
|
|
|
|
|
Year | Summary Compensation Table Total for Non-PEO NEOs
($) | Deduction for Option Awards
($) | Deduction for SCT "Restricted Stock Awards"
($) | Change in fair value of equity awards granted in prior years that vested at the end of or during the covered fiscal year
($) | Change in fair value of equity awards granted in prior years that are outstanding and unvested as of the end of the covered fiscal year
($) | Fair value at the end of the prior fiscal year of equity awards granted in the prior year that were forfeited during the covered fiscal year
($) | Increase for service cost and prior service cost for pension plans
($) | Compensation Actually Paid to Non-PEO NEOs
($) |
2025 | 581,938 | (92,999) | -- | (3,255) | (12,555) | -- | -- | 473,129 |
2024 | 585,458 | (102,192) | -- | (7,553) | (30,785) | -- | -- | 444,928 |
2023 | 678,357 | -- | (195,000) | (17,038) | (113,212) | -- | -- | 353,107 |