
Table of Contents. | ||||||||
| Section | Page | ||||
| Corporate Data: | |||||
| Consolidated Financial Results: | |||||
| Portfolio Data: | |||||
Third Quarter 2026 Supplemental Financial Reporting Package | Page 2 |  | ||||||
Investor Company Summary. | ||||||||
| Executive Management Team | ||||||||
| Laura Clark | Chief Executive Officer, Director | |||||||
| John Nahas | Chief Operating Officer | |||||||
| Michael Fitzmaurice | Chief Financial Officer | |||||||
| David E. Lanzer | General Counsel and Corporate Secretary | |||||||
| Board of Directors | ||||||||
| Tyler H. Rose | Chairman | |||||||
| Laura Clark | Chief Executive Officer, Director | |||||||
| Robert L. Antin | Director | |||||||
| Diana J. Ingram | Director | |||||||
| Angela L. Kleiman | Director | |||||||
| Debra L. Morris | Director | |||||||
| David P. Stockert | Director | |||||||
| Investor Relations Information | ||||||||
| Doug Bettisworth | ||||||||
| SVP, Investor Relations and Capital Markets | ||||||||
| dbettisworth@rexfordindustrial.com | ||||||||
| Equity Research Coverage | ||||||||||||||||||||||||||||||||
| BofA Securities | Samir Khanal | (646) 855-1497 | J.P. Morgan Securities | Michael Mueller | (212) 622-6689 | |||||||||||||||||||||||||||
| Barclays | Brendan Lynch | (212) 526-9428 | Jefferies LLC | Jonathan Petersen | (212) 284-1705 | |||||||||||||||||||||||||||
| BMO Capital Markets | John Kim | (212) 885-4115 | Mizuho Securities USA | Vikram Malhotra | (212) 282-3827 | |||||||||||||||||||||||||||
| BNP Paribas Exane | Nate Crossett | (646) 342-1588 | Raymond James & Associates | David Rodgers | (727) 590-6578 | |||||||||||||||||||||||||||
| Cantor Fitzgerald | Richard Anderson | (929) 441-6927 | Robert W. Baird & Co. | Nicholas Thillman | (414) 298-5053 | |||||||||||||||||||||||||||
| Citigroup Investment Research | Craig Mailman | (212) 816-4471 | Scotiabank | Greg McGinniss | (212) 225-6906 | |||||||||||||||||||||||||||
| Colliers Securities | Barry Oxford | (203) 961-6573 | Truist Securities | Anthony Hau | (212) 303-4176 | |||||||||||||||||||||||||||
| Deutsche Bank | Omotayo Okusanya | (212) 250-9284 | Wells Fargo Securities | Blaine Heck | (443) 263-6529 | |||||||||||||||||||||||||||
| Evercore ISI | Michael Griffin | (212) 446-9462 | Wolfe Research | Andrew Rosivach | (646) 582-9250 | |||||||||||||||||||||||||||
| Green Street Advisors | Vince Tibone | (949) 640-8780 | ||||||||||||||||||||||||||||||
Third Quarter 2026 Supplemental Financial Reporting Package | Page 3 | | ||||||
Company Overview. | ||||||||
| For the Quarter Ended September 30, 2026 | ||||||||
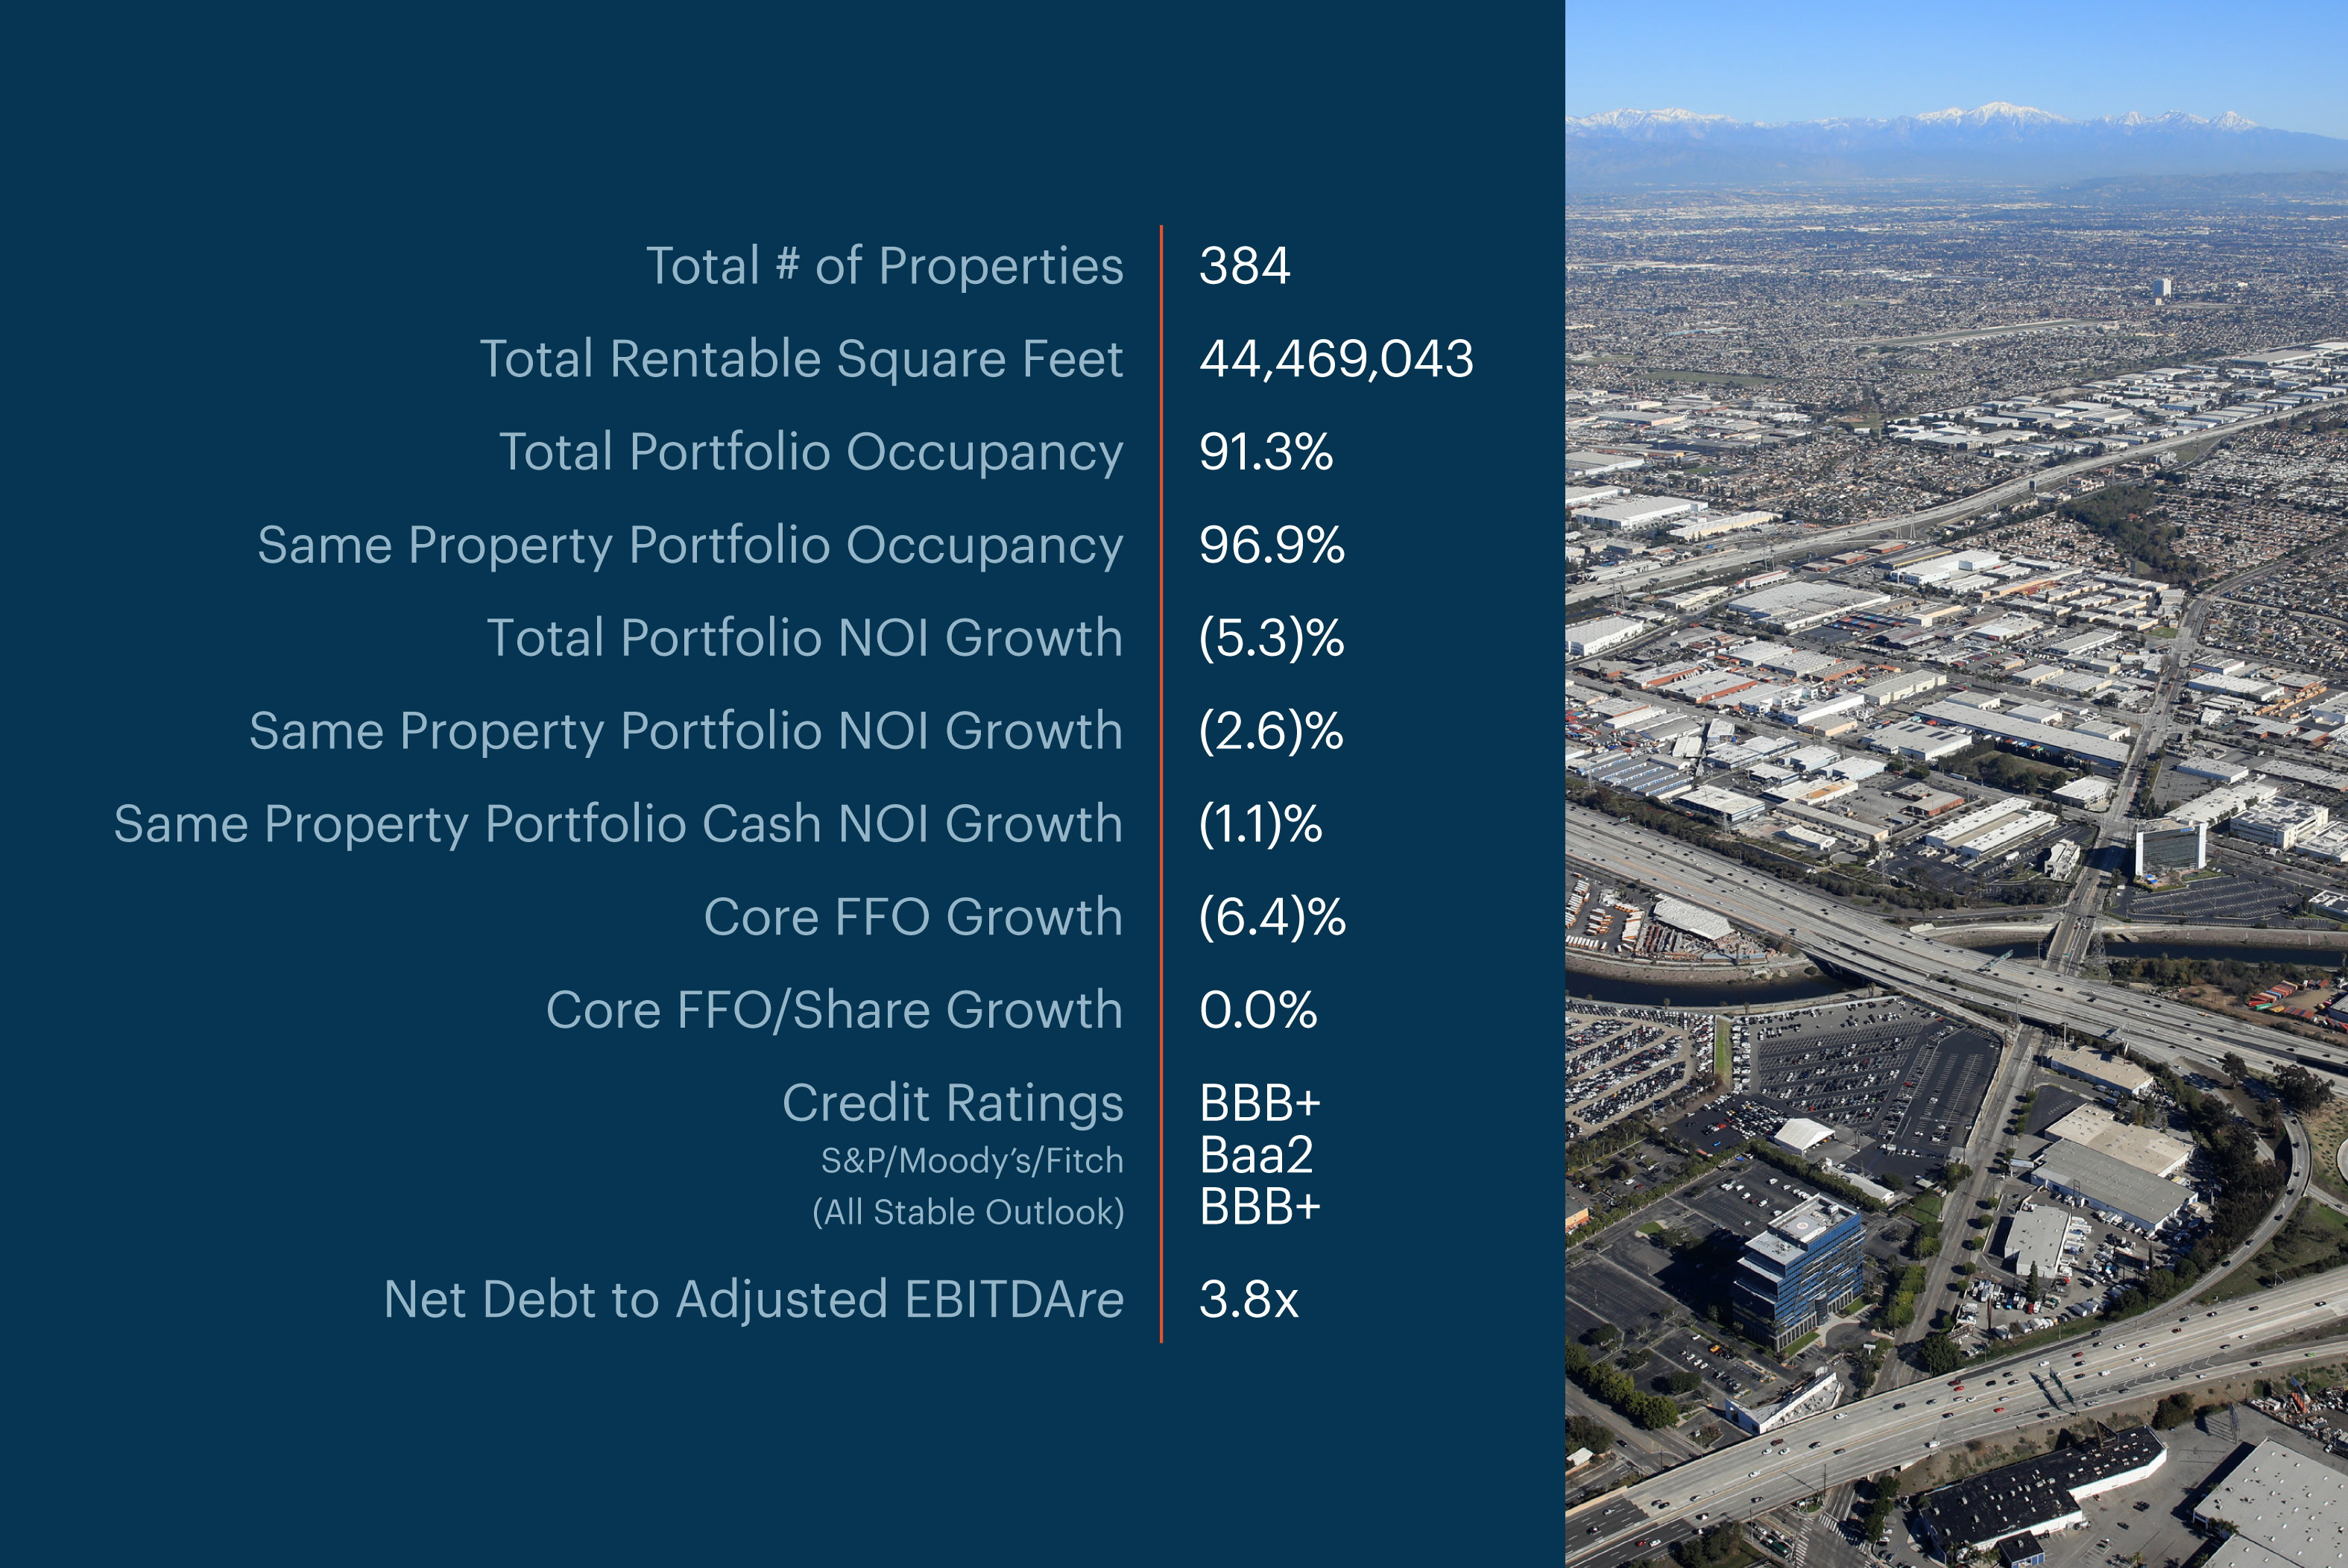
Third Quarter 2026 Supplemental Financial Reporting Package | Page 4 | | ||||||
Financial and Portfolio Highlights and Capitalization Data.(1) | ||||||||
| (in thousands except share and per share data and portfolio statistics) | ||||||||
| Three Months Ended | |||||||||||||||||||||||||||||
| September 30, 2026 | June 30, 2026 | March 31, 2026 | December 31, 2025 | September 30, 2025 | |||||||||||||||||||||||||
| Financial Results: | |||||||||||||||||||||||||||||
| Total rental income | $ | 235,837 | $ | 242,996 | $ | 242,141 | $ | 243,230 | $ | 246,757 | |||||||||||||||||||
| Net income (loss) | $ | 18,070 | $ | (523,811) | $ | 94,562 | $ | (67,735) | $ | 93,056 | |||||||||||||||||||
| Net Operating Income (NOI) | $ | 178,841 | $ | 186,782 | $ | 185,378 | $ | 183,943 | $ | 188,878 | |||||||||||||||||||
| Company share of Core FFO | $ | 132,698 | $ | 141,402 | $ | 139,758 | $ | 136,182 | $ | 141,700 | |||||||||||||||||||
| Company share of Core FFO per common share - diluted | $ | 0.60 | $ | 0.63 | $ | 0.61 | $ | 0.59 | $ | 0.60 | |||||||||||||||||||
Adjusted EBITDAre | $ | 156,824 | $ | 182,052 | $ | 178,557 | $ | 177,808 | $ | 182,624 | |||||||||||||||||||
| Dividend declared per common share | $ | 0.435 | $ | 0.435 | $ | 0.435 | $ | 0.430 | $ | 0.430 | |||||||||||||||||||
| Portfolio Statistics: | |||||||||||||||||||||||||||||
| Portfolio rentable square feet (“RSF”) | 44,469,043 | 49,934,203 | 50,445,312 | 51,161,188 | 50,850,824 | ||||||||||||||||||||||||
| Ending occupancy | 91.3% | 90.0% | 90.7% | 90.2% | 91.8% | ||||||||||||||||||||||||
| Ending occupancy excluding repositioning/development | 96.1% | 94.8% | 95.2% | 96.0% | 97.3% | ||||||||||||||||||||||||
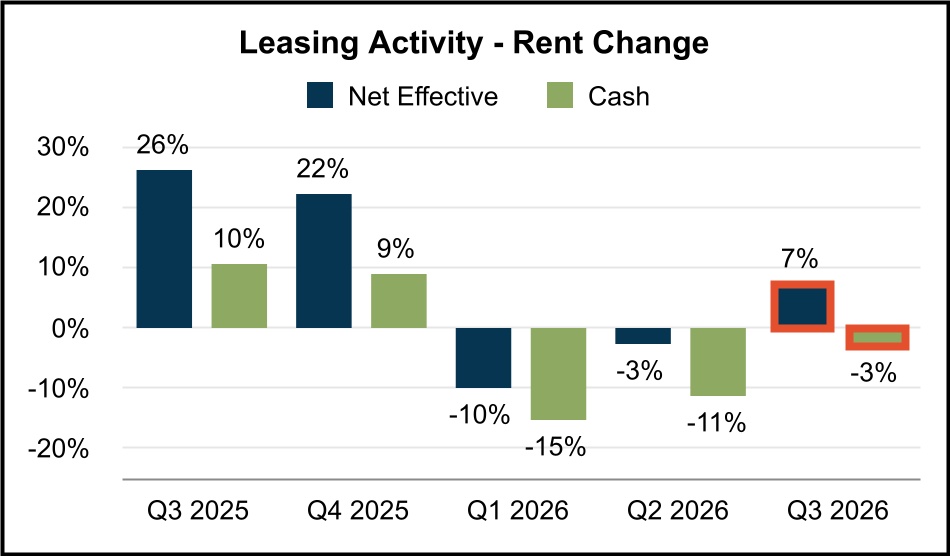
| Net Effective Rent Change | 7.1% | (2.8)% | (10.0)% | 22.0% | 26.1% | ||||||||||||||||||||||||
| Cash Rent Change | (3.0)% | (11.3)% | (15.4)% | 9.0% | 10.3% | ||||||||||||||||||||||||
| Same Property Portfolio Performance: | |||||||||||||||||||||||||||||
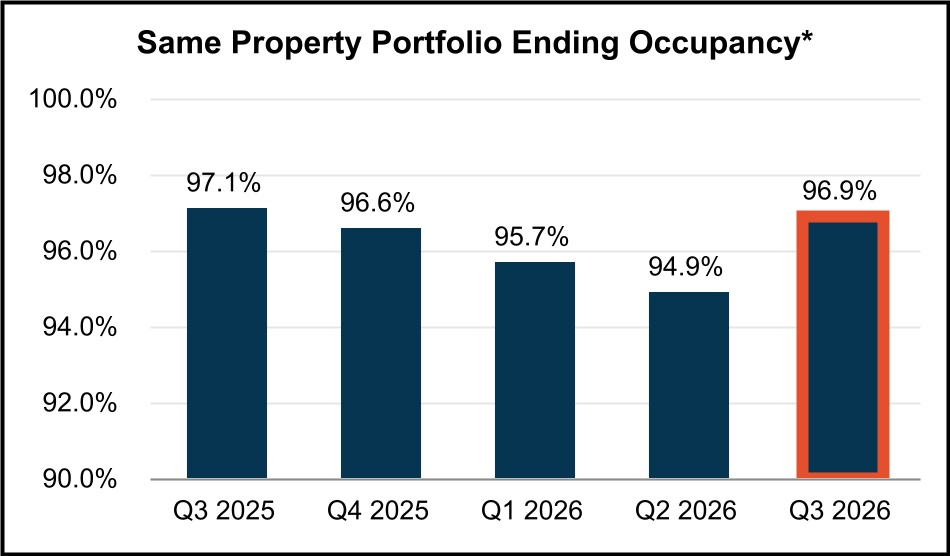
Same Property Portfolio ending occupancy(2)(3) | 96.9% | 94.9% | 95.7% | 96.6% | 97.1% | ||||||||||||||||||||||||
Same Property Portfolio NOI growth(3)(4) | (2.6)% | (0.1)% | 2.6% | ||||||||||||||||||||||||||
Same Property Portfolio Cash NOI growth(3)(4) | (1.1)% | 1.1% | 3.0% | ||||||||||||||||||||||||||
| Capitalization: | |||||||||||||||||||||||||||||
Total shares and units issued and outstanding at period end(5) | 222,935,580 | 231,077,181 | 233,127,293 | 238,245,286 | 240,452,878 | ||||||||||||||||||||||||
| Series B and C Preferred Stock and Series 3 CPOP Units | $ | 173,250 | $ | 173,250 | $ | 173,250 | $ | 173,250 | $ | 173,250 | |||||||||||||||||||
| Total equity market capitalization | $ | 8,259,123 | $ | 7,914,336 | $ | 7,803,506 | $ | 9,398,107 | $ | 10,058,268 | |||||||||||||||||||
| Total consolidated debt | $ | 2,786,284 | $ | 3,285,503 | $ | 3,271,720 | $ | 3,278,649 | $ | 3,278,896 | |||||||||||||||||||
| Total combined market capitalization (net debt plus equity) | $ | 10,621,817 | $ | 11,167,613 | $ | 11,023,512 | $ | 12,510,978 | $ | 13,088,208 | |||||||||||||||||||
| Ratios: | |||||||||||||||||||||||||||||
| Net debt to total combined market capitalization | 22.2% | 29.1% | 29.2% | 24.9% | 23.2% | ||||||||||||||||||||||||
Net debt to Adjusted EBITDAre (quarterly results annualized) | 3.8x | 4.5x | 4.5x | 4.4x | 4.1x | ||||||||||||||||||||||||
Third Quarter 2026 Supplemental Financial Reporting Package | Page 5 | | ||||||
Guidance. | ||||||||
| As of September 30, 2026 | ||||||||
Q3 2026 Updated Guidance | Q2 2026 Guidance | YTD Results as of September 30, 2026 | |||||||||||||||||||||
| Earnings | |||||||||||||||||||||||
Net Loss Attributable to Common Stockholders per diluted share(1)(2) | ($1.55) - ($1.52) | ($1.32) - ($1.27) | $(1.80) | ||||||||||||||||||||
Company share of Core FFO per diluted share(1)(2) | $2.41 - $2.44 | $2.38 - $2.43 | $1.85 | ||||||||||||||||||||
Same Property Portfolio(3) | |||||||||||||||||||||||
| Same Property Portfolio NOI Growth - Net Effective | (0.25)% - 0.25% | (1.25)% - (0.25)% | (0.1)% | ||||||||||||||||||||
| Same Property Portfolio NOI Growth - Cash | 0.25% - 0.75% | (0.75)% - 0.25% | 0.9% | ||||||||||||||||||||
| Average Same Property Portfolio Occupancy (Full Year) | 95.8% - 96.0% | 95.3% - 95.7% | 95.9% | ||||||||||||||||||||
| Capital Allocation | |||||||||||||||||||||||
| Dispositions | $1.7B - $2.0B | $1.5B - $2.0B | $1.5B | ||||||||||||||||||||
Repositioning/Development Annualized Stabilized Cash NOI(4) | $16M - $18M | $16M - $18M | $5M | ||||||||||||||||||||
| Repositioning/Development Starts (SF) | 0.8M | 1.2M | 0.3M | ||||||||||||||||||||
| Repositioning/Development Starts (Total Estimated Project Costs) | $125M - $130M | $160M - $170M | $40M | ||||||||||||||||||||
| Other Assumptions | |||||||||||||||||||||||
| General and Administrative Expenses | +/-$57M | +/-$57M | $42.0M | ||||||||||||||||||||
Interest Expense(5) | +/-$105M | +/-$105M | $82.8M | ||||||||||||||||||||
Third Quarter 2026 Supplemental Financial Reporting Package | Page 6 | | ||||||
Guidance (Continued). | ||||||||
| As of September 30, 2026 | ||||||||
| Earnings Components | Range ($ per share) | Notes | ||||||||||||||||||
Q2 2026 Core FFO Per Diluted Share Guidance | $2.38 | $2.43 | ||||||||||||||||||
Same Property Portfolio NOI Growth - Net Effective | 0.03 | 0.01 | Projected higher average occupancy driven by better-than-expected leasing; lower projected bad debt expense | |||||||||||||||||
Current 2026 Core FFO Per Diluted Share Guidance | $2.41 | $2.44 | ||||||||||||||||||
| Core FFO Per Diluted Share Annual Growth | 0.4% | 1.7% | ||||||||||||||||||
Third Quarter 2026 Supplemental Financial Reporting Package | Page 7 | | ||||||
Consolidated Balance Sheets. | ||||||||
| (unaudited and in thousands) | ||||||||
| September 30, 2026 | June 30, 2026 | March 31, 2026 | December 31, 2025 | September 30, 2025 | |||||||||||||||||||||||||
| ASSETS | |||||||||||||||||||||||||||||
| Land | $ | 6,326,663 | $ | 7,104,413 | $ | 7,562,694 | $ | 7,689,921 | $ | 7,774,737 | |||||||||||||||||||
| Buildings and improvements | 4,109,826 | 4,541,066 | 4,821,492 | 4,677,318 | 4,607,202 | ||||||||||||||||||||||||
| Tenant improvements | 211,910 | 206,540 | 205,656 | 198,161 | 194,405 | ||||||||||||||||||||||||
| Furniture, fixtures, and equipment | 132 | 132 | 132 | 132 | 132 | ||||||||||||||||||||||||
| Construction in progress | 312,737 | 324,365 | 327,029 | 451,109 | 475,072 | ||||||||||||||||||||||||
| Total real estate held for investment | 10,961,268 | 12,176,516 | 12,917,003 | 13,016,641 | 13,051,548 | ||||||||||||||||||||||||
| Accumulated depreciation | (1,197,110) | (1,163,226) | (1,219,932) | (1,165,792) | (1,119,746) | ||||||||||||||||||||||||
| Investments in real estate, net | 9,764,158 | 11,013,290 | 11,697,071 | 11,850,849 | 11,931,802 | ||||||||||||||||||||||||
| Cash and cash equivalents | 423,590 | 32,226 | 51,714 | 165,778 | 248,956 | ||||||||||||||||||||||||
| Restricted cash | — | — | — | — | 65,464 | ||||||||||||||||||||||||
| Loan receivable, net | 124,049 | 123,934 | 123,819 | 123,704 | 123,589 | ||||||||||||||||||||||||
| Rents and other receivables, net | 15,540 | 12,132 | 11,962 | 13,958 | 15,727 | ||||||||||||||||||||||||
| Deferred rent receivable, net | 206,632 | 210,474 | 205,398 | 190,376 | 181,439 | ||||||||||||||||||||||||
| Deferred leasing costs, net | 98,587 | 90,864 | 92,022 | 87,745 | 82,227 | ||||||||||||||||||||||||
| Deferred loan costs, net | 5,372 | 5,877 | 6,382 | 6,886 | 7,391 | ||||||||||||||||||||||||
Acquired lease intangible assets, net(1) | 94,937 | 114,489 | 130,045 | 140,627 | 154,931 | ||||||||||||||||||||||||
Acquired indefinite-lived intangible asset | 5,156 | 5,156 | 5,156 | 5,156 | 5,156 | ||||||||||||||||||||||||
Interest rate swap assets | 16,985 | 9,247 | 4,562 | 2,025 | 2,804 | ||||||||||||||||||||||||
| Other assets | 31,841 | 16,987 | 20,500 | 25,609 | 31,522 | ||||||||||||||||||||||||
| Assets associated with real estate held for sale, net | — | — | 48,761 | — | — | ||||||||||||||||||||||||
| Total Assets | $ | 10,786,847 | $ | 11,634,676 | $ | 12,397,392 | $ | 12,612,713 | $ | 12,851,008 | |||||||||||||||||||
| LIABILITIES & EQUITY | |||||||||||||||||||||||||||||
| Liabilities | |||||||||||||||||||||||||||||
| Notes payable | $ | 2,767,195 | $ | 3,263,724 | $ | 3,247,451 | $ | 3,251,909 | $ | 3,249,733 | |||||||||||||||||||
| Interest rate swap liability | — | 3 | 9 | 829 | 1,626 | ||||||||||||||||||||||||
| Accounts payable, accrued expenses and other liabilities | 137,943 | 99,101 | 125,007 | 120,849 | 153,558 | ||||||||||||||||||||||||
| Dividends and distributions payable | 97,407 | 100,960 | 102,418 | 103,399 | 103,913 | ||||||||||||||||||||||||
Acquired lease intangible liabilities, net(2) | 101,565 | 105,856 | 110,914 | 116,487 | 122,870 | ||||||||||||||||||||||||
| Tenant security deposits | 89,204 | 92,386 | 95,219 | 92,444 | 91,835 | ||||||||||||||||||||||||
Tenant prepaid rents | 78,248 | 79,518 | 82,186 | 88,777 | 85,114 | ||||||||||||||||||||||||
| Liabilities associated with real estate held for sale | — | — | 482 | — | — | ||||||||||||||||||||||||
| Total Liabilities | 3,271,562 | 3,741,548 | 3,763,686 | 3,774,694 | 3,808,649 | ||||||||||||||||||||||||
| Equity | |||||||||||||||||||||||||||||
| Series B preferred stock, net ($75,000 liquidation preference) | 72,443 | 72,443 | 72,443 | 72,443 | 72,443 | ||||||||||||||||||||||||
| Series C preferred stock, net ($86,250 liquidation preference) | 83,233 | 83,233 | 83,233 | 83,233 | 83,233 | ||||||||||||||||||||||||
| Preferred stock | 155,676 | 155,676 | 155,676 | 155,676 | 155,676 | ||||||||||||||||||||||||
| Common stock | 2,149 | 2,230 | 2,263 | 2,316 | 2,328 | ||||||||||||||||||||||||
| Additional paid in capital | 8,326,486 | 8,631,341 | 8,745,875 | 8,945,123 | 8,993,439 | ||||||||||||||||||||||||
| Cumulative distributions in excess of earnings | (1,333,548) | (1,255,153) | (651,692) | (642,130) | (474,813) | ||||||||||||||||||||||||
| Accumulated other comprehensive income (loss) | 14,978 | 7,473 | 2,887 | (422) | (515) | ||||||||||||||||||||||||
| Total stockholders’ equity | 7,165,741 | 7,541,567 | 8,255,009 | 8,460,563 | 8,676,115 | ||||||||||||||||||||||||
| Noncontrolling interests | 349,544 | 351,561 | 378,697 | 377,456 | 366,244 | ||||||||||||||||||||||||
| Total Equity | 7,515,285 | 7,893,128 | 8,633,706 | 8,838,019 | 9,042,359 | ||||||||||||||||||||||||
| Total Liabilities and Equity | $ | 10,786,847 | $ | 11,634,676 | $ | 12,397,392 | $ | 12,612,713 | $ | 12,851,008 | |||||||||||||||||||
Third Quarter 2026 Supplemental Financial Reporting Package | Page 8 | | ||||||
Consolidated Statements of Operations. | ||||||||
| Quarterly Results | (unaudited and in thousands, except share and per share data) | |||||||
| Three Months Ended | |||||||||||||||||||||||||||||
| Sep 30, 2026 | Jun 30, 2026 | Mar 31, 2026 | Dec 31, 2025 | Sep 30, 2025 | |||||||||||||||||||||||||
| Revenues | |||||||||||||||||||||||||||||
Rental income(1) | $ | 235,837 | $ | 242,996 | $ | 242,141 | $ | 243,230 | $ | 246,757 | |||||||||||||||||||
| Management and leasing services | — | — | — | 197 | 118 | ||||||||||||||||||||||||
| Interest income | 3,266 | 2,510 | 2,937 | 4,670 | 6,367 | ||||||||||||||||||||||||
| Total Revenues | 239,103 | 245,506 | 245,078 | 248,097 | 253,242 | ||||||||||||||||||||||||
| Operating Expenses | |||||||||||||||||||||||||||||
| Property expenses | 56,996 | 56,214 | 56,763 | 59,287 | 57,879 | ||||||||||||||||||||||||
| General and administrative | 13,431 | 13,693 | 14,925 | 19,199 | 20,037 | ||||||||||||||||||||||||
| Depreciation and amortization | 74,440 | 73,479 | 72,933 | 76,819 | 81,172 | ||||||||||||||||||||||||
| Total Operating Expenses | 144,867 | 143,386 | 144,621 | 155,305 | 159,088 | ||||||||||||||||||||||||
| Other (Expenses) Income | |||||||||||||||||||||||||||||
Other income | — | 3,500 | 1,350 | — | — | ||||||||||||||||||||||||
| Other expenses, net | (2,561) | 2,001 | (102) | (65,910) | (4,218) | ||||||||||||||||||||||||
Interest expense(2) | (24,785) | (28,571) | (26,600) | (25,451) | (25,463) | ||||||||||||||||||||||||
| Impairment of real estate | (71,834) | (624,754) | (6,824) | (89,097) | — | ||||||||||||||||||||||||
| Debt extinguishment and modification expenses | (194) | — | — | — | — | ||||||||||||||||||||||||
| Gains on sale of real estate | 23,208 | 21,893 | 26,281 | 19,931 | 28,583 | ||||||||||||||||||||||||
| Total Other (Expenses) Income | (76,166) | (625,931) | (5,895) | (160,527) | (1,098) | ||||||||||||||||||||||||
| Net Income (Loss) | 18,070 | (523,811) | 94,562 | (67,735) | 93,056 | ||||||||||||||||||||||||
| Less: net (income) loss attributable to noncontrolling interests | (685) | 19,665 | (3,375) | 2,312 | (3,137) | ||||||||||||||||||||||||
| Net income (loss) attributable to Rexford Industrial Realty, Inc. | 17,385 | (504,146) | 91,187 | (65,423) | 89,919 | ||||||||||||||||||||||||
| Less: preferred stock dividends | (2,314) | (2,315) | (2,314) | (2,315) | (2,314) | ||||||||||||||||||||||||
| Less: earnings allocated to participating securities | (430) | (441) | (1,008) | (952) | (519) | ||||||||||||||||||||||||
| Net income (loss) attributable to common stockholders | $ | 14,641 | $ | (506,902) | $ | 87,865 | $ | (68,690) | $ | 87,086 | |||||||||||||||||||
| Earnings per Common Share | |||||||||||||||||||||||||||||
| Net income (loss) attributable to common stockholders per share - basic | $ | 0.07 | $ | (2.26) | $ | 0.38 | $ | (0.30) | $ | 0.37 | |||||||||||||||||||
| Net income (loss) attributable to common stockholders per share - diluted | $ | 0.07 | $ | (2.26) | $ | 0.38 | $ | (0.30) | $ | 0.37 | |||||||||||||||||||
| Weighted average shares outstanding - basic | 220,509,521 | 223,812,383 | 228,312,419 | 231,758,110 | 234,586,980 | ||||||||||||||||||||||||
| Weighted average shares outstanding - diluted | 220,509,521 | 223,812,383 | 228,312,419 | 232,050,966 | 234,586,980 | ||||||||||||||||||||||||
Third Quarter 2026 Supplemental Financial Reporting Package | Page 9 | | ||||||
Consolidated Statements of Operations. | ||||||||
| Quarterly Results (continued) | (unaudited and in thousands, except share and per share data) | |||||||
| Three Months Ended September 30, | Nine Months Ended September 30, | ||||||||||||||||||||||
| 2026 | 2025 | 2026 | 2025 | ||||||||||||||||||||
| Revenues | |||||||||||||||||||||||
| Rental income | $ | 235,837 | $ | 246,757 | $ | 720,974 | $ | 737,146 | |||||||||||||||
| Management and leasing services | — | 118 | — | 392 | |||||||||||||||||||
| Interest income | 3,266 | 6,367 | 8,713 | 17,498 | |||||||||||||||||||
| Total Revenues | 239,103 | 253,242 | 729,687 | 755,036 | |||||||||||||||||||
| Operating Expenses | |||||||||||||||||||||||
| Property expenses | 56,996 | 57,879 | 169,973 | 168,438 | |||||||||||||||||||
| General and administrative | 13,431 | 20,037 | 42,049 | 59,657 | |||||||||||||||||||
| Depreciation and amortization | 74,440 | 81,172 | 220,852 | 239,100 | |||||||||||||||||||
| Total Operating Expenses | 144,867 | 159,088 | 432,874 | 467,195 | |||||||||||||||||||
| Other (Expenses) Income | |||||||||||||||||||||||
| Other income | — | — | 4,850 | — | |||||||||||||||||||
| Other expenses, net | (2,561) | (4,218) | (662) | (6,701) | |||||||||||||||||||
| Interest expense | (24,785) | (25,463) | (79,956) | (79,452) | |||||||||||||||||||
Impairment of real estate | (71,834) | — | (703,412) | — | |||||||||||||||||||
Debt extinguishment and modification expenses | (194) | — | (194) | (291) | |||||||||||||||||||
| Gains on sale of real estate | 23,208 | 28,583 | 71,382 | 86,101 | |||||||||||||||||||
| Total Other (Expenses) Income | (76,166) | (1,098) | (707,992) | (343) | |||||||||||||||||||
| Net Income (Loss) | 18,070 | 93,056 | (411,179) | 287,498 | |||||||||||||||||||
| Less: net (income) loss attributable to noncontrolling interests | (685) | (3,137) | 15,605 | (10,046) | |||||||||||||||||||
| Net income (loss) attributable to Rexford Industrial Realty, Inc. | 17,385 | 89,919 | (395,574) | 277,452 | |||||||||||||||||||
| Less: preferred stock dividends | (2,314) | (2,314) | (6,943) | (6,943) | |||||||||||||||||||
| Less: earnings allocated to participating securities | (430) | (519) | (1,879) | (1,650) | |||||||||||||||||||
| Net income (loss) attributable to common stockholders | $ | 14,641 | $ | 87,086 | $ | (404,396) | $ | 268,859 | |||||||||||||||
| Net income (loss) attributable to common stockholders per share – basic and diluted | $ | 0.07 | $ | 0.37 | $ | (1.80) | $ | 1.16 | |||||||||||||||
| Weighted-average shares of common stock outstanding – basic and diluted | 220,509,521 | 234,586,980 | 224,182,859 | 232,720,272 | |||||||||||||||||||
Third Quarter 2026 Supplemental Financial Reporting Package | Page 10 | | ||||||
Non-GAAP FFO and Core FFO Reconciliations.(1) | ||||||||
| (unaudited and in thousands, except share and per share data) | ||||||||
| Three Months Ended | |||||||||||||||||||||||||||||
| September 30, 2026 | June 30, 2026 | March 31, 2026 | December 31, 2025 | September 30, 2025 | |||||||||||||||||||||||||
| Net Income (Loss) | $ | 18,070 | $ | (523,811) | $ | 94,562 | $ | (67,735) | $ | 93,056 | |||||||||||||||||||
| Adjustments: | |||||||||||||||||||||||||||||
| Depreciation and amortization | 74,440 | 73,479 | 72,933 | 76,819 | 81,172 | ||||||||||||||||||||||||
Impairment of real estate(2) | 71,834 | 624,754 | 6,824 | 89,097 | — | ||||||||||||||||||||||||
| Gains on sale of real estate | (23,208) | (21,893) | (26,281) | (19,931) | (28,583) | ||||||||||||||||||||||||
| NAREIT Defined Funds From Operations (FFO) | 141,136 | 152,529 | 148,038 | 78,250 | 145,645 | ||||||||||||||||||||||||
| Less: preferred stock dividends | (2,314) | (2,315) | (2,314) | (2,315) | (2,314) | ||||||||||||||||||||||||
Less: FFO attributable to noncontrolling interests(3) | (5,358) | (5,726) | (5,282) | (2,688) | (4,906) | ||||||||||||||||||||||||
Less: FFO attributable to participating securities(4) | (610) | (680) | (1,434) | (953) | (713) | ||||||||||||||||||||||||
| Company share of FFO | $ | 132,854 | $ | 143,808 | $ | 139,008 | $ | 72,294 | $ | 137,712 | |||||||||||||||||||
| Company share of FFO per common share‐basic | $ | 0.60 | $ | 0.64 | $ | 0.61 | $ | 0.31 | $ | 0.59 | |||||||||||||||||||
| Company share of FFO per common share‐diluted | $ | 0.60 | $ | 0.64 | $ | 0.61 | $ | 0.31 | $ | 0.59 | |||||||||||||||||||
| FFO | $ | 141,136 | $ | 152,529 | $ | 148,038 | $ | 78,250 | $ | 145,645 | |||||||||||||||||||
| Adjustments: | |||||||||||||||||||||||||||||
Acquisition expenses(5) | — | — | — | 10 | 161 | ||||||||||||||||||||||||
| Debt extinguishment and modification expenses | 194 | — | — | — | — | ||||||||||||||||||||||||
| Gain on termination of interest rate swaps | (2,874) | — | — | — | — | ||||||||||||||||||||||||
Non-capitalizable demolition costs(5) | 1,309 | — | — | — | — | ||||||||||||||||||||||||
Co-CEO transition costs(5)(6) | 528 | (2,330) | — | 60,223 | — | ||||||||||||||||||||||||
Severance costs(5)(7) | 680 | 269 | — | — | 2,728 | ||||||||||||||||||||||||
Other nonrecurring expenses(5)(8) | — | 45 | 62 | 5,605 | 1,259 | ||||||||||||||||||||||||
Write-offs of below-market lease intangibles related to unexercised renewal options(9) | — | (497) | — | — | — | ||||||||||||||||||||||||
| Core FFO | 140,973 | 150,016 | 148,100 | 144,088 | 149,793 | ||||||||||||||||||||||||
| Less: preferred stock dividends | (2,314) | (2,315) | (2,314) | (2,315) | (2,314) | ||||||||||||||||||||||||
Less: Core FFO attributable to noncontrolling interests(3) | (5,351) | (5,631) | (5,284) | (4,943) | (5,045) | ||||||||||||||||||||||||
Less: Core FFO attributable to participating securities(4)(10) | (610) | (668) | (744) | (648) | (734) | ||||||||||||||||||||||||
| Company share of Core FFO | $ | 132,698 | $ | 141,402 | $ | 139,758 | $ | 136,182 | $ | 141,700 | |||||||||||||||||||
| Company share of Core FFO per common share‐basic | $ | 0.60 | $ | 0.63 | $ | 0.61 | $ | 0.59 | $ | 0.60 | |||||||||||||||||||
| Company share of Core FFO per common share‐diluted | $ | 0.60 | $ | 0.63 | $ | 0.61 | $ | 0.59 | $ | 0.60 | |||||||||||||||||||
| Weighted-average shares outstanding-basic | 220,509,521 | 223,812,383 | 228,312,419 | 231,758,110 | 234,586,980 | ||||||||||||||||||||||||
| Weighted-average shares outstanding-diluted | 220,509,521 | 223,812,383 | 228,312,419 | 232,050,966 | 234,586,980 | ||||||||||||||||||||||||
Third Quarter 2026 Supplemental Financial Reporting Package | Page 11 | | ||||||
Non-GAAP FFO and Core FFO Reconciliations.(1) | ||||||||
| (unaudited and in thousands, except share and per share data) | ||||||||
| Three Months Ended September 30, | Nine Months Ended September 30, | |||||||||||||||||||||||||
| 2026 | 2025 | 2026 | 2025 | |||||||||||||||||||||||
| Net Income (Loss) | $ | 18,070 | $ | 93,056 | $ | (411,179) | $ | 287,498 | ||||||||||||||||||
| Adjustments: | ||||||||||||||||||||||||||
| Depreciation and amortization | 74,440 | 81,172 | 220,852 | 239,100 | ||||||||||||||||||||||
Impairment of real estate(2) | 71,834 | — | 703,412 | — | ||||||||||||||||||||||
| Gains on sale of real estate | (23,208) | (28,583) | (71,382) | (86,101) | ||||||||||||||||||||||
| Funds From Operations (FFO) | 141,136 | 145,645 | 441,703 | 440,497 | ||||||||||||||||||||||
| Less: preferred stock dividends | (2,314) | (2,314) | (6,943) | (6,943) | ||||||||||||||||||||||
| Less: FFO attributable to noncontrolling interests | (5,358) | (4,906) | (16,366) | (15,262) | ||||||||||||||||||||||
| Less: FFO attributable to participating securities | (610) | (713) | (2,724) | (2,191) | ||||||||||||||||||||||
| Company share of FFO | $ | 132,854 | $ | 137,712 | $ | 415,670 | $ | 416,101 | ||||||||||||||||||
| Company share of FFO per common share‐basic and diluted | $ | 0.60 | $ | 0.59 | $ | 1.85 | $ | 1.79 | ||||||||||||||||||
| FFO | $ | 141,136 | $ | 145,645 | $ | 441,703 | $ | 440,497 | ||||||||||||||||||
| Adjustments: | ||||||||||||||||||||||||||
Acquisition expenses(3) | — | 161 | — | 263 | ||||||||||||||||||||||
| Debt extinguishment and modification expenses | 194 | — | 194 | 291 | ||||||||||||||||||||||
| Gain on termination of interest rate swaps | (2,874) | — | (2,874) | — | ||||||||||||||||||||||
Non-capitalizable demolition costs(3) | 1,309 | — | 1,309 | 365 | ||||||||||||||||||||||
Co-CEO transition costs(3)(4) | 528 | — | (1,802) | — | ||||||||||||||||||||||
Severance costs(3)(5) | 680 | 2,728 | 949 | 4,410 | ||||||||||||||||||||||
Other nonrecurring expenses(3)(6) | — | 1,259 | 107 | 1,259 | ||||||||||||||||||||||
Write-offs of below-market lease intangibles related to unexercised renewal options(7) | — | — | (497) | — | ||||||||||||||||||||||
| Core FFO | 140,973 | 149,793 | 439,089 | 447,085 | ||||||||||||||||||||||
| Less: preferred stock dividends | (2,314) | (2,314) | (6,943) | (6,943) | ||||||||||||||||||||||
| Less: Core FFO attributable to noncontrolling interests | (5,351) | (5,045) | (16,266) | (15,485) | ||||||||||||||||||||||
| Less: Core FFO attributable to participating securities | (610) | (734) | (2,022) | (2,225) | ||||||||||||||||||||||
| Company share of Core FFO | $ | 132,698 | $ | 141,700 | $ | 413,858 | $ | 422,432 | ||||||||||||||||||
| Company share of Core FFO per common share‐basic and diluted | $ | 0.60 | $ | 0.60 | $ | 1.85 | $ | 1.82 | ||||||||||||||||||
| Weighted-average shares outstanding-basic and diluted | 220,509,521 | 234,586,980 | 224,182,859 | 232,720,272 | ||||||||||||||||||||||
Third Quarter 2026 Supplemental Financial Reporting Package | Page 12 | | ||||||
Non-GAAP AFFO Reconciliation.(1) | ||||||||
| (unaudited and in thousands, except share and per share data) | ||||||||
| Three Months Ended | |||||||||||||||||||||||||||||
| September 30, 2026 | June 30, 2026 | March 31, 2026 | December 31, 2025 | September 30, 2025 | |||||||||||||||||||||||||
Funds From Operations(2) | $ | 141,136 | $ | 152,529 | $ | 148,038 | $ | 78,250 | $ | 145,645 | |||||||||||||||||||
| Adjustments: | |||||||||||||||||||||||||||||
| Amortization of deferred financing costs | 1,319 | 1,333 | 1,334 | 1,333 | 1,340 | ||||||||||||||||||||||||
| Non-cash stock compensation | 4,106 | 3,666 | 4,063 | 8,537 | 10,485 | ||||||||||||||||||||||||
| Debt extinguishment and modification expenses | 194 | — | — | — | — | ||||||||||||||||||||||||
| Gain on termination of interest rate swaps | (2,874) | — | — | — | — | ||||||||||||||||||||||||
| Amortization related to settlement of treasury rate lock agreements | 78 | 77 | 77 | 78 | 78 | ||||||||||||||||||||||||
| Note payable (discount) premium amortization, net | 1,681 | 1,662 | 1,641 | 1,616 | 1,597 | ||||||||||||||||||||||||
| Non-capitalizable demolition costs | 1,309 | — | — | — | — | ||||||||||||||||||||||||
Co-CEO transition costs(3) | 528 | (2,330) | — | 60,223 | — | ||||||||||||||||||||||||
| Severance costs | 680 | 269 | — | — | 2,728 | ||||||||||||||||||||||||
| Other nonrecurring expenses | — | 45 | 62 | 5,605 | 1,259 | ||||||||||||||||||||||||
| Deduct: | |||||||||||||||||||||||||||||
| Preferred stock dividends | (2,314) | (2,315) | (2,314) | (2,315) | (2,314) | ||||||||||||||||||||||||
Straight line rental revenue adjustment(4) | (6,000) | (9,967) | (15,136) | (9,073) | (8,164) | ||||||||||||||||||||||||
| Above/(below) market lease revenue adjustments | (3,438) | (3,805) | (4,647) | (4,129) | (5,254) | ||||||||||||||||||||||||
Capitalized payments(5) | (11,563) | (10,612) | (13,203) | (14,814) | (15,756) | ||||||||||||||||||||||||
| Accretion of net loan origination fees | (115) | (115) | (115) | (115) | (115) | ||||||||||||||||||||||||
Recurring capital expenditures(6) | (4,685) | (4,750) | (2,314) | (2,566) | (3,563) | ||||||||||||||||||||||||
2nd generation tenant improvements(7) | (574) | (242) | (185) | (179) | (460) | ||||||||||||||||||||||||
2nd generation leasing commissions(8) | (10,468) | (4,942) | (8,193) | (6,324) | (8,007) | ||||||||||||||||||||||||
| Adjusted Funds From Operations (AFFO) | $ | 109,000 | $ | 120,503 | $ | 109,108 | $ | 116,127 | $ | 119,499 | |||||||||||||||||||
Third Quarter 2026 Supplemental Financial Reporting Package | Page 13 | | ||||||
Statement of Operations Reconciliations - NOI, Cash NOI, EBITDAre and Adjusted EBITDAre.(1) | ||||||||
| (unaudited and in thousands) | ||||||||
| NOI and Cash NOI | |||||||||||||||||||||||||||||
| Three Months Ended | |||||||||||||||||||||||||||||
| Sep 30, 2026 | Jun 30, 2026 | Mar 31, 2026 | Dec 31, 2025 | Sep 30, 2025 | |||||||||||||||||||||||||
Rental income(2)(3)(4)(5) | $ | 235,837 | $ | 242,996 | $ | 242,141 | $ | 243,230 | $ | 246,757 | |||||||||||||||||||
| Less: Property expenses | 56,996 | 56,214 | 56,763 | 59,287 | 57,879 | ||||||||||||||||||||||||
| Net Operating Income (NOI) | $ | 178,841 | $ | 186,782 | $ | 185,378 | $ | 183,943 | $ | 188,878 | |||||||||||||||||||
Above/(below) market lease revenue adjustments(3) | (3,438) | (3,805) | (4,647) | (4,129) | (5,254) | ||||||||||||||||||||||||
| Straight line rental revenue adjustment | (6,000) | (9,967) | (15,136) | (9,073) | (8,164) | ||||||||||||||||||||||||
| Cash NOI | $ | 169,403 | $ | 173,010 | $ | 165,595 | $ | 170,741 | $ | 175,460 | |||||||||||||||||||
EBITDAre and Adjusted EBITDAre | |||||||||||||||||||||||||||||
| Three Months Ended | |||||||||||||||||||||||||||||
| Sep 30, 2026 | Jun 30, 2026 | Mar 31, 2026 | Dec 31, 2025 | Sep 30, 2025 | |||||||||||||||||||||||||
| Net income (loss) | $ | 18,070 | $ | (523,811) | $ | 94,562 | $ | (67,735) | $ | 93,056 | |||||||||||||||||||
| Interest expense | 24,785 | 28,571 | 26,600 | 25,451 | 25,463 | ||||||||||||||||||||||||
| Depreciation and amortization | 74,440 | 73,479 | 72,933 | 76,819 | 81,172 | ||||||||||||||||||||||||
Impairment of real estate | 71,834 | 624,754 | 6,824 | 89,097 | — | ||||||||||||||||||||||||
| Gains on sale of real estate | (23,208) | (21,893) | (26,281) | (19,931) | (28,583) | ||||||||||||||||||||||||
EBITDAre | $ | 165,921 | $ | 181,100 | $ | 174,638 | $ | 103,701 | $ | 171,108 | |||||||||||||||||||
| Stock-based compensation amortization | 4,106 | 3,666 | 4,063 | 8,537 | 10,485 | ||||||||||||||||||||||||
| Debt extinguishment and modification expenses | 194 | — | — | — | — | ||||||||||||||||||||||||
| Acquisition expenses | — | — | — | 10 | 161 | ||||||||||||||||||||||||
| Non-capitalizable demolition costs | 1,309 | — | — | — | — | ||||||||||||||||||||||||
| Co-CEO transition costs | 528 | (2,330) | — | 60,223 | — | ||||||||||||||||||||||||
Other nonrecurring expenses | — | 45 | 62 | 5,605 | 1,259 | ||||||||||||||||||||||||
| Write-offs of below-market lease intangibles related to unexercised renewal options | — | (497) | — | — | — | ||||||||||||||||||||||||
Pro forma effect of dispositions(6) | (15,234) | 68 | (206) | (268) | (389) | ||||||||||||||||||||||||
Adjusted EBITDAre | $ | 156,824 | $ | 182,052 | $ | 178,557 | $ | 177,808 | $ | 182,624 | |||||||||||||||||||
Third Quarter 2026 Supplemental Financial Reporting Package | Page 14 | | ||||||
Same Property Portfolio Performance.(1) | ||||||||
| (unaudited and dollars in thousands) | ||||||||
| Same Property Portfolio: | ||||||||||||||||||||||||||||||||||||||||||||||||||
| Number of properties | 316 | |||||||||||||||||||||||||||||||||||||||||||||||||
| Square Feet | 36,809,603 | |||||||||||||||||||||||||||||||||||||||||||||||||
| Same Property Portfolio NOI and Cash NOI: | ||||||||||||||||||||||||||||||||||||||||||||||||||
| Three Months Ended September 30, | Nine Months Ended September 30, | |||||||||||||||||||||||||||||||||||||||||||||||||
| 2026 | 2025 | $ Change | % Change | 2026 | 2025 | $ Change | % Change | |||||||||||||||||||||||||||||||||||||||||||
Rental income(2)(3)(4)(5) | $ | 186,367 | $ | 189,391 | $ | (3,024) | (1.6)% | $ | 559,076 | $ | 556,112 | $ | 2,964 | 0.5% | ||||||||||||||||||||||||||||||||||||
| Property expenses | 42,189 | 41,348 | 841 | 2.0% | 122,823 | 119,594 | 3,229 | 2.7% | ||||||||||||||||||||||||||||||||||||||||||
| Same Property Portfolio NOI | $ | 144,178 | $ | 148,043 | $ | (3,865) | (2.6)% | (4) | $ | 436,253 | $ | 436,518 | $ | (265) | (0.1)% | (4) | ||||||||||||||||||||||||||||||||||
Straight-line rental revenue adjustment | (3,976) | (5,462) | 1,486 | (27.2)% | (17,476) | (18,834) | 1,358 | (7.2)% | ||||||||||||||||||||||||||||||||||||||||||
Above/(below) market lease revenue adjustments(5) | (3,607) | (4,440) | 833 | (18.8)% | (11,586) | (14,266) | 2,680 | (18.8)% | ||||||||||||||||||||||||||||||||||||||||||
| Same Property Portfolio Cash NOI | $ | 136,595 | $ | 138,141 | $ | (1,546) | (1.1)% | (4) | $ | 407,191 | $ | 403,418 | $ | 3,773 | 0.9% | (4) | ||||||||||||||||||||||||||||||||||
| Same Property Portfolio Occupancy: | |||||||||||||||||||||||||||||
| Three Months Ended September 30, | Year-over-Year Change (basis points) | Three Months Ended June 30, 2026 | Sequential Change (basis points) | ||||||||||||||||||||||||||
| 2026 | 2025 | ||||||||||||||||||||||||||||
Quarterly Weighted Average Occupancy:(6) | |||||||||||||||||||||||||||||
| Los Angeles County | 96.4% | 95.4% | 100 bps | 96.6% | (20) bps | ||||||||||||||||||||||||
| Orange County | 96.3% | 97.5% | (120) bps | 95.8% | 50 bps | ||||||||||||||||||||||||
| Riverside / San Bernardino County | 92.3% | 96.7% | (440) bps | 90.7% | 160 bps | ||||||||||||||||||||||||
| San Diego County | 97.9% | 98.3% | (40) bps | 97.5% | 40 bps | ||||||||||||||||||||||||
| Ventura County | 94.6% | 94.2% | 40 bps | 94.9% | (30) bps | ||||||||||||||||||||||||
| Quarterly Weighted Average Occupancy | 95.6% | 96.0% | (40) bps | 95.5% | 10 bps | ||||||||||||||||||||||||
| Ending Occupancy: | 96.9% | 97.1% | (20) bps | 94.9% | 200 bps | ||||||||||||||||||||||||
Third Quarter 2026 Supplemental Financial Reporting Package | Page 15 | | ||||||
Capitalization Summary. | ||||||||
| (unaudited and in thousands, except share and per share data) | ||||||||
| Capitalization as of September 30, 2026 | ||||||||

| Description | September 30, 2026 | June 30, 2026 | March 31, 2026 | December 31, 2025 | September 30, 2025 | ||||||||||||||||||||||||
Common shares outstanding(1) | 214,260,837 | 222,360,849 | 224,521,552 | 229,957,058 | 232,297,172 | ||||||||||||||||||||||||
Operating partnership units outstanding(2) | 8,674,743 | 8,716,332 | 8,605,741 | 8,288,228 | 8,155,706 | ||||||||||||||||||||||||
| Total shares and units outstanding at period end | 222,935,580 | 231,077,181 | 233,127,293 | 238,245,286 | 240,452,878 | ||||||||||||||||||||||||
| Share price at end of quarter | $ | 36.27 | $ | 33.50 | $ | 32.73 | $ | 38.72 | $ | 41.11 | |||||||||||||||||||
| Common Stock and Operating Partnership Units - Capitalization | $ | 8,085,873 | $ | 7,741,086 | $ | 7,630,256 | $ | 9,224,857 | $ | 9,885,018 | |||||||||||||||||||
Series B and C Cumulative Redeemable Preferred Stock(3) | $ | 161,250 | $ | 161,250 | $ | 161,250 | $ | 161,250 | $ | 161,250 | |||||||||||||||||||
3.00% Series 3 Cumulative Redeemable Convertible Preferred Units(4) | 12,000 | 12,000 | 12,000 | 12,000 | 12,000 | ||||||||||||||||||||||||
| Preferred Equity | $ | 173,250 | $ | 173,250 | $ | 173,250 | $ | 173,250 | $ | 173,250 | |||||||||||||||||||
| Total Equity Market Capitalization | $ | 8,259,123 | $ | 7,914,336 | $ | 7,803,506 | $ | 9,398,107 | $ | 10,058,268 | |||||||||||||||||||
| Total Debt | $ | 2,786,284 | $ | 3,285,503 | $ | 3,271,720 | $ | 3,278,649 | $ | 3,278,896 | |||||||||||||||||||
| Less: Cash and cash equivalents | (423,590) | (32,226) | (51,714) | (165,778) | (248,956) | ||||||||||||||||||||||||
| Net Debt | $ | 2,362,694 | $ | 3,253,277 | $ | 3,220,006 | $ | 3,112,871 | $ | 3,029,940 | |||||||||||||||||||
| Total Combined Market Capitalization (Net Debt plus Equity) | $ | 10,621,817 | $ | 11,167,613 | $ | 11,023,512 | $ | 12,510,978 | $ | 13,088,208 | |||||||||||||||||||
Net debt to Adjusted EBITDAre (quarterly results annualized)(5) | 3.8x | 4.5x | 4.5x | 4.4x | 4.1x | ||||||||||||||||||||||||
Net debt & preferred equity to Adjusted EBITDAre (quarterly results annualized)(5) | 4.0x | 4.7x | 4.8x | 4.6x | 4.4x | ||||||||||||||||||||||||
Third Quarter 2026 Supplemental Financial Reporting Package | Page 16 | | ||||||
Debt Summary. | ||||||||
| (unaudited and dollars in thousands) | ||||||||
| Debt Detail: | ||||||||||||||||||||||||||
| As of September 30, 2026 | ||||||||||||||||||||||||||
| Debt Description | Maturity Date | Stated Interest Rate | Effective Interest Rate(1) | Principal Balance(2) | ||||||||||||||||||||||
| Unsecured Debt: | ||||||||||||||||||||||||||
$1.25 Billion Revolving Credit Facility(3) | 5/30/2029(4) | SOFR+0.685%(5) | 4.585% | $ | — | |||||||||||||||||||||
$575M Exchangeable 2027 Senior Notes(6) | 3/15/2027 | 4.375% | 4.375% | 575,000 | ||||||||||||||||||||||
| $300M Senior Notes | 6/15/2028 | 5.000% | 5.000% | 300,000 | ||||||||||||||||||||||
$575M Exchangeable 2029 Senior Notes(6) | 3/15/2029 | 4.125% | 4.125% | 575,000 | ||||||||||||||||||||||
| $25M Series 2019A Senior Notes | 7/16/2029 | 3.880% | 3.880% | 25,000 | ||||||||||||||||||||||
| $400M Term Loan Facility | 5/30/2030 | SOFR+0.76%(5) | 4.174%(7) | 400,000 | ||||||||||||||||||||||
| $400M Senior Notes | 12/1/2030 | 2.125% | 2.125% | 400,000 | ||||||||||||||||||||||
| $400M Senior Notes - Green Bond | 9/1/2031 | 2.150% | 2.150% | 400,000 | ||||||||||||||||||||||
| $75M Series 2019B Senior Notes | 7/16/2034 | 4.030% | 4.030% | 75,000 | ||||||||||||||||||||||
| Secured Debt: | ||||||||||||||||||||||||||
| 13943-13955 Balboa Boulevard | 7/1/2027 | 3.930% | 3.930% | 13,504 | ||||||||||||||||||||||
| 2205 126th Street | 12/1/2027 | 3.910% | 3.910% | 5,200 | ||||||||||||||||||||||
| 2410-2420 Santa Fe Avenue | 1/1/2028 | 3.700% | 3.700% | 10,300 | ||||||||||||||||||||||
| 11832-11954 La Cienega Boulevard | 7/1/2028 | 4.260% | 4.260% | 3,624 | ||||||||||||||||||||||
| 1100-1170 Gilbert Street (Gilbert/La Palma) | 3/1/2031 | 5.125% | 5.125% | 1,156 | ||||||||||||||||||||||
| 7817 Woodley Avenue | 8/1/2039 | 4.140% | 4.140% | 2,500 | ||||||||||||||||||||||
| Total Debt | 3.700% | $ | 2,786,284 | |||||||||||||||||||||||
Debt Composition: | ||||||||||||||||||||||||||||||||
| Category | Weighted Average Term Remaining (yrs) | Stated Interest Rate | Effective Interest Rate | Balance | % of Total | |||||||||||||||||||||||||||
| Fixed | 2.9 | 3.700% (See Table Above) | 3.700% | $ | 2,786,284 | 100.0% | ||||||||||||||||||||||||||
| Variable | — | — | —% | $ | — | 0.0% | ||||||||||||||||||||||||||
| Secured | 2.0 | 3.947% | $ | 36,284 | 1.0% | |||||||||||||||||||||||||||
| Unsecured | 2.9 | 3.697% | $ | 2,750,000 | 99.0% | |||||||||||||||||||||||||||
Third Quarter 2026 Supplemental Financial Reporting Package | Page 17 | | ||||||
Debt Summary (Continued). | ||||||||
| (unaudited and dollars in thousands) | ||||||||
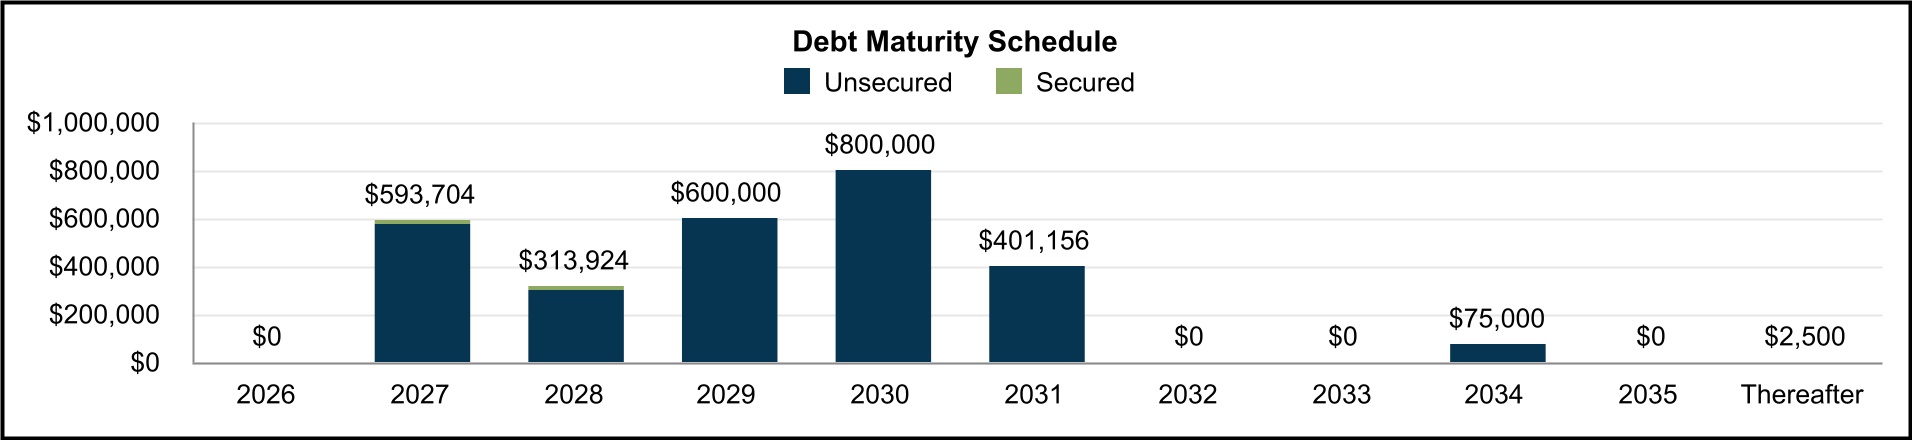
Debt Maturity Schedule(8): | ||||||||||||||||||||||||||||||||
| Year | Secured | Unsecured | Total | % Total | Effective Interest Rate(1) | |||||||||||||||||||||||||||
| 2026 | $ | — | $ | — | $ | — | — | % | — | % | ||||||||||||||||||||||
| 2027 | 18,704 | 575,000 | 593,704 | 21 | % | 4.361 | % | |||||||||||||||||||||||||
| 2028 | 13,924 | 300,000 | 313,924 | 11 | % | 4.949 | % | |||||||||||||||||||||||||
| 2029 | — | 600,000 | 600,000 | 22 | % | 4.115 | % | |||||||||||||||||||||||||
| 2030 | — | 800,000 | 800,000 | 29 | % | 3.149 | % | |||||||||||||||||||||||||
| 2031 | 1,156 | 400,000 | 401,156 | 14 | % | 2.159 | % | |||||||||||||||||||||||||
| 2032 | — | — | — | — | % | — | % | |||||||||||||||||||||||||
| 2033 | — | — | — | — | % | — | % | |||||||||||||||||||||||||
| 2034 | — | 75,000 | 75,000 | 3 | % | 4.030 | % | |||||||||||||||||||||||||
| 2035 | — | — | — | — | % | — | % | |||||||||||||||||||||||||
| Thereafter | 2,500 | — | 2,500 | — | % | 4.140 | % | |||||||||||||||||||||||||
| Total | $ | 36,284 | $ | 2,750,000 | $ | 2,786,284 | 100 | % | 3.700 | % | ||||||||||||||||||||||
Third Quarter 2026 Supplemental Financial Reporting Package | Page 18 | | ||||||
Operations. | ||||||||
| Quarterly Results | ||||||||
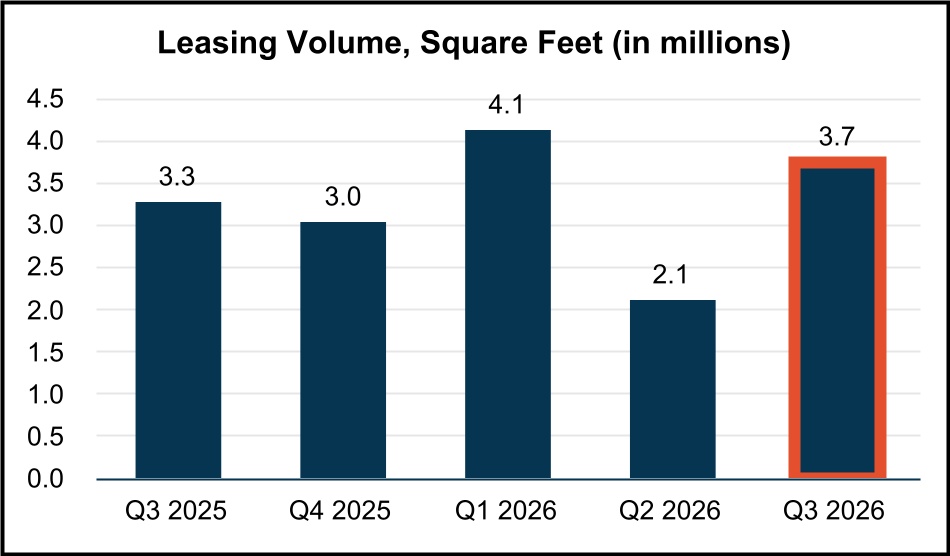
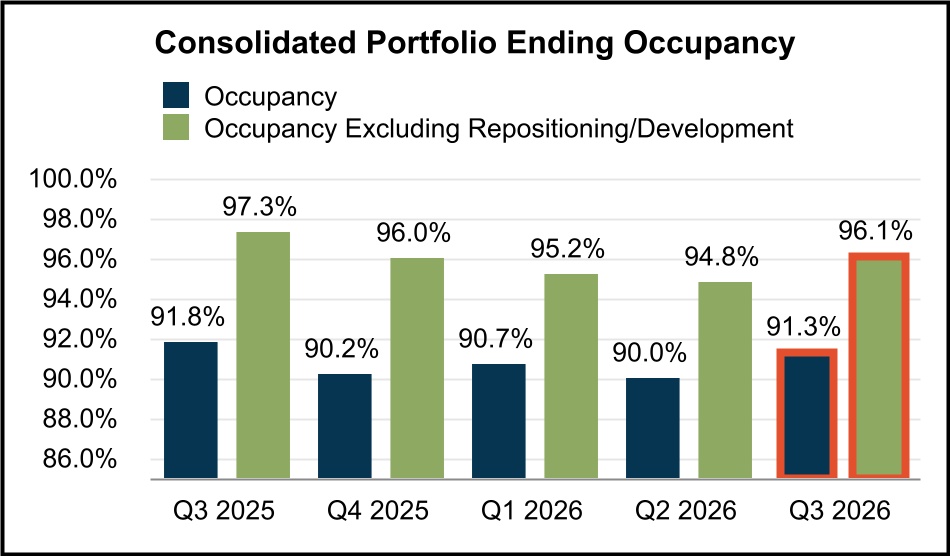
Third Quarter 2026 Supplemental Financial Reporting Package | Page 19 | | ||||||
Portfolio Overview. | ||||||||
| At September 30, 2026 | (unaudited results) | |||||||
| Consolidated Portfolio: | ||||||||
| Rentable Square Feet | Ending Occupancy % | In-Place ABR(3) | |||||||||||||||||||||||||||||||||||||||||||||||||||||||||||||||
| Market | # of Properties | Same Property Portfolio | Non-Same Property Portfolio | Total Portfolio | Same Property Portfolio | Non-Same Property Portfolio | Total Portfolio(1) | Total Portfolio Excluding Repo/Redev(2) | Total (in 000’s) | Per Square Foot | |||||||||||||||||||||||||||||||||||||||||||||||||||||||
| Central LA | 20 | 2,834,219 | 384,764 | 3,218,983 | 100.0 | % | 93.5 | % | 99.2 | % | 100.0 | % | $ | 44,715 | $14.00 | ||||||||||||||||||||||||||||||||||||||||||||||||||
| Greater San Fernando Valley | 73 | 5,486,406 | 1,541,810 | 7,028,216 | 96.8 | % | 54.7 | % | 87.6 | % | 91.5 | % | 112,815 | $18.33 | |||||||||||||||||||||||||||||||||||||||||||||||||||
| Mid-Counties | 28 | 1,848,173 | 525,807 | 2,373,980 | 99.3 | % | 61.7 | % | 91.0 | % | 99.4 | % | 42,692 | $19.76 | |||||||||||||||||||||||||||||||||||||||||||||||||||
| San Gabriel Valley | 39 | 4,608,828 | 1,225,634 | 5,834,462 | 94.5 | % | 50.1 | % | 85.2 | % | 95.1 | % | 66,233 | $13.33 | |||||||||||||||||||||||||||||||||||||||||||||||||||
| South Bay | 76 | 6,210,502 | 1,167,574 | 7,378,076 | 96.3 | % | 61.8 | % | 90.8 | % | 96.3 | % | 155,224 | $23.17 | |||||||||||||||||||||||||||||||||||||||||||||||||||
| Los Angeles County | 236 | 20,988,128 | 4,845,589 | 25,833,717 | 96.8 | % | 59.1 | % | 89.7 | % | 95.5 | % | 421,679 | $18.19 | |||||||||||||||||||||||||||||||||||||||||||||||||||
| North Orange County | 21 | 1,812,309 | 505,751 | 2,318,060 | 97.5 | % | 76.0 | % | 92.8 | % | 98.0 | % | 40,876 | $18.99 | |||||||||||||||||||||||||||||||||||||||||||||||||||
| OC Airport | 8 | 958,510 | — | 958,510 | 100.0 | % | — | % | 100.0 | % | 100.0 | % | 20,429 | $21.31 | |||||||||||||||||||||||||||||||||||||||||||||||||||
| South Orange County | 9 | 482,919 | 46,642 | 529,561 | 99.0 | % | 100.0 | % | 99.1 | % | 99.1 | % | 9,355 | $17.83 | |||||||||||||||||||||||||||||||||||||||||||||||||||
| West Orange County | 10 | 1,288,838 | — | 1,288,838 | 93.9 | % | — | % | 93.9 | % | 93.9 | % | 21,607 | $17.85 | |||||||||||||||||||||||||||||||||||||||||||||||||||
| Orange County | 48 | 4,542,576 | 552,393 | 5,094,969 | 97.2 | % | 78.0 | % | 95.1 | % | 97.4 | % | 92,267 | $19.04 | |||||||||||||||||||||||||||||||||||||||||||||||||||
| Inland Empire West | 49 | 6,360,169 | 726,308 | 7,086,477 | 97.4 | % | 42.0 | % | 91.7 | % | 96.8 | % | 98,702 | $15.18 | |||||||||||||||||||||||||||||||||||||||||||||||||||
| Riverside / San Bernardino County | 49 | 6,360,169 | 726,308 | 7,086,477 | 97.4 | % | 42.0 | % | 91.7 | % | 96.8 | % | 98,702 | $15.18 | |||||||||||||||||||||||||||||||||||||||||||||||||||
| Central San Diego | 21 | 1,417,150 | 511,105 | 1,928,255 | 97.6 | % | 65.4 | % | 89.1 | % | 98.1 | % | 42,525 | $24.76 | |||||||||||||||||||||||||||||||||||||||||||||||||||
| North County San Diego | 12 | 1,019,475 | 282,231 | 1,301,706 | 97.7 | % | 92.4 | % | 96.6 | % | 98.2 | % | 19,479 | $15.50 | |||||||||||||||||||||||||||||||||||||||||||||||||||
| San Diego County | 33 | 2,436,625 | 793,336 | 3,229,961 | 97.7 | % | 75.0 | % | 92.1 | % | 98.1 | % | 62,004 | $20.84 | |||||||||||||||||||||||||||||||||||||||||||||||||||
| Ventura | 18 | 2,482,105 | 741,814 | 3,223,919 | 94.8 | % | 98.6 | % | 95.7 | % | 95.9 | % | 44,692 | $14.48 | |||||||||||||||||||||||||||||||||||||||||||||||||||
| Ventura County | 18 | 2,482,105 | 741,814 | 3,223,919 | 94.8 | % | 98.6 | % | 95.7 | % | 95.9 | % | 44,692 | $14.48 | |||||||||||||||||||||||||||||||||||||||||||||||||||
| CONSOLIDATED TOTAL / WTD AVG | 384 | 36,809,603 | 7,659,440 | 44,469,043 | 96.9 | % | 64.3 | % | 91.3 | % | 96.1 | % | $ | 719,344 | $17.72 | (4) | |||||||||||||||||||||||||||||||||||||||||||||||||
Third Quarter 2026 Supplemental Financial Reporting Package | Page 20 | | ||||||
Executed Leasing Statistics and Trends. | ||||||||
| (unaudited results) | ||||||||
| Executed Leasing Activity and Weighted Average New / Renewal Leasing Spreads: | ||||||||
| Three Months Ended | ||||||||||||||||||||||||||||||||
| Sep 30, 2026 | Jun 30, 2026 | Mar 31, 2026 | Dec 31, 2025 | Sep 30, 2025 | ||||||||||||||||||||||||||||
| Leasing Spreads: | ||||||||||||||||||||||||||||||||
| Net Effective Rent Change | 7.1 | % | (2.8) | % | (10.0) | % | 22.0 | % | 26.1 | % | ||||||||||||||||||||||
| Cash Rent Change | (3.0) | % | (11.3) | % | (15.4) | % | 9.0 | % | 10.3 | % | ||||||||||||||||||||||
Leasing Activity (Building SF):(1) | ||||||||||||||||||||||||||||||||
| New leases | 2,157,994 | 840,344 | 1,296,230 | 1,574,816 | 2,361,131 | |||||||||||||||||||||||||||
| Renewal leases | 1,580,384 | 1,261,446 | 2,829,822 | 1,464,751 | 904,014 | |||||||||||||||||||||||||||
| Total leasing activity | 3,738,378 | 2,101,790 | 4,126,052 | 3,039,567 | 3,265,145 | |||||||||||||||||||||||||||
| Total expiring leases | (2,456,080) | (2,788,275) | (4,638,894) | (3,551,170) | (1,734,790) | |||||||||||||||||||||||||||
Expiring leases - placed into repositioning/development | 85,000 | 599,680 | 152,417 | 957,493 | 418,878 | |||||||||||||||||||||||||||
Net absorption(2) | 1,367,298 | (86,805) | (360,425) | 445,890 | 1,949,233 | |||||||||||||||||||||||||||
Retention rate(3) | 75 | % | 60 | % | 64 | % | 61 | % | 72 | % | ||||||||||||||||||||||
Retention + Backfill rate(4) | 87 | % | 69 | % | 79 | % | 70 | % | 77 | % | ||||||||||||||||||||||
Executed Leasing Activity and Change in Annual Rental Rates and Turnover Costs for Current Quarter Leases:(5) | ||||||||||||||||||||||||||||||||||||||||||||||||||||||||||||||||||||||||||
| Net Effective Rent | Cash Rent | Turnover Costs(6) | ||||||||||||||||||||||||||||||||||||||||||||||||||||||||||||||||||||||||
| Third Quarter 2026 | # Leases Signed | SF of Leasing | Wtd. Avg. Lease Term (Years) | Current Lease | Prior Lease | Rent Change | Current Lease | Prior Lease | Rent Change | Wtd. Avg. Abatement (Months) | Tenant Improvements per SF | Leasing Commissions per SF | ||||||||||||||||||||||||||||||||||||||||||||||||||||||||||||||
| New | 60 | 2,157,994 | 6.5 | $14.40 | $14.07 | 2.3% | $14.31 | $15.39 | (7.0)% | 5.6 | $1.94 | $5.04 | ||||||||||||||||||||||||||||||||||||||||||||||||||||||||||||||
Renewal | 56 | 1,580,384 | 4.6 | $14.80 | $13.35 | 10.8% | $14.49 | $14.47 | 0.1% | 2.7 | $2.92 | $2.07 | ||||||||||||||||||||||||||||||||||||||||||||||||||||||||||||||
Total / Wtd. Average | 116 | 3,738,378 | 5.7 | $14.63 | $13.65 | 7.1% | $14.41 | $14.86 | (3.0)% | 3.9 | $2.51 | $3.32 | ||||||||||||||||||||||||||||||||||||||||||||||||||||||||||||||
Third Quarter 2026 Supplemental Financial Reporting Package | Page 21 | | ||||||
Leasing Statistics (Continued). | ||||||||
| (unaudited results) | ||||||||
| Lease Expiration Schedule as of September 30, 2026: | ||||||||
| Year of Lease Expiration | # of Leases Expiring | Total Rentable Square Feet | In-Place + Uncommenced ABR (in thousands) | In-Place + Uncommenced ABR per SF | ||||||||||||||||||||||
| Available | — | 1,526,893 | $ | — | $— | |||||||||||||||||||||
Repositioning/Development(1) | — | 1,951,698 | — | $— | ||||||||||||||||||||||
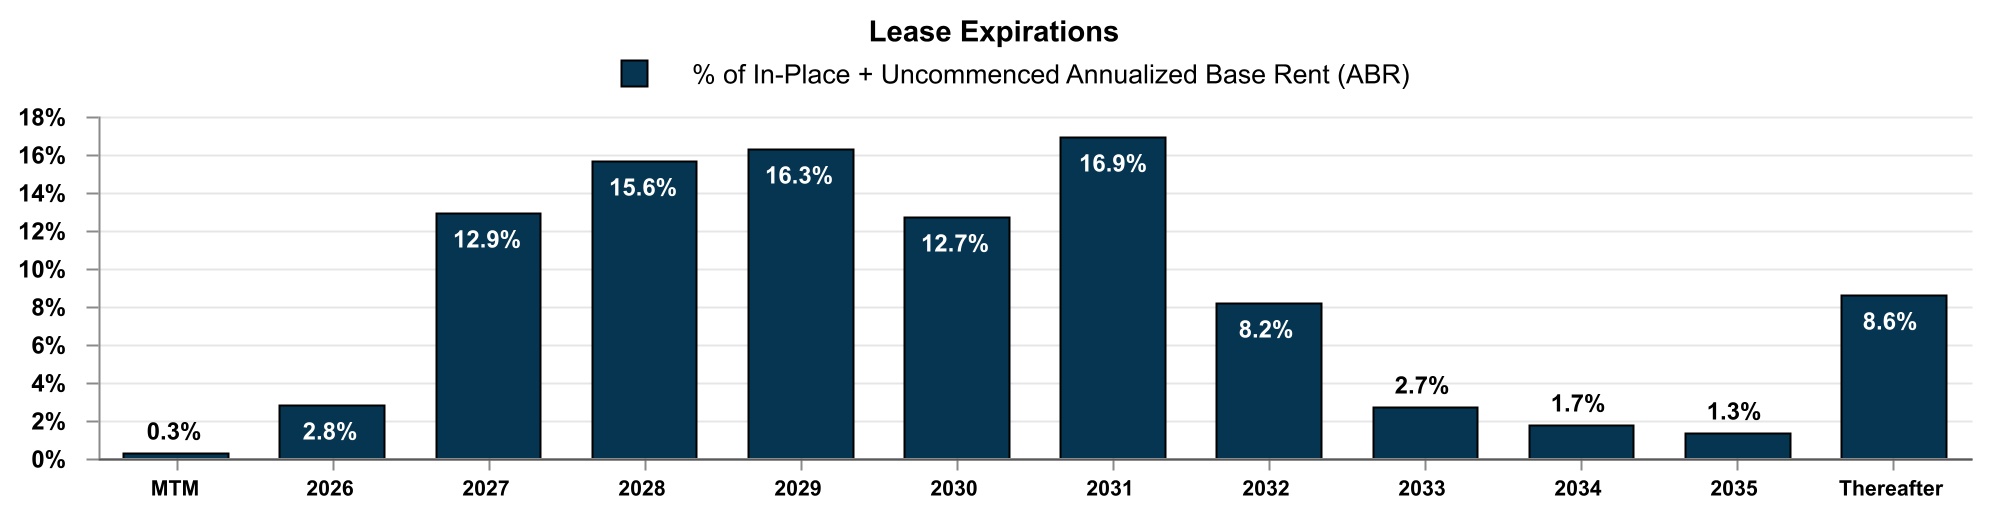
| MTM Tenants | 10 | 95,555 | 2,033 | $21.28 | ||||||||||||||||||||||
| 2026 | 73 | 729,865 | 20,681 | $28.33(2) | ||||||||||||||||||||||
| 2027 | 361 | 5,609,890 | 94,577 | $16.86 | ||||||||||||||||||||||
| 2028 | 308 | 6,011,385 | 114,330 | $19.02 | ||||||||||||||||||||||
| 2029 | 321 | 6,320,388 | 119,431 | $18.90 | ||||||||||||||||||||||
| 2030 | 144 | 5,399,947 | 93,154 | $17.25 | ||||||||||||||||||||||
| 2031 | 141 | 8,054,463 | 124,329 | $15.44 | ||||||||||||||||||||||
| 2032 | 63 | 3,675,501 | 60,245 | $16.39 | ||||||||||||||||||||||
| 2033 | 19 | 1,175,905 | 19,780 | $16.82 | ||||||||||||||||||||||
| 2034 | 11 | 812,845 | 12,151 | $14.95 | ||||||||||||||||||||||
| 2035 | 8 | 462,072 | 9,666 | $20.92 | ||||||||||||||||||||||
| Thereafter | 39 | 2,642,636 | 63,145 | $23.89 | ||||||||||||||||||||||
| Total Portfolio | 1,498 | 44,469,043 | $ | 733,522 | $17.89(3) | |||||||||||||||||||||
Third Quarter 2026 Supplemental Financial Reporting Package | Page 22 | | ||||||
Top Tenants and Lease Segmentation. | ||||||||
| (unaudited results) | ||||||||
Top 20 Tenants as of September 30, 2026 | ||||||||
| Tenant | Submarket | Leased Rentable SF | In-Place + Uncommenced ABR (in 000’s)(1) | % of In-Place + Uncommenced ABR(1) | In-Place + Uncommenced ABR per SF(1) | Lease Expiration | ||||||||||||||||||||||||||||||||
| Zenith Energy West Coast Terminals LLC | South Bay | —(2) | $12,147 | 1.7% | $3.48(2) | 9/29/2041 | ||||||||||||||||||||||||||||||||
| Cubic Corporation | Central San Diego | 315,227 | $11,786 | 1.6% | $37.39 | 3/31/2038 | ||||||||||||||||||||||||||||||||
| IBY, LLC | San Gabriel Valley | 1,178,021 | $11,694 | 1.6% | $9.93 | 4/5/2031(3) | ||||||||||||||||||||||||||||||||
| Federal Express Corporation | Multiple Submarkets(4) | 527,861 | $11,038 | 1.5% | $20.91 | 11/30/2032(4) | ||||||||||||||||||||||||||||||||
| L3 Technologies, Inc. | South Bay | 461,431 | $9,537 | 1.3% | $20.67 | 9/30/2031 | ||||||||||||||||||||||||||||||||
| The Hertz Corporation | South Bay | 38,680(5) | $8,922 | 1.2% | $11.14(5) | 10/31/2026 | ||||||||||||||||||||||||||||||||
| Orora Packaging Solutions | Multiple Submarkets(6) | 476,065 | $8,175 | 1.1% | $17.17 | 9/30/2028(6) | ||||||||||||||||||||||||||||||||
| Forward Air, LLC | South Bay | 300,217 | $7,209 | 1.0% | $24.01 | 8/31/2031 | ||||||||||||||||||||||||||||||||
| Vie Logistics, Incorporated | South Bay | 696,584 | $6,645 | 0.9% | $9.54 | 5/31/2031 | ||||||||||||||||||||||||||||||||
| Unified Grocers, Inc. | Central Los Angeles | 695,120 | $5,686 | 0.8% | $8.18 | 5/8/2038 | ||||||||||||||||||||||||||||||||
| Top 10 Tenants | 4,689,206 | $92,839 | 12.7% | |||||||||||||||||||||||||||||||||||
| Top 11 - 20 Tenants | 2,003,939 | $41,910 | 5.7% | |||||||||||||||||||||||||||||||||||
| Total Top 20 Tenants | 6,693,145 | $134,749 | 18.4% | |||||||||||||||||||||||||||||||||||
| Lease Segmentation by Size: | |||||||||||||||||||||||||||||||||||||||||||||||||||||
| Square Feet | Number of Leases | Leased Building/Land Rentable SF | Building/Land Rentable SF | Leased % | Leased % Excl. Repo/Redev | In-Place + Uncommenced ABR (in 000’s)(1) | % of In-Place + Uncommenced ABR(1) | In-Place + Uncommenced ABR per SF(1) | |||||||||||||||||||||||||||||||||||||||||||||
| Building: | |||||||||||||||||||||||||||||||||||||||||||||||||||||
| <4,999 | 506 | 1,253,578 | 1,407,386 | 89.1% | 89.1% | $ | 25,433 | 3.5% | $20.29 | ||||||||||||||||||||||||||||||||||||||||||||
| 5,000 - 9,999 | 222 | 1,582,202 | 1,746,113 | 90.6% | 91.3% | 31,046 | 4.2% | $19.62 | |||||||||||||||||||||||||||||||||||||||||||||
| 10,000 - 24,999 | 311 | 5,105,574 | 5,610,724 | 91.0% | 92.4% | 96,979 | 13.2% | $18.99 | |||||||||||||||||||||||||||||||||||||||||||||
| 25,000 - 49,999 | 174 | 6,301,310 | 6,797,508 | 92.7% | 96.2% | 116,009 | 15.8% | $18.41 | |||||||||||||||||||||||||||||||||||||||||||||
| 50,000 - 99,999 | 109 | 7,866,941 | 8,603,406 | 91.4% | 96.2% | 138,471 | 18.9% | $17.60 | |||||||||||||||||||||||||||||||||||||||||||||
| >100,000 | 109 | 18,681,537 | 20,089,853 | 93.0% | 98.7% | 279,347 | 38.1% | $14.95 | |||||||||||||||||||||||||||||||||||||||||||||
| Building Subtotal / Wtd. Avg. | 1,431 | 40,791,142 | (2) | 44,254,990 | (2) | 92.2% | (2) | 96.4% | (2) | $ | 687,285 | 93.7% | $16.85 | ||||||||||||||||||||||||||||||||||||||||
Land/IOS(3) | 23 | 7,812,614 | (4) | 8,263,593 | (4) | 94.5% | (4) | 43,279 | 5.9% | $5.54 | (4) | ||||||||||||||||||||||||||||||||||||||||||
Other(3) | 44 | 2,958 | 0.4% | ||||||||||||||||||||||||||||||||||||||||||||||||||
| Total | 1,498 | $ | 733,522 | 100.0% | |||||||||||||||||||||||||||||||||||||||||||||||||
Third Quarter 2026 Supplemental Financial Reporting Package | Page 23 | | ||||||
Capital Expenditure Summary. | ||||||||
| (unaudited results, in thousands, except square feet and per square foot data) | ||||||||
| Nine months ended September 30, 2026 | ||||||||
| Year to Date | ||||||||||||||||||||||||||||||||||||||
| Q3-2026 | Q2-2026 | Q1-2026 | Total | SF(1) | PSF | |||||||||||||||||||||||||||||||||
| Tenant Improvements: | ||||||||||||||||||||||||||||||||||||||
| New Leases – 1st Generation | $ | 207 | $ | — | $ | 148 | $ | 355 | 108,059 | $ | 3.29 | |||||||||||||||||||||||||||
| New Leases – 2nd Generation | 222 | 127 | 50 | 399 | 396,564 | $ | 1.01 | |||||||||||||||||||||||||||||||
| Renewals | 352 | 115 | 135 | 602 | 712,346 | $ | 0.85 | |||||||||||||||||||||||||||||||
| Total Tenant Improvements | $ | 781 | $ | 242 | $ | 333 | $ | 1,356 | ||||||||||||||||||||||||||||||
| Leasing Commissions & Lease Costs: | ||||||||||||||||||||||||||||||||||||||
| New Leases – 1st Generation | $ | 8,724 | $ | 2,214 | $ | 2,174 | $ | 13,112 | 1,758,035 | $ | 7.46 | |||||||||||||||||||||||||||
| New Leases – 2nd Generation | 7,159 | 1,679 | 3,931 | 12,769 | 2,987,036 | $ | 4.27 | |||||||||||||||||||||||||||||||
| Renewals | 3,309 | 3,263 | 4,262 | 10,834 | 5,582,853 | $ | 1.94 | |||||||||||||||||||||||||||||||
| Total Leasing Commissions & Lease Costs | $ | 19,192 | $ | 7,156 | $ | 10,367 | $ | 36,715 | ||||||||||||||||||||||||||||||
| Total Recurring Capex | $ | 4,685 | $ | 4,750 | $ | 2,314 | $ | 11,749 | 44,722,784 | $ | 0.26 | |||||||||||||||||||||||||||
| Recurring Capex % of NOI | 2.6 | % | 2.5 | % | 1.2 | % | 2.1 | % | ||||||||||||||||||||||||||||||
| Recurring Capex % of Rental Income | 2.0 | % | 2.0 | % | 1.0 | % | 1.6 | % | ||||||||||||||||||||||||||||||
| Nonrecurring Capex: | ||||||||||||||||||||||||||||||||||||||
Repositioning and Development in Process(2) | $ | 23,133 | $ | 19,597 | $ | 29,483 | $ | 72,213 | ||||||||||||||||||||||||||||||
Unit Renovation(3) | 6,389 | 7,914 | 7,933 | 22,236 | ||||||||||||||||||||||||||||||||||
Other(4) | 4,154 | 4,796 | 2,451 | 11,401 | ||||||||||||||||||||||||||||||||||
| Total Nonrecurring Capex | $ | 33,676 | $ | 32,307 | $ | 39,867 | $ | 105,850 | 37,490,941 | $ | 2.82 | |||||||||||||||||||||||||||
Other Capitalized Costs(5) | $ | 11,945 | $ | 11,090 | $ | 13,858 | $ | 36,893 | ||||||||||||||||||||||||||||||
Third Quarter 2026 Supplemental Financial Reporting Package | Page 24 | | ||||||
Properties and Space Under Repositioning/Development.(1) | ||||||||
| As of September 30, 2026 | (unaudited results, $ in millions) | |||||||
3Q 2026 Stabilizations | ||||||||||||||||||||||||||||||||||||||||||||||||||||||||||||||
| Property | Submarket | Repositioning/ Development | RSF(2) | Purch. Price | Est. Project Costs | Est. Total Invest. | Est. Remaining Costs | Construction Period | Property Leased | |||||||||||||||||||||||||||||||||||||||||||||||||||||
| Start | Complete | |||||||||||||||||||||||||||||||||||||||||||||||||||||||||||||
| 14955 Salt Lake Avenue | San Gabriel Valley | Repositioning | 46,653 | $ | 10.9 | $ | 3.6 | $ | 14.5 | $ | 0.1 | 4Q-24 | 3Q-25 | 100% | ||||||||||||||||||||||||||||||||||||||||||||||||
| Total Stabilized | 46,653 | $ | 10.9 | $ | 3.6 | $ | 14.5 | $ | 0.1 | |||||||||||||||||||||||||||||||||||||||||||||||||||||
Stabilized | ||||||||||||||||||||||||||||||||||||||||||||||||||||||||||||||
| Repositioning | Development | Total | ||||||||||||||||||||||||||||||||||||||||||||||||||||||||||||
Actual Cash NOI: 3Q 2026 ($M) | $0.3 | $— | $0.3 | |||||||||||||||||||||||||||||||||||||||||||||||||||||||||||
Annualized Stabilized Cash NOI ($M) | $2.0 | $— | $2.0 | |||||||||||||||||||||||||||||||||||||||||||||||||||||||||||
| Estimated Stabilized Return on Cost | 13.8% | N/A | 13.8% | |||||||||||||||||||||||||||||||||||||||||||||||||||||||||||
Third Quarter 2026 Supplemental Financial Reporting Package | Page 25 | | ||||||
Properties and Space Under Repositioning/Development (Continued).(1) | ||||||||
| As of September 30, 2026 | (unaudited results, $ in millions) | |||||||
| Completed & In Lease-Up | ||||||||||||||||||||||||||||||||||||||||||||||||||||||||||||||
Repositioning/ Development | RSF(2) | Purch. Price | Est. Project Costs | Est. Total Invest. | Est. Remaining Costs | Construction Period | Property Leased | |||||||||||||||||||||||||||||||||||||||||||||||||||||||
Property | Submarket | Start | Complete | |||||||||||||||||||||||||||||||||||||||||||||||||||||||||||
4416 Azusa Canyon Road(3) | San Gabriel Valley | Development | 129,830 | $ | 12.3 | $ | 21.4 | $ | 33.7 | $ | 1.7 | 4Q-22 | 2Q-25 | —% | ||||||||||||||||||||||||||||||||||||||||||||||||
| 15010 Don Julian Road | San Gabriel Valley | Development | 219,690 | 22.9 | 37.6 | 60.5 | 2.5 | 1Q-23 | 4Q-25 | —% | ||||||||||||||||||||||||||||||||||||||||||||||||||||
19301 Santa Fe Avenue(4) | South Bay | Repositioning | LAND | 14.7 | 5.7 | 20.4 | 0.4 | 2Q-24 | 3Q-25 | —% | ||||||||||||||||||||||||||||||||||||||||||||||||||||
8985 Crestmar Point(4) | Central San Diego | Repositioning | 53,395 | 8.1 | 5.7 | 13.8 | 0.5 | 4Q-24 | 3Q-25 | —% | ||||||||||||||||||||||||||||||||||||||||||||||||||||
| 14940 Proctor Road | San Gabriel Valley | Development | 160,094 | 28.8 | 26.5 | 55.3 | 1.7 | 4Q-24 | 2Q-26 | —% | ||||||||||||||||||||||||||||||||||||||||||||||||||||
| 11234 Rush Street | San Gabriel Valley | Development | 101,728 | 12.6 | 21.6 | 34.2 | 0.6 | 4Q-24 | 2Q-26 | —% | ||||||||||||||||||||||||||||||||||||||||||||||||||||
| 5235 Hunter Avenue | North Orange County | Development | 121,364 | 11.4 | 20.0 | 31.4 | 2.1 | 1Q-25 | 2Q-26 | —% | ||||||||||||||||||||||||||||||||||||||||||||||||||||
| 9455 Cabot Drive | Central San Diego | Repositioning | 81,670 | 12.2 | 8.3 | 20.5 | 1.1 | 2Q-25 | 4Q-25 | 60% | ||||||||||||||||||||||||||||||||||||||||||||||||||||
| 1175 Aviation Place | Greater San Fernando Valley | Repositioning | 93,202 | 17.9 | 3.9 | 21.8 | 0.7 | 3Q-25 | 4Q-25 | —% | ||||||||||||||||||||||||||||||||||||||||||||||||||||
| Total Completed & In Lease-Up | 960,973 | $ | 140.9 | $ | 150.7 | $ | 291.6 | $ | 11.3 | |||||||||||||||||||||||||||||||||||||||||||||||||||||
| Leased, Not Yet Stabilized | ||||||||||||||||||||||||||||||||||||||||||||||||||||||||||||||
| Repositioning/ Development | RSF(2) | Purch. Price | Est. Project Costs | Est. Total Invest. | Est. Remaining Costs | Construction Period | Property Leased | |||||||||||||||||||||||||||||||||||||||||||||||||||||||
Property(5) | Submarket | Start | Complete | |||||||||||||||||||||||||||||||||||||||||||||||||||||||||||
| 9615 Norwalk Boulevard | Mid-Counties | Development | 201,571 | $ | 9.6 | $ | 51.5 | $ | 61.1 | $ | 1.0 | 3Q-21 | 4Q-25 | 100% | ||||||||||||||||||||||||||||||||||||||||||||||||
| 3680-3880 Voyager Street | South Bay | Development | 67,734 | 21.1 | 19.0 | 40.1 | 1.1 | 1Q-25 | 3Q-26 | 100% | ||||||||||||||||||||||||||||||||||||||||||||||||||||
| 24935-24955 Avenue Kearny | Greater San Fernando Valley | Repositioning | 66,130 | 5.8 | 4.1 | 9.9 | 0.1 | 4Q-25 | 2Q-26 | 100% | ||||||||||||||||||||||||||||||||||||||||||||||||||||
| Total Leased, Not Yet Stabilized | 335,435 | $ | 36.5 | $ | 74.6 | $ | 111.1 | $ | 2.2 | |||||||||||||||||||||||||||||||||||||||||||||||||||||
Third Quarter 2026 Supplemental Financial Reporting Package | Page 26 | | ||||||
Properties and Space Under Repositioning/Development (Continued).(1) | ||||||||
| As of September 30, 2026 | (unaudited results, $ in millions) | |||||||
Under Construction | ||||||||||||||||||||||||||||||||||||||||||||||||||||||||||||||
Repositioning/Development | RSF(2) | Purch. Price | Est. Project Costs | Est. Total Invest. | Est. Remaining Costs | Construction Period | Property Leased | |||||||||||||||||||||||||||||||||||||||||||||||||||||||
Property | Submarket | Start | Complete | |||||||||||||||||||||||||||||||||||||||||||||||||||||||||||
| 7815 Van Nuys Boulevard | Greater San Fernando Valley | Development | 78,904 | $ | 25.6 | $ | 16.0 | $ | 41.6 | $ | 1.0 | 2Q-25 | 4Q-26 | —% | ||||||||||||||||||||||||||||||||||||||||||||||||
| 14400 Figueroa Street | South Bay | Repositioning | 56,771 | 61.4 | 16.9 | 78.3 | 13.3 | 3Q-25 | 2Q-27 | —% | ||||||||||||||||||||||||||||||||||||||||||||||||||||
950 West 190th Street(6) | South Bay | Development | 214,894 | 41.5 | 43.1 | 84.6 | 32.4 | 4Q-25 | 3Q-27 | 100% | ||||||||||||||||||||||||||||||||||||||||||||||||||||
| 9323 Balboa Avenue | Central San Diego | Development | 177,551 | 27.1 | 26.3 | 53.4 | 13.8 | 4Q-25 | 2Q-27 | —% | ||||||||||||||||||||||||||||||||||||||||||||||||||||
| 16425 Gale Avenue | San Gabriel Valley | Development | 290,830 | 26.3 | 39.9 | 66.2 | 36.5 | 2Q-26 | 4Q-27 | —% | ||||||||||||||||||||||||||||||||||||||||||||||||||||
| Total Under Construction | 818,950 | $ | 181.9 | $ | 142.2 | $ | 324.1 | $ | 97.0 | |||||||||||||||||||||||||||||||||||||||||||||||||||||
| Total Completed & In Lease-Up/Leased, Not Yet Stabilized/Under Construction | 2,115,358 | $ | 359.3 | $ | 367.5 | $ | 726.8 | $ | 110.6 | |||||||||||||||||||||||||||||||||||||||||||||||||||||
| Completed & In Lease-Up/Leased, Not Yet Stabilized/Under Construction | ||||||||||||||||||||||||||||||||||||||||||||||||||||||||||||||
| Repositioning | Development | Total | ||||||||||||||||||||||||||||||||||||||||||||||||||||||||||||
Actual Cash NOI: 3Q 2026 ($M) | $(0.1) | $(0.4) | $(0.5) | |||||||||||||||||||||||||||||||||||||||||||||||||||||||||||
| Annualized Stabilized Cash NOI ($M) | $7 - $8 | $32 - $35 | $39 - $43 | |||||||||||||||||||||||||||||||||||||||||||||||||||||||||||
| Estimated Stabilized Return on Cost | 4.3% - 4.8% | 5.8% - 6.3% | 5.5% - 6.0% | |||||||||||||||||||||||||||||||||||||||||||||||||||||||||||
Third Quarter 2026 Supplemental Financial Reporting Package | Page 27 | | ||||||
Properties and Space Under Repositioning/Development (Continued).(1) | ||||||||
| As of September 30, 2026 | (unaudited results, $ in millions) | |||||||
Near-Term Potential Future Repositioning and Development | |||||||||||||||||||||||
| Property | Submarket | Repositioning/ Development | Projected RSF(2) | Estimated Construction Start | Purchase Price ($M) | Lease Expiration Date | Project Description | ||||||||||||||||
| 3100 Fujita Street | South Bay | Repositioning | 81,832 | 4Q-26 | $14.2 | Vacant | Repositioning of an existing 1970s vintage, functionally-limited industrial building acquired in 2018 through a sale leaseback. | ||||||||||||||||
9000 Airport Boulevard | South Bay | Development | 400,602 | 4Q-26 | $144.3 | 10/31/26 | 18 acres of industrially-zoned land acquired through a sale leaseback for planned development. Following lease expiration, the project will deliver a rare, Class-A industrial campus. | ||||||||||||||||
4181 Ruffin Road | Central San Diego | Development | 220,153 | 1Q-27 | $36.0 | 10/31/26 | Development of a modern Class A industrial building with highly competitive functionality in a premier location. | ||||||||||||||||
| 3550 Tyburn Street | Greater San Fernando Valley | Repositioning | 85,537 | 1Q-27 | $10.5 | 01/31/27 | Repositioning to reduce office space and upgrade warehouse infrastructure to convert from manufacturing to more modern distribution use. | ||||||||||||||||
| Total Future Repositioning/Development | 788,124 | $205.0 | |||||||||||||||||||||
| Repositioning | Development | Total | |||||||||||||||||||||
| Projected RSF | 167,369 | 620,755 | 788,124 | ||||||||||||||||||||
Projected Project Costs ($M) | $15 - $20 | $100 - $110 | $115 - $130 | ||||||||||||||||||||
Actual Cash NOI: 3Q 2026 ($M) | $2.3 | $2.3 | $4.6 | ||||||||||||||||||||
Third Quarter 2026 Supplemental Financial Reporting Package | Page 28 | | ||||||
Properties and Space Under Repositioning/Development (Continued).(1) | |||||||||||
| As of September 30, 2026 | (unaudited results) | ||||||||||
| Current Year Stabilized Repositioning/Development | ||||||||||||||||||||||||||||||||||||||||||||||||||||||||
| Property (Submarket) | RSF(2) | Stabilized Period | Stabilized Return on Cost | |||||||||||||||||||||||||||||||||||||||||||||||||||||
| 12118 Bloomfield Avenue | 107,045 | 1Q-26 | 5.2% | |||||||||||||||||||||||||||||||||||||||||||||||||||||
| 1315 Storm Parkway | 37,844 | 1Q-26 | 5.9% | |||||||||||||||||||||||||||||||||||||||||||||||||||||
3211-3233 Mission Oaks Blvd.(7) | 116,852 | 2Q-26 | 9.6% | |||||||||||||||||||||||||||||||||||||||||||||||||||||
| 19900 Plummer Street | 79,539 | 2Q-26 | 4.4% | |||||||||||||||||||||||||||||||||||||||||||||||||||||
| 14955 Salt Lake Avenue | 46,653 | 3Q-26 | 13.8% | |||||||||||||||||||||||||||||||||||||||||||||||||||||
Third Quarter 2026 Supplemental Financial Reporting Package | Page 29 | | ||||||
Current Year Investments and Dispositions Summary. | ||||||||||||||||||||||||||||||||||||||
| As of September 30, 2026 | (unaudited results) | |||||||||||||||||||||||||||||||||||||
| 2026 Current Period Dispositions | ||||||||||||||||||||||||||||||||||||||
| Disposition Date | Property Address | Submarket | Asset Type | Rentable Square Feet | Gross Proceeds ($M) | Realized NOI Contribution in the Quarter of Sale ($M) | ||||||||||||||||||||||||||||||||
| 2/6/2026 | 14005 Live Oak Avenue | Los Angeles - San Gabriel Valley | Development | — | $ | 14.50 | $ | — | ||||||||||||||||||||||||||||||
| 2/24/2026 | 18250 Euclid Street | Orange County Airport | Operating | 62,838 | $ | 26.71 | $ | 0.1 | ||||||||||||||||||||||||||||||
| 3/17/2026 | 29010 Avenue Paine | Los Angeles - Greater San Fernando Valley | Operating | 100,157 | $ | 31.00 | $ | 0.2 | ||||||||||||||||||||||||||||||
| 3/18/2026 | 13700-13738 Slover Avenue | San Bernardino - Inland Empire West | Operating | 17,862 | $ | 14.48 | $ | (0.1) | ||||||||||||||||||||||||||||||
| 3/25/2026 | 600-708 Vermont Avenue | North Orange County | Development | 133,836 | $ | 40.70 | $ | — | ||||||||||||||||||||||||||||||
| 4/16/2026 | 423-424 Berry Way | North Orange County | Development | 101,380 | $ | 16.51 | $ | — | ||||||||||||||||||||||||||||||
| 5/1/2026 | 18455 Figueroa Street | Los Angeles - South Bay | Development | 146,765 | $ | 34.90 | $ | (0.1) | ||||||||||||||||||||||||||||||
| 5/4/2026 | 17031-17037 Green Drive | Los Angeles - San Gabriel Valley | Operating | 51,000 | $ | 16.65 | $ | — | ||||||||||||||||||||||||||||||
| 5/7/2026 | 19100 Susana Road | Los Angeles - South Bay | Operating | 52,714 | $ | 16.10 | $ | (0.1) | ||||||||||||||||||||||||||||||
| 5/11/2026 | 13711 Freeway Drive | Los Angeles - Mid-Counties | Development | 82,180 | $ | 15.78 | $ | — | ||||||||||||||||||||||||||||||
| 5/11/2026 | 3901 Via Oro Avenue | Los Angeles - South Bay | Development | 53,817 | $ | 10.28 | $ | — | ||||||||||||||||||||||||||||||
| 6/2/2026 | 2610 S. Birch Street | Orange County Airport | Operating | 83,852 | $ | 27.68 | $ | 0.2 | ||||||||||||||||||||||||||||||
| 7/23/2026 | 1340 Rocky Point | San Diego - North County | Operating | 22,667 | $ | 7.61 | $ | — | ||||||||||||||||||||||||||||||
| 9/2/2026 | 6635 Caballero Blvd | Los Angeles - Mid-Counties | Operating | 92,395 | $ | 28.18 | $ | (0.5) | ||||||||||||||||||||||||||||||
| 9/8/2026 | 1500 Raymond Avenue | Orange County - North | Operating | 136,218 | $ | 50.22 | $ | — | ||||||||||||||||||||||||||||||
| 9/16/2026 | Portfolio Transaction(1) | Various | Operating | 5,217,227 | $ | 1,179.15 | $ | 15.7 | ||||||||||||||||||||||||||||||
Total 2026 Dispositions through September 30, 2026 | 6,354,908 | $ | 1,530.45 | |||||||||||||||||||||||||||||||||||
Third Quarter 2026 Supplemental Financial Reporting Package | Page 30 | | ||||||
Net Asset Value Components. | ||||||||
| As of September 30, 2026 | (unaudited and in thousands, except share data) | |||||||
| Net Operating Income | ||||||||
Pro Forma Net Operating Income (NOI)(1) | Three Months Ended Sep 30, 2026 | |||||||
| Total operating rental income | $235,837 | |||||||
| Property operating expenses | (56,996) | |||||||
Pro forma effect of uncommenced leases(2) | 368 | |||||||
Pro forma effect of dispositions(3) | (15,234) | |||||||
Pro forma NOI effect of significant properties classified as current, lease-up, and stabilized repositioning and development(4) | 9,625 | |||||||
| Pro Forma NOI | 173,600 | |||||||
Above/(below) market lease revenue adjustments | (3,438) | |||||||
| Straight line rental revenue adjustment | (6,000) | |||||||
| Pro Forma Cash NOI | $164,162 | |||||||
| Balance Sheet Items | ||||||||
| Other assets and liabilities | September 30, 2026 | |||||||
| Cash and cash equivalents | $423,590 | |||||||
| Loan receivable, net | 124,049 | |||||||
| Rents and other receivables, net | 15,540 | |||||||
| Other assets | 31,841 | |||||||
| Accounts payable, accrued expenses and other liabilities | (137,943) | |||||||
| Dividends payable | (97,407) | |||||||
| Tenant security deposits | (89,204) | |||||||
| Prepaid rents | (78,248) | |||||||
Estimated remaining cost to complete repositioning/development projects(5) | (110,600) | |||||||
| Total other assets and liabilities | $81,618 | |||||||
| Debt and Shares Outstanding | ||||||||
Total consolidated debt(6) | $2,786,284 | |||||||
| Preferred stock/units - liquidation preference | $173,250 | |||||||
Common shares outstanding(7) | 214,260,837 | |||||||
Operating partnership units outstanding(8) | 8,674,743 | |||||||
| Total common shares and operating partnership units outstanding | 222,935,580 | |||||||
Third Quarter 2026 Supplemental Financial Reporting Package | Page 31 | | ||||||
Notes and Definitions. | ||||||||
Third Quarter 2026 Supplemental Financial Reporting Package | Page 32 | | ||||||
Notes and Definitions. | ||||||||
| September 30, 2026 | |||||||||||||||||
| Current Period Covenant | Revolver & $400M Term Loan Facility | Senior Notes ($25M & $75M) | |||||||||||||||
| Maximum Leverage Ratio | less than 60% | 19.3% | 25.4% | ||||||||||||||
| Maximum Secured Leverage Ratio | less than 45% | 0.2% | N/A | ||||||||||||||
| Maximum Secured Leverage Ratio | less than 40% | N/A | 0.3% | ||||||||||||||
| Maximum Secured Recourse Debt | less than 15% | N/A | —% | ||||||||||||||
| Minimum Tangible Net Worth | $7,266,909 | N/A | $8,713,867 | ||||||||||||||
| Minimum Fixed Charge Coverage Ratio | at least 1.50 to 1.00 | 5.40 to 1.00 | 5.34 to 1.00 | ||||||||||||||
| Unencumbered Leverage Ratio | less than 60% | 20.1% | 27.5% | ||||||||||||||
| Unencumbered Interest Coverage Ratio | at least 1.75 to 1.00 | 6.15 to 1.00 | 6.15 to 1.00 | ||||||||||||||
| September 30, 2026 | |||||||||||
| Current Period Covenant | Senior Notes ($400M due 2030 & $400M due 2031) | ||||||||||
| Maximum Debt to Total Asset Ratio | less than 60% | 23.3% | |||||||||
| Maximum Secured Debt to Total Asset Ratio | less than 40% | 0.3% | |||||||||
| Minimum Debt Service Coverage Ratio | at least 1.50 to 1.00 | 5.23 to 1.00 | |||||||||
| Minimum Unencumbered Assets to Unsecured Debt Ratio | at least 1.50 to 1.00 | 4.30 to 1.00 | |||||||||
Three Months Ended | |||||||||||||||||||||||||||||
| Sep 30, 2026 | Jun 30, 2026 | Mar 31, 2026 | Dec 31, 2025 | Sep 30, 2025 | |||||||||||||||||||||||||
EBITDAre | $ | 165,921 | $ | 181,100 | $ | 174,638 | $ | 103,701 | $ | 171,108 | |||||||||||||||||||
Above/(below) market lease revenue adjustments | (3,438) | (3,805) | (4,647) | (4,129) | (5,254) | ||||||||||||||||||||||||
Non-cash stock compensation | 4,106 | 3,666 | 4,063 | 8,537 | 10,485 | ||||||||||||||||||||||||
Co-CEO transition costs | 528 | (2,330) | — | 60,223 | — | ||||||||||||||||||||||||
Debt extinguishment and modification expenses | 194 | — | — | — | — | ||||||||||||||||||||||||
Straight line rental revenue adj. | (6,000) | (9,967) | (15,136) | (9,073) | (8,164) | ||||||||||||||||||||||||
Capitalized payments | (5,279) | (4,586) | (5,851) | (6,013) | (6,516) | ||||||||||||||||||||||||
| Accretion of net loan origination fees | (115) | (115) | (115) | (115) | (115) | ||||||||||||||||||||||||
Recurring capital expenditures | (4,685) | (4,750) | (2,314) | (2,566) | (3,563) | ||||||||||||||||||||||||
| 2nd gen. tenant improvements | (574) | (242) | (185) | (179) | (460) | ||||||||||||||||||||||||
| 2nd gen. leasing commissions | (10,468) | (4,942) | (8,193) | (6,324) | (8,007) | ||||||||||||||||||||||||
| Cash flow for fixed charge coverage calculation | $ | 140,190 | $ | 154,029 | $ | 142,260 | $ | 144,062 | $ | 149,514 | |||||||||||||||||||
| Cash interest expense calculation detail: | |||||||||||||||||||||||||||||
| Interest expense | 24,785 | 28,571 | 26,600 | 25,451 | 25,463 | ||||||||||||||||||||||||
| Capitalized interest | 6,284 | 6,026 | 7,352 | 8,801 | 9,240 | ||||||||||||||||||||||||
| Note payable premium amort. | (1,681) | (1,662) | (1,641) | (1,616) | (1,597) | ||||||||||||||||||||||||
| Amort. of deferred financing costs | (1,319) | (1,333) | (1,334) | (1,333) | (1,340) | ||||||||||||||||||||||||
| Amort. of swap term fees & t-locks | (78) | (77) | (77) | (78) | (78) | ||||||||||||||||||||||||
| Cash interest expense | 27,991 | 31,525 | 30,900 | 31,225 | 31,688 | ||||||||||||||||||||||||
| Scheduled principal payments | 219 | 217 | 215 | 247 | 244 | ||||||||||||||||||||||||
| Preferred stock/unit dividends | 2,404 | 2,405 | 2,404 | 2,405 | 2,404 | ||||||||||||||||||||||||
| Fixed charges | $ | 30,614 | $ | 34,147 | $ | 33,519 | $ | 33,877 | $ | 34,336 | |||||||||||||||||||
| Fixed Charge Coverage Ratio | 4.6 | x | 4.5 | x | 4.2 | x | 4.3 | x | 4.4 | x | |||||||||||||||||||
Third Quarter 2026 Supplemental Financial Reporting Package | Page 33 | | ||||||
Notes and Definitions. | ||||||||
Third Quarter 2026 Supplemental Financial Reporting Package | Page 34 | | ||||||
Notes and Definitions. | ||||||||
| Three Months Ended | |||||||||||||||||||||||||||||
| Sep 30, 2026 | Jun 30, 2026 | Mar 31, 2026 | Dec 31, 2025 | Sep 30, 2025 | |||||||||||||||||||||||||
| Rental revenue (before collectability adjustment) | $ | 194,995 | $ | 200,258 | $ | 202,658 | $ | 201,454 | $ | 203,217 | |||||||||||||||||||
| Tenant reimbursements | 41,107 | 42,856 | 41,728 | 43,793 | 42,612 | ||||||||||||||||||||||||
| Other income | 848 | 1,296 | 486 | 598 | 915 | ||||||||||||||||||||||||
| Increase (reduction) in revenue due to change in collectability assessment | (1,113) | (1,414) | (2,731) | (2,615) | 13 | ||||||||||||||||||||||||
| Rental income | $ | 235,837 | $ | 242,996 | $ | 242,141 | $ | 243,230 | $ | 246,757 | |||||||||||||||||||
| Three Months Ended | |||||||||||||||||||||||||||||
| Sep 30, 2026 | Jun 30, 2026 | Mar 31, 2026 | Dec 31, 2025 | Sep 30, 2025 | |||||||||||||||||||||||||
| # of Properties | 316 | 341 | 342 | 287 | 288 | ||||||||||||||||||||||||
| Square Feet | 36,809,603 | 41,633,904 | 41,727,325 | 37,466,856 | 37,916,326 | ||||||||||||||||||||||||
| Ending Occupancy | 96.9 | % | 95.1 | % | 96.1 | % | 96.5 | % | 96.8 | % | |||||||||||||||||||
| SPP NOI growth | (2.6) | % | (0.5) | % | 0.9 | % | 0.4 | % | 1.9 | % | |||||||||||||||||||
| SPP Cash NOI growth | (1.1) | % | 1.5 | % | (0.4) | % | 2.8 | % | 5.5 | % | |||||||||||||||||||
| Three Months Ended September 30, | Nine Months Ended September 30, | ||||||||||||||||||||||||||||||||||||||||||||||
| 2026 | 2025 | $ Change | % Change | 2026 | 2025 | $ Change | % Change | ||||||||||||||||||||||||||||||||||||||||
| Rental revenue | $ | 155,527 | $ | 158,395 | $ | (2,868) | (1.8)% | $ | 466,378 | $ | 465,758 | $ | 620 | 0.1% | |||||||||||||||||||||||||||||||||
| Tenant reimbursements | 30,168 | 30,614 | (446) | (1.5)% | 90,712 | 88,872 | 1,840 | 2.1% | |||||||||||||||||||||||||||||||||||||||
| Other income | 672 | 382 | 290 | 75.9% | 1,986 | 1,482 | 504 | 34.0% | |||||||||||||||||||||||||||||||||||||||
| Rental income | $ | 186,367 | $ | 189,391 | $ | (3,024) | (1.6)% | $ | 559,076 | $ | 556,112 | $ | 2,964 | 0.5% | |||||||||||||||||||||||||||||||||
| Three Months Ended | |||||||||||||||||||||||||||||
| Sep 30, 2026 | Jun 30, 2026 | Mar 31, 2026 | Dec 31, 2025 | Sep 30, 2025 | |||||||||||||||||||||||||
| Net Income (Loss) | $ | 18,070 | $ | (523,811) | $ | 94,562 | $ | (67,735) | $ | 93,056 | |||||||||||||||||||
| General and administrative | 13,431 | 13,693 | 14,925 | 19,199 | 20,037 | ||||||||||||||||||||||||
| Depreciation & amortization | 74,440 | 73,479 | 72,933 | 76,819 | 81,172 | ||||||||||||||||||||||||
| Other expenses, net | 2,561 | (2,001) | 102 | 65,910 | 4,218 | ||||||||||||||||||||||||
| Interest expense | 24,785 | 28,571 | 26,600 | 25,451 | 25,463 | ||||||||||||||||||||||||
Debt extinguishment and modification expenses | 194 | — | — | — | — | ||||||||||||||||||||||||
| Management & leasing services | — | — | — | (197) | (118) | ||||||||||||||||||||||||
| Other income | — | (3,500) | (1,350) | — | — | ||||||||||||||||||||||||
| Interest income | (3,266) | (2,510) | (2,937) | (4,670) | (6,367) | ||||||||||||||||||||||||
Impairment of real estate | 71,834 | 624,754 | 6,824 | 89,097 | — | ||||||||||||||||||||||||
| Gains on sale of real estate | (23,208) | (21,893) | (26,281) | (19,931) | (28,583) | ||||||||||||||||||||||||
| NOI | $ | 178,841 | $ | 186,782 | $ | 185,378 | $ | 183,943 | $ | 188,878 | |||||||||||||||||||
| S/L rental revenue adj. | (6,000) | (9,967) | (15,136) | (9,073) | (8,164) | ||||||||||||||||||||||||
Above/(below) market lease revenue adjustments | (3,438) | (3,805) | (4,647) | (4,129) | (5,254) | ||||||||||||||||||||||||
| Cash NOI | $ | 169,403 | $ | 173,010 | $ | 165,595 | $ | 170,741 | $ | 175,460 | |||||||||||||||||||
Third Quarter 2026 Supplemental Financial Reporting Package | Page 35 | | ||||||
Notes and Definitions. | ||||||||
| Three Months Ended September 30, | Nine Months Ended September 30, | ||||||||||||||||||||||
| 2026 | 2025 | 2026 | 2025 | ||||||||||||||||||||
| Net income (loss) | $ | 18,070 | $ | 93,056 | $ | (411,179) | $ | 287,498 | |||||||||||||||
| General and administrative | 13,431 | 20,037 | 42,049 | 59,657 | |||||||||||||||||||
| Depreciation and amortization | 74,440 | 81,172 | 220,852 | 239,100 | |||||||||||||||||||
| Other expenses, net | 2,561 | 4,218 | 662 | 6,701 | |||||||||||||||||||
| Interest expense | 24,785 | 25,463 | 79,956 | 79,452 | |||||||||||||||||||
Debt extinguishment and modification expenses | 194 | — | 194 | 291 | |||||||||||||||||||
| Management and leasing services | — | (118) | — | (392) | |||||||||||||||||||
| Other income | — | — | (4,850) | — | |||||||||||||||||||
| Interest income | (3,266) | (6,367) | (8,713) | (17,498) | |||||||||||||||||||
Impairment of real estate | 71,834 | — | 703,412 | — | |||||||||||||||||||
| Gains on sale of real estate | (23,208) | (28,583) | (71,382) | (86,101) | |||||||||||||||||||
| NOI | $ | 178,841 | $ | 188,878 | $ | 551,001 | $ | 568,708 | |||||||||||||||
| Non-Same Property Portfolio rental income | (49,470) | (57,366) | (161,898) | (181,034) | |||||||||||||||||||
| Non-Same Property Portfolio property exp. | 14,807 | 16,531 | 47,150 | 48,844 | |||||||||||||||||||
| Same Property Portfolio NOI | $ | 144,178 | $ | 148,043 | $ | 436,253 | $ | 436,518 | |||||||||||||||
| Straight line rental revenue adjustment | (3,976) | (5,462) | (17,476) | (18,834) | |||||||||||||||||||
Above/(below) market lease revenue adjustments | (3,607) | (4,440) | (11,586) | (14,266) | |||||||||||||||||||
| Same Property Portfolio Cash NOI | $ | 136,595 | $ | 138,141 | $ | 407,191 | $ | 403,418 | |||||||||||||||
2026 Estimate | |||||||||||
| Low | High | ||||||||||
| Net loss attributable to common stockholders | $ | (1.55) | $ | (1.52) | |||||||
| Company share of depreciation and amortization | 1.24 | 1.24 | |||||||||
Company share of impairment of real estate | 3.04 | 3.04 | |||||||||
Company share of gains on sale of real estate(1) | (0.31) | (0.31) | |||||||||
| Company share of FFO | $ | 2.42 | $ | 2.45 | |||||||
Core FFO adjustments(2) | (0.01) | (0.01) | |||||||||
| Company share of Core FFO | $ | 2.41 | $ | 2.44 | |||||||
| Sep 30, 2026 | Jun 30, 2026 | Mar 31, 2026 | Dec 31, 2025 | Sep 30, 2025 | ||||||||||||||||||||||||||||
| Ending Occupancy: | ||||||||||||||||||||||||||||||||
| Los Angeles County | 89.7% | 90.1% | 89.8% | 88.3% | 90.9% | |||||||||||||||||||||||||||
| Orange County | 95.1% | 91.8% | 92.2% | 93.6% | 93.7% | |||||||||||||||||||||||||||
| Riverside / San Bernardino County | 91.7% | 86.9% | 91.2% | 95.3% | 94.4% | |||||||||||||||||||||||||||
| San Diego County | 92.1% | 90.4% | 90.7% | 85.9% | 91.3% | |||||||||||||||||||||||||||
| Ventura County | 95.7% | 95.3% | 94.5% | 91.8% | 89.8% | |||||||||||||||||||||||||||
| Total/Weighted Average | 91.3% | 90.0% | 90.7% | 90.2% | 91.8% | |||||||||||||||||||||||||||
| Total Portfolio RSF | 44,469,043 | 49,934,203 | 50,445,312 | 51,161,188 | 50,850,824 | |||||||||||||||||||||||||||
| Total/Weighted Average | ||||||||
| Occupied SF | 40,584,026 | |||||||
Uncommenced Renewal Leases - Leased SF(1) | 624,502 | |||||||
Uncommenced New Leases - Leased SF(1) | 406,427 | |||||||
| Leased SF | 40,990,453 | |||||||
| Percent Leased | 92.2 | % | ||||||
In-Place ABR(2) | $ | 719,344 | ||||||
ABR Under Uncommenced Leases (in thousands)(2)(3) | 14,178 | |||||||
In-Place + Uncommenced ABR (in thousands)(2) | $ | 733,522 | ||||||
In-Place + Uncommenced ABR per SF(2) | $ | 17.89 | ||||||
Third Quarter 2026 Supplemental Financial Reporting Package | Page 36 | | ||||||