Bread Financial Holdings, Inc Financial Supplement Third Quarter 2026 Table of Contents Page Number Table 1: Consolidated Statements of Income 2 Table 2: Consolidated Balance Sheets 3 Table 3: Select Financial Metrics 4 Table 4: Capital Ratios 5 Table 5: Average Balances and Net Interest Margin 6 Table 6: Reconciliation of GAAP to Non-GAAP Financial Measures 7 Glossary of Terms 9 Note: The information contained in this Financial Supplement is preliminary and based on data available at the time of the earnings presentation. Please refer to our Quarterly Report on Form 10-Q for the period ended September 30, 2026 once it is filed with the Securities and Exchange Commission. Amounts presented in the following tables may not sum and percentages may not recalculate due to rounding. 1 Exhibit 99.2
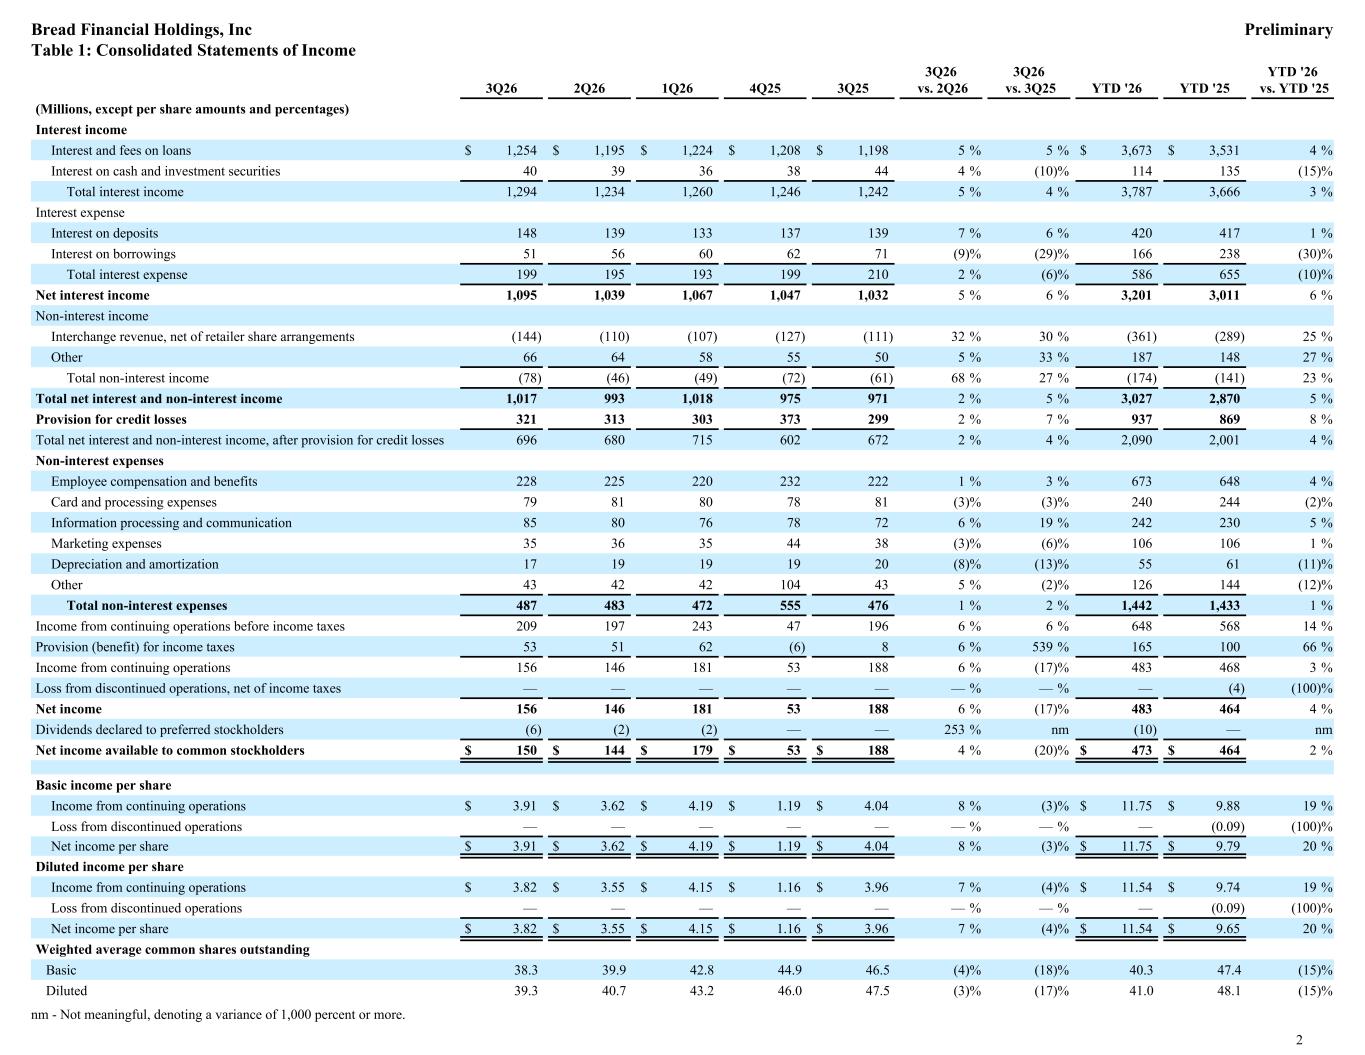
3Q26 2Q26 1Q26 4Q25 3Q25 3Q26 vs. 2Q26 3Q26 vs. 3Q25 YTD '26 YTD '25 YTD '26 vs. YTD '25 (Millions, except per share amounts and percentages) Interest income Interest and fees on loans $ 1,254 $ 1,195 $ 1,224 $ 1,208 $ 1,198 5 % 5 % $ 3,673 $ 3,531 4 % Interest on cash and investment securities 40 39 36 38 44 4 % (10) % 114 135 (15) % Total interest income 1,294 1,234 1,260 1,246 1,242 5 % 4 % 3,787 3,666 3 % Interest expense Interest on deposits 148 139 133 137 139 7 % 6 % 420 417 1 % Interest on borrowings 51 56 60 62 71 (9) % (29) % 166 238 (30) % Total interest expense 199 195 193 199 210 2 % (6) % 586 655 (10) % Net interest income 1,095 1,039 1,067 1,047 1,032 5 % 6 % 3,201 3,011 6 % Non-interest income Interchange revenue, net of retailer share arrangements (144) (110) (107) (127) (111) 32 % 30 % (361) (289) 25 % Other 66 64 58 55 50 5 % 33 % 187 148 27 % Total non-interest income (78) (46) (49) (72) (61) 68 % 27 % (174) (141) 23 % Total net interest and non-interest income 1,017 993 1,018 975 971 2 % 5 % 3,027 2,870 5 % Provision for credit losses 321 313 303 373 299 2 % 7 % 937 869 8 % Total net interest and non-interest income, after provision for credit losses 696 680 715 602 672 2 % 4 % 2,090 2,001 4 % Non-interest expenses Employee compensation and benefits 228 225 220 232 222 1 % 3 % 673 648 4 % Card and processing expenses 79 81 80 78 81 (3) % (3) % 240 244 (2) % Information processing and communication 85 80 76 78 72 6 % 19 % 242 230 5 % Marketing expenses 35 36 35 44 38 (3) % (6) % 106 106 1 % Depreciation and amortization 17 19 19 19 20 (8) % (13) % 55 61 (11) % Other 43 42 42 104 43 5 % (2) % 126 144 (12) % Total non-interest expenses 487 483 472 555 476 1 % 2 % 1,442 1,433 1 % Income from continuing operations before income taxes 209 197 243 47 196 6 % 6 % 648 568 14 % Provision (benefit) for income taxes 53 51 62 (6) 8 6 % 539 % 165 100 66 % Income from continuing operations 156 146 181 53 188 6 % (17) % 483 468 3 % Loss from discontinued operations, net of income taxes — — — — — — % — % — (4) (100) % Net income 156 146 181 53 188 6 % (17) % 483 464 4 % Dividends declared to preferred stockholders (6) (2) (2) — — 253 % nm (10) — nm Net income available to common stockholders $ 150 $ 144 $ 179 $ 53 $ 188 4 % (20) % $ 473 $ 464 2 % Basic income per share Income from continuing operations $ 3.91 $ 3.62 $ 4.19 $ 1.19 $ 4.04 8 % (3) % $ 11.75 $ 9.88 19 % Loss from discontinued operations — — — — — — % — % — (0.09) (100) % Net income per share $ 3.91 $ 3.62 $ 4.19 $ 1.19 $ 4.04 8 % (3) % $ 11.75 $ 9.79 20 % Diluted income per share Income from continuing operations $ 3.82 $ 3.55 $ 4.15 $ 1.16 $ 3.96 7 % (4) % $ 11.54 $ 9.74 19 % Loss from discontinued operations — — — — — — % — % — (0.09) (100) % Net income per share $ 3.82 $ 3.55 $ 4.15 $ 1.16 $ 3.96 7 % (4) % $ 11.54 $ 9.65 20 % Weighted average common shares outstanding Basic 38.3 39.9 42.8 44.9 46.5 (4) % (18) % 40.3 47.4 (15) % Diluted 39.3 40.7 43.2 46.0 47.5 (3) % (17) % 41.0 48.1 (15) % nm - Not meaningful, denoting a variance of 1,000 percent or more. Bread Financial Holdings, Inc Preliminary Table 1: Consolidated Statements of Income 2
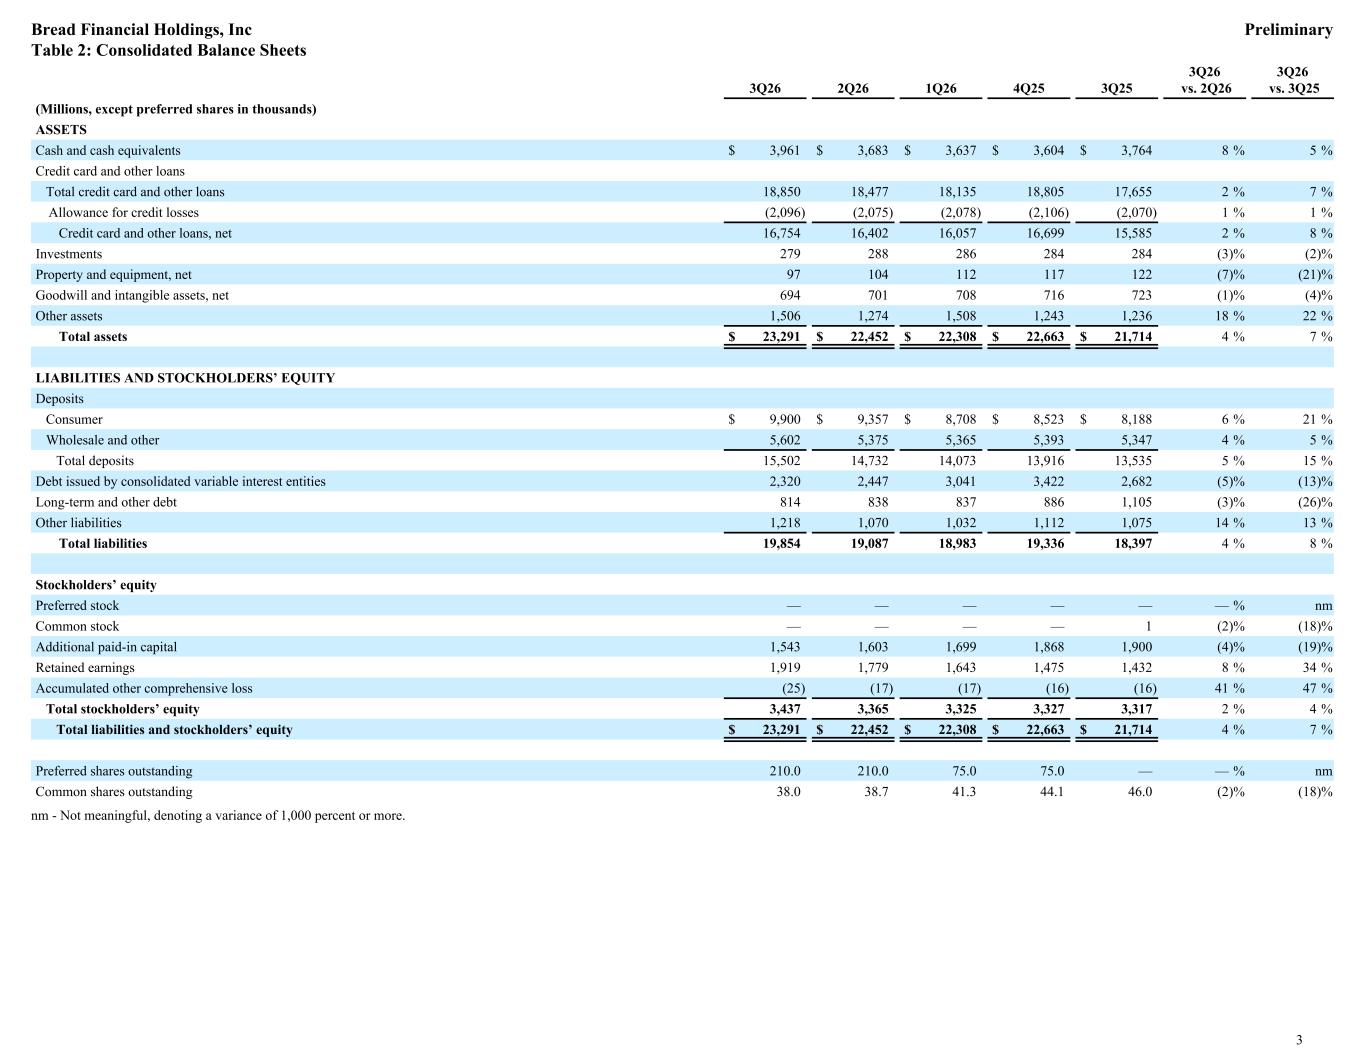
3Q26 2Q26 1Q26 4Q25 3Q25 3Q26 vs. 2Q26 3Q26 vs. 3Q25 (Millions, except preferred shares in thousands) ASSETS Cash and cash equivalents $ 3,961 $ 3,683 $ 3,637 $ 3,604 $ 3,764 8 % 5 % Credit card and other loans Total credit card and other loans 18,850 18,477 18,135 18,805 17,655 2 % 7 % Allowance for credit losses (2,096) (2,075) (2,078) (2,106) (2,070) 1 % 1 % Credit card and other loans, net 16,754 16,402 16,057 16,699 15,585 2 % 8 % Investments 279 288 286 284 284 (3) % (2) % Property and equipment, net 97 104 112 117 122 (7) % (21) % Goodwill and intangible assets, net 694 701 708 716 723 (1) % (4) % Other assets 1,506 1,274 1,508 1,243 1,236 18 % 22 % Total assets $ 23,291 $ 22,452 $ 22,308 $ 22,663 $ 21,714 4 % 7 % LIABILITIES AND STOCKHOLDERS’ EQUITY Deposits Consumer $ 9,900 $ 9,357 $ 8,708 $ 8,523 $ 8,188 6 % 21 % Wholesale and other 5,602 5,375 5,365 5,393 5,347 4 % 5 % Total deposits 15,502 14,732 14,073 13,916 13,535 5 % 15 % Debt issued by consolidated variable interest entities 2,320 2,447 3,041 3,422 2,682 (5) % (13) % Long-term and other debt 814 838 837 886 1,105 (3) % (26) % Other liabilities 1,218 1,070 1,032 1,112 1,075 14 % 13 % Total liabilities 19,854 19,087 18,983 19,336 18,397 4 % 8 % Stockholders’ equity Preferred stock — — — — — — % nm Common stock — — — — 1 (2) % (18) % Additional paid-in capital 1,543 1,603 1,699 1,868 1,900 (4) % (19) % Retained earnings 1,919 1,779 1,643 1,475 1,432 8 % 34 % Accumulated other comprehensive loss (25) (17) (17) (16) (16) 41 % 47 % Total stockholders’ equity 3,437 3,365 3,325 3,327 3,317 2 % 4 % Total liabilities and stockholders’ equity $ 23,291 $ 22,452 $ 22,308 $ 22,663 $ 21,714 4 % 7 % Preferred shares outstanding 210.0 210.0 75.0 75.0 — — % nm Common shares outstanding 38.0 38.7 41.3 44.1 46.0 (2) % (18) % nm - Not meaningful, denoting a variance of 1,000 percent or more. Bread Financial Holdings, Inc Preliminary Table 2: Consolidated Balance Sheets 3
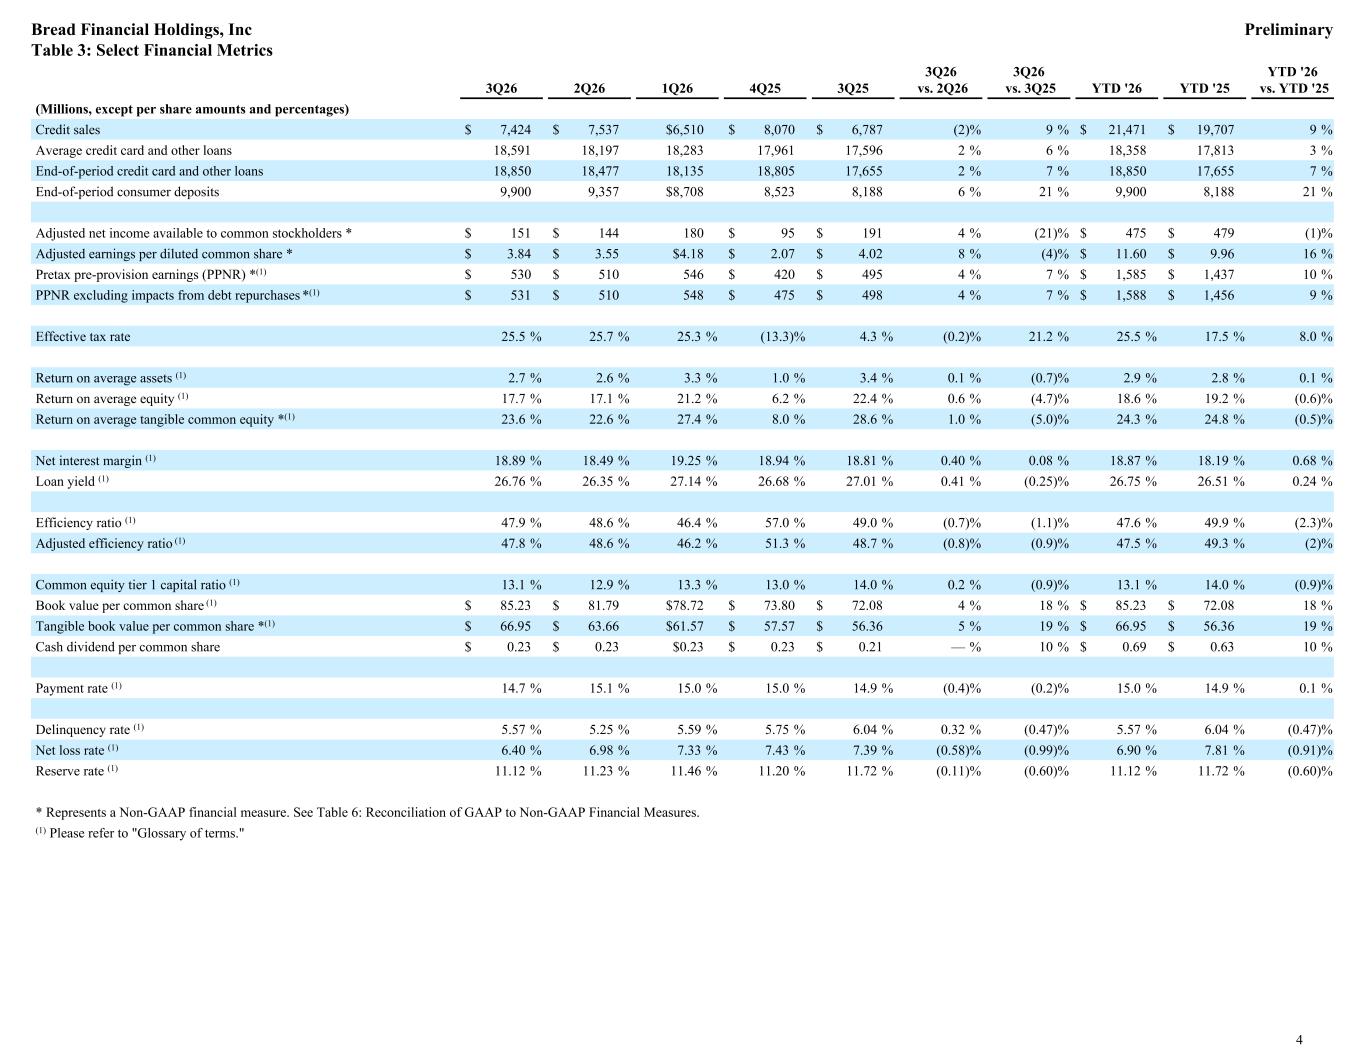
3Q26 2Q26 1Q26 4Q25 3Q25 3Q26 vs. 2Q26 3Q26 vs. 3Q25 YTD '26 YTD '25 YTD '26 vs. YTD '25 (Millions, except per share amounts and percentages) Credit sales $ 7,424 $ 7,537 $6,510 $ 8,070 $ 6,787 (2) % 9 % $ 21,471 $ 19,707 9 % Average credit card and other loans 18,591 18,197 18,283 17,961 17,596 2 % 6 % 18,358 17,813 3 % End-of-period credit card and other loans 18,850 18,477 18,135 18,805 17,655 2 % 7 % 18,850 17,655 7 % End-of-period consumer deposits 9,900 9,357 $8,708 8,523 8,188 6 % 21 % 9,900 8,188 21 % Adjusted net income available to common stockholders * $ 151 $ 144 180 $ 95 $ 191 4 % (21) % $ 475 $ 479 (1) % Adjusted earnings per diluted common share * $ 3.84 $ 3.55 $4.18 $ 2.07 $ 4.02 8 % (4) % $ 11.60 $ 9.96 16 % Pretax pre-provision earnings (PPNR) *(1) $ 530 $ 510 546 $ 420 $ 495 4 % 7 % $ 1,585 $ 1,437 10 % PPNR excluding impacts from debt repurchases *(1) $ 531 $ 510 548 $ 475 $ 498 4 % 7 % $ 1,588 $ 1,456 9 % Effective tax rate 25.5 % 25.7 % 25.3 % (13.3) % 4.3 % (0.2) % 21.2 % 25.5 % 17.5 % 8.0 % Return on average assets (1) 2.7 % 2.6 % 3.3 % 1.0 % 3.4 % 0.1 % (0.7) % 2.9 % 2.8 % 0.1 % Return on average equity (1) 17.7 % 17.1 % 21.2 % 6.2 % 22.4 % 0.6 % (4.7) % 18.6 % 19.2 % (0.6) % Return on average tangible common equity *(1) 23.6 % 22.6 % 27.4 % 8.0 % 28.6 % 1.0 % (5.0) % 24.3 % 24.8 % (0.5) % Net interest margin (1) 18.89 % 18.49 % 19.25 % 18.94 % 18.81 % 0.40 % 0.08 % 18.87 % 18.19 % 0.68 % Loan yield (1) 26.76 % 26.35 % 27.14 % 26.68 % 27.01 % 0.41 % (0.25) % 26.75 % 26.51 % 0.24 % Efficiency ratio (1) 47.9 % 48.6 % 46.4 % 57.0 % 49.0 % (0.7) % (1.1) % 47.6 % 49.9 % (2.3) % Adjusted efficiency ratio (1) 47.8 % 48.6 % 46.2 % 51.3 % 48.7 % (0.8) % (0.9) % 47.5 % 49.3 % (2) % Common equity tier 1 capital ratio (1) 13.1 % 12.9 % 13.3 % 13.0 % 14.0 % 0.2 % (0.9) % 13.1 % 14.0 % (0.9) % Book value per common share (1) $ 85.23 $ 81.79 $78.72 $ 73.80 $ 72.08 4 % 18 % $ 85.23 $ 72.08 18 % Tangible book value per common share *(1) $ 66.95 $ 63.66 $61.57 $ 57.57 $ 56.36 5 % 19 % $ 66.95 $ 56.36 19 % Cash dividend per common share $ 0.23 $ 0.23 $0.23 $ 0.23 $ 0.21 — % 10 % $ 0.69 $ 0.63 10 % Payment rate (1) 14.7 % 15.1 % 15.0 % 15.0 % 14.9 % (0.4) % (0.2) % 15.0 % 14.9 % 0.1 % Delinquency rate (1) 5.57 % 5.25 % 5.59 % 5.75 % 6.04 % 0.32 % (0.47) % 5.57 % 6.04 % (0.47) % Net loss rate (1) 6.40 % 6.98 % 7.33 % 7.43 % 7.39 % (0.58) % (0.99) % 6.90 % 7.81 % (0.91) % Reserve rate (1) 11.12 % 11.23 % 11.46 % 11.20 % 11.72 % (0.11) % (0.60) % 11.12 % 11.72 % (0.60) % * Represents a Non-GAAP financial measure. See Table 6: Reconciliation of GAAP to Non-GAAP Financial Measures. (1) Please refer to "Glossary of terms." Bread Financial Holdings, Inc Preliminary Table 3: Select Financial Metrics 4
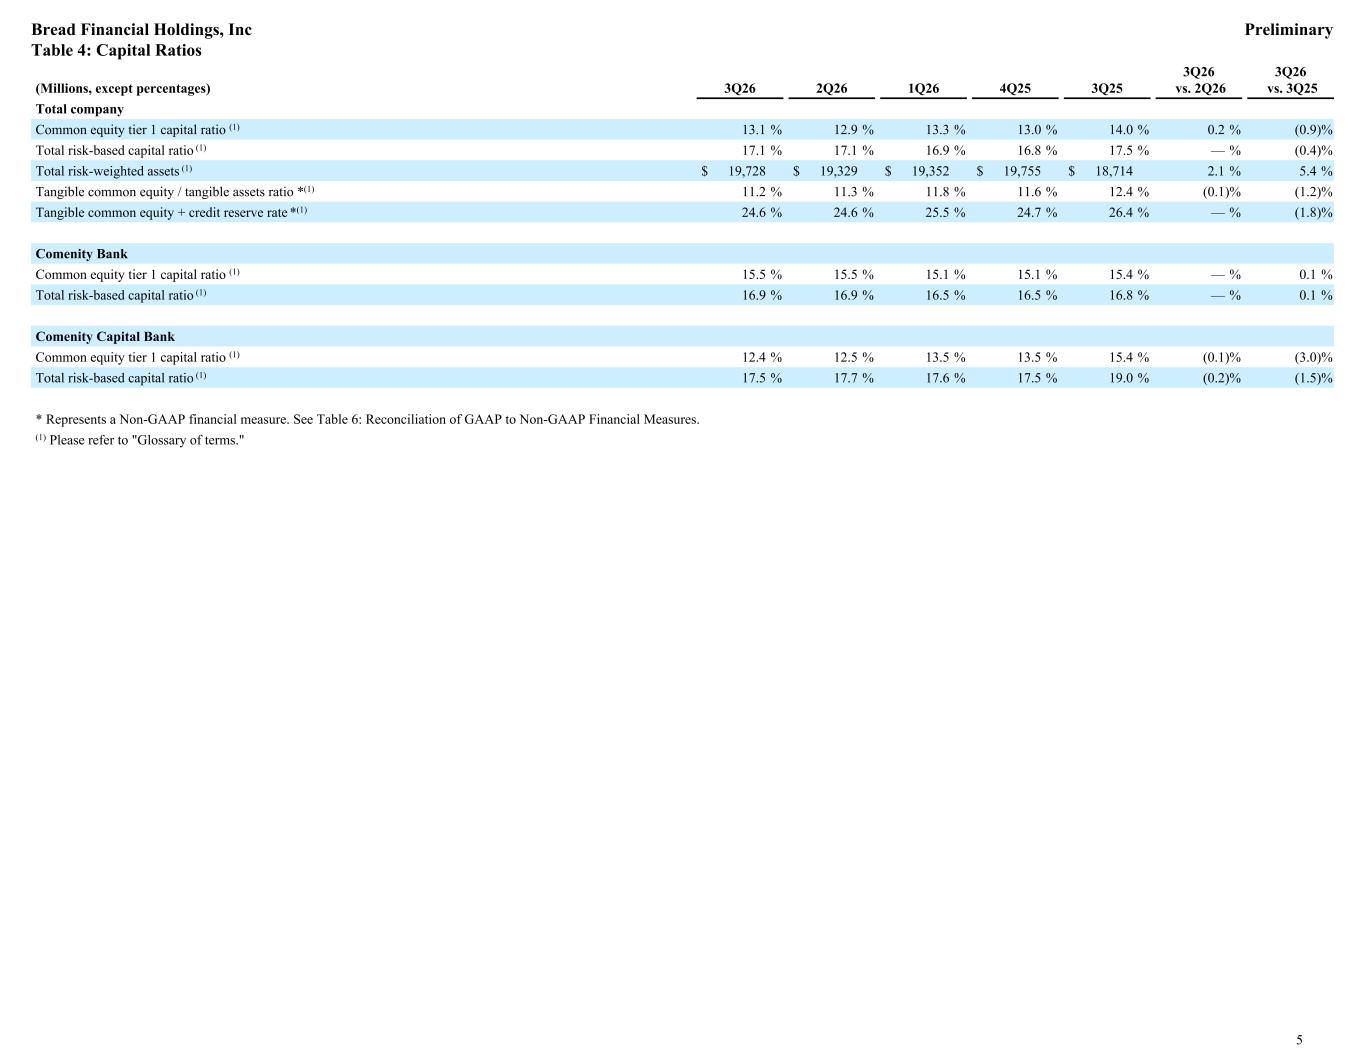
(Millions, except percentages) 3Q26 2Q26 1Q26 4Q25 3Q25 3Q26 vs. 2Q26 3Q26 vs. 3Q25 Total company Common equity tier 1 capital ratio (1) 13.1 % 12.9 % 13.3 % 13.0 % 14.0 % 0.2 % (0.9) % Total risk-based capital ratio (1) 17.1 % 17.1 % 16.9 % 16.8 % 17.5 % — % (0.4) % Total risk-weighted assets (1) $ 19,728 $ 19,329 $ 19,352 $ 19,755 $ 18,714 2.1 % 5.4 % Tangible common equity / tangible assets ratio *(1) 11.2 % 11.3 % 11.8 % 11.6 % 12.4 % (0.1) % (1.2) % Tangible common equity + credit reserve rate *(1) 24.6 % 24.6 % 25.5 % 24.7 % 26.4 % — % (1.8) % Comenity Bank Common equity tier 1 capital ratio (1) 15.5 % 15.5 % 15.1 % 15.1 % 15.4 % — % 0.1 % Total risk-based capital ratio (1) 16.9 % 16.9 % 16.5 % 16.5 % 16.8 % — % 0.1 % Comenity Capital Bank Common equity tier 1 capital ratio (1) 12.4 % 12.5 % 13.5 % 13.5 % 15.4 % (0.1) % (3.0) % Total risk-based capital ratio (1) 17.5 % 17.7 % 17.6 % 17.5 % 19.0 % (0.2) % (1.5) % * Represents a Non-GAAP financial measure. See Table 6: Reconciliation of GAAP to Non-GAAP Financial Measures. (1) Please refer to "Glossary of terms." Bread Financial Holdings, Inc Preliminary Table 4: Capital Ratios 5
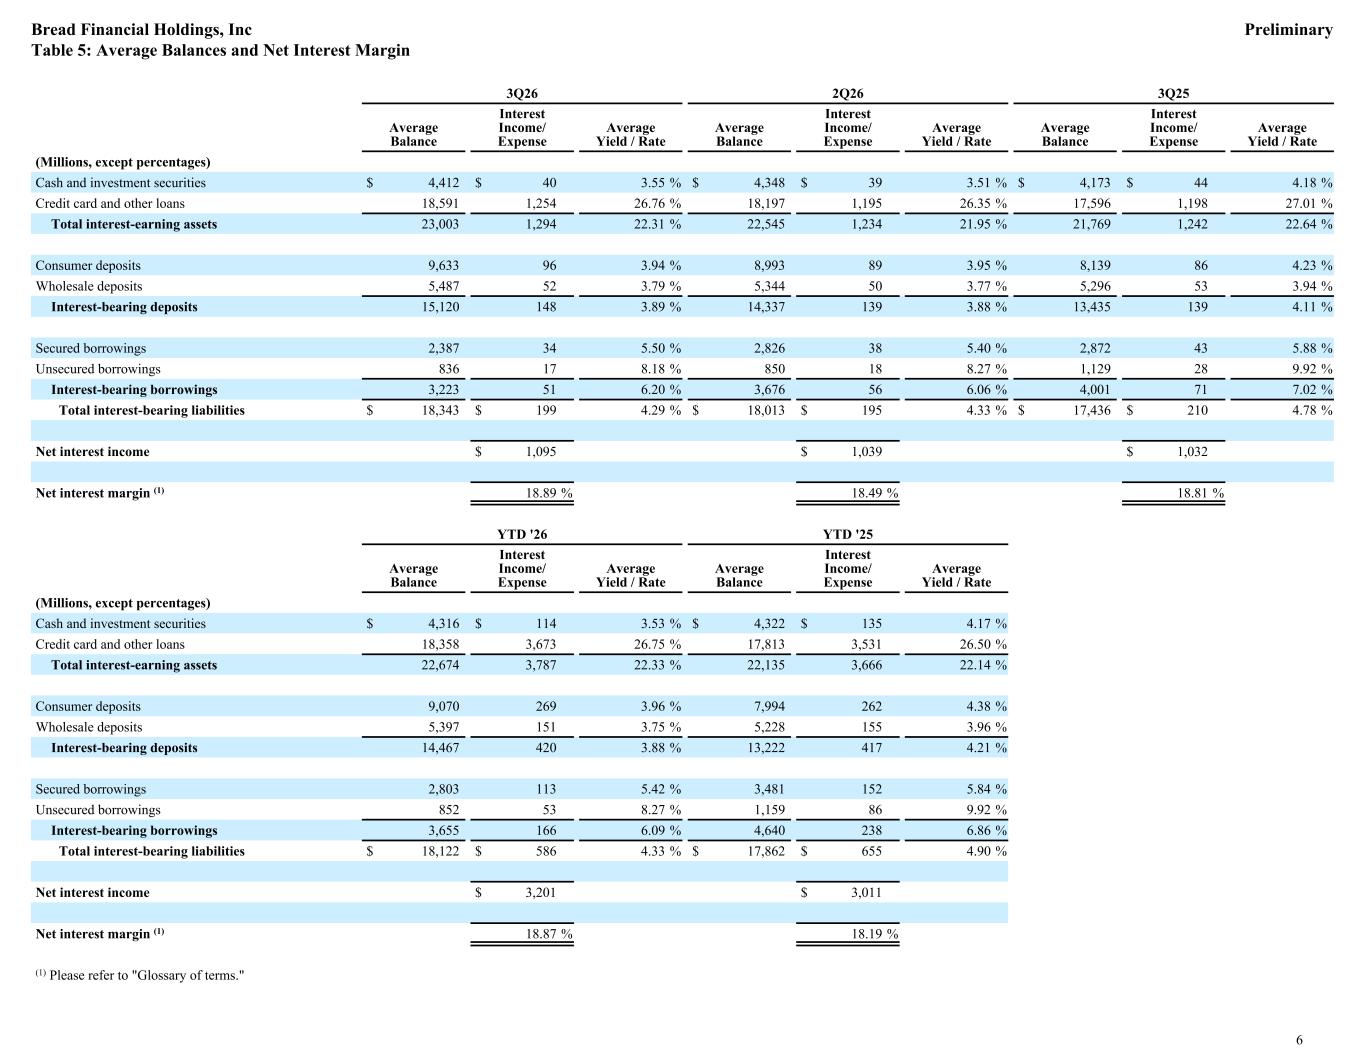
3Q26 2Q26 3Q25 Average Balance Interest Income/ Expense Average Yield / Rate Average Balance Interest Income/ Expense Average Yield / Rate Average Balance Interest Income/ Expense Average Yield / Rate (Millions, except percentages) Cash and investment securities $ 4,412 $ 40 3.55 % $ 4,348 $ 39 3.51 % $ 4,173 $ 44 4.18 % Credit card and other loans 18,591 1,254 26.76 % 18,197 1,195 26.35 % 17,596 1,198 27.01 % Total interest-earning assets 23,003 1,294 22.31 % 22,545 1,234 21.95 % 21,769 1,242 22.64 % Consumer deposits 9,633 96 3.94 % 8,993 89 3.95 % 8,139 86 4.23 % Wholesale deposits 5,487 52 3.79 % 5,344 50 3.77 % 5,296 53 3.94 % Interest-bearing deposits 15,120 148 3.89 % 14,337 139 3.88 % 13,435 139 4.11 % Secured borrowings 2,387 34 5.50 % 2,826 38 5.40 % 2,872 43 5.88 % Unsecured borrowings 836 17 8.18 % 850 18 8.27 % 1,129 28 9.92 % Interest-bearing borrowings 3,223 51 6.20 % 3,676 56 6.06 % 4,001 71 7.02 % Total interest-bearing liabilities $ 18,343 $ 199 4.29 % $ 18,013 $ 195 4.33 % $ 17,436 $ 210 4.78 % Net interest income $ 1,095 $ 1,039 $ 1,032 Net interest margin (1) 18.89 % 18.49 % 18.81 % YTD '26 YTD '25 Average Balance Interest Income/ Expense Average Yield / Rate Average Balance Interest Income/ Expense Average Yield / Rate (Millions, except percentages) Cash and investment securities $ 4,316 $ 114 3.53 % $ 4,322 $ 135 4.17 % Credit card and other loans 18,358 3,673 26.75 % 17,813 3,531 26.50 % Total interest-earning assets 22,674 3,787 22.33 % 22,135 3,666 22.14 % Consumer deposits 9,070 269 3.96 % 7,994 262 4.38 % Wholesale deposits 5,397 151 3.75 % 5,228 155 3.96 % Interest-bearing deposits 14,467 420 3.88 % 13,222 417 4.21 % Secured borrowings 2,803 113 5.42 % 3,481 152 5.84 % Unsecured borrowings 852 53 8.27 % 1,159 86 9.92 % Interest-bearing borrowings 3,655 166 6.09 % 4,640 238 6.86 % Total interest-bearing liabilities $ 18,122 $ 586 4.33 % $ 17,862 $ 655 4.90 % Net interest income $ 3,201 $ 3,011 Net interest margin (1) 18.87 % 18.19 % (1) Please refer to "Glossary of terms." Bread Financial Holdings, Inc Preliminary Table 5: Average Balances and Net Interest Margin 6
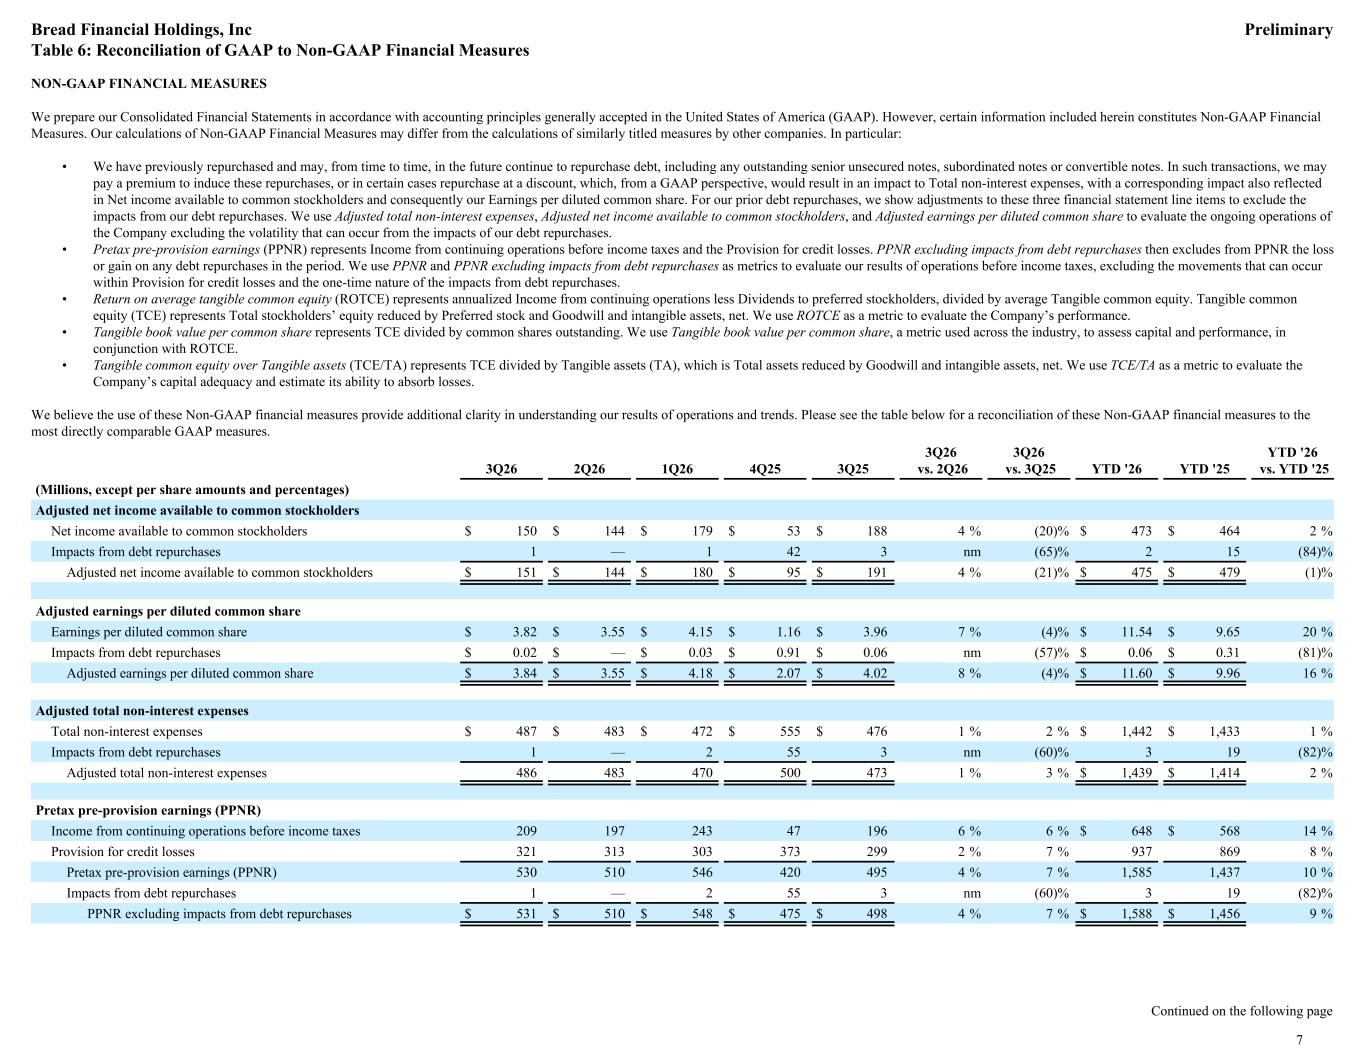
NON-GAAP FINANCIAL MEASURES We prepare our Consolidated Financial Statements in accordance with accounting principles generally accepted in the United States of America (GAAP). However, certain information included herein constitutes Non-GAAP Financial Measures. Our calculations of Non-GAAP Financial Measures may differ from the calculations of similarly titled measures by other companies. In particular: • We have previously repurchased and may, from time to time, in the future continue to repurchase debt, including any outstanding senior unsecured notes, subordinated notes or convertible notes. In such transactions, we may pay a premium to induce these repurchases, or in certain cases repurchase at a discount, which, from a GAAP perspective, would result in an impact to Total non-interest expenses, with a corresponding impact also reflected in Net income available to common stockholders and consequently our Earnings per diluted common share. For our prior debt repurchases, we show adjustments to these three financial statement line items to exclude the impacts from our debt repurchases. We use Adjusted total non-interest expenses, Adjusted net income available to common stockholders, and Adjusted earnings per diluted common share to evaluate the ongoing operations of the Company excluding the volatility that can occur from the impacts of our debt repurchases. • Pretax pre-provision earnings (PPNR) represents Income from continuing operations before income taxes and the Provision for credit losses. PPNR excluding impacts from debt repurchases then excludes from PPNR the loss or gain on any debt repurchases in the period. We use PPNR and PPNR excluding impacts from debt repurchases as metrics to evaluate our results of operations before income taxes, excluding the movements that can occur within Provision for credit losses and the one-time nature of the impacts from debt repurchases. • Return on average tangible common equity (ROTCE) represents annualized Income from continuing operations less Dividends to preferred stockholders, divided by average Tangible common equity. Tangible common equity (TCE) represents Total stockholders’ equity reduced by Preferred stock and Goodwill and intangible assets, net. We use ROTCE as a metric to evaluate the Company’s performance. • Tangible book value per common share represents TCE divided by common shares outstanding. We use Tangible book value per common share, a metric used across the industry, to assess capital and performance, in conjunction with ROTCE. • Tangible common equity over Tangible assets (TCE/TA) represents TCE divided by Tangible assets (TA), which is Total assets reduced by Goodwill and intangible assets, net. We use TCE/TA as a metric to evaluate the Company’s capital adequacy and estimate its ability to absorb losses. We believe the use of these Non-GAAP financial measures provide additional clarity in understanding our results of operations and trends. Please see the table below for a reconciliation of these Non-GAAP financial measures to the most directly comparable GAAP measures. Adjusted net income available to common stockholders Net income available to common stockholders $ 150 $ 144 $ 179 $ 53 $ 188 4 % (20) % $ 473 $ 464 2 % Impacts from debt repurchases 1 — 1 42 3 nm (65) % 2 15 (84) % Adjusted net income available to common stockholders $ 151 $ 144 $ 180 $ 95 $ 191 4 % (21) % $ 475 $ 479 (1) % Adjusted earnings per diluted common share Earnings per diluted common share $ 3.82 $ 3.55 $ 4.15 $ 1.16 $ 3.96 7 % (4) % $ 11.54 $ 9.65 20 % Impacts from debt repurchases $ 0.02 $ — $ 0.03 $ 0.91 $ 0.06 nm (57) % $ 0.06 $ 0.31 (81) % Adjusted earnings per diluted common share $ 3.84 $ 3.55 $ 4.18 $ 2.07 $ 4.02 8 % (4) % $ 11.60 $ 9.96 16 % Adjusted total non-interest expenses Total non-interest expenses $ 487 $ 483 $ 472 $ 555 $ 476 1 % 2 % $ 1,442 $ 1,433 1 % Impacts from debt repurchases 1 — 2 55 3 nm (60) % 3 19 (82) % Adjusted total non-interest expenses 486 483 470 500 473 1 % 3 % $ 1,439 $ 1,414 2 % Pretax pre-provision earnings (PPNR) Income from continuing operations before income taxes 209 197 243 47 196 6 % 6 % $ 648 $ 568 14 % Provision for credit losses 321 313 303 373 299 2 % 7 % 937 869 8 % Pretax pre-provision earnings (PPNR) 530 510 546 420 495 4 % 7 % 1,585 1,437 10 % Impacts from debt repurchases 1 — 2 55 3 nm (60) % 3 19 (82) % PPNR excluding impacts from debt repurchases $ 531 $ 510 $ 548 $ 475 $ 498 4 % 7 % $ 1,588 $ 1,456 9 % Continued on the following page 3Q26 2Q26 1Q26 4Q25 3Q25 3Q26 vs. 2Q26 3Q26 vs. 3Q25 YTD '26 YTD '25 YTD '26 vs. YTD '25 (Millions, except per share amounts and percentages) Bread Financial Holdings, Inc Preliminary Table 6: Reconciliation of GAAP to Non-GAAP Financial Measures 7
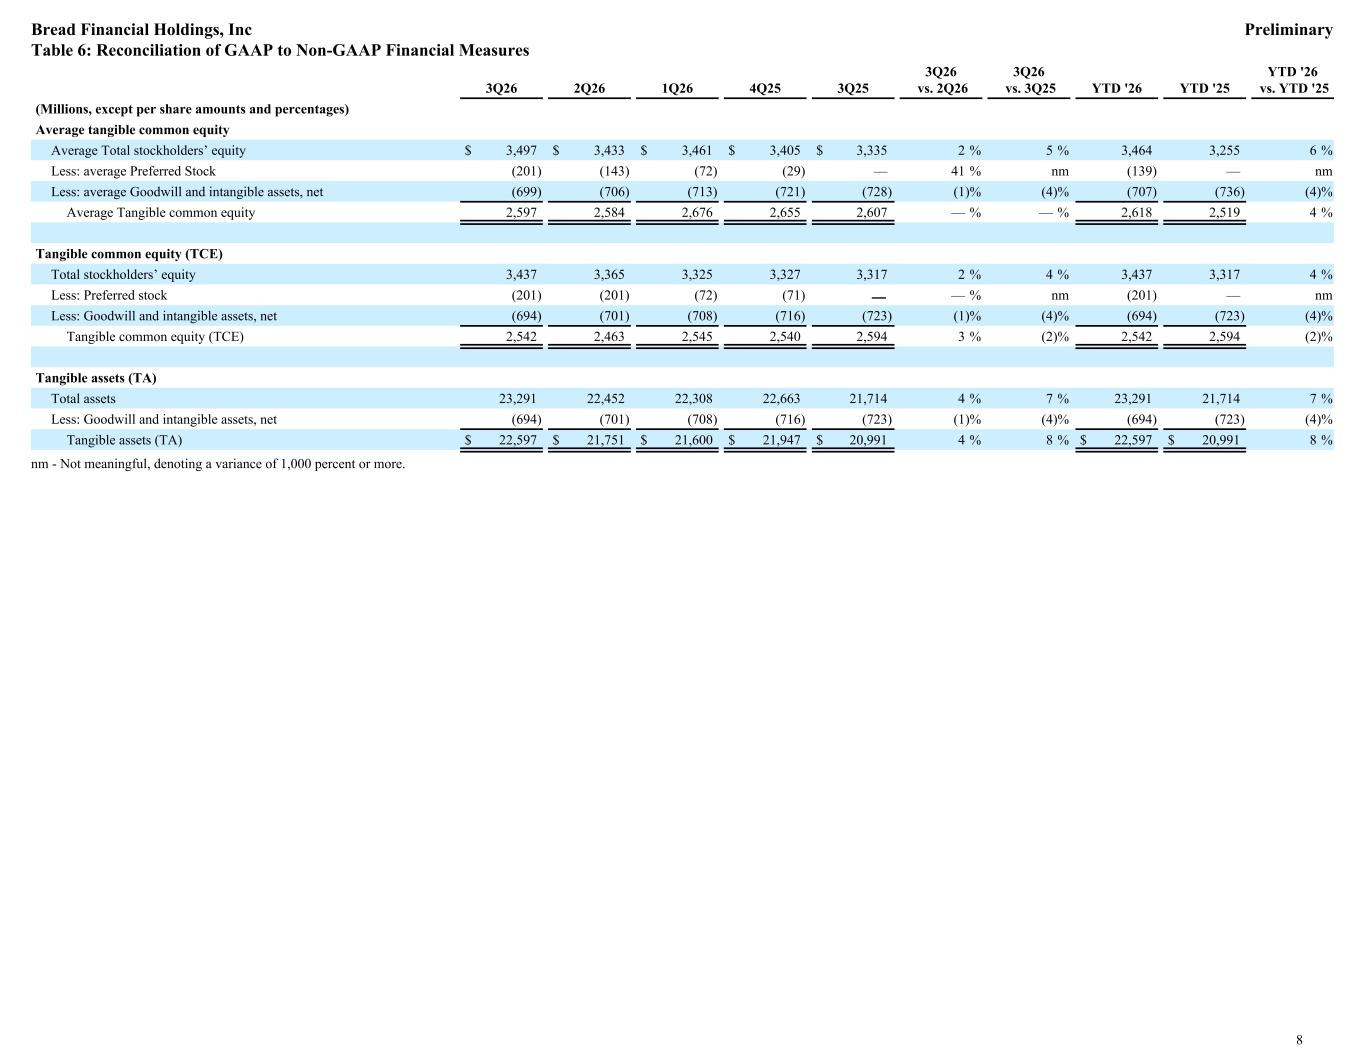
Average tangible common equity Average Total stockholders’ equity $ 3,497 $ 3,433 $ 3,461 $ 3,405 $ 3,335 2 % 5 % 3,464 3,255 6 % Less: average Preferred Stock (201) (143) (72) (29) — 41 % nm (139) — nm Less: average Goodwill and intangible assets, net (699) (706) (713) (721) (728) (1) % (4) % (707) (736) (4) % Average Tangible common equity 2,597 2,584 2,676 2,655 2,607 — % — % 2,618 2,519 4 % Tangible common equity (TCE) Total stockholders’ equity 3,437 3,365 3,325 3,327 3,317 2 % 4 % 3,437 3,317 4 % Less: Preferred stock (201) (201) (72) (71) — — % nm (201) — nm Less: Goodwill and intangible assets, net (694) (701) (708) (716) (723) (1) % (4) % (694) (723) (4) % Tangible common equity (TCE) 2,542 2,463 2,545 2,540 2,594 3 % (2) % 2,542 2,594 (2) % Tangible assets (TA) Total assets 23,291 22,452 22,308 22,663 21,714 4 % 7 % 23,291 21,714 7 % Less: Goodwill and intangible assets, net (694) (701) (708) (716) (723) (1) % (4) % (694) (723) (4) % Tangible assets (TA) $ 22,597 $ 21,751 $ 21,600 $ 21,947 $ 20,991 4 % 8 % $ 22,597 $ 20,991 8 % 3Q26 2Q26 1Q26 4Q25 3Q25 3Q26 vs. 2Q26 3Q26 vs. 3Q25 YTD '26 YTD '25 YTD '26 vs. YTD '25 (Millions, except per share amounts and percentages) nm - Not meaningful, denoting a variance of 1,000 percent or more. Bread Financial Holdings, Inc Preliminary Table 6: Reconciliation of GAAP to Non-GAAP Financial Measures 8
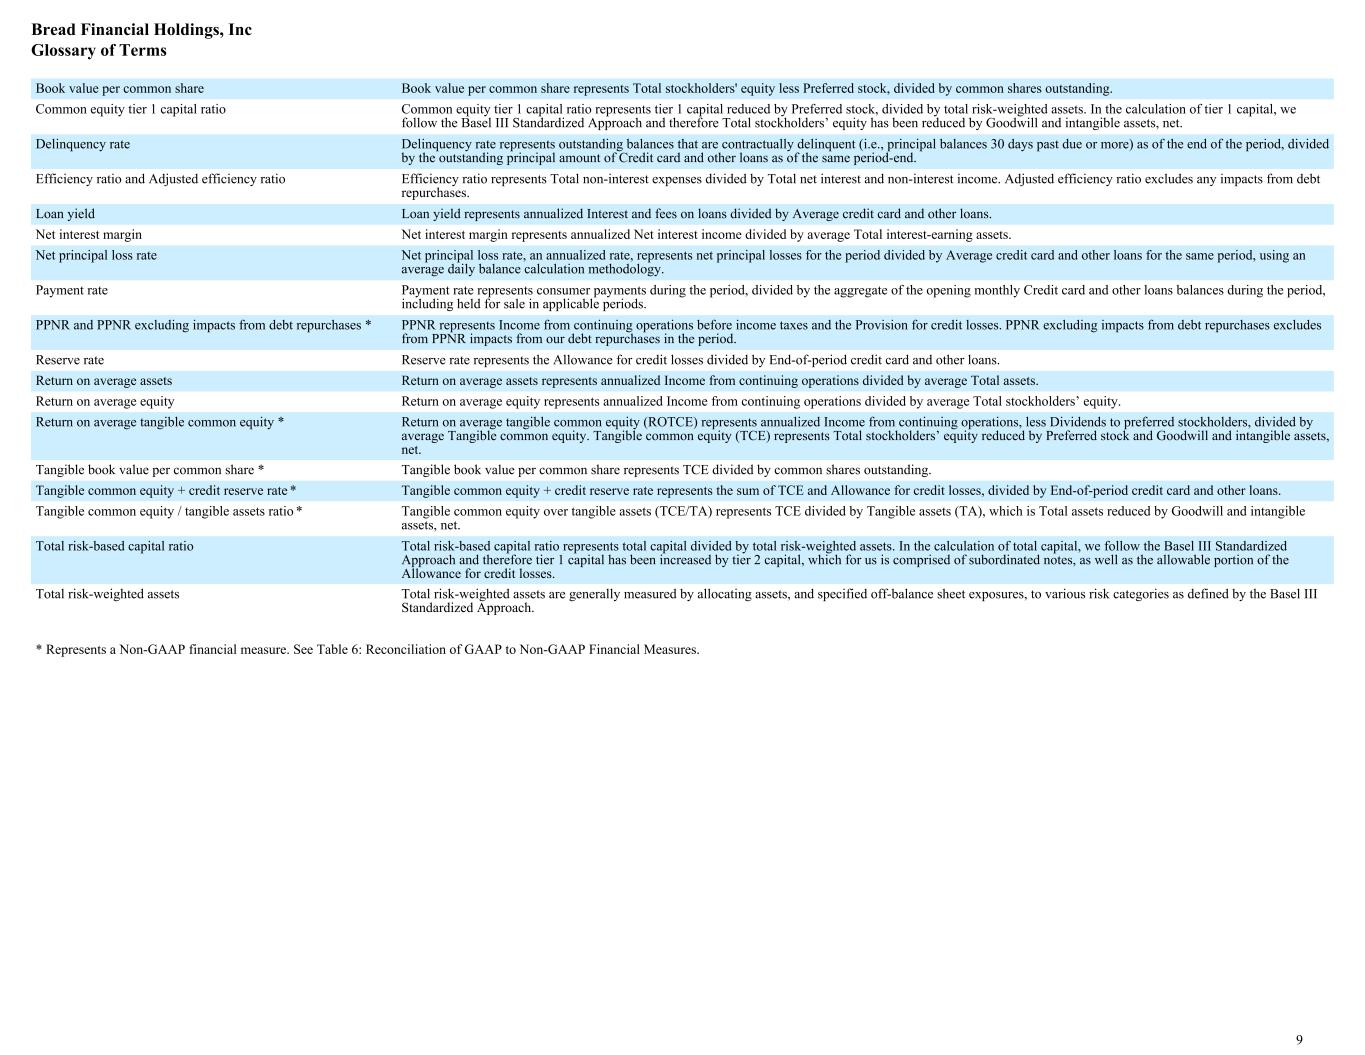
Book value per common share Book value per common share represents Total stockholders' equity less Preferred stock, divided by common shares outstanding. Common equity tier 1 capital ratio Common equity tier 1 capital ratio represents tier 1 capital reduced by Preferred stock, divided by total risk-weighted assets. In the calculation of tier 1 capital, we follow the Basel III Standardized Approach and therefore Total stockholders’ equity has been reduced by Goodwill and intangible assets, net. Delinquency rate Delinquency rate represents outstanding balances that are contractually delinquent (i.e., principal balances 30 days past due or more) as of the end of the period, divided by the outstanding principal amount of Credit card and other loans as of the same period-end. Efficiency ratio and Adjusted efficiency ratio Efficiency ratio represents Total non-interest expenses divided by Total net interest and non-interest income. Adjusted efficiency ratio excludes any impacts from debt repurchases. Loan yield Loan yield represents annualized Interest and fees on loans divided by Average credit card and other loans. Net interest margin Net interest margin represents annualized Net interest income divided by average Total interest-earning assets. Net principal loss rate Net principal loss rate, an annualized rate, represents net principal losses for the period divided by Average credit card and other loans for the same period, using an average daily balance calculation methodology. Payment rate Payment rate represents consumer payments during the period, divided by the aggregate of the opening monthly Credit card and other loans balances during the period, including held for sale in applicable periods. PPNR and PPNR excluding impacts from debt repurchases * PPNR represents Income from continuing operations before income taxes and the Provision for credit losses. PPNR excluding impacts from debt repurchases excludes from PPNR impacts from our debt repurchases in the period. Reserve rate Reserve rate represents the Allowance for credit losses divided by End-of-period credit card and other loans. Return on average assets Return on average assets represents annualized Income from continuing operations divided by average Total assets. Return on average equity Return on average equity represents annualized Income from continuing operations divided by average Total stockholders’ equity. Return on average tangible common equity * Return on average tangible common equity (ROTCE) represents annualized Income from continuing operations, less Dividends to preferred stockholders, divided by average Tangible common equity. Tangible common equity (TCE) represents Total stockholders’ equity reduced by Preferred stock and Goodwill and intangible assets, net. Tangible book value per common share * Tangible book value per common share represents TCE divided by common shares outstanding. Tangible common equity + credit reserve rate * Tangible common equity + credit reserve rate represents the sum of TCE and Allowance for credit losses, divided by End-of-period credit card and other loans. Tangible common equity / tangible assets ratio * Tangible common equity over tangible assets (TCE/TA) represents TCE divided by Tangible assets (TA), which is Total assets reduced by Goodwill and intangible assets, net. Total risk-based capital ratio Total risk-based capital ratio represents total capital divided by total risk-weighted assets. In the calculation of total capital, we follow the Basel III Standardized Approach and therefore tier 1 capital has been increased by tier 2 capital, which for us is comprised of subordinated notes, as well as the allowable portion of the Allowance for credit losses. Total risk-weighted assets Total risk-weighted assets are generally measured by allocating assets, and specified off-balance sheet exposures, to various risk categories as defined by the Basel III Standardized Approach. * Represents a Non-GAAP financial measure. See Table 6: Reconciliation of GAAP to Non-GAAP Financial Measures. Bread Financial Holdings, Inc Glossary of Terms 9