
FINANCIAL RESULTS Third Quarter 2026 Earnings Presentation | October 22, 2026
Forward looking statements This presentation may contain “forward -looking statements” that involve risks and uncertainties, which could cause actual results to differ from those contained in the forward -looking statements. These include statements concerning the Corporation’s future economic, operational, and financial performance, which may constitute forward-looking statements and are subject to the risk that the actual impact may differ, possibly materially, from what is currently expected. For a discussion of additional risks and uncertainties, which could cause actual results to differ from those contained in the forward -looking statements, see the Corporation’s Securities and Exchange Commission filings, including, but not limited to, those risks and uncertainties included under the captions “Risk Factors” and “Forward -Looking Statements” set forth in these filings and any updates to such risks and uncertainties contained in subsequent report s on Form 10-K, Form 10-Q or Form 8-K. Undue reliance should not be placed on the forward-looking statements in this press release, which are based upon information available to the Corporation on the date hereof. The Corporation undertakes no duty to update this information unless required by law. NON-GAAP FINANCIAL MEASURES In addition to the Corporation’s financial information presented in accordance with GAAP, management uses certain non-GAAP financial measures within the meaning of Regulation G promulgated by the SEC, to clarify and enhance understanding of past performance and prospects for the future. Please refer to pages 15-17 for a reconciliation of GAAP to non-GAAP measures and calculations. 2
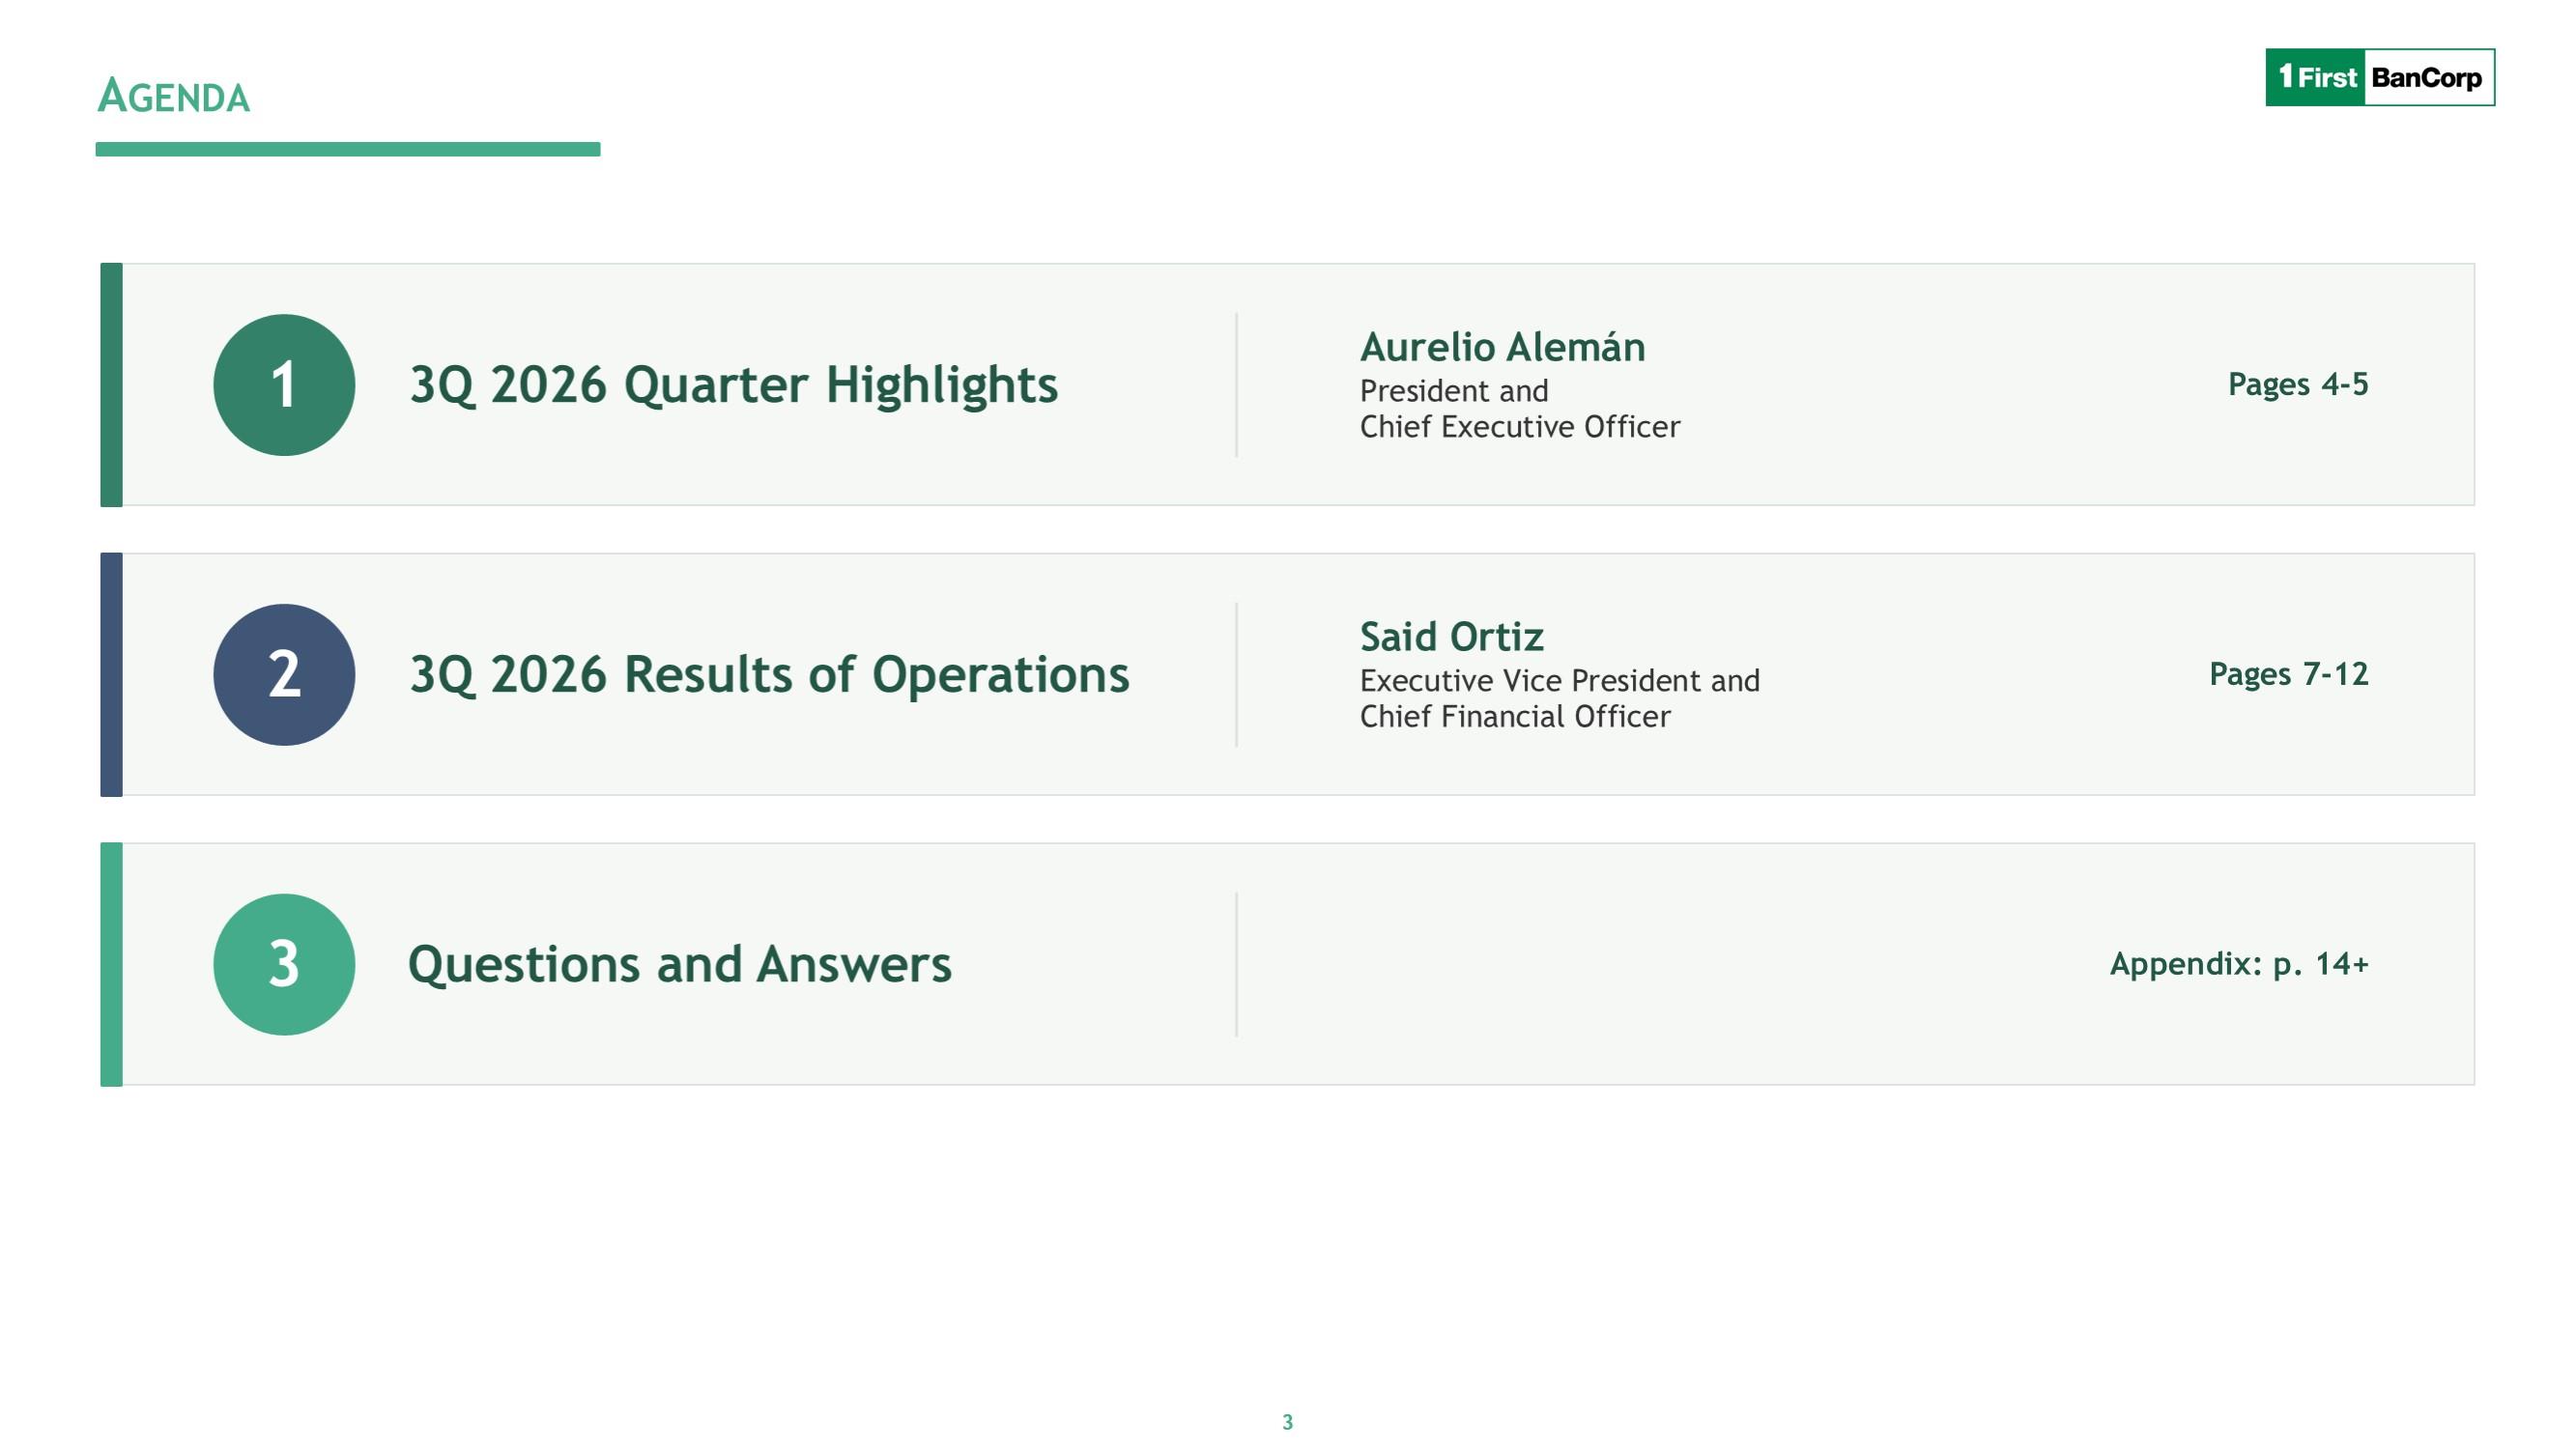
Agenda 1 3Q 2026 Quarter Highlights Aurelio Alemán President and Chief Executive Officer Pages 4-5 2 3Q 2026 Results of Operations Said Ortiz Executive Vice President and Chief Financial Officer Pages 7-12 3 Questions and Answers Appendix: p. 14+ 3
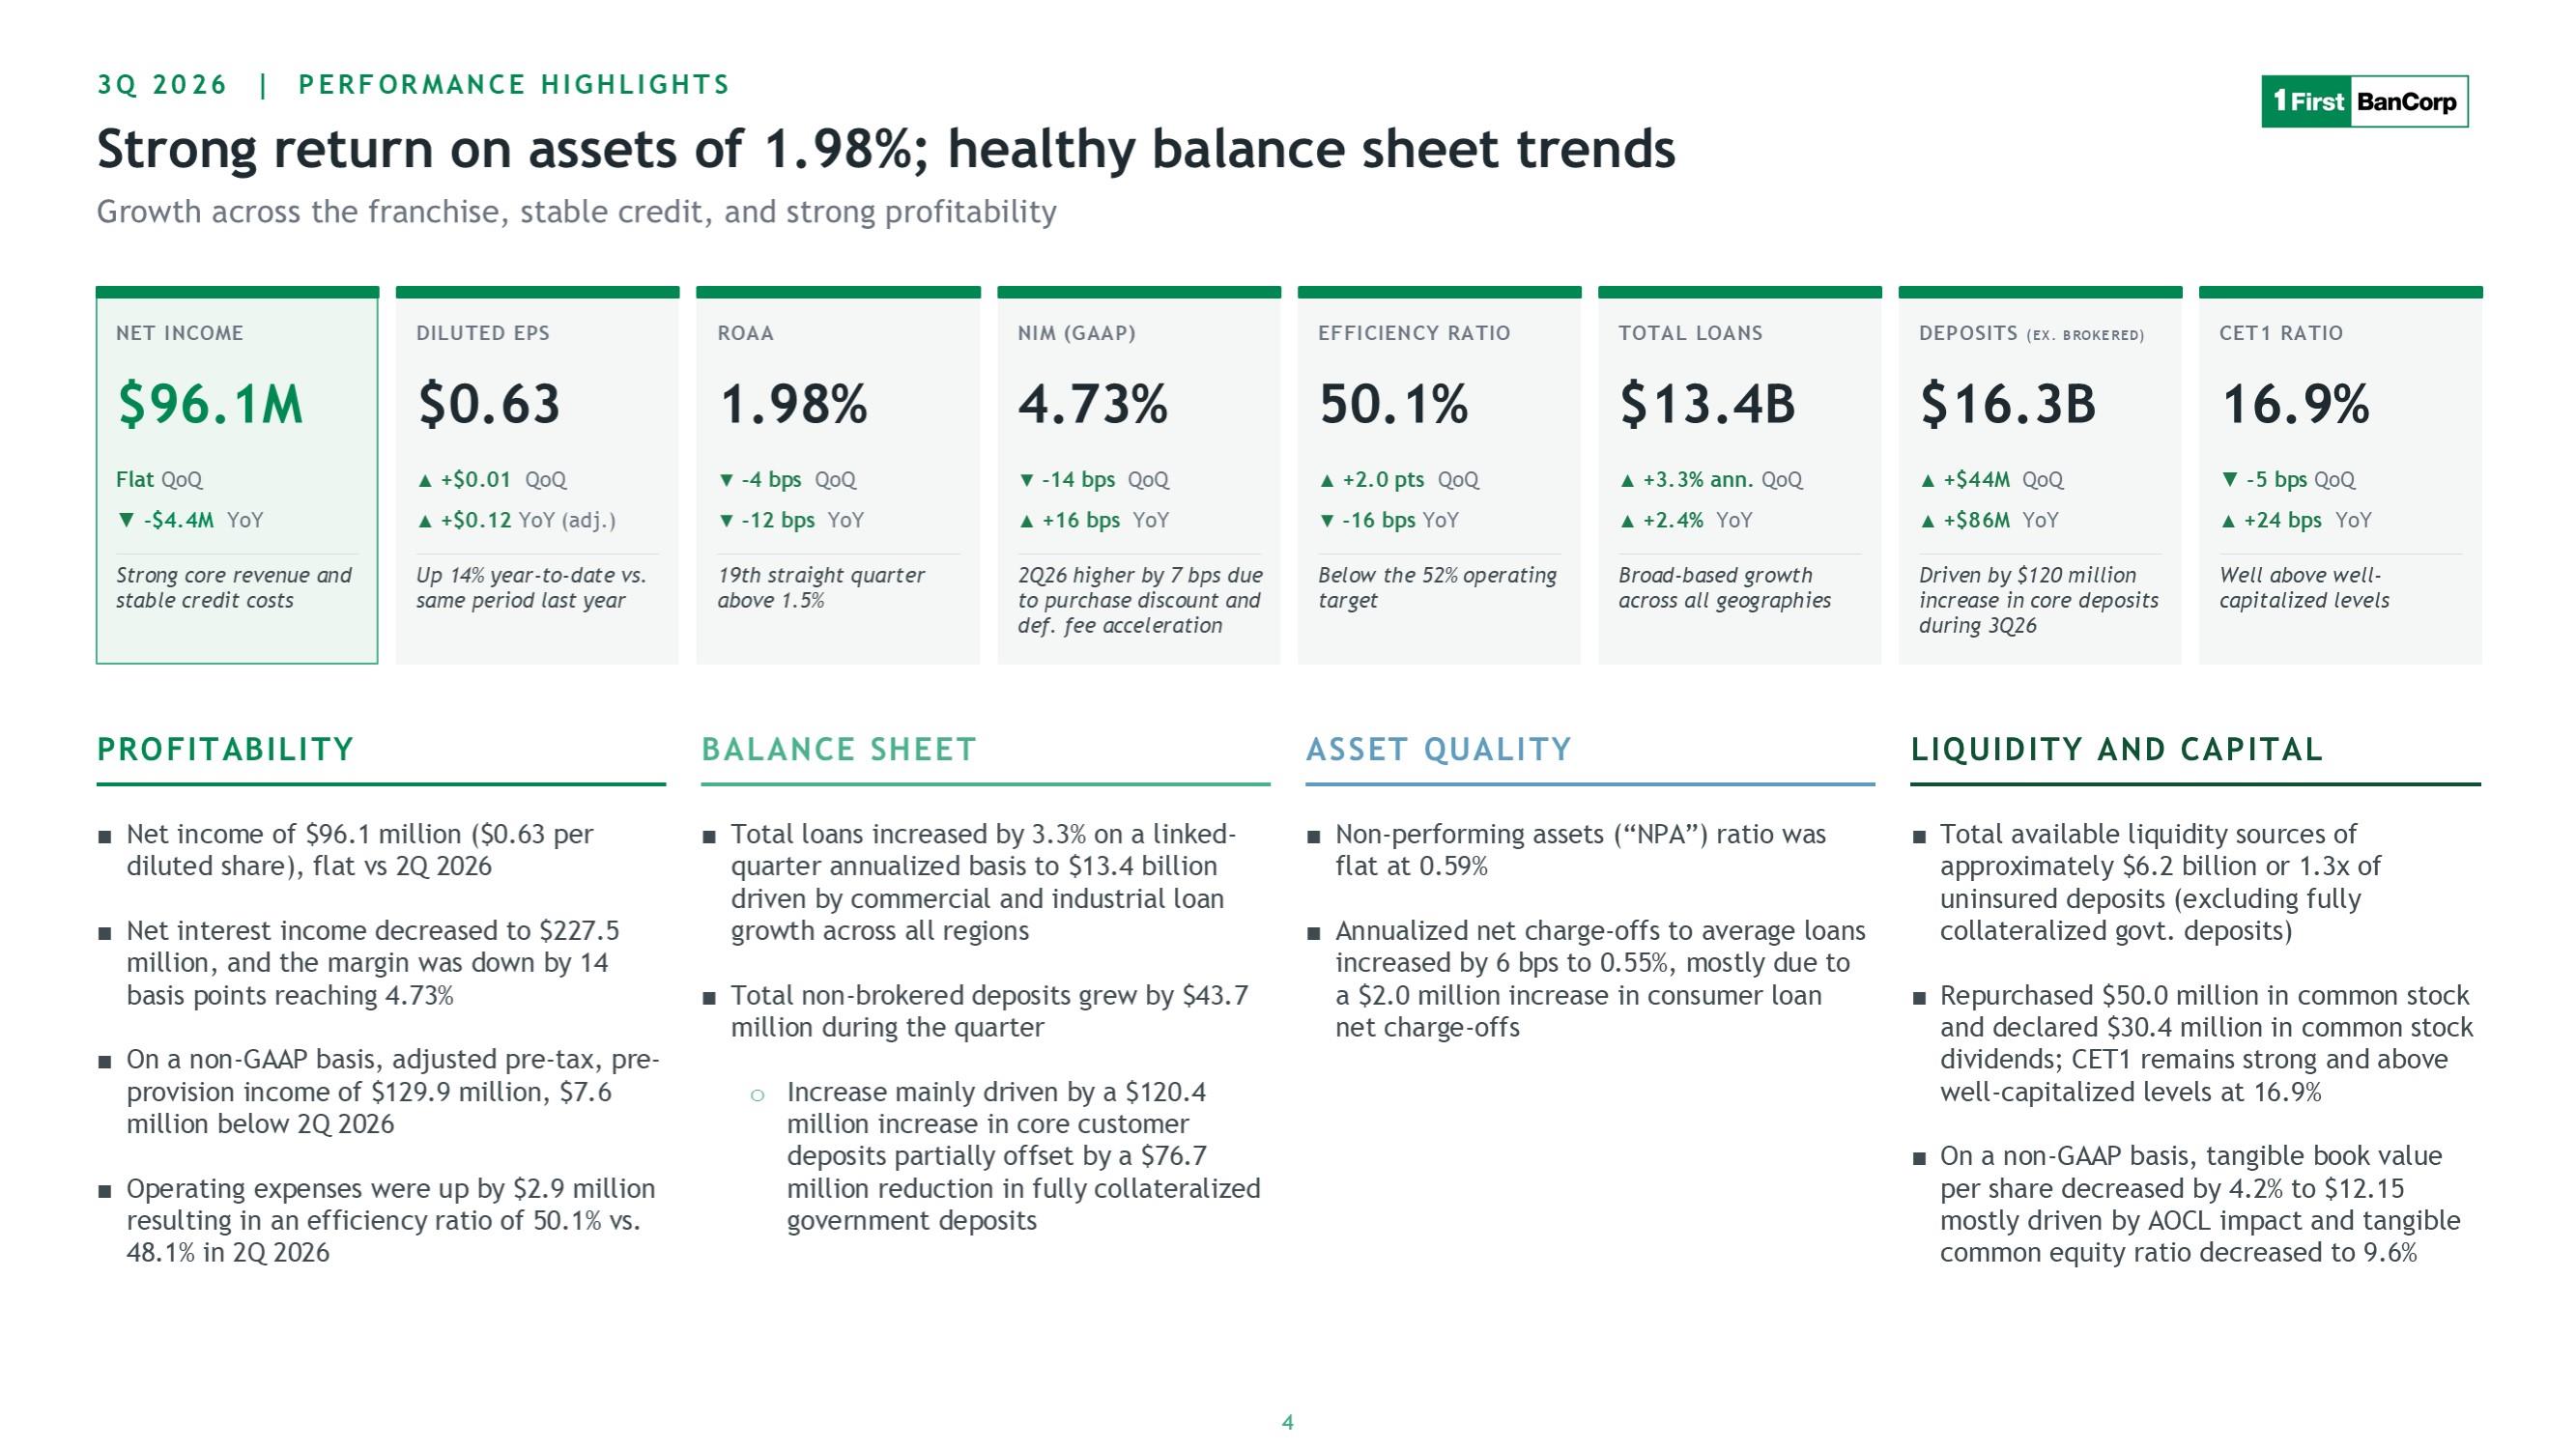
3Q 2026 | PERFORMANCE HIGHLIGHTS Strong return on assets of 1.98%; healthy balance sheet trends Growth across the franchise, stable credit, and strong profitability NET INCOME $96.1M Flat QoQ ▼ -$4.4M YoY Strong core revenue and stable credit costs DILUTED EPS $0.63 ▲ +$0.01 QoQ ▲ +$0.12 YoY (adj.) Up 14% year-to-date vs. same period last year ROAA 1.98% ▼ -4 bps QoQ ▼ -12 bps YoY 19th straight quarter above 1.5% NIM (GAAP) 4.73% ▼ -14 bps QoQ ▲ +16 bps YoY 2Q26 higher by 7 bps due to purchase discount and def. fee acceleration EFFICIENCY RATIO 50.1% ▲ +2.0 pts QoQ ▼ -16 bps YoY Below the 52% operating target TOTAL LOANS $13.4B ▲ +3.3% ann. QoQ ▲ +2.4% YoY Broad-based growth across all geographies DEPOSITS (EX. BROKERED) $16.3B ▲ +$44M QoQ ▲ +$86M YoY Driven by $120 million increase in core deposits during 3Q26 CET1 RATIO 16.9% ▼ -5 bps QoQ ▲ +24 bps YoY Well above well-capitalized levels PROFITABILITY Net income of $96.1 million ($0.63 per diluted share), flat vs 2Q 2026 Net interest income decreased to $227.5 million, and the margin was down by 14 basis points reaching 4.73% On a non-GAAP basis, adjusted pre-tax, pre-provision income of $129.9 million, $7.6 million below 2Q 2026 Operating expenses were up by $2.9 million resulting in an efficiency ratio of 50.1% vs. 48.1% in 2Q 2026 BALANCE SHEET Total loans increased by 3.3% on a linked-quarter annualized basis to $13.4 billion driven by commercial and industrial loan growth across all regions Total non-brokered deposits grew by $43.7 million during the quarter Increase mainly driven by a $120.4 million increase in core customer deposits partially offset by a $76.7 million
reduction in fully collateralized government deposits ASSET QUALITY Non-performing assets (“NPA”) ratio was flat at 0.59% Annualized net charge-offs to average loans increased by 6 bps to 0.55%, mostly due to a $2.0 million increase in consumer loan net charge-offs LIQUIDITY AND CAPITAL Total available liquidity sources of approximately $6.2 billion or 1.3x of uninsured deposits (excluding fully collateralized govt. deposits) Repurchased $50.0 million in common stock and declared $30.4 million in common stock dividends; CET1 remains strong and above well-capitalized levels at 16.9% On a non-GAAP basis, tangible book value per share decreased by 4.2% to $12.15 mostly driven by AOCL impact and tangible common equity ratio decreased to 9.6% 3Q 2026 | PERFORMANCE HIGHLIGHTS Strong return on assets of 1.98%; healthy balance sheet trends 4
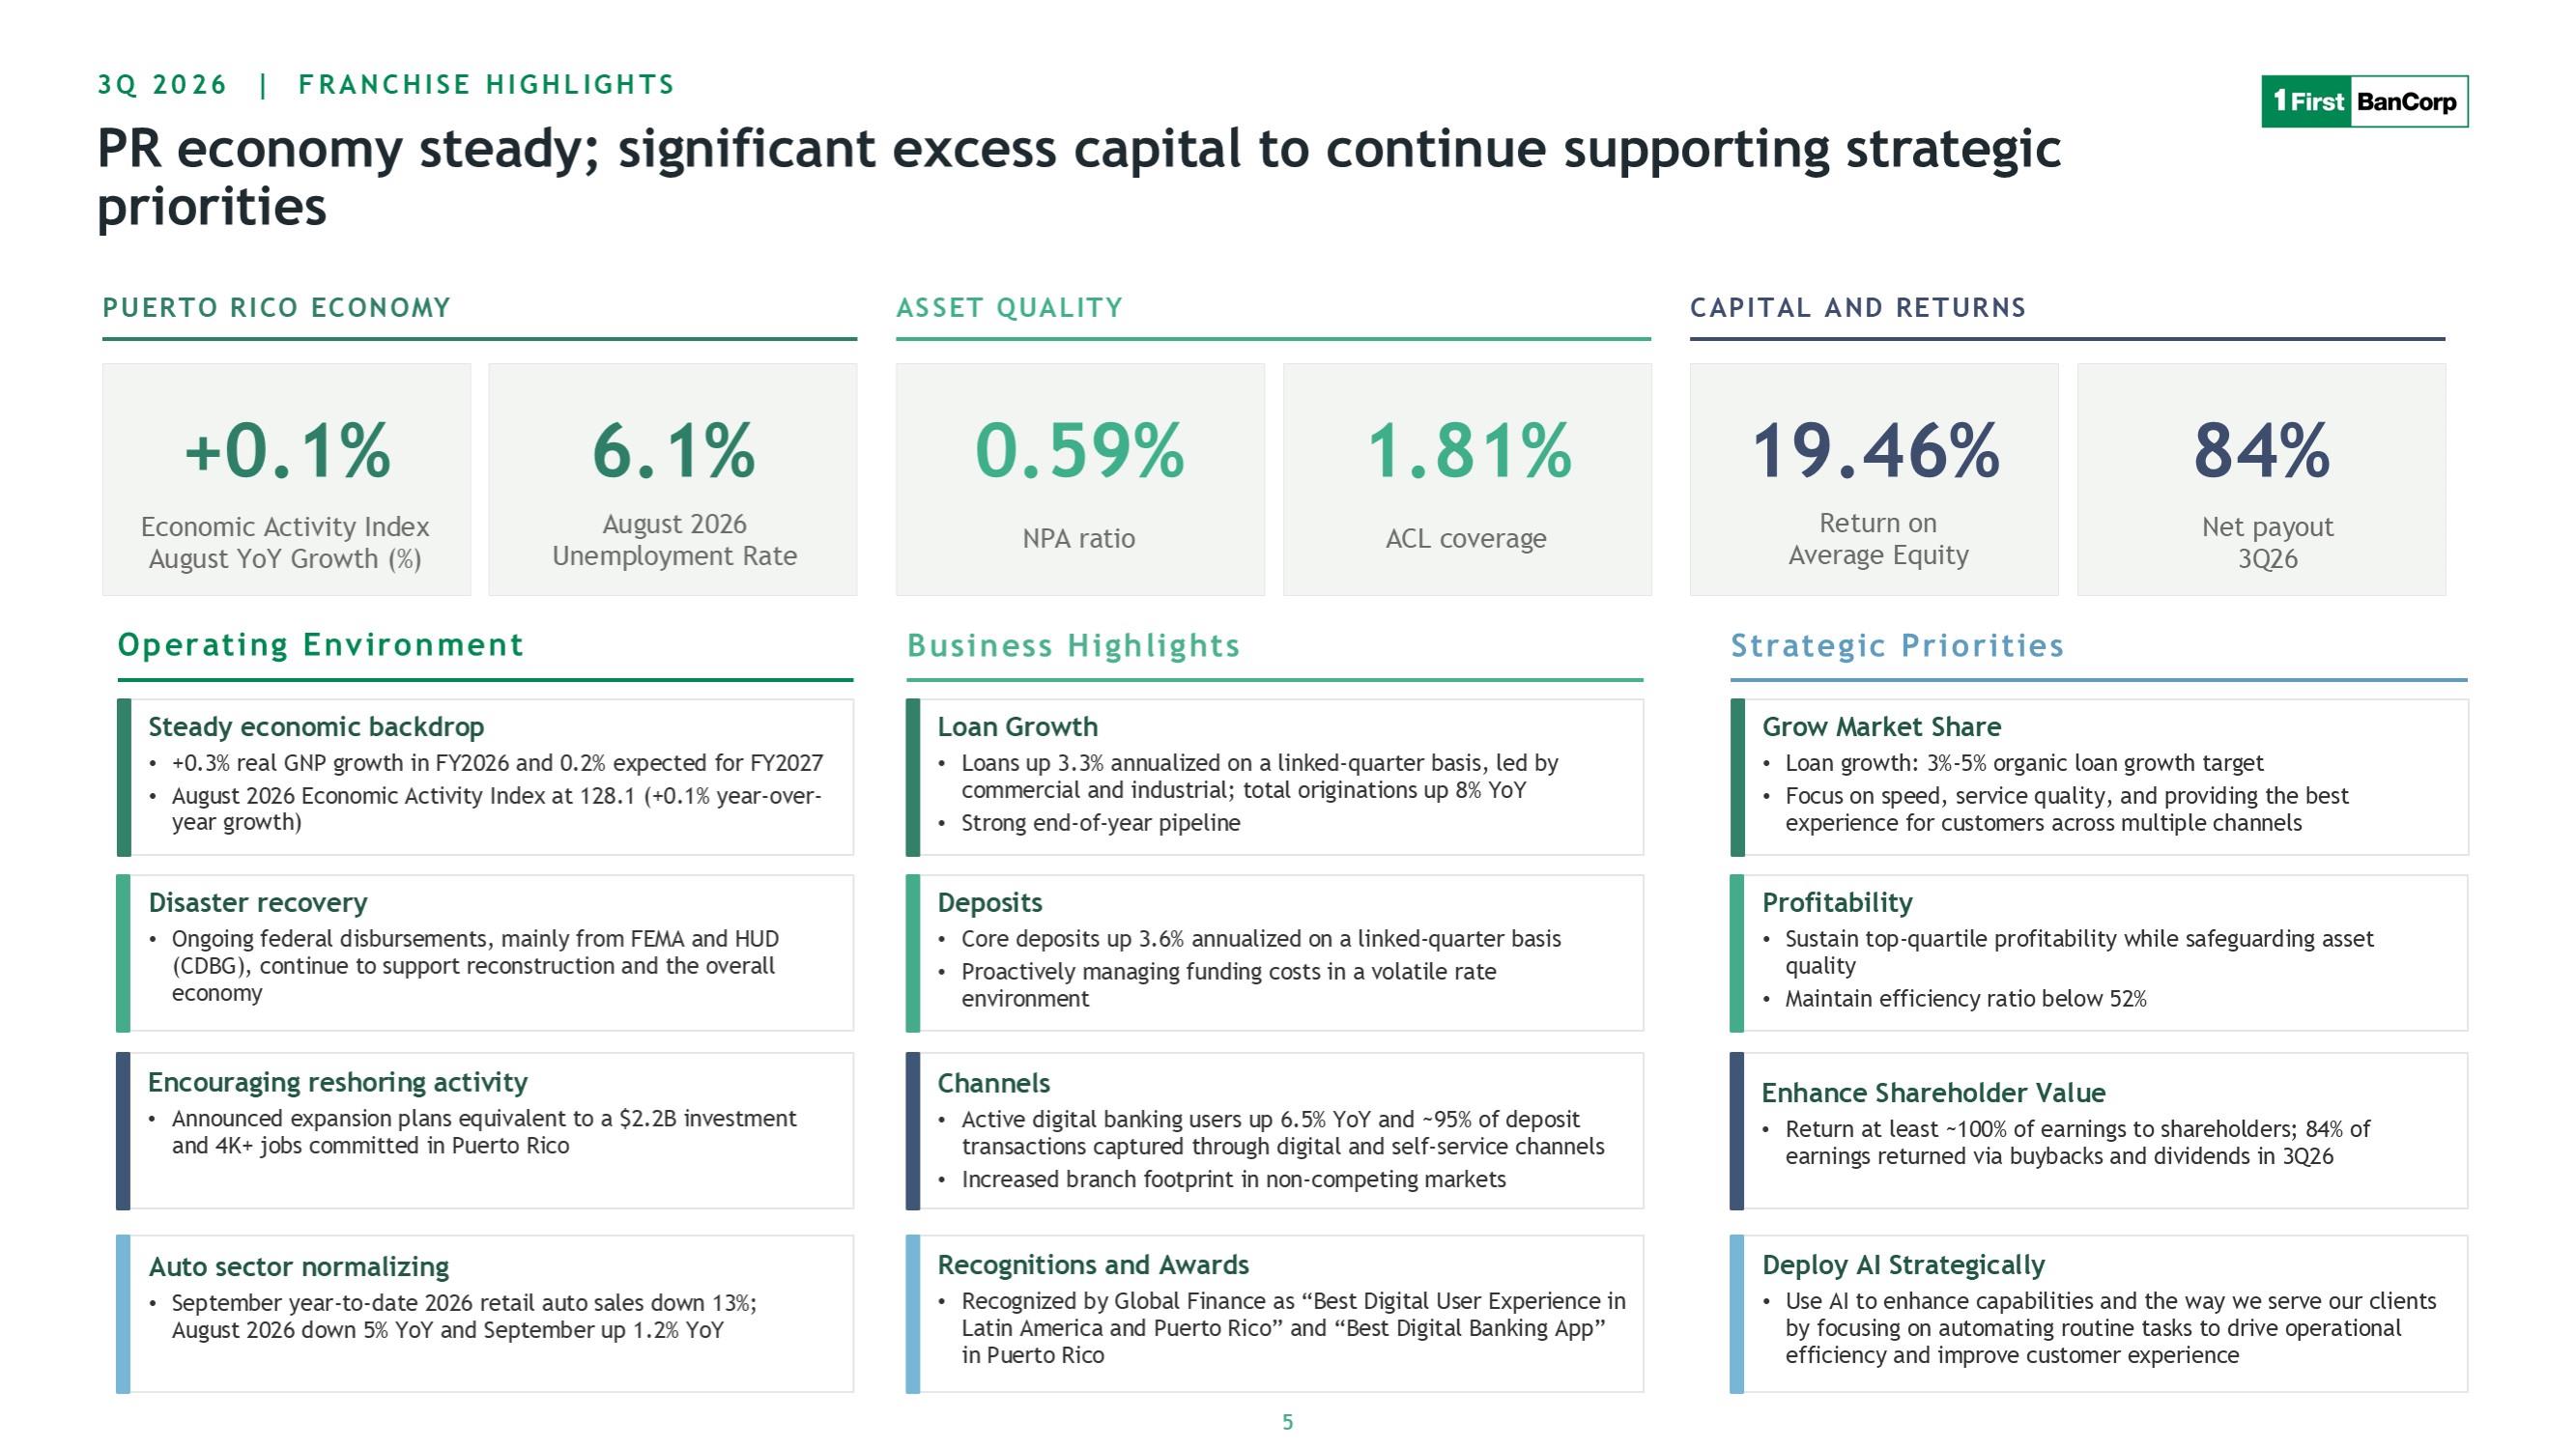
3Q 2026 | FRANCHISE HIGHLIGHTS PR economy steady; significant excess capital to continue supporting strategic priorities PUERTO RICO ECONOMY +0.1% Economic Activity Index August YoY Growth (%) 6.1% August 2026 Unemployment Rate ASSET QUALITY 0.59% NPA ratio 1.81% ACL coverage CAPITAL AND RETURNS 19.46% Return on Average Equity 84% Net payout 3Q26 Operating Environment Steady economic backdrop +0.3% real GNP growth in FY2026 and 0.2% expected for FY2027 August 2026 Economic Activity Index at 128.1 (+0.1% year-over-year growth) Disaster recovery Ongoing federal disbursements, mainly from FEMA and HUD (CDBG), continue to support reconstruction and the overall economy Encouraging reshoring activity Announced expansion plans equivalent to a $2.2B investment and 4K+ jobs committed in Puerto Rico Auto sector normalizing September year-to-date 2026 retail auto sales down 13%; August 2026 down 5% YoY and September up 1.2% YoY Business Highlights Loan Growth Loans up 3.3% annualized on a linked-quarter basis, led by commercial and industrial; total originations up 8% YoY Strong end-of-year pipeline Deposits Core deposits up 3.6% annualized on a linked-quarter basis Proactively managing funding costs in a volatile rate environment Channels Active digital banking users up 6.5% YoY and ~95% of deposit transactions captured through digital and self-service channels Increased branch footprint in non-competing markets Recognitions and Awards Recognized by Global Finance as “Best Digital User Experience in Latin America and Puerto Rico” and “Best Digital Banking App” in Puerto Rico Strategic Priorities Grow Market Share Loan growth: 3%-5% organic loan
growth target Focus on speed, service quality, and providing the best experience for customers across multiple channels Profitability Sustain top-quartile profitability while safeguarding asset quality Maintain efficiency ratio below 52% Enhance Shareholder Value Return at least ~100% of earnings to shareholders; 84% of earnings returned via buybacks and dividends in 3Q26 Deploy AI Strategically Use AI to enhance capabilities and the way we serve our clients by focusing on automating routine tasks to drive operational efficiency and improve customer experience 5
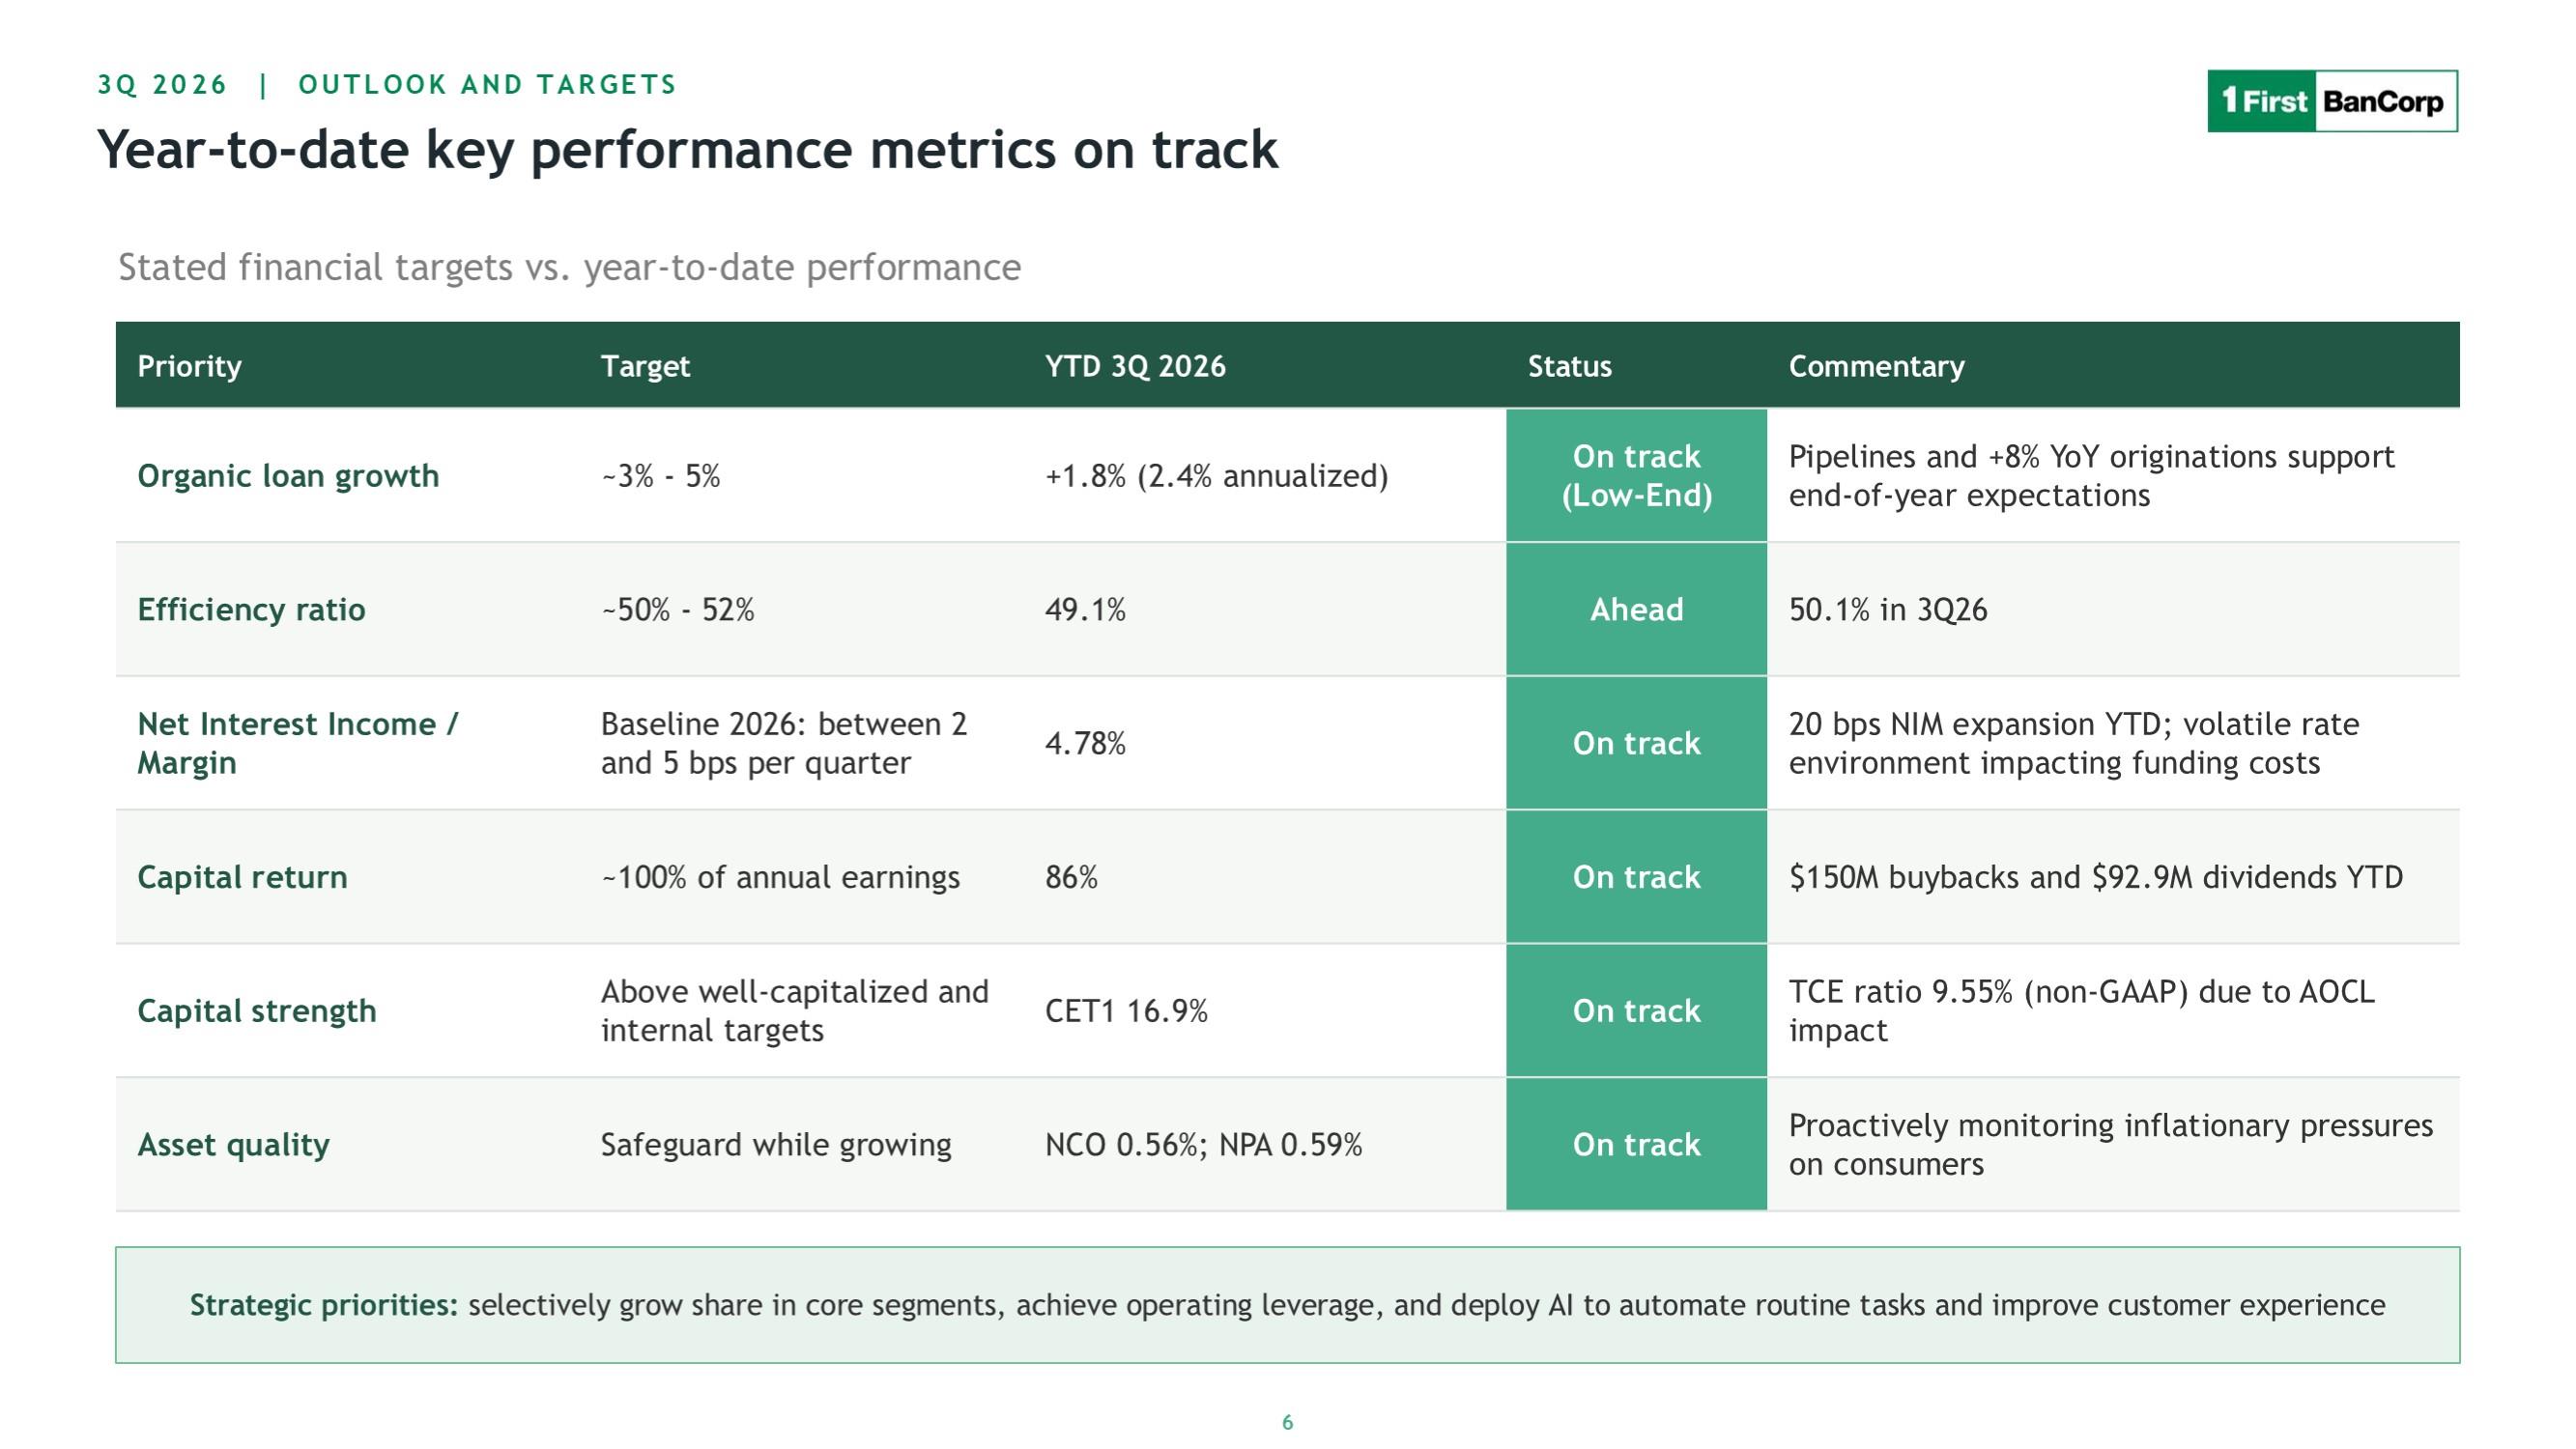
3Q 2026 | OUTLOOK AND TARGETS Year-to-date key performance metrics on track Stated financial targets vs. year-to-date performance Priority Target YTD 3Q 2026 Status Comment Organic loan growth ~3% - 5% +1.8% (2.4% annualized) On track (Low-End) Pipelines and +8% YoY originations support end-of-year expectations Efficiency ratio ~50% - 52% 49.1% Ahead 50.1% in 3Q26 Net Interest Income / Margin Baseline 2026: ~4.80% 4.78% On track 20 bps NIM expansion YTD; volatile rate environment impacting funding costs Capital return ~100% of annual earnings 86% On track $150M buybacks and $92.9M dividends YTD Capital strength Above well-capitalized and internal targets CET1 16.9% On track TCE ratio 9.55% (non-GAAP) due to AOCL impact Asset quality Safeguard while growing NCO 0.55%; NPA 0.59% On track Proactively monitoring inflationary pressures on consumers Strategic priorities: selectively grow share in core segments, achieve operating leverage, and deploy AI to automate routine tasks and improve customer experience 6

Results of Operations
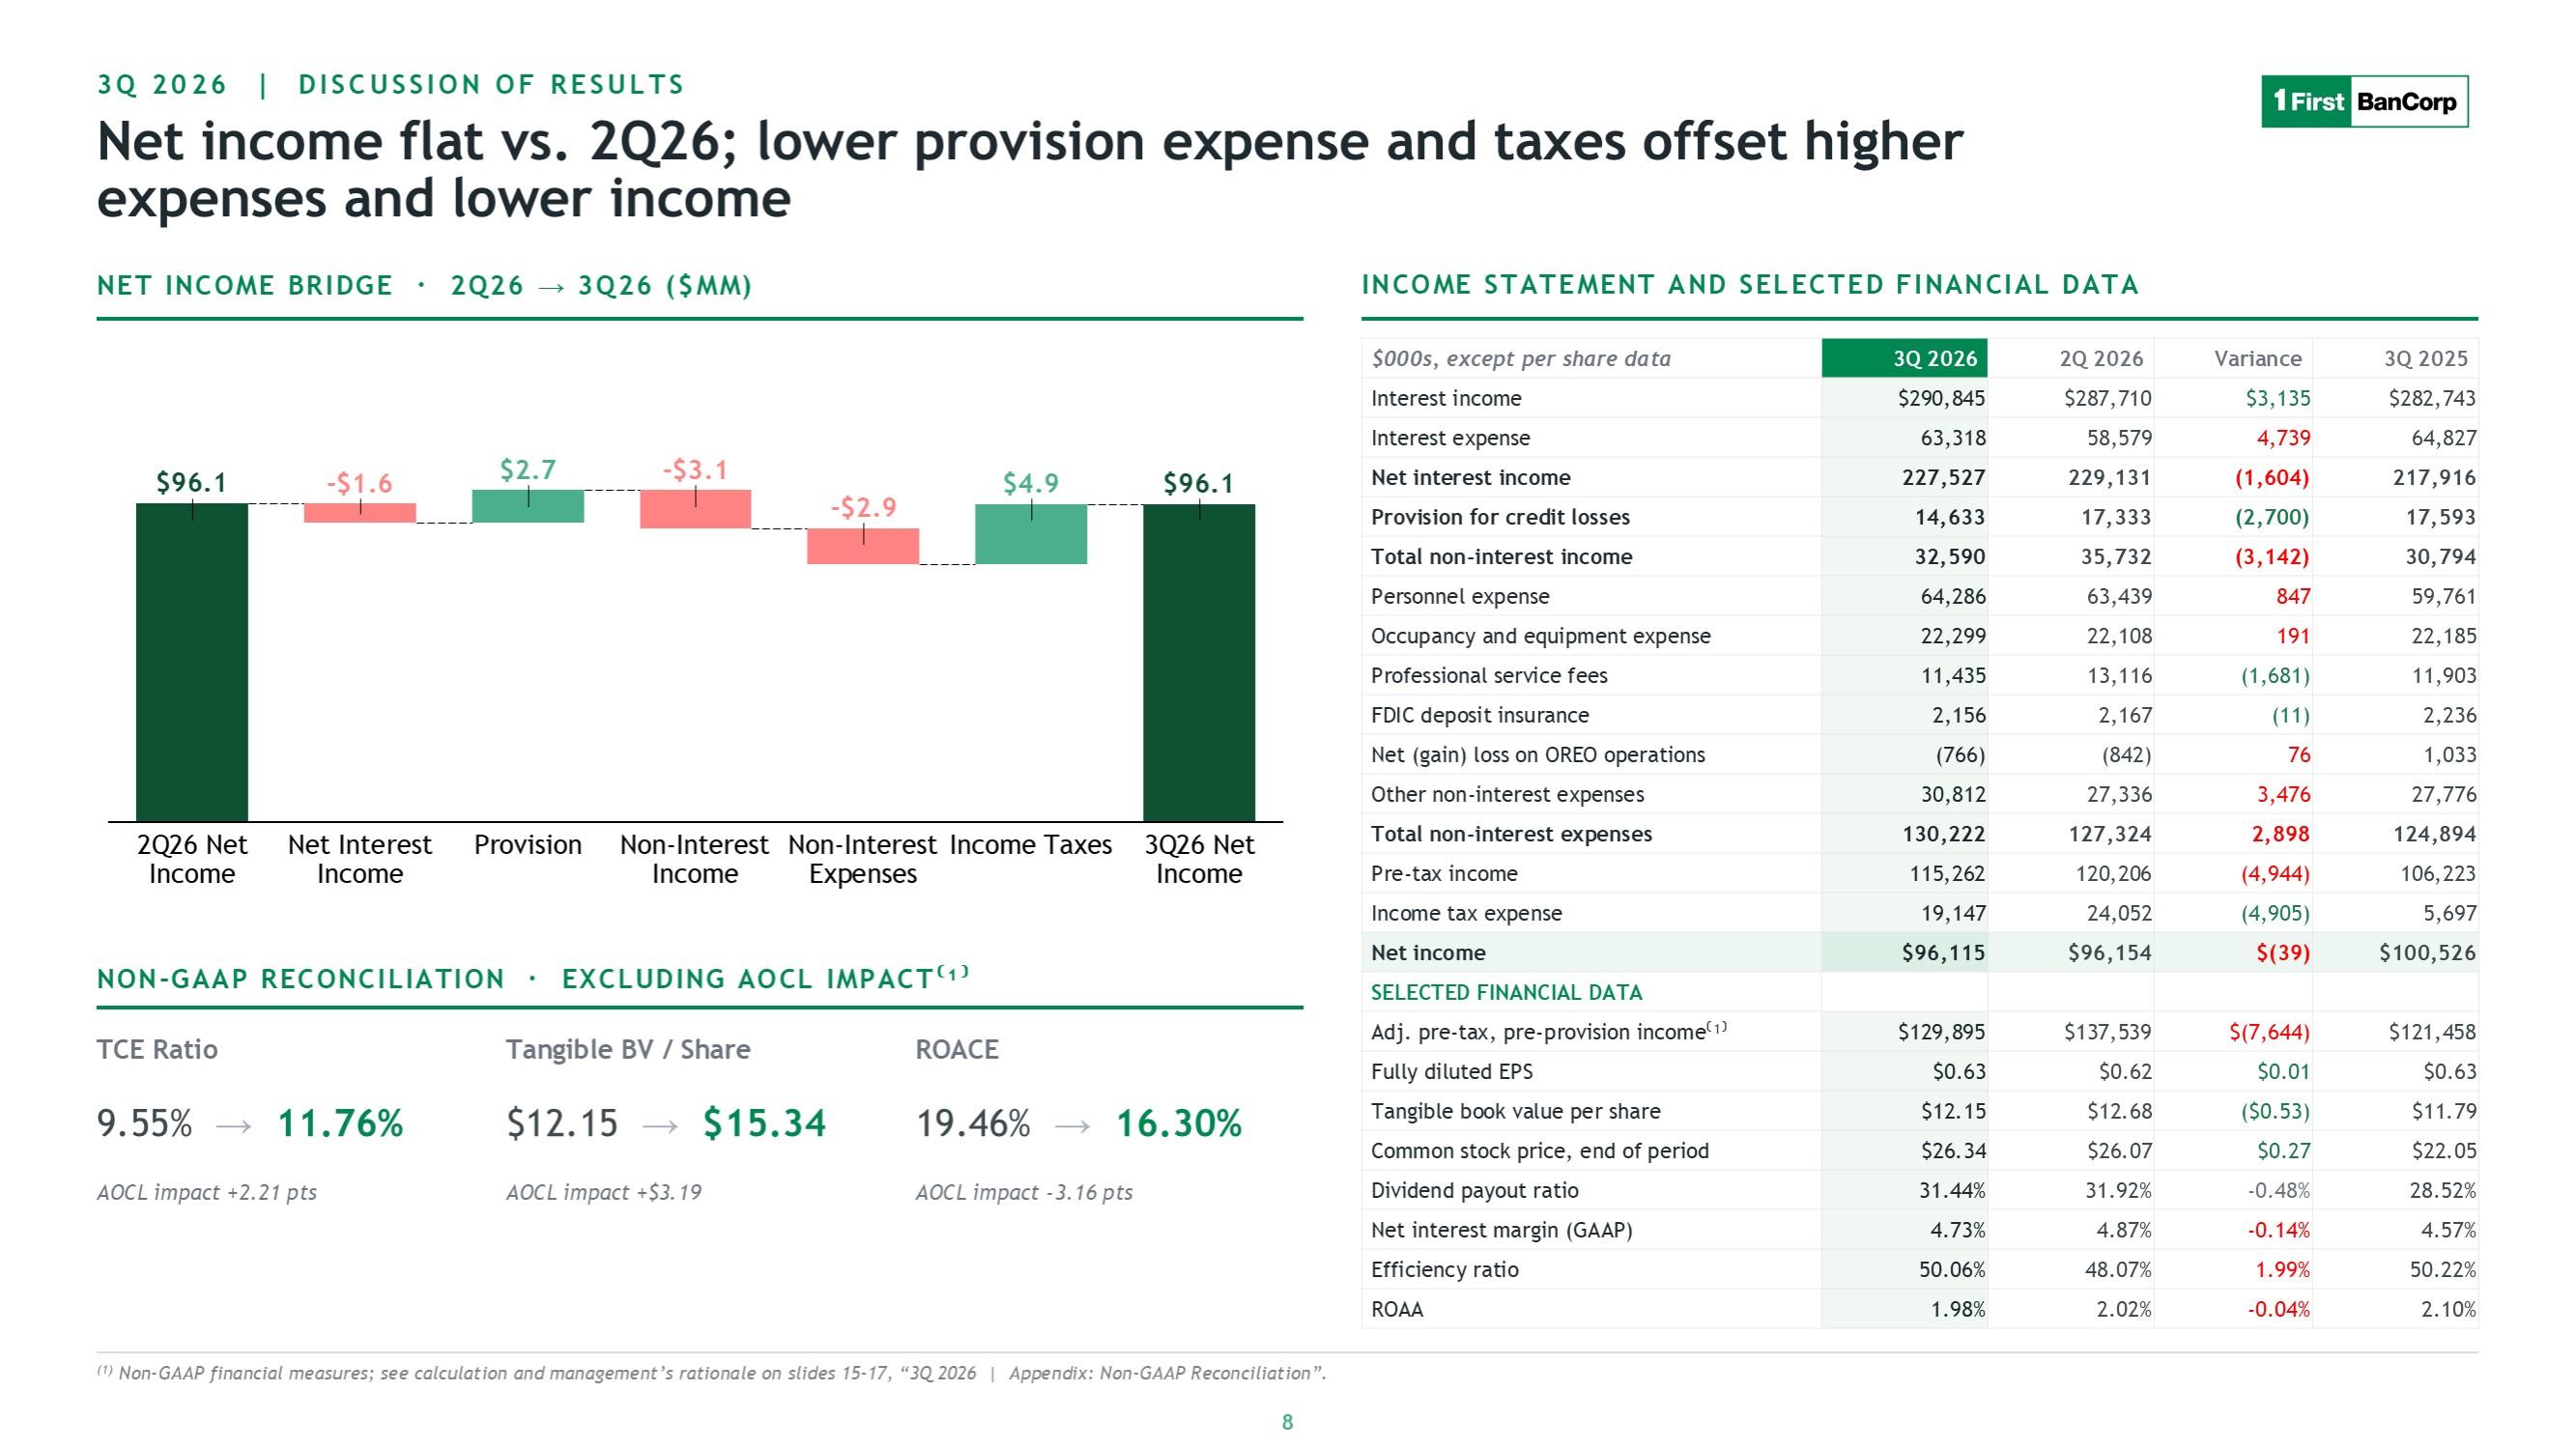
3Q 2026 | DISCUSSION OF RESULTS Net income flat vs. 2Q26; lower provision expense and taxes offset higher expenses and lower income NET INCOME BRIDGE · 2Q26 → 3Q26 ($MM) $96.1 -$1.6 $2.7 -$3.1 -$2.9 $4.9 $96.1 2Q26 Net Income Net Interest Income Provision Non-Interest Income Non-Interest Expnese Inocme Taxes 3Q26 Net Income NON-GAAP RECONCILIATION · EXCLUDING AOCL IMPACT⁽¹⁾ TCE Ratio Tangible BV / Shares ROACE 9.55% - 11.76% $12.15 - $15.34 19.46% - 16.30% AOCL Impact +21.21 pts AOCL impact +$3.19 AOCL impact -3.16 pts INCOME STATEMENT AND SELECTED FINANCIAL DATA $000s, except per share data 3Q 2026 2Q 2026 Variance 3Q 2025 Interest income $290,845 $287,710 3,135 $282,743 Interest expense 63,318 58,579 4,739 64,827 Net interest income 227,527 229,131 (1,604) 217,916 Provision for credit losses 14,633 17,333 (2,700) 17,593 Total non-interest income 32,590 35,732 (3,142) 30,794 Personnel expense 64,286 63,439 847 59,761 Occupancy and equipment expense 22,299 22,108 191 22,185 Professional service fees 11,435 13,116 (1,681) 11,903 FDIC deposit insurance 2,156 2,167 (11) 2,236 Net (gain) loss on OREO operations (766) (842) 76 1,033 Other non-interest expenses 30,812 27,336 3,476 27,776 Total non-interest expenses 130,222 127,324 2,898 124,894 Pre-tax income 115,262 120,206 (4,944) 106,223 Income tax expense 19,147 24,052 (4,905) 5,697 Net income $96,115 $96,154 $(39) $100,526 SELECTED FINANCIAL DATA Adj. pre-tax, pre-provision income⁽¹⁾ $129,895 $137,539 $(7,644) $121,458 Fully diluted EPS $0.63 $0.62 $0.01 $0.63 Tangible book value per share $12.15 $12.68 ($0.53) $11.79 Common stock price, end of period $26.34
$26.07 $0.27 $22.05 Dividend payout ratio 31.44% 31.92% -0.48% 28.52% Net interest margin (GAAP) 4.73% 4.87% -0.14% 4.57% Efficiency ratio 50.06% 48.07% 1.99% 50.22% ROAA 1.98% 2.02% -0.04% 2.10% Non-GAAP financial measures; see calculation and management’ s rationale on 8
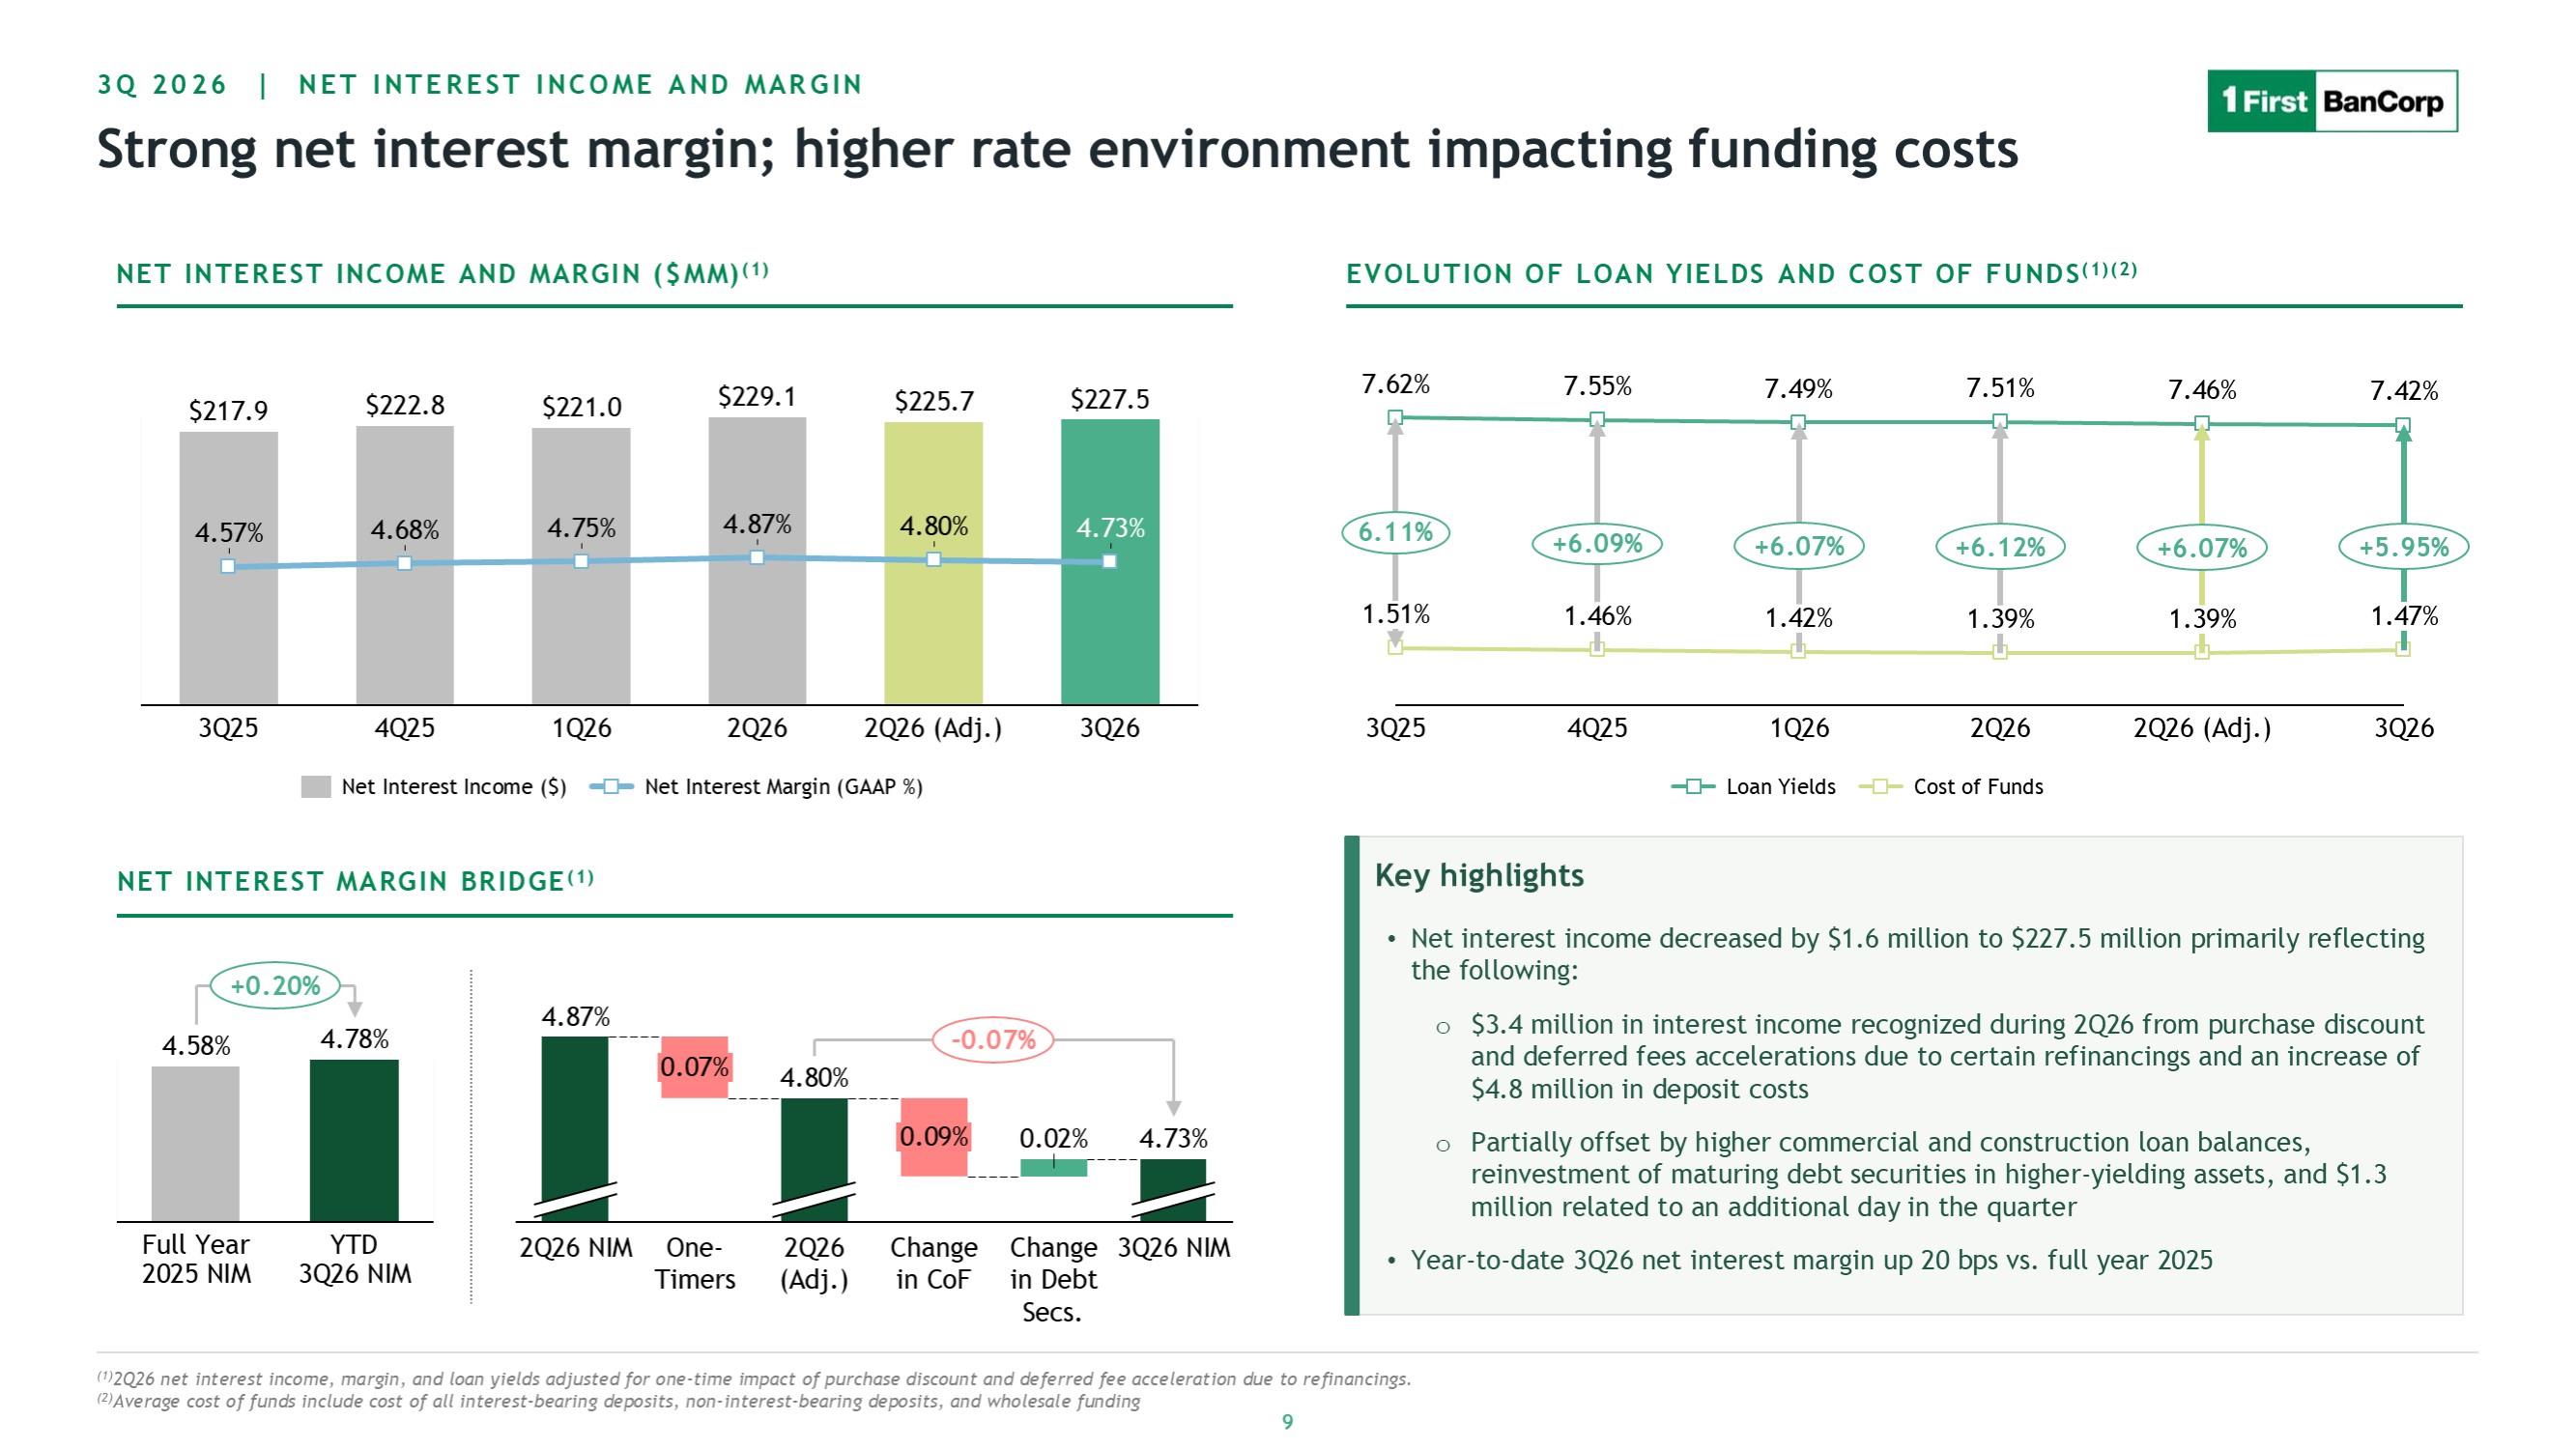
3Q 2026 | NET INTEREST INCOME AND MARGIN Strong net interest margin; higher rate environment impacting funding costs NET INTEREST INCOME AND MARGIN ($MM)(1) $217.9 $222.8 $221.0 $229.1 $225.7 $227.5 4.57% 4.68% 4.75% 4.87% 4.80% 4.73% 3Q25 4Q25 1Q26 2Q26 2Q26 (Adj.) 3Q26 Net interest income ($) Net Interest Margin (GAAP %) EVOLUTION OF LOAN YIELDS AND COST OF FUNDS(1)(2) 7.62% 7.55% 7.49% 7.51% 7.46% 7.42% 6.11% 6.09% 6.07% 6.12% 6.07% 5.95% 1.51% 1.46% 1.42% 1.39% 1.39% 1.47% 3Q25 4Q25 1Q26 2Q26 2Q26 (Adj.) 3Q26 Loan Yields Cost of Fu nds NET INTEREST MARGIN BRIDGE 0.20% 4.58% 4.78% 0.07% 4.80% -0.07% 0.09% 0.02% 4.73% "Full Year 2025 NIM" "YTD 3Q26 NIM" 21Q26 NIM "One- Timer" "2Q26 (Adj.)" "Change in CoF" "Change in Debt Secs." 3Q26 NIM Key highlights Net interest income decreased by $1.6 million to $227.5 million primarily reflecting the following: $3.4 million in interest income recognized during 2Q26 from purchase discount and deferred fees accelerations due to certain refinancings and an increase of $4.8 million in deposit costs Partially offset by higher commercial and construction loan balances, reinvestment of maturing debt securities in higher-yielding assets, and $1.3 million related to an additional day in the quarter Year -to-date 3Q26 net interest margin up 20 bps vs. full year 2025 (1)2Q26 net interest income, margin, and loan yields adjusted for one-time impact of purchase discount and deferred fee acceleration due to refinancings. (2)Average cost of funds include cost of all interest-bearing deposits, non-interest-bearing deposits, and wholesale funding 9
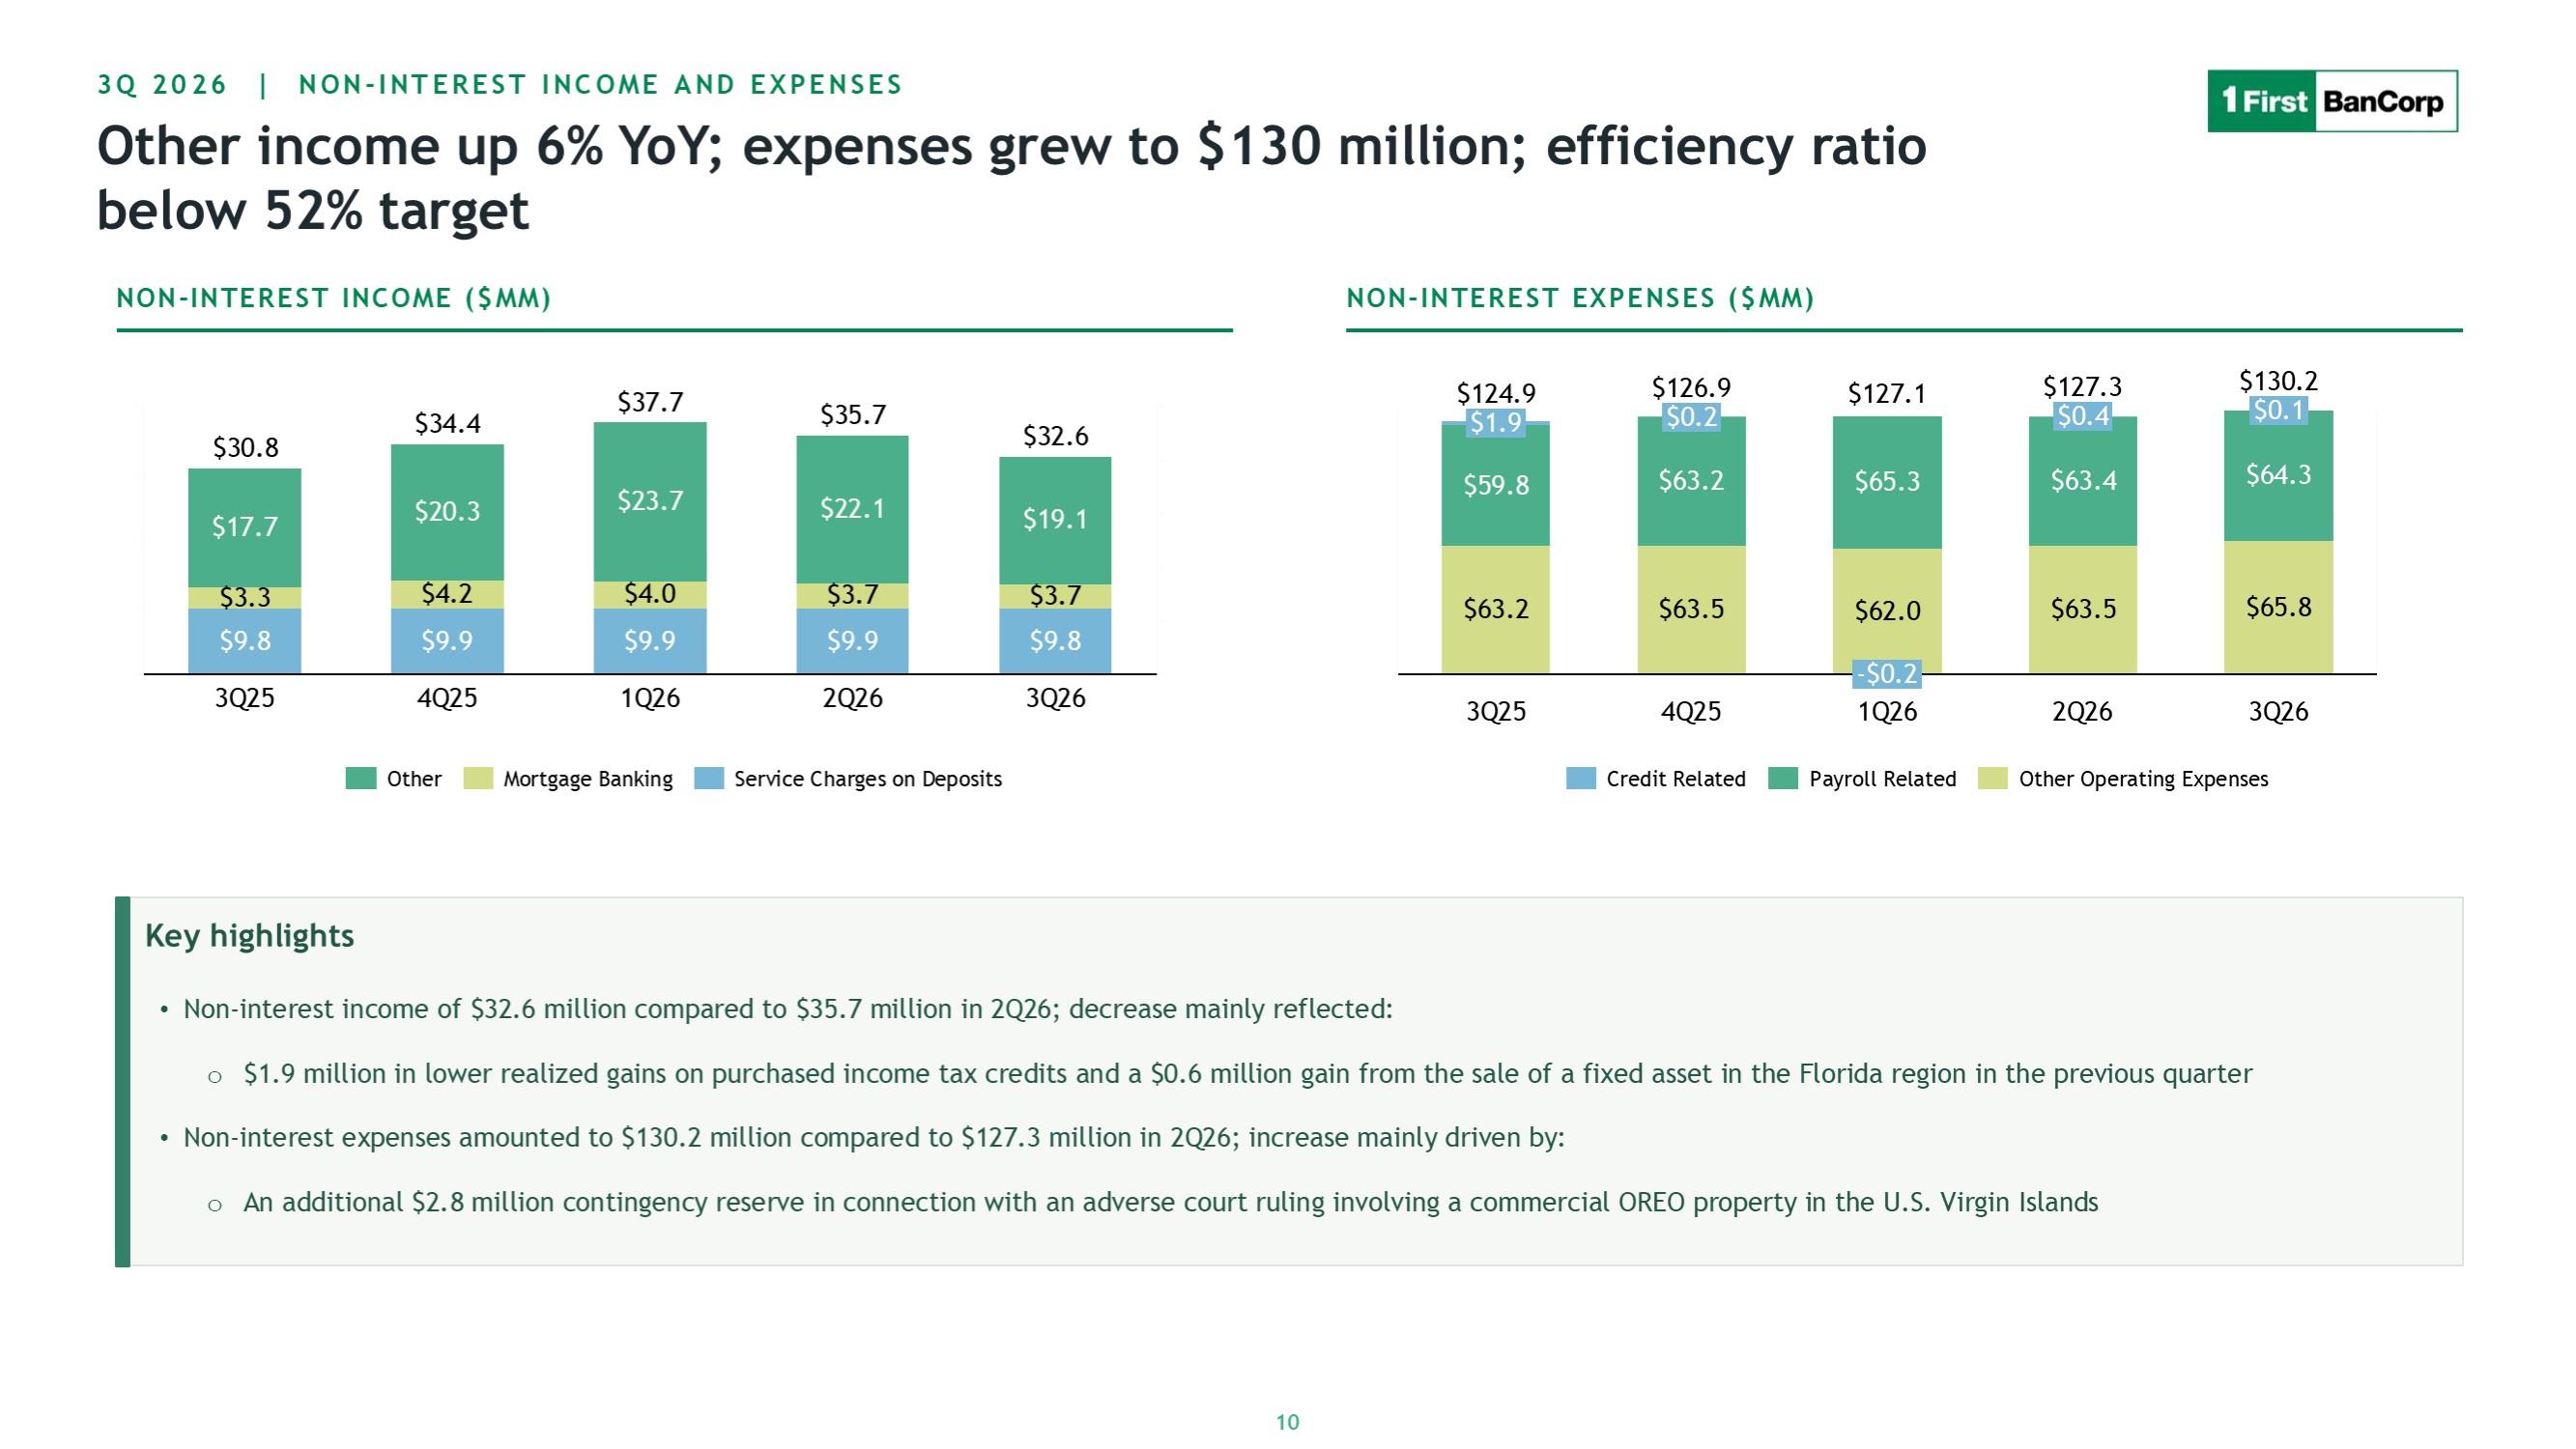
3Q 2026 | NON-INTEREST INCOME AND EXPENSES Other income up 6% YoY; expenses grew to $130 million; efficiency ratio below 52% target NON-INTEREST INCOME ($MM) $30.8 $34.4 $37.7 $35.7 $32.6 $17.7 $20.3 $23.7 $22.1 $19.1 $3.3 $4.2 $4.0 $3.7 $3.7 $9.8 $9.9 $9.9 $9.9 $9.8 3Q25 4Q25 1Q26 2Q26 3Q26 Other Mortgage Banking Service Charges on Deposits NON-INTEREST EXPENSES ($MM) $124.9 $126.9 $127.1 $127.3 $130.2 $1.9 $0.2 -$0.2 $0.4 $0.1 $59.8 $63.2 $65.3 $63.4 $64.3 $63.2 $63.5 $62.0 $63.5 $65.8 3Q25 4Q25 1Q26 2Q26 3Q26 Credit Related Payroll Related Other Operating Expneses Key highlights Non-interest income of $32.6 million compared to $35.7 million in 2Q26; decrease mainly reflected: $1.9 million in lower realized gains on purchased income tax credits and a $0.6 million gain from the sale of a fixed asset in the Florida region in the previous quarter Non-interest expenses amounted to $130.2 million compared to $127.3 million in 2Q26; increase mainly driven by: An additional $2.8 million contingency reserve for interest and penalties associated with escrowed rent in connection with an adverse ruling involving a commercial OREO property in the U.S. Virgin Islands 10
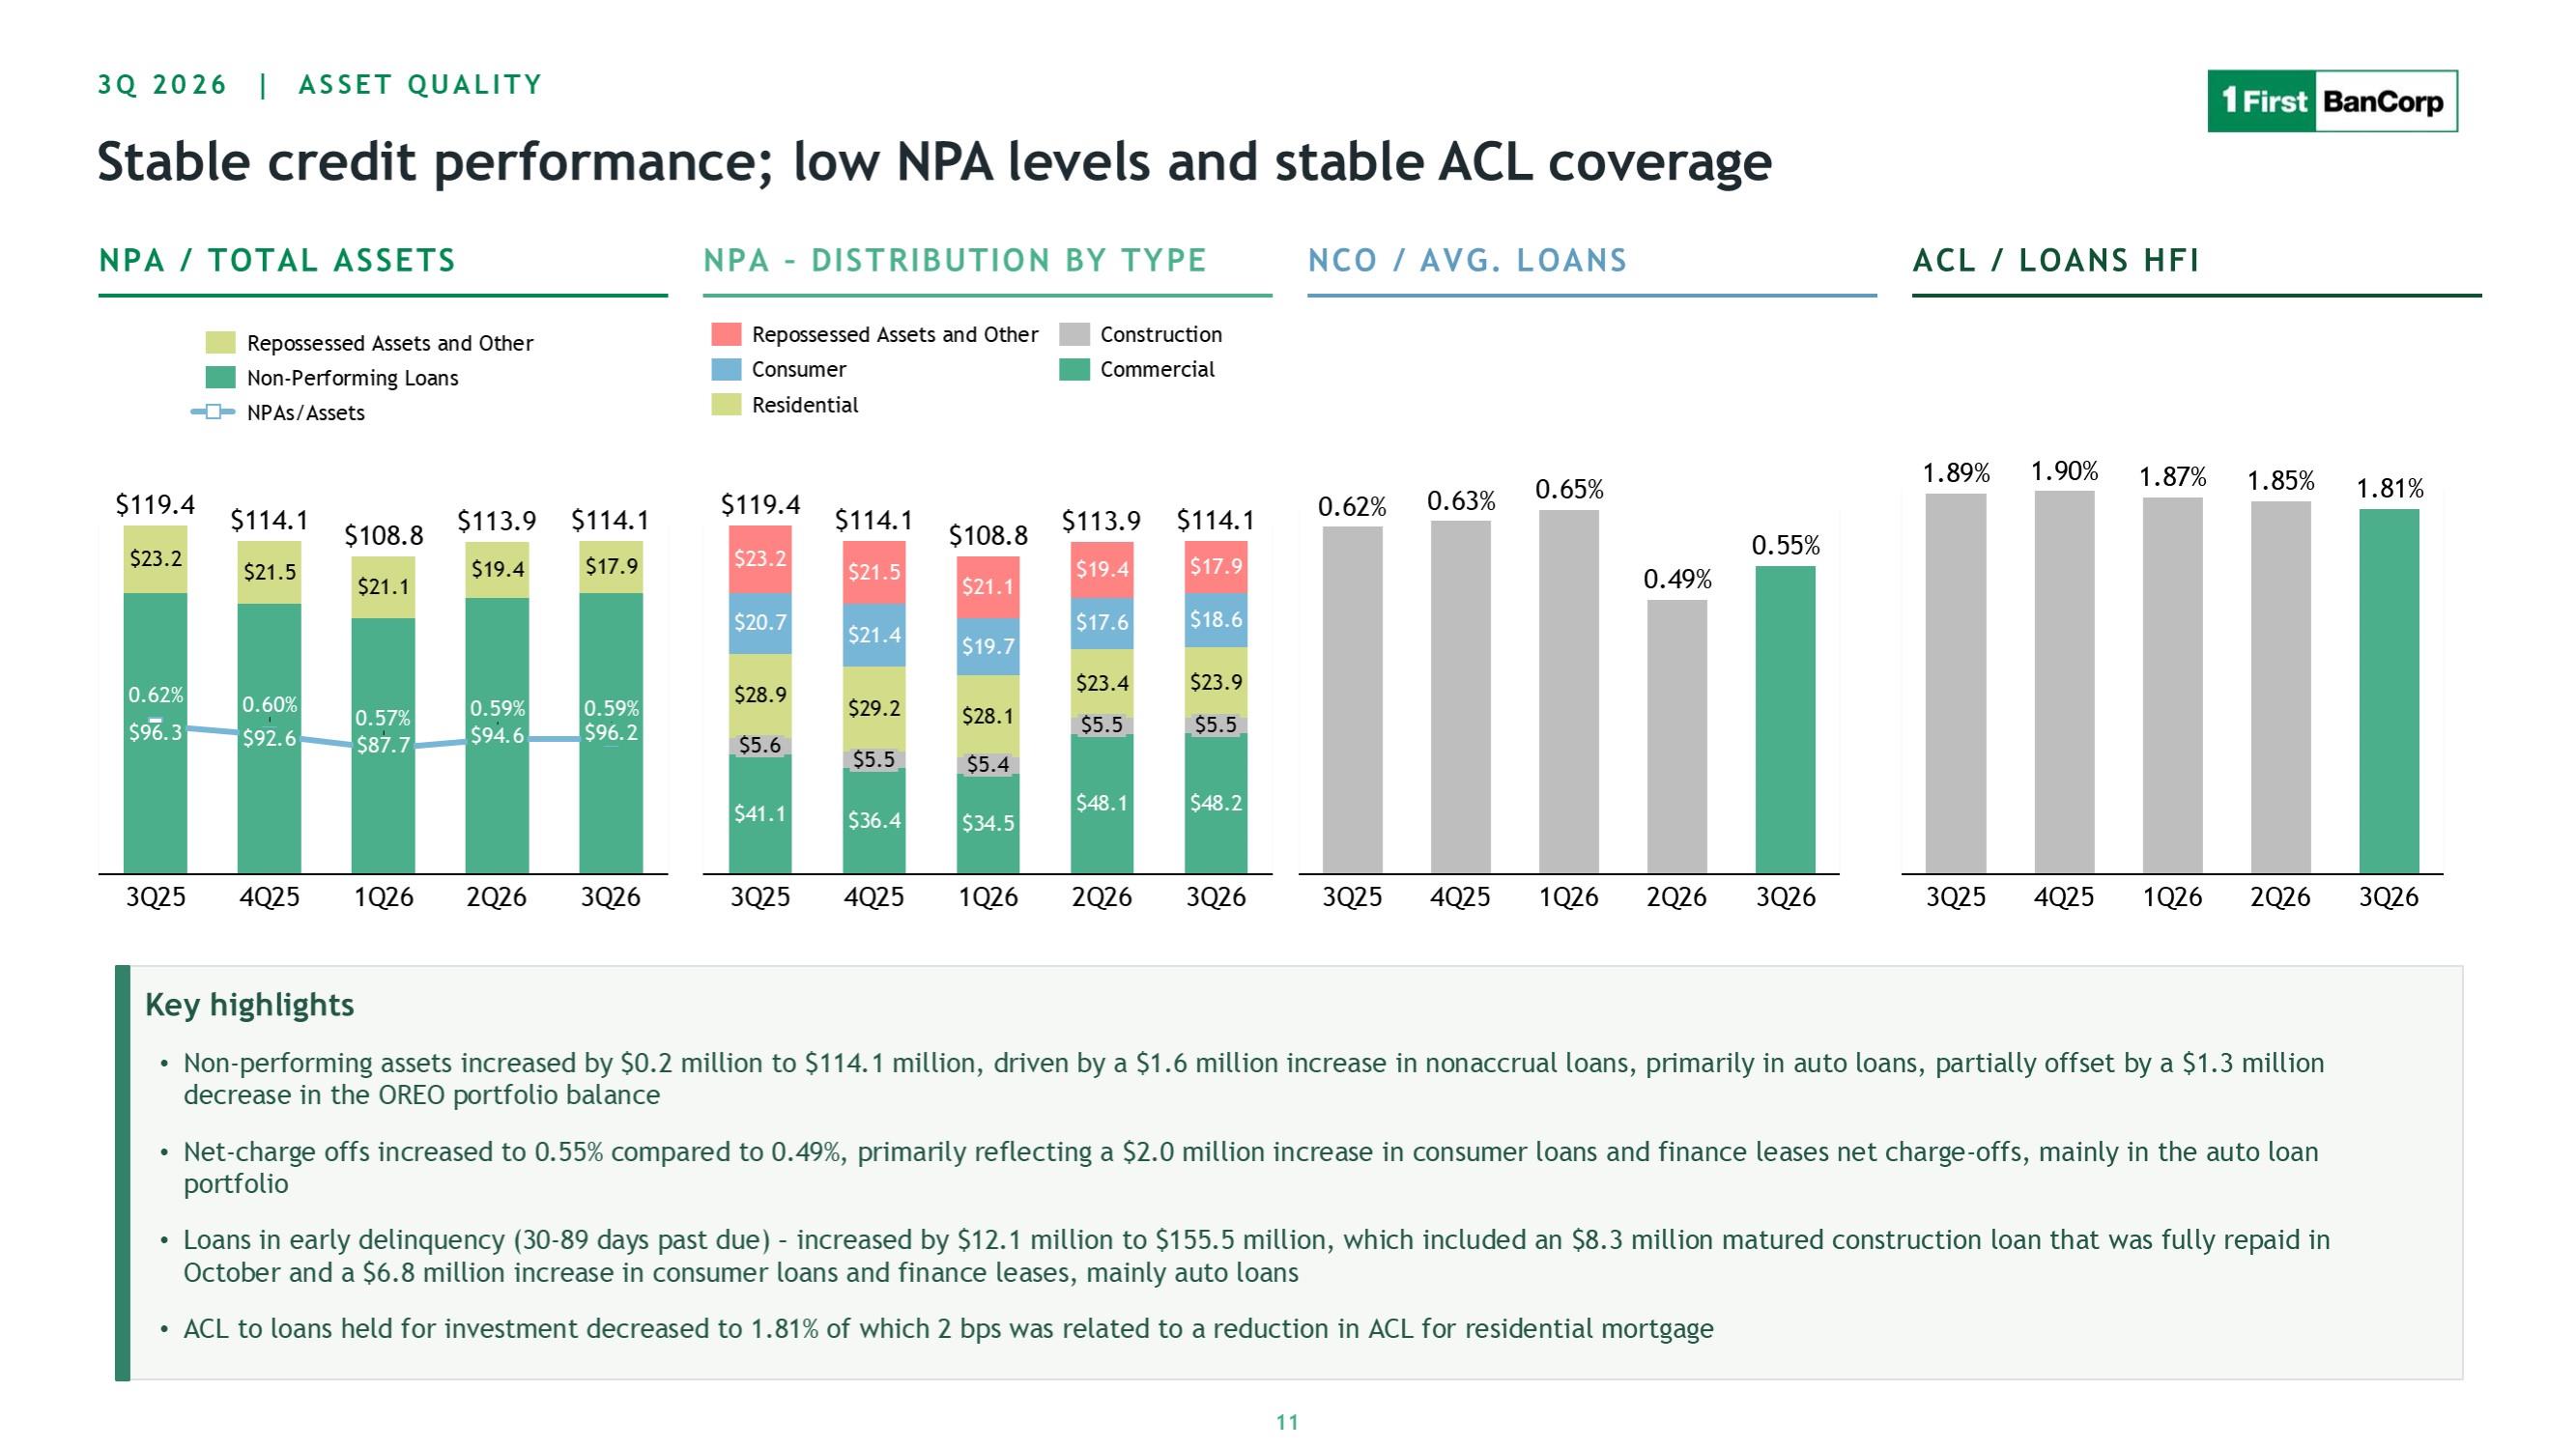
3Q 2026 | ASSET QUALITY Stable credit performance; low NPA levels and stable ACL coverage NPA / TOTAL ASSETS Repossessed Assets and Other Non-Performing Loans NPAs/Assets $119.4 $114.1 $108.8 $113.9 $114.1 $23.2 $21.5 $21.1 $19.4 $17.9 0.62% 0.60% 0.57% 0.59% 0.59% $96.3 $92.6 $87.7 $94.6 $96.2 3Q25 4Q25 1Q26 2Q26 3Q26 NPA – DISTRIBUTION BY TYPE Repossessed Assets and Other Consumer Residential Construction Commercial $119.4 $114.1 $108.8 $113.9 $114.1 $23.2 $21.5 $21.1 $19.4 $17.9 $20.7 $21.4 $19.7 $17.6 $18.6 $28.9 $29.2 $28.1 $23.4 $23.9 $5.6 $5.5 $5.4 $5.5 $5.5 $41.1 $36.4 $34.5 $48.1 $48.2 3Q25 4Q25 1Q26 2Q26 3Q26 NCO / AVG. LOANS 0.62% 0.63% 65.00% 49.00% 55.00% 3Q25 4Q25 1Q26 2Q26 3Q26 ACL / LOANS HFI 1.89% 1.90% 1.87% 1.85% 1.81% 3Q25 4Q25 1Q26 2Q26 3Q26 Key highlights Non-performing assets increased by $0.2 million to $114.1 million, driven by a $1.6 million increase in nonaccrual loans, primarily in auto loans, partially offset by a $1.3 million decrease in the OREO portfolio balance Net-charge offs increased to 0.55% compared to 0.49%, primarily reflecting a $2.0 million increase in consumer loans and finance leases net charge-offs, mainly in the auto loan portfolio Loans in early delinquency (30-89 days past due) – increased by $12.1 million to $155.5 million, which included an $8.3 million matured construction loan that was fully repaid in October and a $6.8 million increase in consumer loans and finance leases, mainly auto loans ACL to loans held for investment decreased to 1.81% of which 2 bps was related to a reduction in ACL for residential mortgage 11
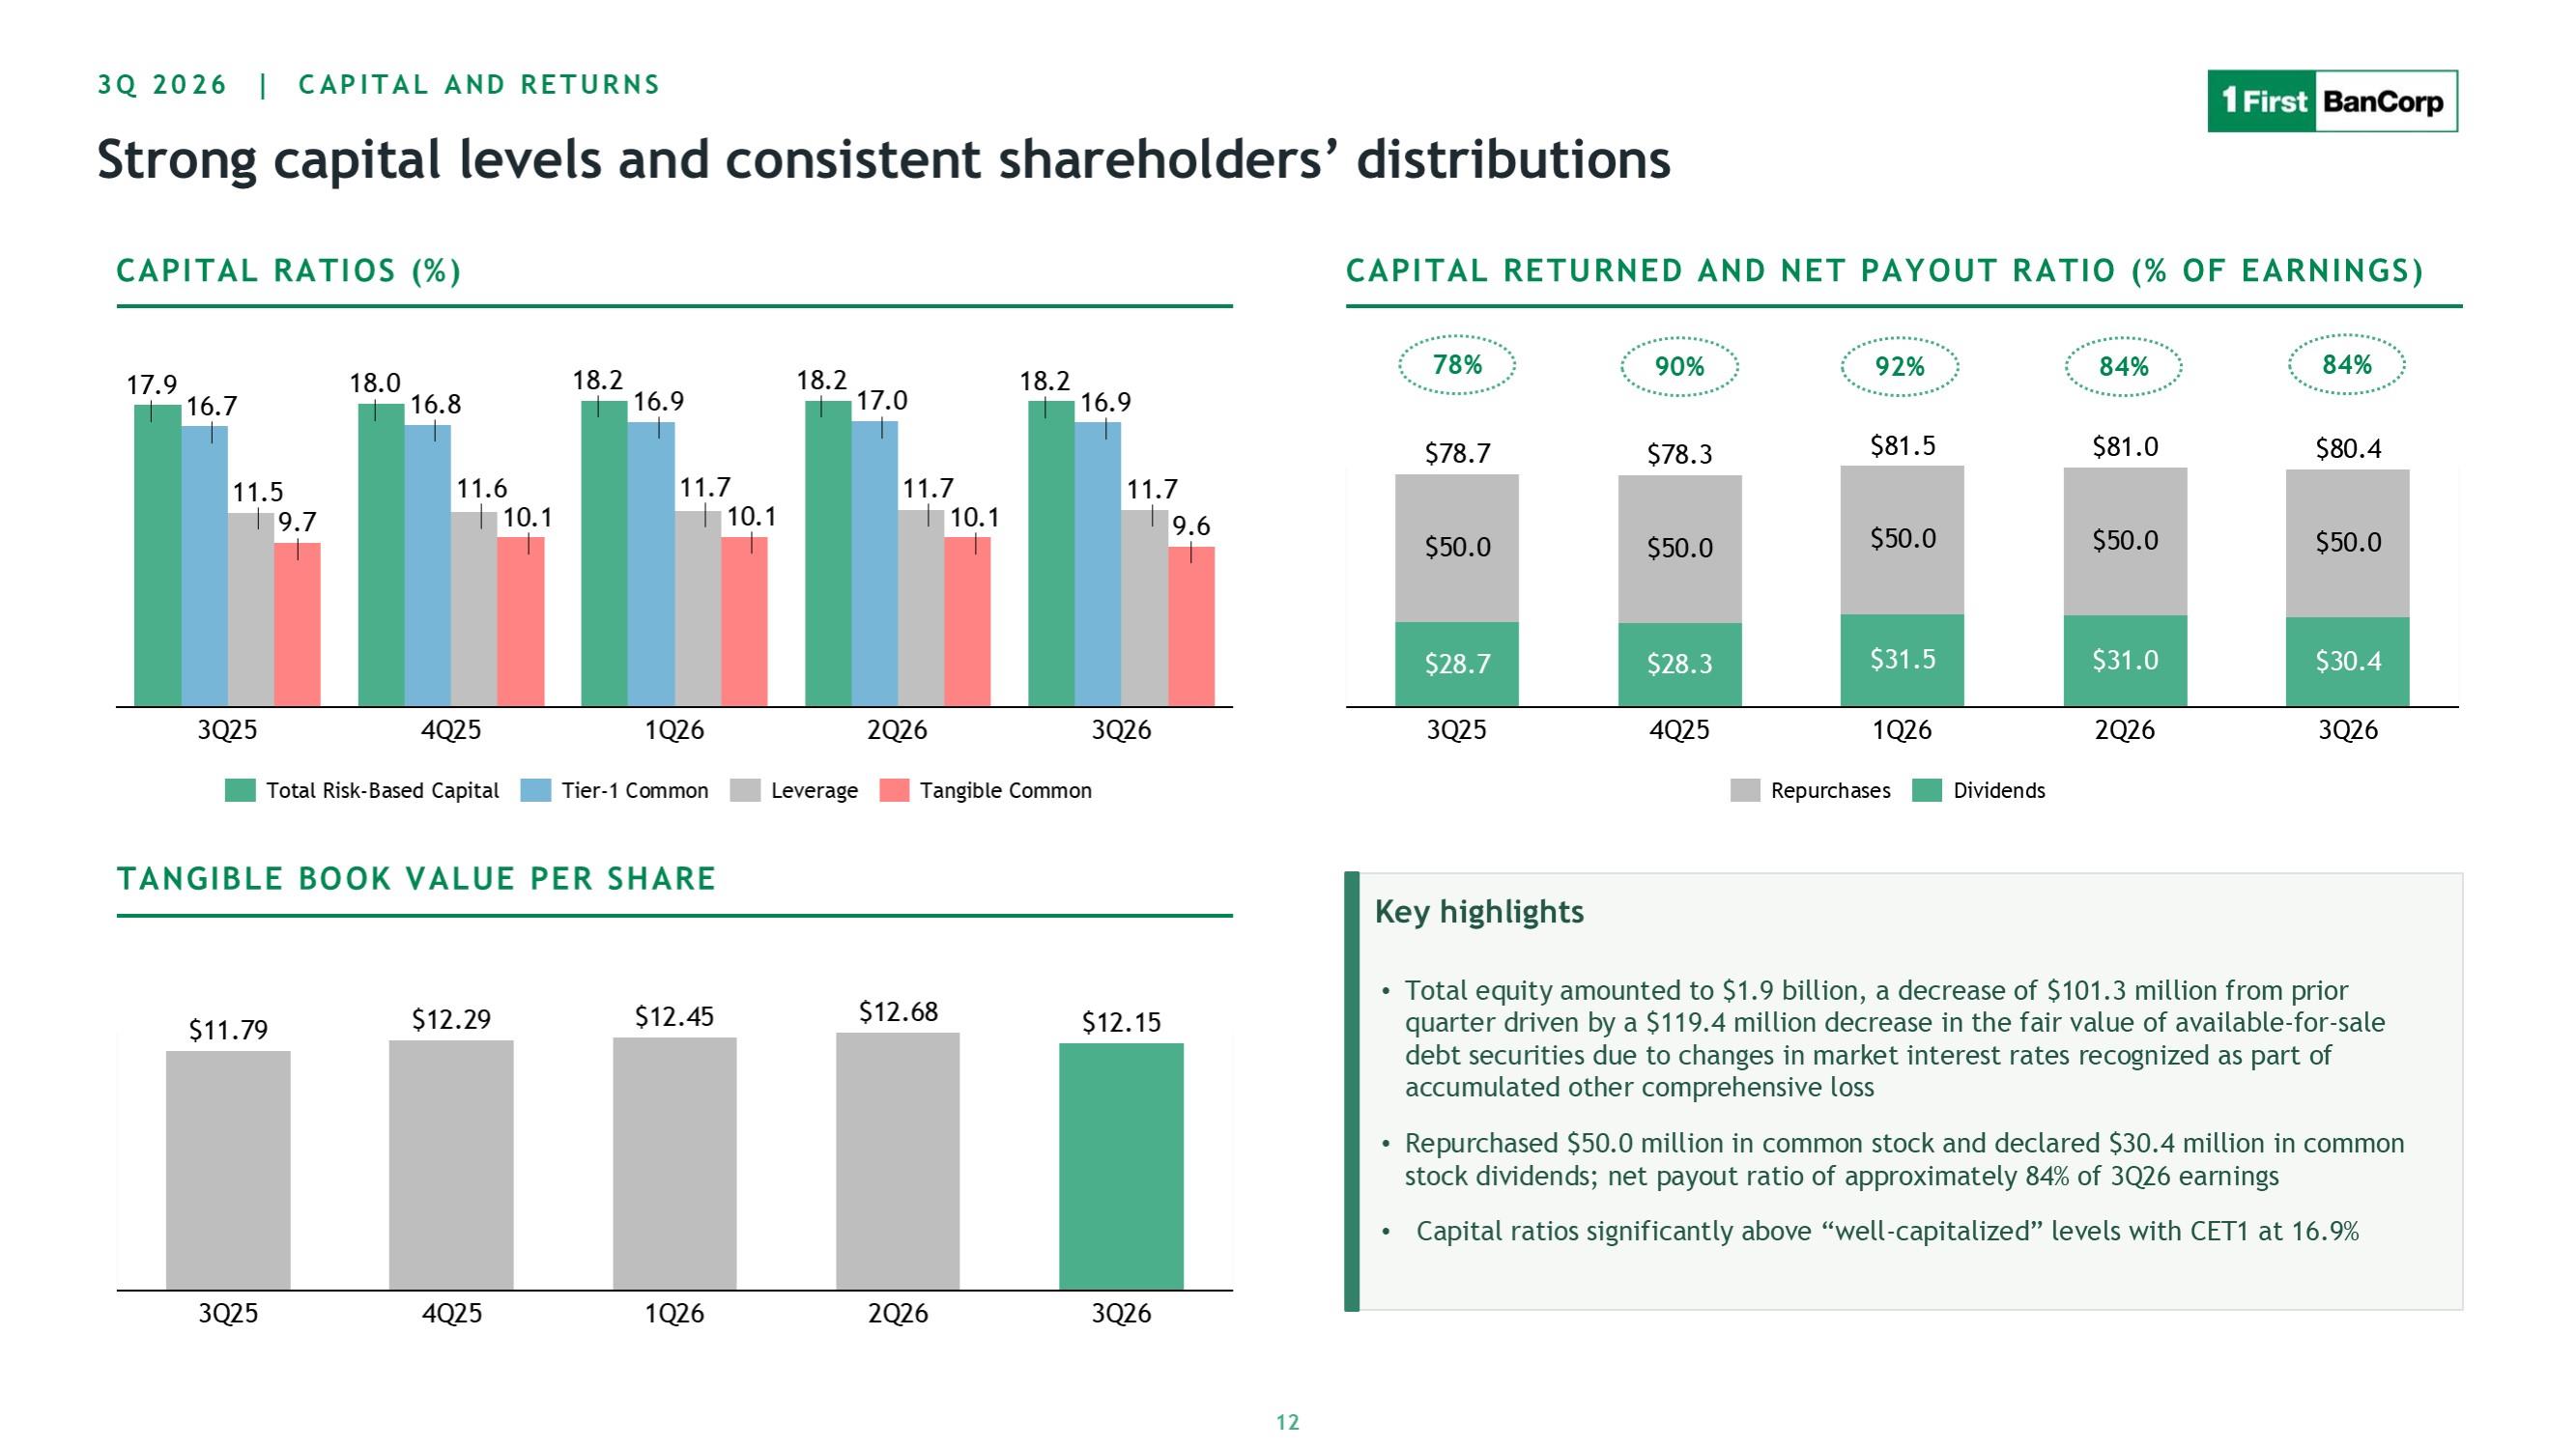
3Q 2026 | CAPITAL AND RETURNS Strong capital levels and consistent shareholders’ distributions CAPITAL RATIOS (%) 17.9 16.7 11.5 9.7 18 16.8 11.6 10.1 18.2 16.9 11.7 10.1 18.2 17 11.7 10.1 18.2 16.9 11.7 9.6 3Q25 4Q25 1Q26 2Q26 3Q26 Total Risk-Based Capital Tier-1 Common Leverage Tangible Common CAPITAL RETURNED AND NET PAYOUT RATIO (% OF EARNINGS) 78% 90% 92% 84% 84% $78.7 $78.3 $81.5 $81.0 $80.4 $50.0 $50.0 $50.0 $50.0 $50.0 $28.7 $28.3 $31.5 $31.0 $30.4 3Q25 4Q25 1Q26 2Q26 3Q26 Repurchases Dividends TANGIBLE BOOK VALUE PER SHARE $11.79 $12.29 $12.45 $12.68 $12.15 3Q25 4Q25 1Q26 2Q26 3Q26 Key highlights Total equity amounted to $1.9 billion, a decrease of $101.3 million from prior quarter driven by a $119.4 million decrease in the fair value of available-for-sale debt securities due to changes in market interest rates recognized as part of accumulated other comprehensive loss Repurchased $50.0 million in common stock and declared $30.4 million in common stock dividends; net payout ratio of approximately 84% of 3Q26 earnings Capital ratios significantly above “well-capitalized” levels with CET1 at 16.9% 12
3Q 2026 Financial Results Appendix and Non-GAAP Financial Measures
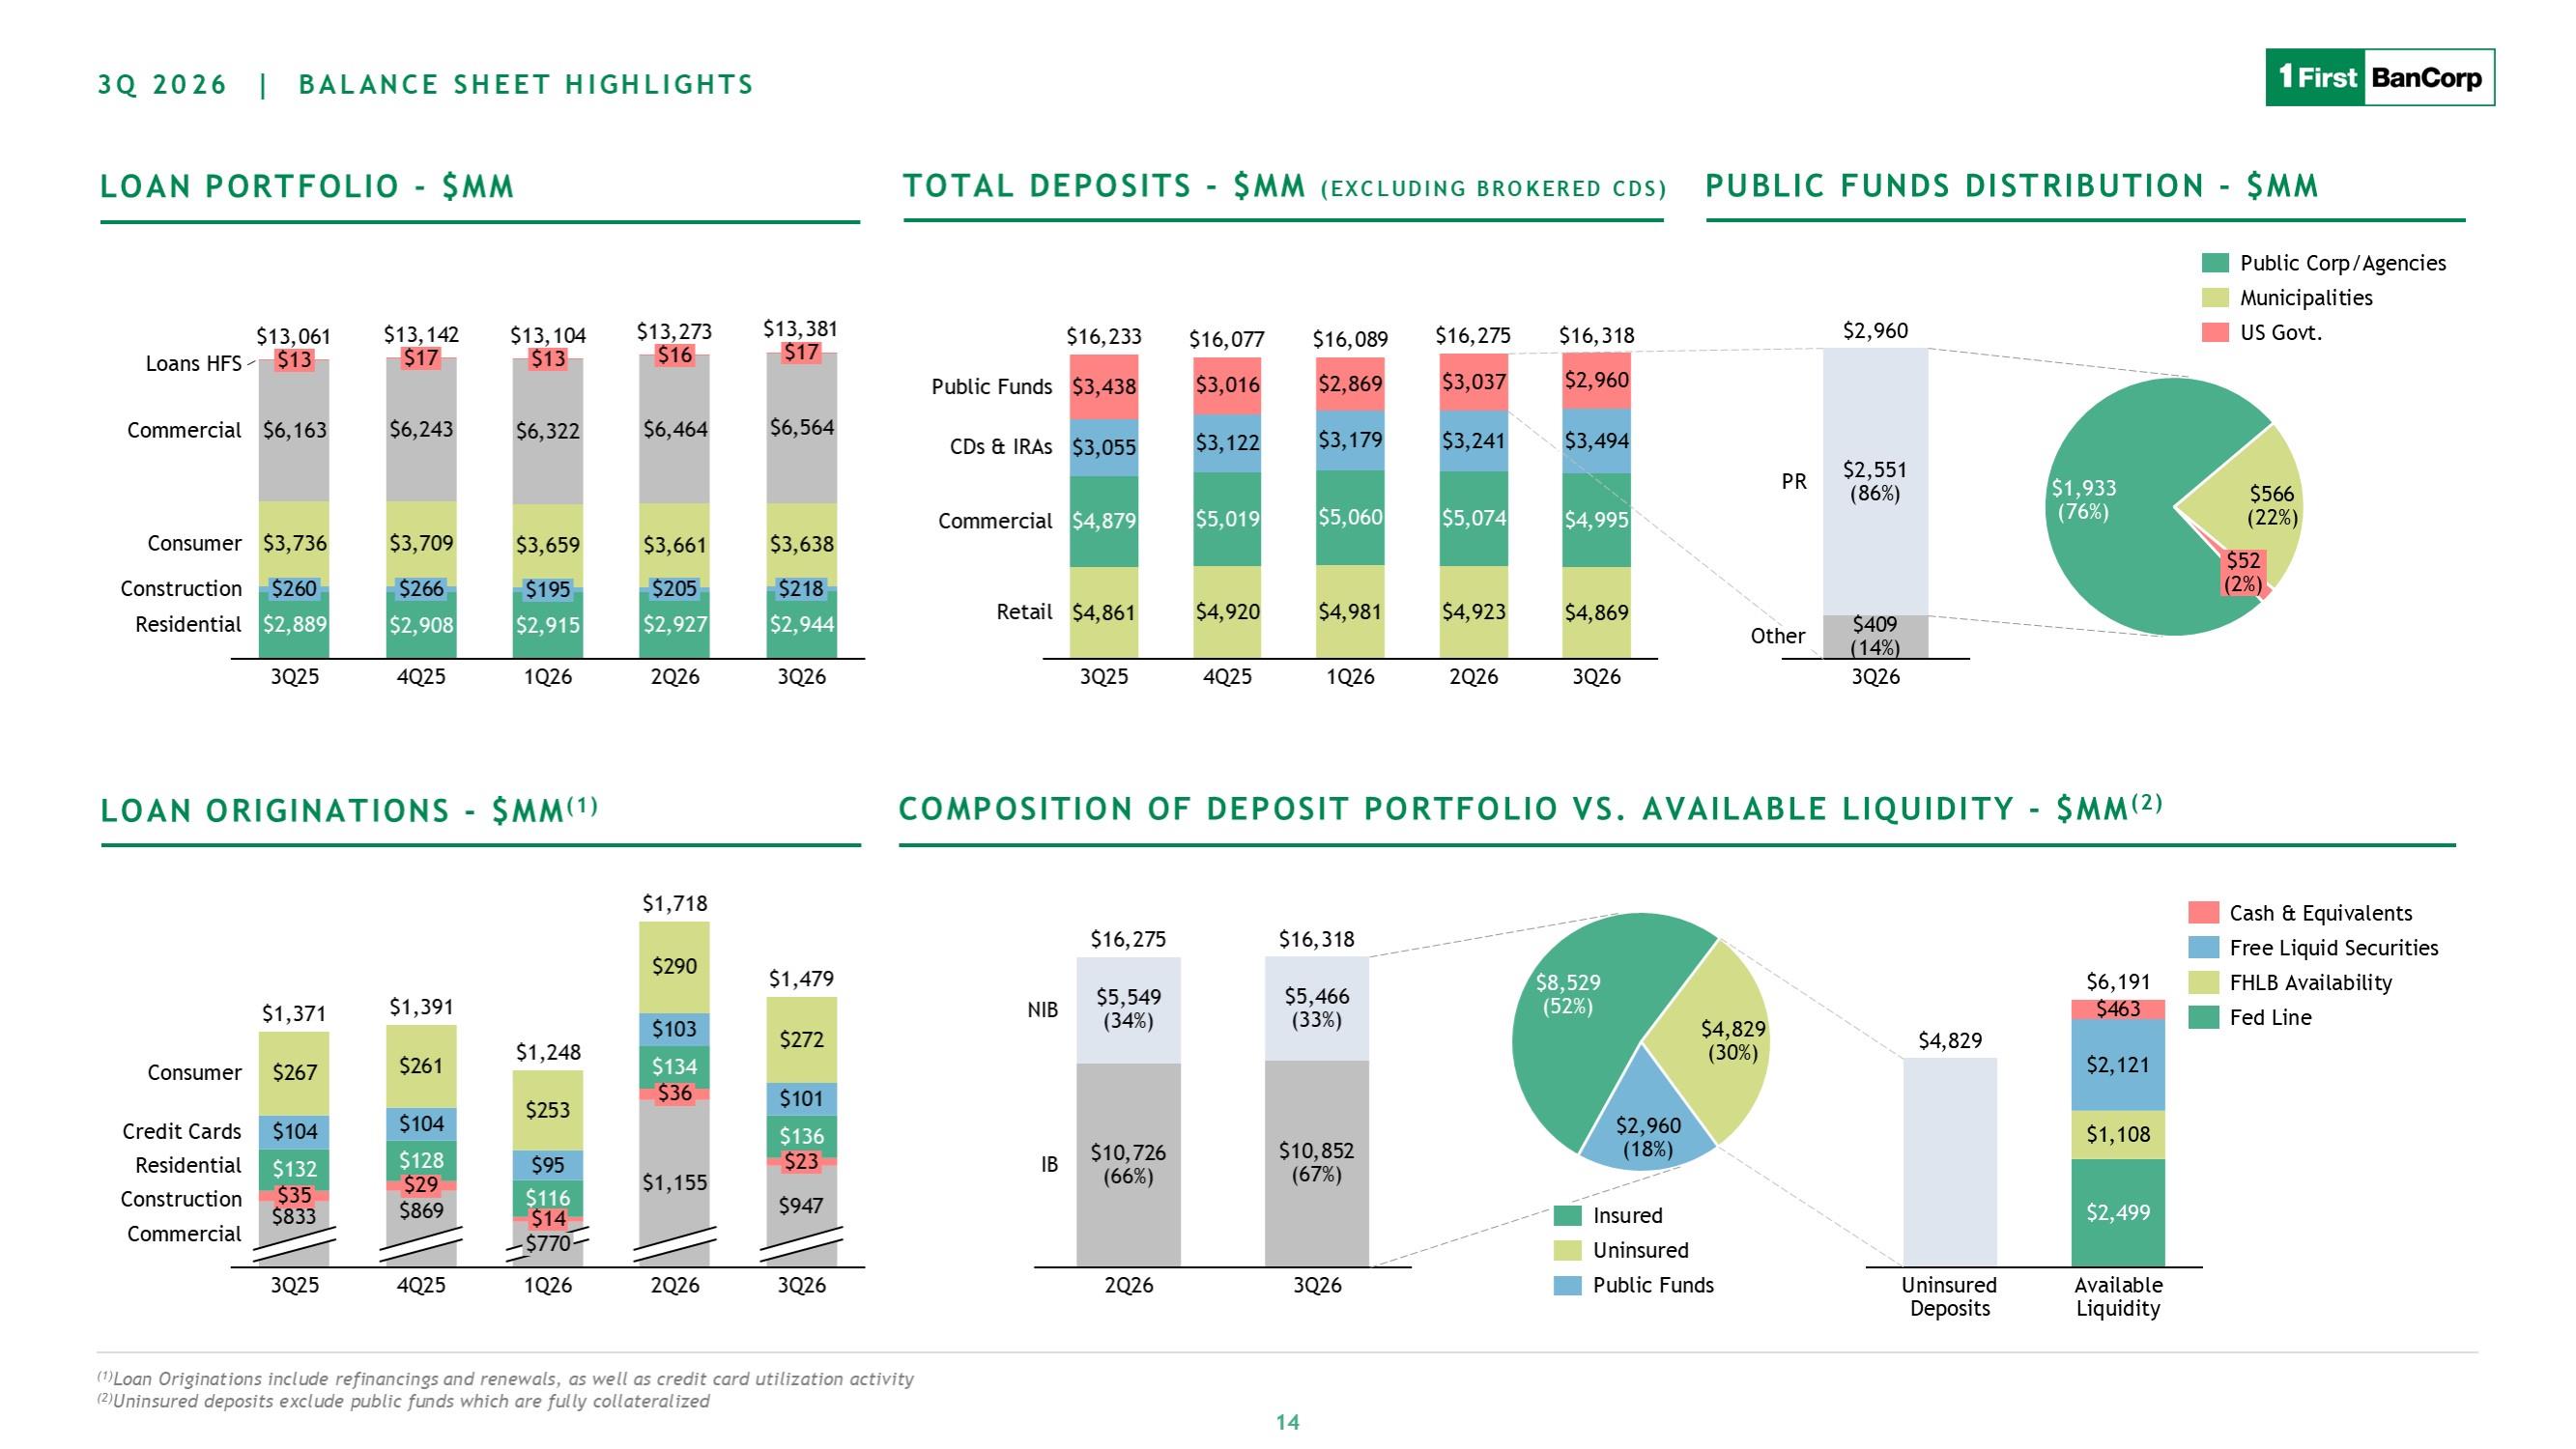
3Q 2026 | BALANCE SHEET HIGHLIGHTS LOAN PORTFOLIO - $MM Loans HFS $13,061 $13,142 $13,104 $13,273 $13,381 Commercial $13 $17 $13 $16 $17 Cosumer $6,163 $6,243 $6,322 $6,464 $6,564 Construction $3,736 $3,709 $3,659 $3,661 $3,638 residential $260 $266 $195 $205 $218 residnetial $2,889 $2,908 $2,915 $2,927 $2,944 3Q25 4Q25 1Q26 2Q26 3Q26 TOTAL DEPOSITS - $MM (EXCLUDING BROKERED CDS) $16,233 $16,077 $16,089 $16,275 $16,318 Public Funds $3,438 $3,016 $2,869 $3,037 $2,960 CDs & IRAs $3,055 $3,122 $3,179 $3,241 $3,494 Commerical $4,879 $5,019 $5,060 $5,074 $4,995 Retail $4,861 $4,920 $4,981 $49,232 $4,869 3Q25 4Q25 1Q26 2Q26 3Q26 PUBLIC FUNDS DISTRIBUTION - $MM $2,960 $2,551 -86% PR $409 Other -14% 3Q25 Public Corp/Agencies Municipalities US Govt. $1,933 $566 $52 76% 22% 2% LOAN ORIGINATIONS - $MM(1) $1,371 $1,391 $1,248 $1,718 $1,479 Consumer $267 $261 $253 $290 $272 Credit Cards $104 $104 $95 $103 $101 Residnetial $132 $128 $116 $134 $136 Construction $35 $29 $14 $36 $23 Commercial $833 $869 $770 $1,155 $947 3Q25 4Q25 1Q26 2Q26 3Q26 COMPOSITION OF DEPOSIT PORTFOLIO VS. AVAILABLE LIQUIDITY - $MM(2) $16,275 $16,318 $5,549 $5,466 -34% -33% NIB $10,726 $10,852 IB -66% -67% 2Q26 3Q26 $8,529 $4,829 $2,930 52% 30% 18% Insured Uninsured Public Funds $6,191 $463 Cash & Equivalents $2,121 Free Liquid Securities $1,108 FHLB Availability $8,529 $2,499 Fed Line Uninsured Deposits Available Liquidity (1)Loan Originations include refinancings and renewals, as well as credit card utilization activity (2)Uninsured deposits exclude public funds which are fully collateralized 14
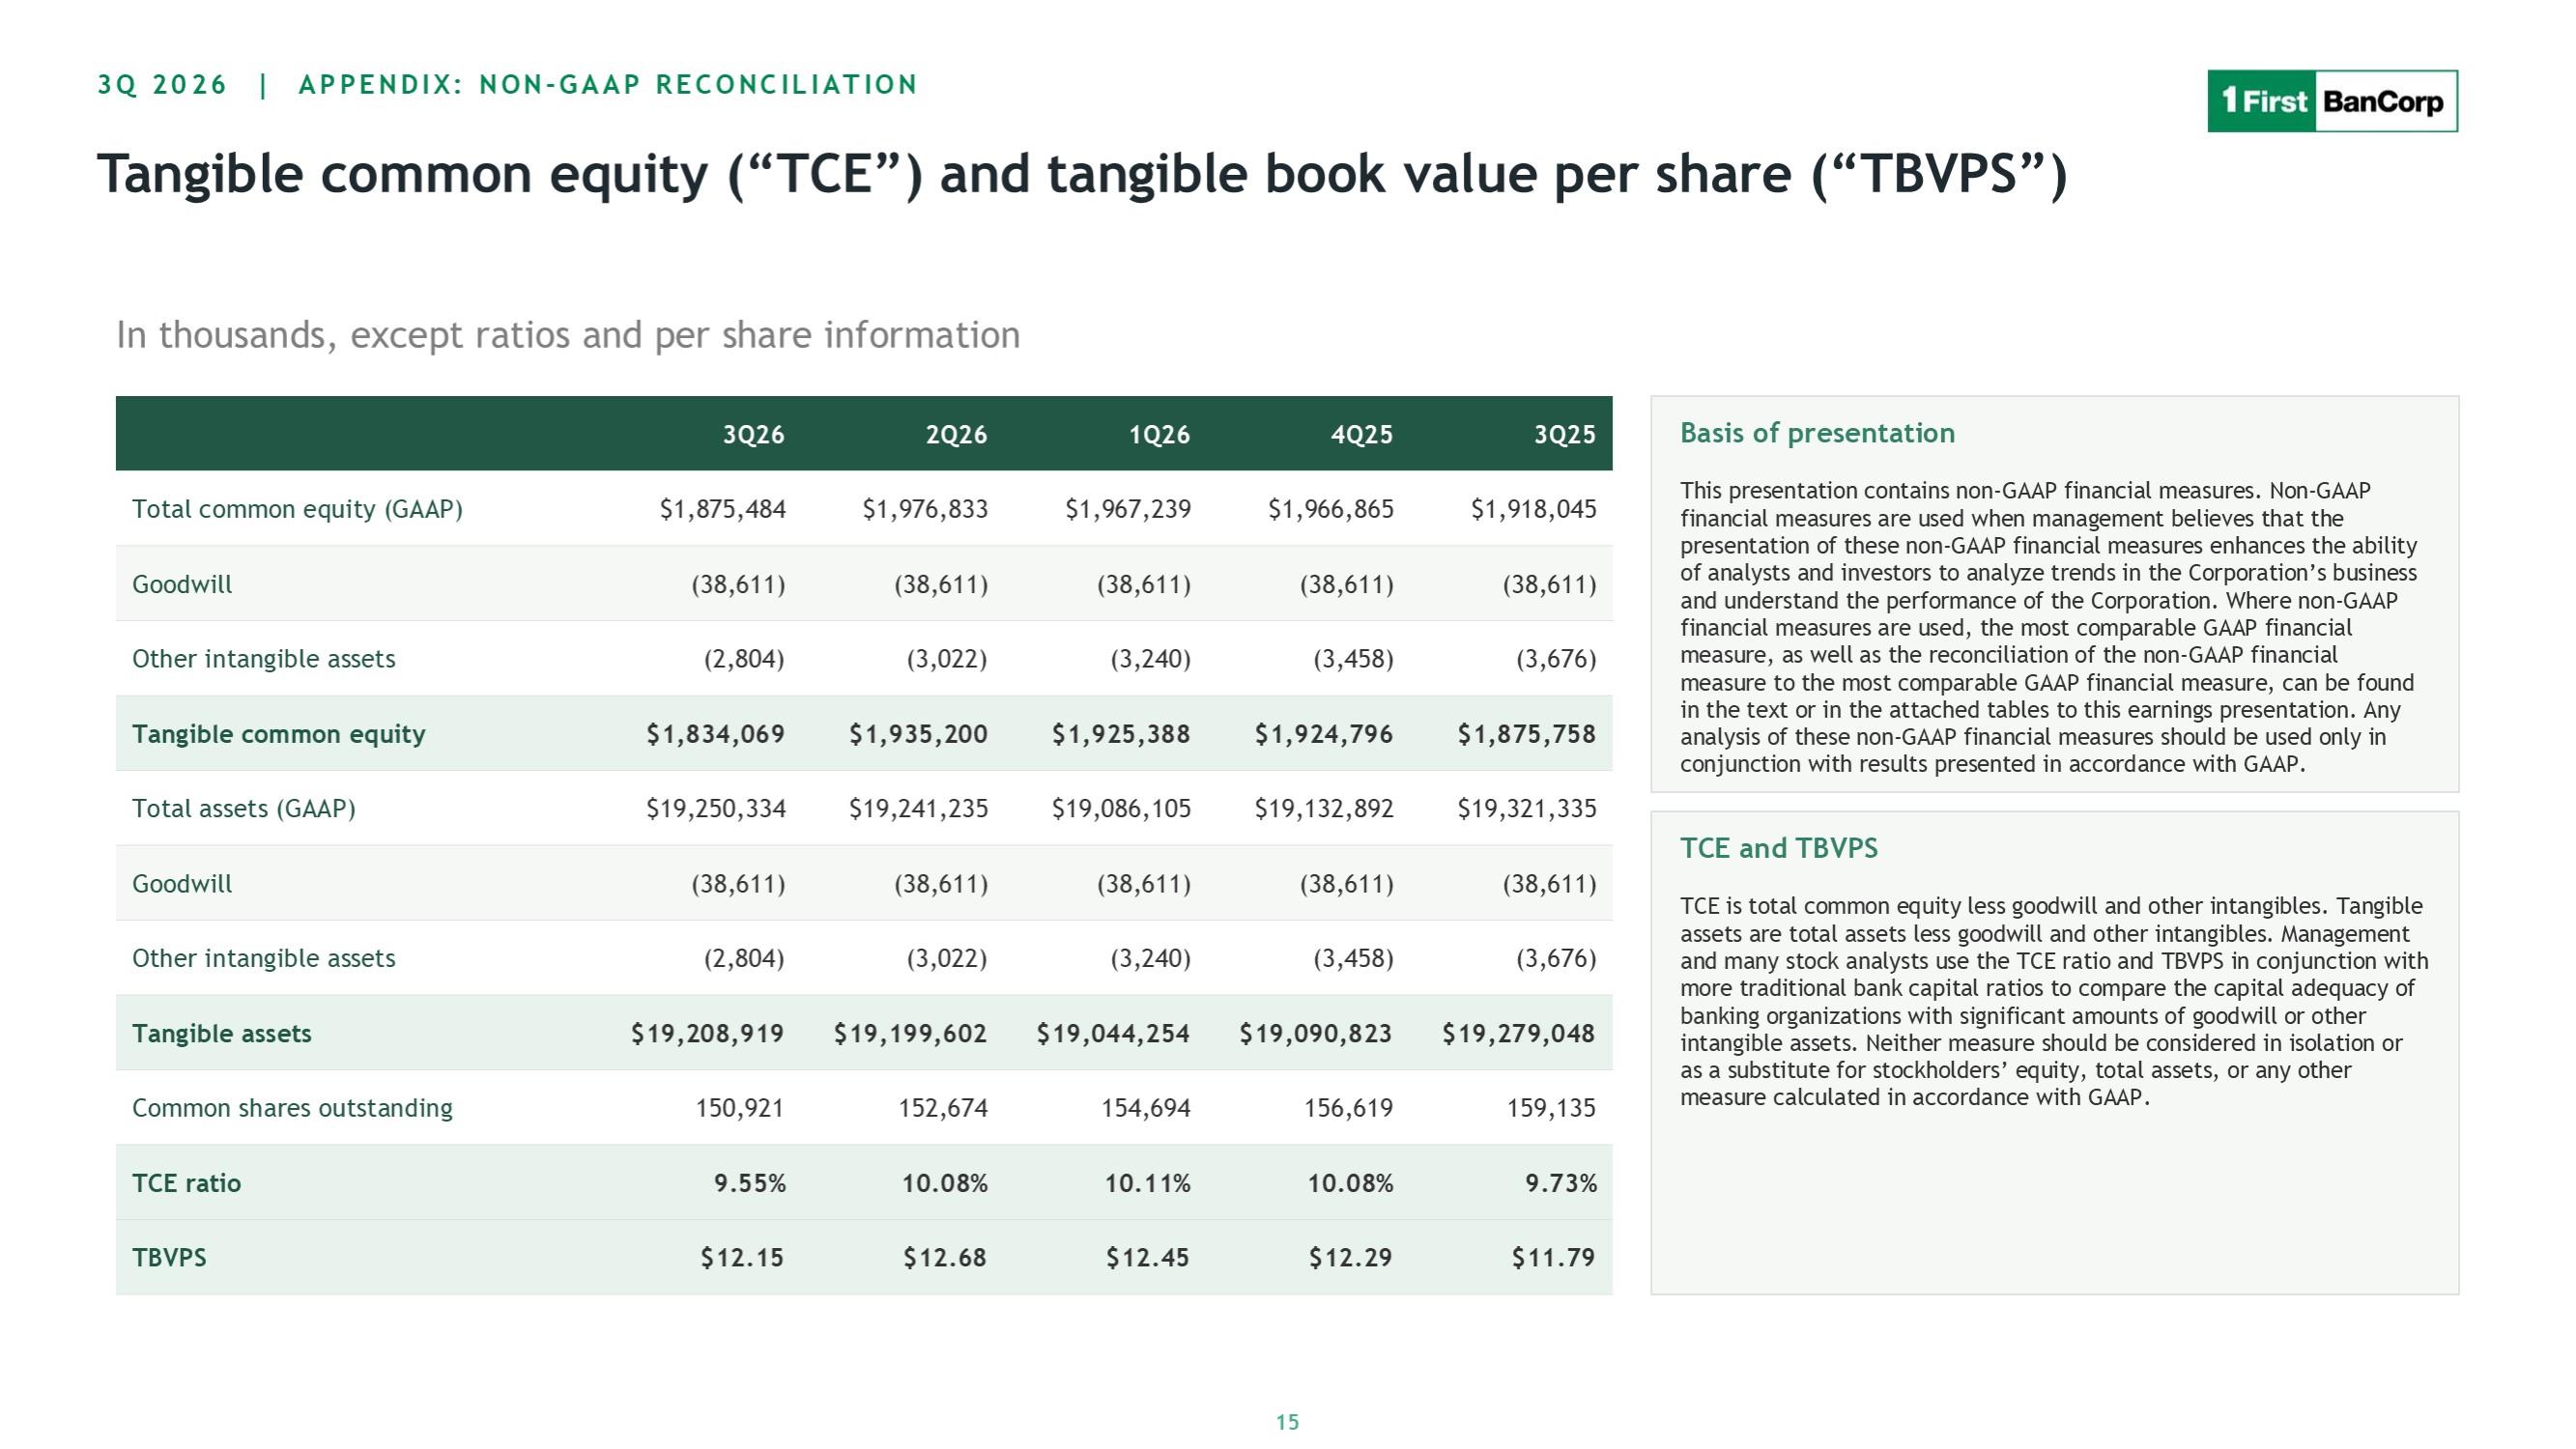
3Q 2026 | APPENDIX: NON-GAAP RECONCILIATION Tangible common equity (“TCE”) and tangible book value per share (“TBVPS”) In thousands, except ratios and per share information 3Q26 2Q26 1Q26 4Q25 3Q25 Total common equity (GAAP) $1,875,484 $1,976,833 $1,967,239 $1,966,865 $1,918,045 Goodwill (38,611) (38,611) (38,611) (38,611) (38,611) Other intangible assets (2,804) (3,022) (3,240) (3,458) (3,676) Tangible common equity $1,834,069 $1,935,200 $1,925,388 $1,924,796 $1,875,758 Total assets (GAAP) $19,250,334 $19,241,235 $19,086,105 $19,132,892 $19,321,335 Goodwill (38,611) (38,611) (38,611) (38,611) (38,611) Other intangible assets (2,804) (3,022) (3,240) (3,458) (3,676) Tangible assets $19,208,919 $19,199,602 $19,044,254 $19,090,823 $19,279,048 Common shares outstanding 150,921 152,674 154,694 156,619 159,135 TCE ratio 9.55% 10.08% 10.11% 10.08% 9.73% TBVPS $12.15 $12.68 $12.45 $12.29 $11.79 Basis of presentation This presentation contains non-GAAP financial measures. Non-GAAP financial measures are used when management believes that the presentation of these non-GAAP financial measures enhances the ability of analysts and investors to analyze trends in the Corporation’s business and understand the performance of the Corporation. Where non-GAAP financial measures are used, the most comparable GAAP financial measure, as well as the reconciliation of the non-GAAP financial measure to the most comparable GAAP financial measure, can be found in the text or in the attached tables to this earnings presentation. Any analysis of these non-GAAP financial measures should be used only in conjunction with results presented in accordance with GAAP. TCE and TBVPS TCE is total
common equity less goodwill and other intangibles. Tangible assets are total assets less goodwill and other intangibles. Management and many stock analysts use the TCE ratio and TBVPS in conjunction with more traditional bank capital ratios to compare the capital adequacy of banking organizations with significant amounts of goodwill or other intangible assets. Neither measure should be considered in isolation or as a substitute for stockholders’ equity, total assets, or any other measure calculated in accordance with GAAP. 15
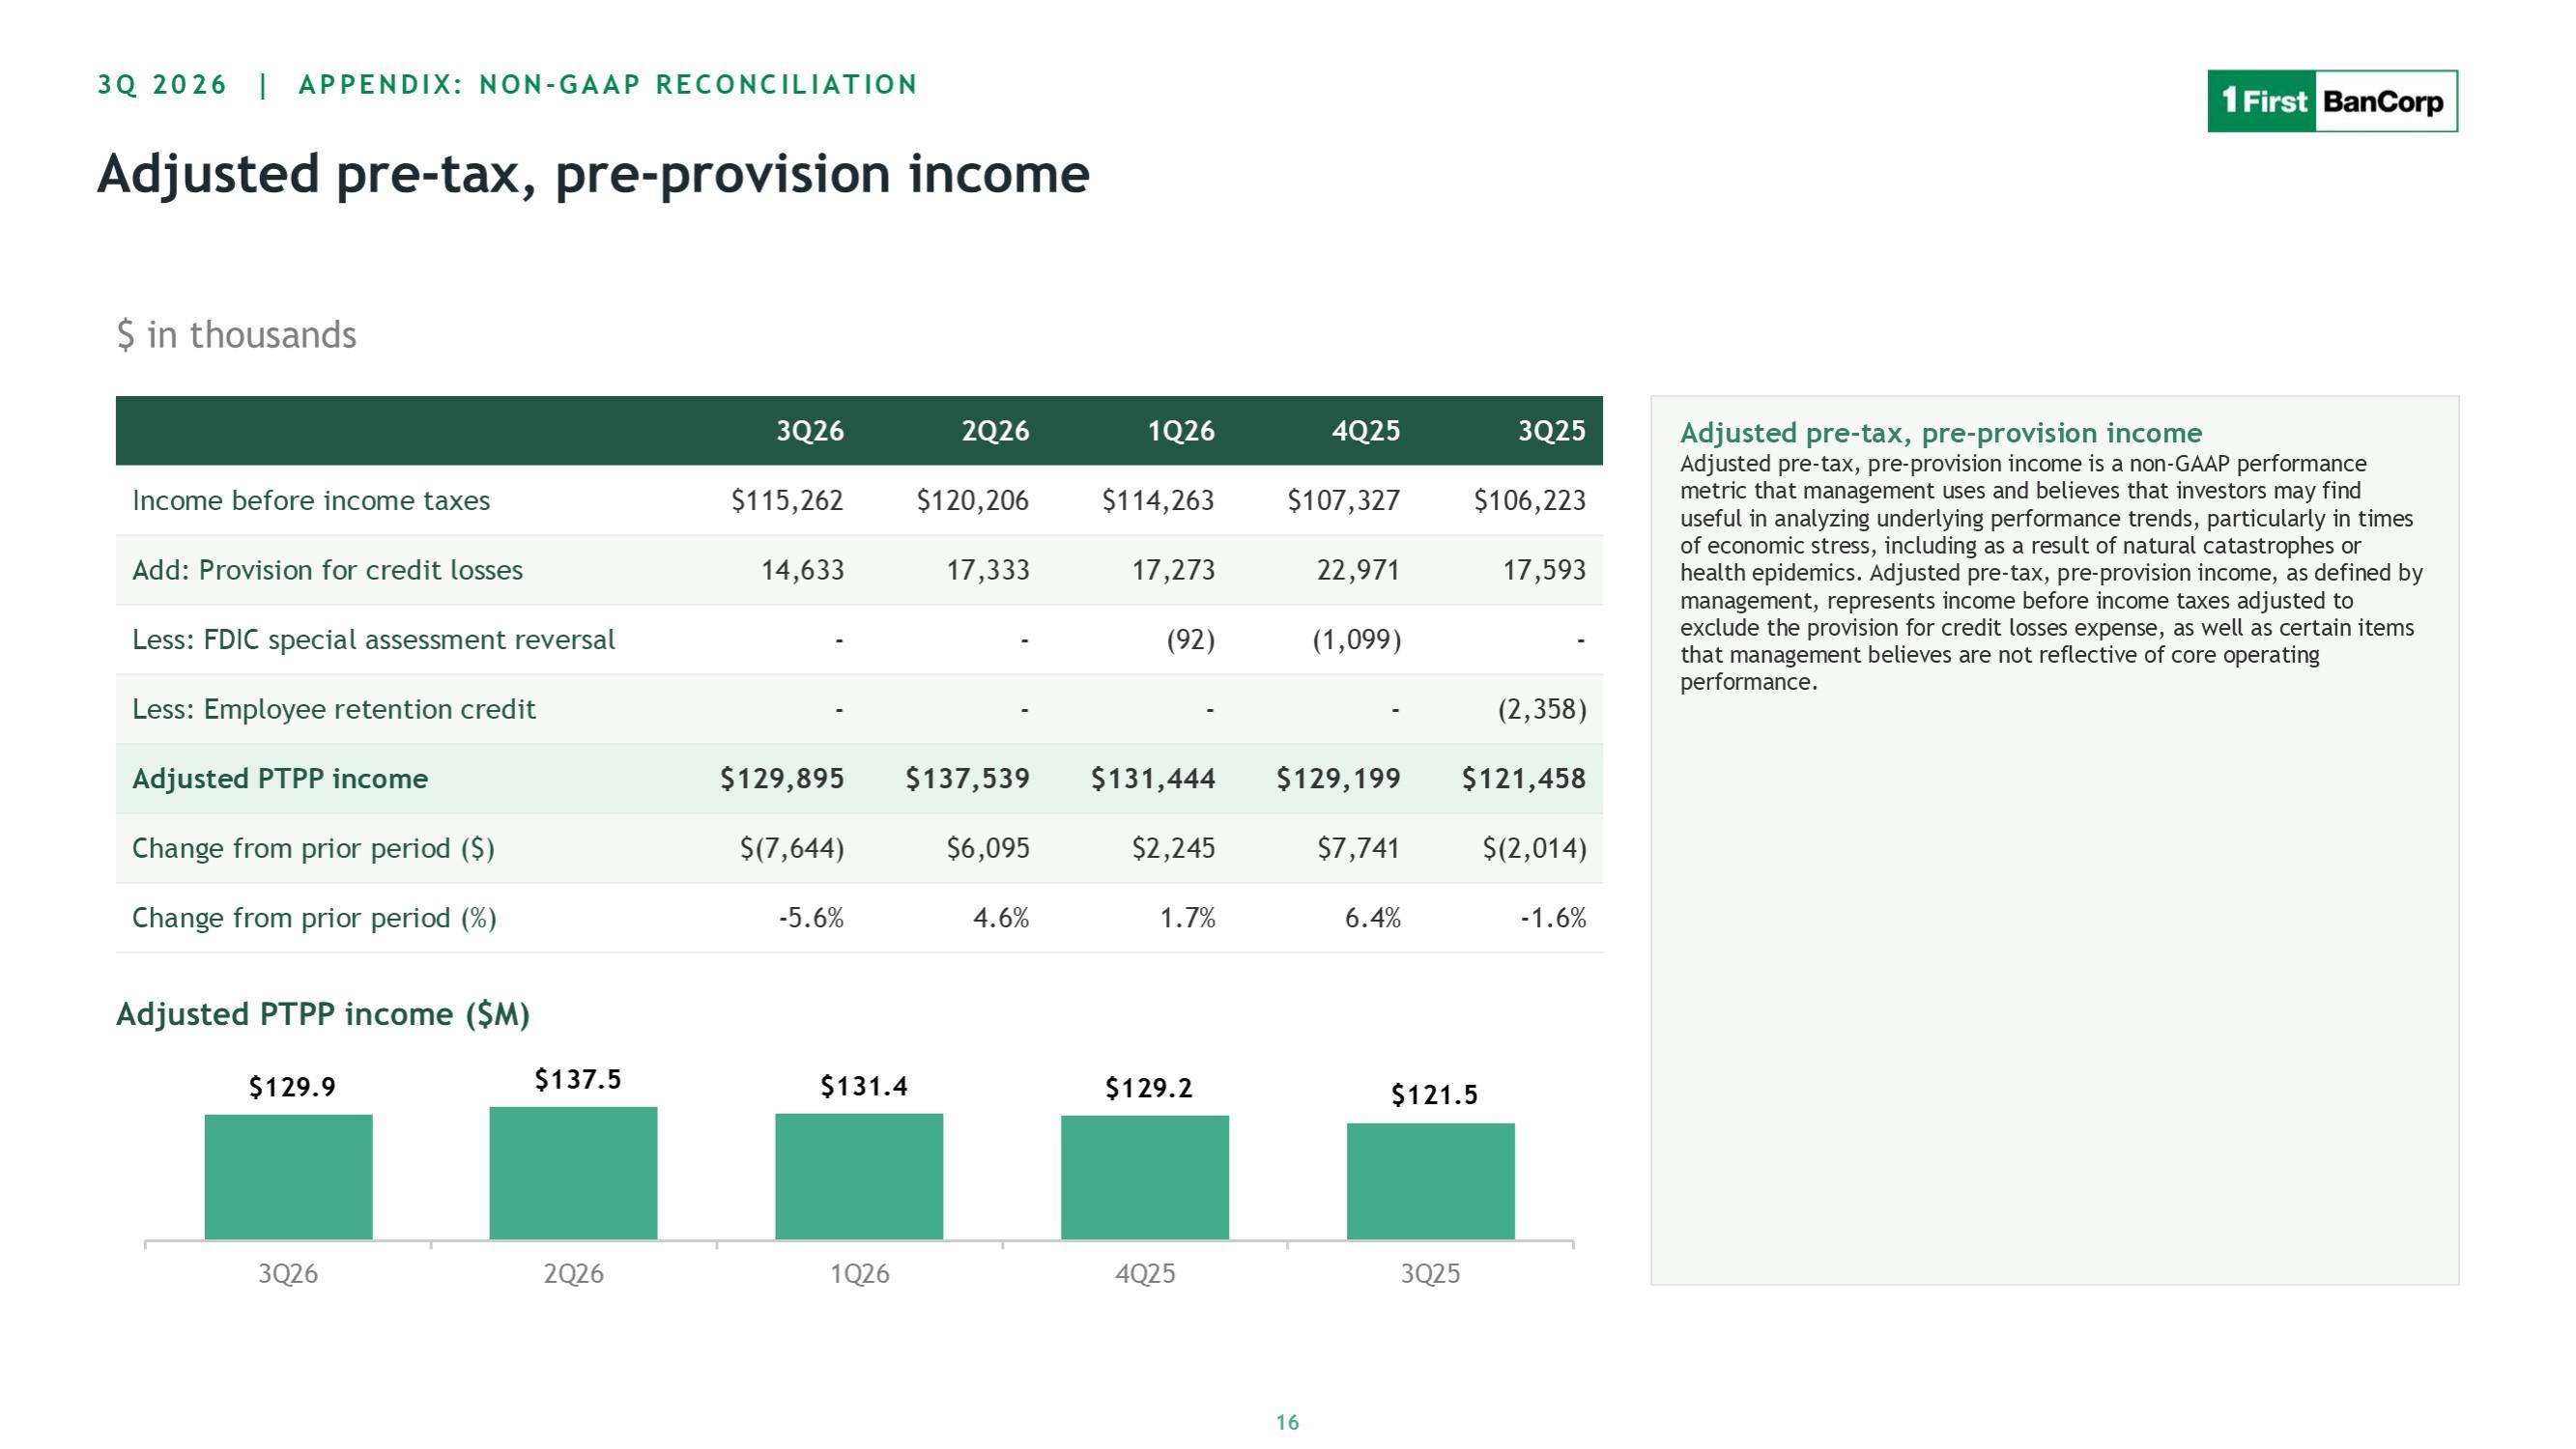
3Q 2026 | APPENDIX: NON-GAAP RECONCILIATION Adjusted pre-tax, pre-provision income $ in thousands 3Q26 2Q26 1Q26 4Q25 3Q25 Income before income taxes $115,262 $120,206 $114,263 $107,327 $106,223 Add: Provision for credit losses 14,633 17,333 17,273 22,971 17,593 Less: FDIC special assessment reversal - - (92) (1,099) - Less: Employee retention credit - - - - (2,358) Adjusted PTPP income $129,895 $137,539 $131,444 $129,199 $121,458 Change from prior period ($) $(7,644) $6,095 $2,245 $7,741 $(2,014) Change from prior period (%) -5.6% 4.6% 1.7% 6.4% -1.6% Adjusted PTPP income ($M) $129.9 $137.5 $131.4 $129.2 $121.5 3Q26 2Q26 1Q26 4Q25 3Q25 Adjusted pre-tax, pre-provision income Adjusted pre-tax, pre-provision income is a non-GAAP performance metric that management uses and believes that investors may find useful in analyzing underlying performance trends, particularly in times of economic stress, including as a result of natural catastrophes or health epidemics. Adjusted pre-tax, pre-provision income, as defined by management, represents income before income taxes adjusted to exclude the provision for credi t losses expense, as well as certain items that management believes are not reflective of core operating performance. 16
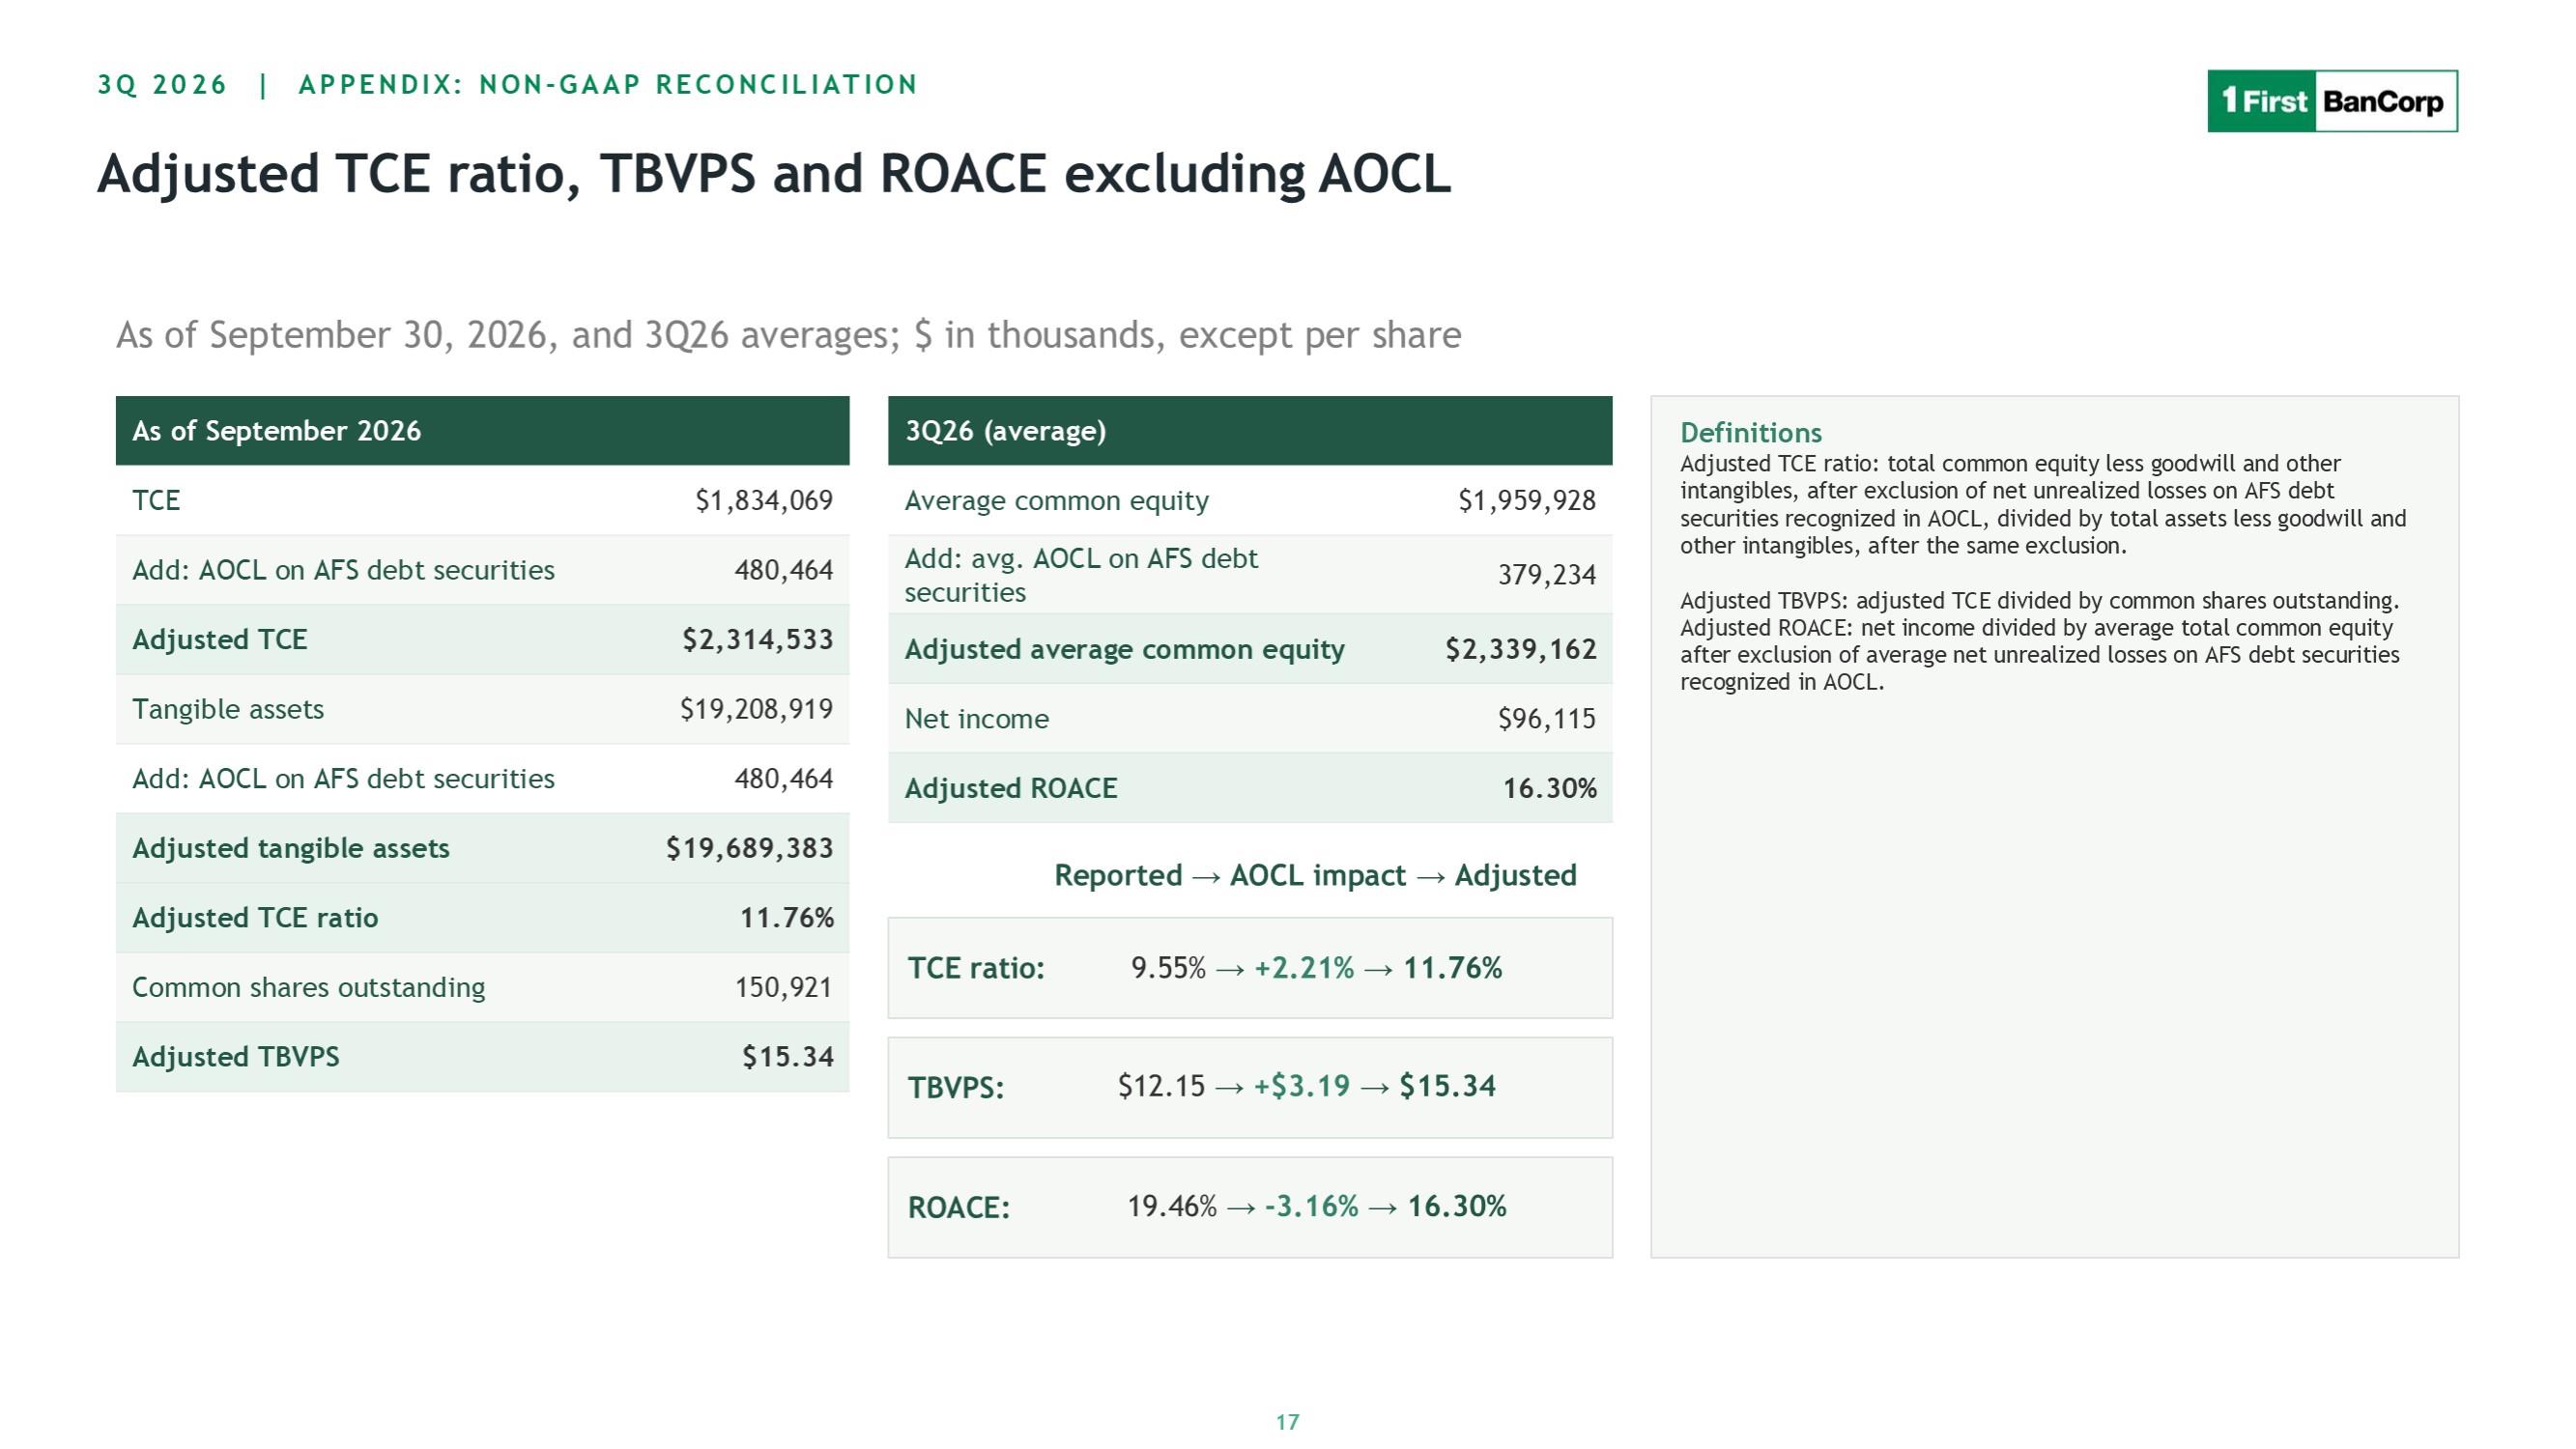
3Q 2026 | APPENDIX: NON-GAAP RECONCILIATION Adjusted TCE ratio, TBVPS and ROACE excluding AOCL As of September 30, 2026, and 3Q26 averages; $ in thousands, except per share As of September 2026 TCE $1,834,069 Add: AOCL on AFS debt securities 480,464 Adjusted TCE $2,314,533 Tangible assets $19,208,919 Add: AOCL on AFS debt securities 480,464 Adjusted tangible assets $19,689,383 Adjusted TCE ratio 11.76% Common shares outstanding 150,921 Adjusted TBVPS $15.34 3Q26 (average) Average common equity $1,959,928 Add: avg. AOCL on AFS debt securities 379,234 Adjusted average common equity $2,339,162 Net income $96,115 Adjusted ROACE 16.30% Reported
à
à

Thank You Questions and Answers Earnings Presentation | October 22, 2026 18