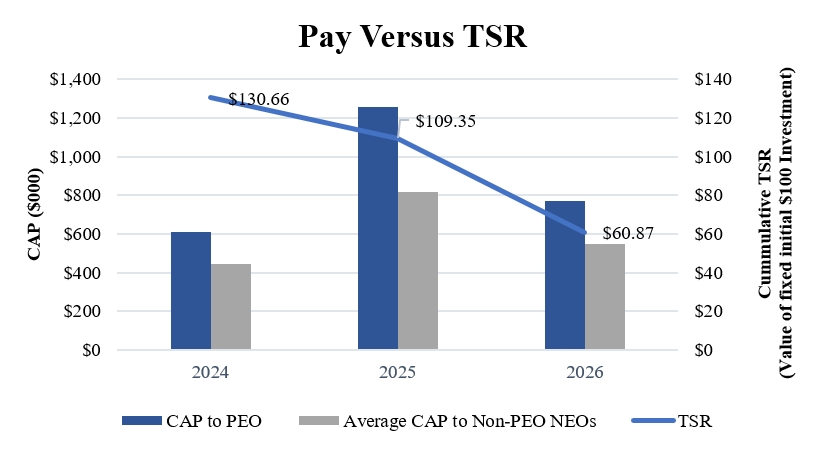
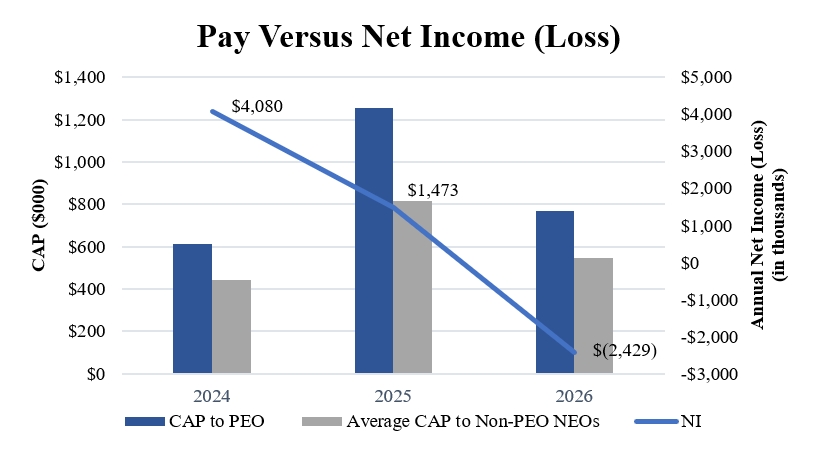
SCT Total | Average SCT | Average CAP | Total | ||||||||||||||||
Fiscal | for | CAP to | Total for | to Non-PEO | Shareholder | Net income (loss) | |||||||||||||
Year | PEO (1) | PEO (1)(2) | Non-PEO NEOs (3) | NEOs (3)(4)) | Return (5) | (in thousands) (6) | |||||||||||||
2026 | $ | 973,473 | $ | 768,298 | $ | 653,603 | $ | 548,136 | $ | 60.87 | $ | (2,429) | |||||||
2025 | 1,315,704 | 1,255,647 | 844,566 | 816,476 | 109.35 | 1,473 | |||||||||||||
2024 | 1,080,561 | 610,200 | 707,171 | 443,562 | 130.66 | 4,080 | |||||||||||||
| (1) | Mr. Loyd served as our PEO for all fiscal years presented. |
| (2) | CAP to our PEO was calculated in accordance with FASB ASC Topic 718 using valuation assumptions not materially different from those at the time of grant. Adjustments to stock-based compensation from the fair value at the time of grant are as follows: |
Year-over-year | Fair Value | ||||||||||||||||||||||||
Deduction | Year-end | Vesting Date | Change in Fair | Change in Fair | at Prior | ||||||||||||||||||||
for Amounts | Fair Value of | Fair Value of | Value of | Value of Vested | Year-end of | ||||||||||||||||||||
SCT Total | under Stock | Unvested | Vested Awards | Unvested | Awards Granted | Awards | |||||||||||||||||||
Fiscal | for | Awards Column | Awards Granted | Granted During | Awards Granted | in Prior | Forfeited | ||||||||||||||||||
Year | PEO | in SCT | During the Year | the Year(a) | in Prior Year(s) | Year(s)(a) | During the Year | CAP Total(b) | |||||||||||||||||
2026 | $ | 973,473 | $ | (411,679) | $ | 288,621 | $ | 49,360 | $ | (138,105) | $ | 93,936 | $ | (87,308) | $ | 768,298 | |||||||||
2025 | 1,315,704 | (534,672) | 441,791 | 50,093 | (98,692) | 81,423 | — | 1,255,647 | |||||||||||||||||
2024 | 1,080,561 | (422,604) | 281,649 | 37,869 | (401,636) | 34,361 | — | 610,200 | |||||||||||||||||
| a. | Includes cash dividends paid during the fiscal years presented on unvested restricted stock awards beneficially owned. |
| b. | The fair values associated with performance-based award units contingent on achieving outperform targets, which were considered not probable of achievement at issuance, were excluded from the computation of CAP for the table above. If these performance-based contingent share units were considered probable of vesting, then the CAP fair value of the awards would be as follows: |
Year-over-year | Fair Value | |||||||||||
Year-end | Change in Fair | at Prior | ||||||||||
Fair Value of | Value of | Year-end of | ||||||||||
Unvested | Unvested | Awards | ||||||||||
Fiscal | Awards Granted | Awards Granted | Forfeited | |||||||||
Year | During the Year | in Prior Year(s) | During the Year | CAP Adjustment | ||||||||
2026 | $ | — | $ | (56,354) | $ | (5,128) | $ | (61,482) | ||||
2025 | 109,056 | (28,007) | (48,925) | 32,124 | ||||||||
2024 | 33,135 | (79,825) | — | (46,690) | ||||||||
| (3) | For all fiscal years presented, our non-PEO NEOs include Mr. Bunch and Mr. Stash. |
| (4) | Average CAP to our non-PEO NEOs was calculated in accordance with FASB ASC Topic 718 using valuation assumptions not materially different from those at the time of grant. Adjustments to stock-based compensation from the fair value at the time of grant are as follows: |
Year-over-year | Fair Value | ||||||||||||||||||||||||
Average | Deduction | Year-end | Vesting Date | Change in Fair | Change in Fair | at Prior | |||||||||||||||||||
SCT Total | for Amounts | Fair Value of | Fair Value of | Value of | Value of Vested | Year-end of | |||||||||||||||||||
for | under Stock | Unvested | Vested Awards | Unvested | Awards Granted | Awards | |||||||||||||||||||
Fiscal | Non-PEO | Awards Column | Awards Granted | Granted During | Awards Granted | in Prior | Forfeited | ||||||||||||||||||
Year | NEOs | in SCT | During the Year | the Year(a) | in Prior Year(s) | Year(s)(a) | During the Year | CAP Total(b) | |||||||||||||||||
2026 | $ | 653,603 | $ | (218,538) | $ | 153,213 | $ | 26,203 | $ | (69,977) | $ | 49,978 | $ | (46,346) | $ | 548,136 | |||||||||
2025 | 844,566 | (283,831) | 234,525 | 26,592 | (47,829) | 42,453 | — | 816,476 | |||||||||||||||||
2024 | 707,171 | (224,335) | 149,510 | 20,102 | (187,022) | (21,864) | — | 443,562 | |||||||||||||||||
| a. | Includes cash dividends paid during the fiscal years presented on unvested restricted stock awards beneficially owned. |
| b. | The fair values associated with performance-based award units contingent on achieving outperform targets, which were considered not probable of achievement at issuance, were excluded from the computation of CAP for the table above. If these performance-based contingent share units were considered probable of vesting, then the CAP fair value of the awards would be as follows: |
Year-over-year | Fair Value | |||||||||||
Year-end | Change in Fair | at Prior | ||||||||||
Fair Value of | Value of | Year-end of | ||||||||||
Unvested | Unvested | Awards | ||||||||||
Fiscal | Awards Granted | Awards Granted | Forfeited | |||||||||
Year | During the Year | in Prior Year(s) | During the Year | CAP Adjustment | ||||||||
2026 | $ | — | $ | (29,916) | $ | (2,722) | $ | (32,638) | ||||
2025 | 57,893 | (14,867) | (16,826) | 26,200 | ||||||||
2024 | 17,590 | (27,452) | (99,697) | (109,559) | ||||||||
| (5) | The Company’s Total Shareholder Return for each period presented is calculated cumulatively as an initial fixed $100 investment at the applicable measurement point with dividends reinvested for each measurement in accordance with Item 201(e) of Regulation S-K. |
| (6) | Represents Net Income (Loss) as reported in the Company’s audited consolidated financial statements included in our Annual Report on Form 10-K for the fiscal years ended June 30, 2026, 2025 and 2024. |
| (2) | CAP to our PEO was calculated in accordance with FASB ASC Topic 718 using valuation assumptions not materially different from those at the time of grant. Adjustments to stock-based compensation from the fair value at the time of grant are as follows: |
Year-over-year | Fair Value | ||||||||||||||||||||||||
Deduction | Year-end | Vesting Date | Change in Fair | Change in Fair | at Prior | ||||||||||||||||||||
for Amounts | Fair Value of | Fair Value of | Value of | Value of Vested | Year-end of | ||||||||||||||||||||
SCT Total | under Stock | Unvested | Vested Awards | Unvested | Awards Granted | Awards | |||||||||||||||||||
Fiscal | for | Awards Column | Awards Granted | Granted During | Awards Granted | in Prior | Forfeited | ||||||||||||||||||
Year | PEO | in SCT | During the Year | the Year(a) | in Prior Year(s) | Year(s)(a) | During the Year | CAP Total(b) | |||||||||||||||||
2026 | $ | 973,473 | $ | (411,679) | $ | 288,621 | $ | 49,360 | $ | (138,105) | $ | 93,936 | $ | (87,308) | $ | 768,298 | |||||||||
2025 | 1,315,704 | (534,672) | 441,791 | 50,093 | (98,692) | 81,423 | — | 1,255,647 | |||||||||||||||||
2024 | 1,080,561 | (422,604) | 281,649 | 37,869 | (401,636) | 34,361 | — | 610,200 | |||||||||||||||||
| a. | Includes cash dividends paid during the fiscal years presented on unvested restricted stock awards beneficially owned. |
| b. | The fair values associated with performance-based award units contingent on achieving outperform targets, which were considered not probable of achievement at issuance, were excluded from the computation of CAP for the table above. If these performance-based contingent share units were considered probable of vesting, then the CAP fair value of the awards would be as follows: |
Year-over-year | Fair Value | |||||||||||
Year-end | Change in Fair | at Prior | ||||||||||
Fair Value of | Value of | Year-end of | ||||||||||
Unvested | Unvested | Awards | ||||||||||
Fiscal | Awards Granted | Awards Granted | Forfeited | |||||||||
Year | During the Year | in Prior Year(s) | During the Year | CAP Adjustment | ||||||||
2026 | $ | — | $ | (56,354) | $ | (5,128) | $ | (61,482) | ||||
2025 | 109,056 | (28,007) | (48,925) | 32,124 | ||||||||
2024 | 33,135 | (79,825) | — | (46,690) | ||||||||
| (4) | Average CAP to our non-PEO NEOs was calculated in accordance with FASB ASC Topic 718 using valuation assumptions not materially different from those at the time of grant. Adjustments to stock-based compensation from the fair value at the time of grant are as follows: |
Year-over-year | Fair Value | ||||||||||||||||||||||||
Average | Deduction | Year-end | Vesting Date | Change in Fair | Change in Fair | at Prior | |||||||||||||||||||
SCT Total | for Amounts | Fair Value of | Fair Value of | Value of | Value of Vested | Year-end of | |||||||||||||||||||
for | under Stock | Unvested | Vested Awards | Unvested | Awards Granted | Awards | |||||||||||||||||||
Fiscal | Non-PEO | Awards Column | Awards Granted | Granted During | Awards Granted | in Prior | Forfeited | ||||||||||||||||||
Year | NEOs | in SCT | During the Year | the Year(a) | in Prior Year(s) | Year(s)(a) | During the Year | CAP Total(b) | |||||||||||||||||
2026 | $ | 653,603 | $ | (218,538) | $ | 153,213 | $ | 26,203 | $ | (69,977) | $ | 49,978 | $ | (46,346) | $ | 548,136 | |||||||||
2025 | 844,566 | (283,831) | 234,525 | 26,592 | (47,829) | 42,453 | — | 816,476 | |||||||||||||||||
2024 | 707,171 | (224,335) | 149,510 | 20,102 | (187,022) | (21,864) | — | 443,562 | |||||||||||||||||
| a. | Includes cash dividends paid during the fiscal years presented on unvested restricted stock awards beneficially owned. |
| b. | The fair values associated with performance-based award units contingent on achieving outperform targets, which were considered not probable of achievement at issuance, were excluded from the computation of CAP for the table above. If these performance-based contingent share units were considered probable of vesting, then the CAP fair value of the awards would be as follows: |
Year-over-year | Fair Value | |||||||||||
Year-end | Change in Fair | at Prior | ||||||||||
Fair Value of | Value of | Year-end of | ||||||||||
Unvested | Unvested | Awards | ||||||||||
Fiscal | Awards Granted | Awards Granted | Forfeited | |||||||||
Year | During the Year | in Prior Year(s) | During the Year | CAP Adjustment | ||||||||
2026 | $ | — | $ | (29,916) | $ | (2,722) | $ | (32,638) | ||||
2025 | 57,893 | (14,867) | (16,826) | 26,200 | ||||||||
2024 | 17,590 | (27,452) | (99,697) | (109,559) | ||||||||