
Associated Banc-Corp Third Quarter 2026 Earnings Presentation October 22, 2026
Important Disclosures 2 Forward-looking statements: Statements made in this document which are not purely historical are forward-looking statements, as defined in the Private Securities Litigation Reform Act of 1995. This includes any statements regarding management’s plans, objectives, or goals for future operations, products or services, and forecasts of its revenues, earnings, or other measures of performance. Such forward-looking statements may be identified by the use of words such as “believe,” “expect,” “anticipate,” “plan,” “estimate,” “should," “intend,” "target," “outlook,” "project," "guidance," "forecast," or similar expressions. Forward-looking statements are based on current management expectations and, by their nature, are subject to risks and uncertainties. Actual results may differ materially from those contained in the forward- looking statements. Factors which may cause actual results to differ materially from those contained in such forward-looking statements include the ability to integrate the American National Bank (“ANB”) business successfully and in a timely manner; the possibility that the anticipated benefits of the ANB transaction are not realized when expected or at all; the possibility that the ANB transaction may be more expensive to integrate than anticipated; and such other risk factors as identified in the Company’s most recent Form 10-K and subsequent Form 10-Qs and other SEC filings, and such factors are incorporated herein by reference. Trademarks: All trademarks, service marks, and trade names referenced in this material are official trademarks and the property of their respective owners. Presentation: Within the charts and tables presented, certain segments, columns and rows may not sum to totals shown due to rounding. Non-GAAP measures: This presentation includes certain non-GAAP financial measures. These financial measures have been included as they provide meaningful supplemental information to assess trends in the Corporation’s results of operations. These non-GAAP measures are provided in addition to, and not as substitutes for, measures of our financial performance determined in accordance with GAAP. Our calculation of these non-GAAP measures may not be comparable to similarly titled measures of other companies due to potential differences between companies in the method of calculation. As a result, the use of these non-GAAP measures has limitations and should not be considered superior to, in isolation from, or as a substitute for, related GAAP measures. Unless otherwise noted, reconciliations of these non-GAAP financial measures to the most directly comparable GAAP financial measures can be found at the end of this presentation.

Financial Results Associated Bank River Center – Milwaukee, WI
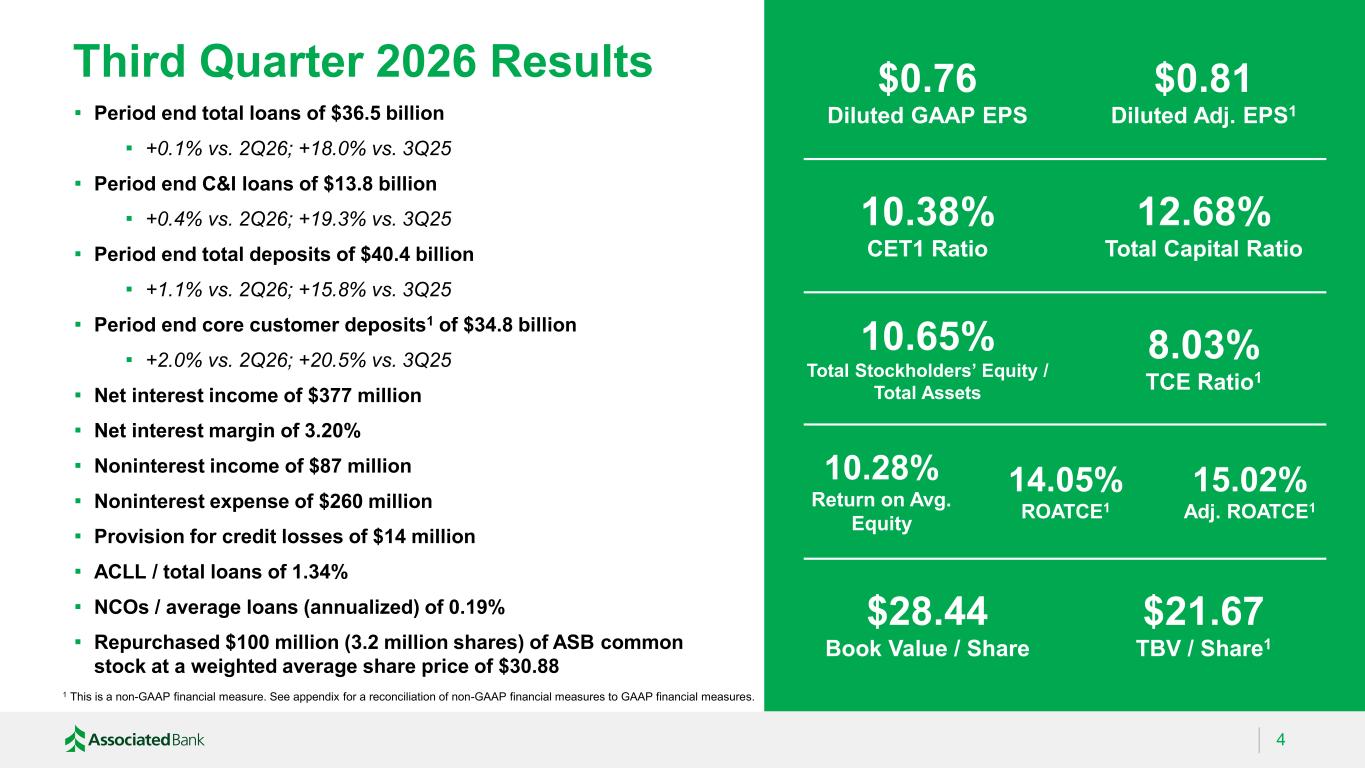
$0.76 Diluted GAAP EPS $0.81 Diluted Adj. EPS1 10.38% CET1 Ratio 12.68% Total Capital Ratio 10.65% Total Stockholders’ Equity / Total Assets 8.03% TCE Ratio1 10.28% Return on Avg. Equity 14.05% ROATCE1 15.02% Adj. ROATCE1 $28.44 Book Value / Share $21.67 TBV / Share1 Third Quarter 2026 Results 4 ▪ Period end total loans of $36.5 billion ▪ +0.1% vs. 2Q26; +18.0% vs. 3Q25 ▪ Period end C&I loans of $13.8 billion ▪ +0.4% vs. 2Q26; +19.3% vs. 3Q25 ▪ Period end total deposits of $40.4 billion ▪ +1.1% vs. 2Q26; +15.8% vs. 3Q25 ▪ Period end core customer deposits1 of $34.8 billion ▪ +2.0% vs. 2Q26; +20.5% vs. 3Q25 ▪ Net interest income of $377 million ▪ Net interest margin of 3.20% ▪ Noninterest income of $87 million ▪ Noninterest expense of $260 million ▪ Provision for credit losses of $14 million ▪ ACLL / total loans of 1.34% ▪ NCOs / average loans (annualized) of 0.19% ▪ Repurchased $100 million (3.2 million shares) of ASB common stock at a weighted average share price of $30.88 1 This is a non-GAAP financial measure. See appendix for a reconciliation of non-GAAP financial measures to GAAP financial measures.
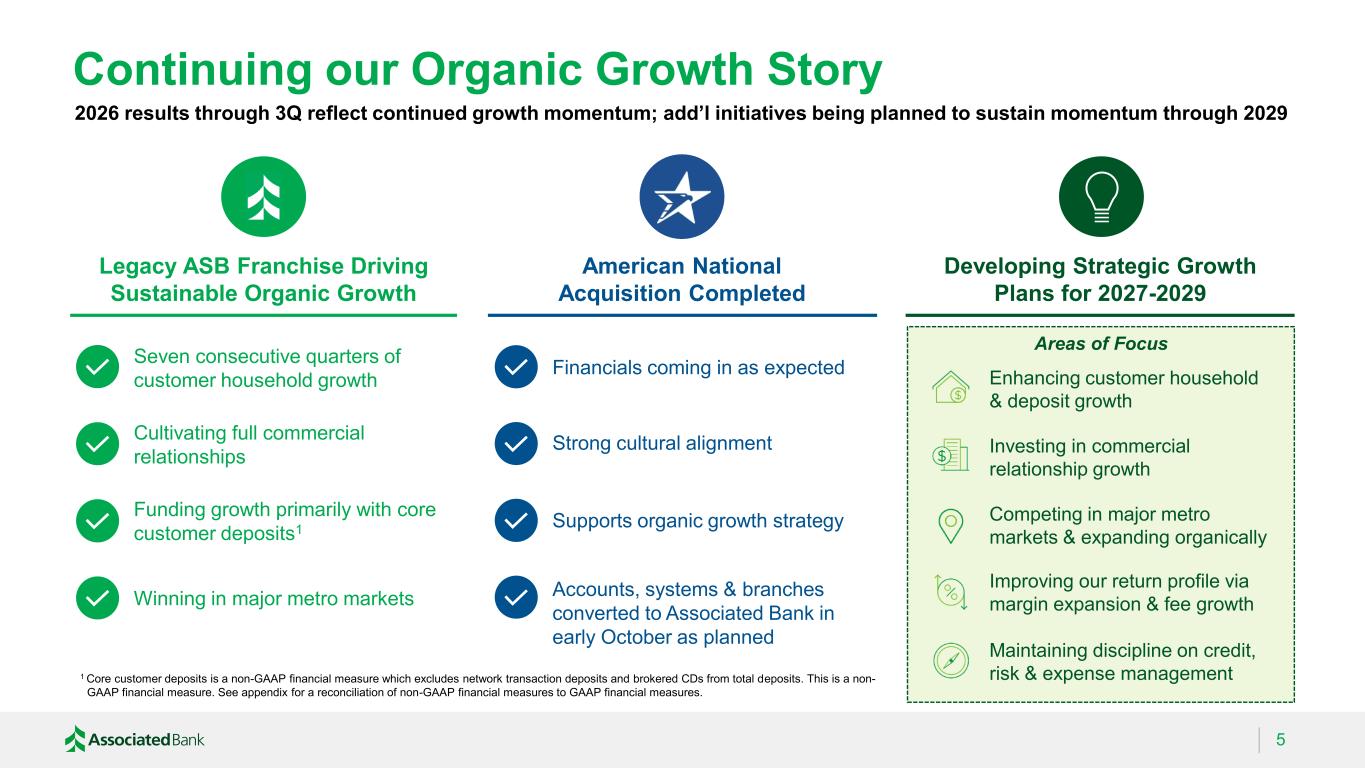
Areas of Focus Continuing our Organic Growth Story 5 2026 results through 3Q reflect continued growth momentum; add’l initiatives being planned to sustain momentum through 2029 Legacy ASB Franchise Driving Sustainable Organic Growth American National Acquisition Completed Developing Strategic Growth Plans for 2027-2029 Seven consecutive quarters of customer household growth Cultivating full commercial relationships Funding growth primarily with core customer deposits1 Winning in major metro markets Financials coming in as expected Strong cultural alignment Supports organic growth strategy Enhancing customer household & deposit growth Investing in commercial relationship growth Competing in major metro markets & expanding organically Improving our return profile via margin expansion & fee growth Maintaining discipline on credit, risk & expense management Accounts, systems & branches converted to Associated Bank in early October as planned 1 Core customer deposits is a non-GAAP financial measure which excludes network transaction deposits and brokered CDs from total deposits. This is a non- GAAP financial measure. See appendix for a reconciliation of non-GAAP financial measures to GAAP financial measures.
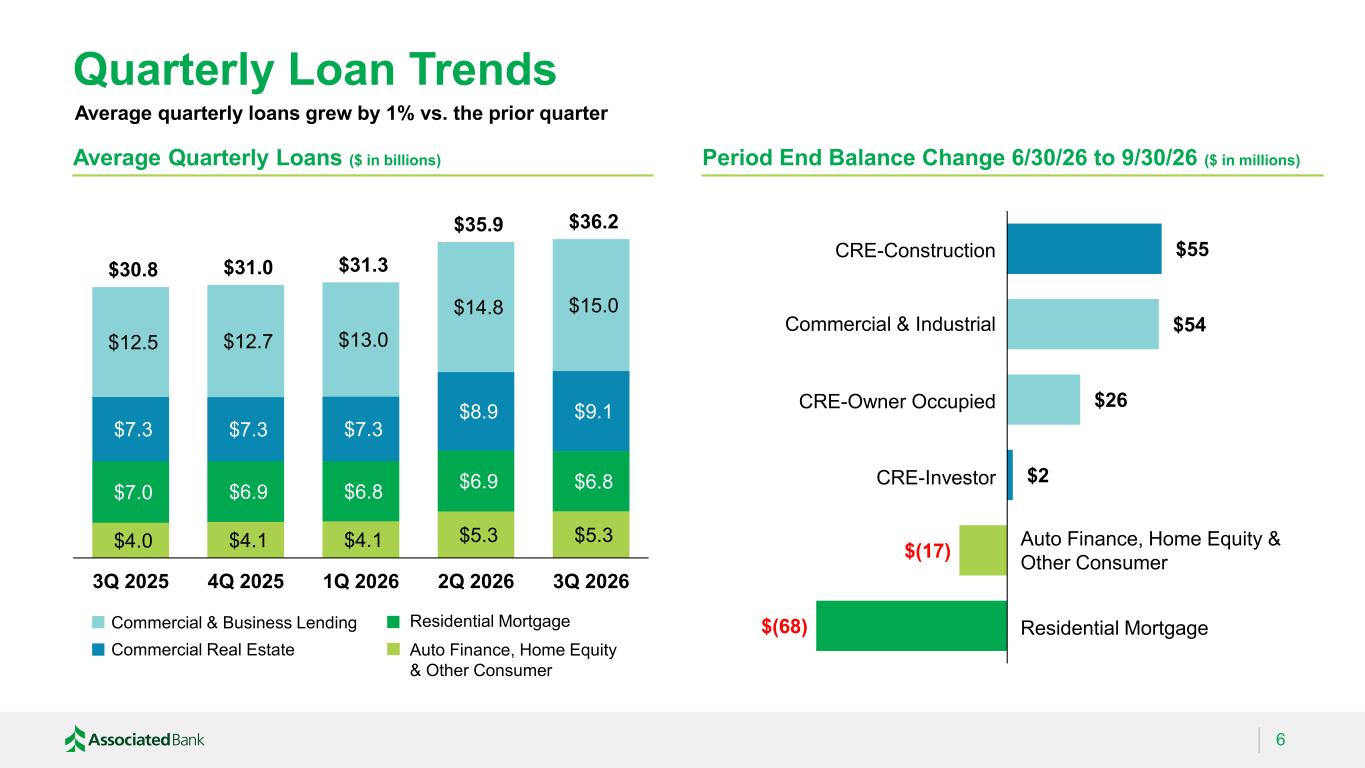
$4.0 $4.1 $4.1 $5.3 $5.3 $7.0 $6.9 $6.8 $6.9 $6.8 $7.3 $7.3 $7.3 $8.9 $9.1 $12.5 $12.7 $13.0 $14.8 $15.0 $30.8 $31.0 $31.3 $35.9 $36.2 3Q 2025 4Q 2025 1Q 2026 2Q 2026 3Q 2026 Quarterly Loan Trends 6 Average Quarterly Loans ($ in billions) Period End Balance Change 6/30/26 to 9/30/26 ($ in millions) Commercial & Business Lending Commercial Real Estate Residential Mortgage Auto Finance, Home Equity & Other Consumer Average quarterly loans grew by 1% vs. the prior quarter $(68) $(17) $2 $26 $54 $55 CRE-Construction Auto Finance, Home Equity & Other Consumer Commercial & Industrial Residential Mortgage CRE-Owner Occupied CRE-Investor
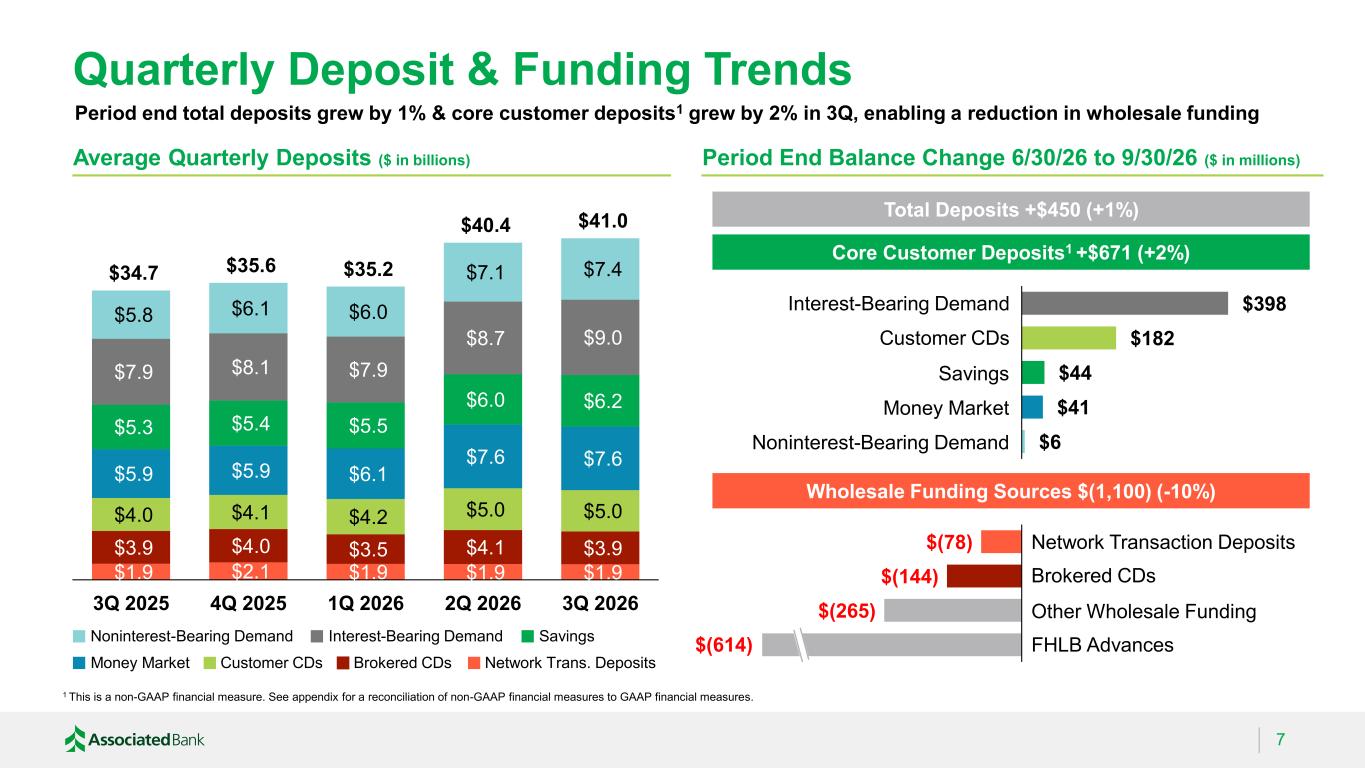
$1.9 $2.1 $1.9 $1.9 $1.9 $3.9 $4.0 $3.5 $4.1 $3.9 $4.0 $4.1 $4.2 $5.0 $5.0 $5.9 $5.9 $6.1 $7.6 $7.6 $5.3 $5.4 $5.5 $6.0 $6.2 $7.9 $8.1 $7.9 $8.7 $9.0 $5.8 $6.1 $6.0 $7.1 $7.4 $34.7 $35.6 $35.2 $40.4 $41.0 3Q 2025 4Q 2025 1Q 2026 2Q 2026 3Q 2026 Quarterly Deposit & Funding Trends 7 Average Quarterly Deposits ($ in billions) 1 This is a non-GAAP financial measure. See appendix for a reconciliation of non-GAAP financial measures to GAAP financial measures. Customer CDs Savings Money Market Network Trans. Deposits Noninterest-Bearing Demand Interest-Bearing Demand Brokered CDs Period End Balance Change 6/30/26 to 9/30/26 ($ in millions) Period end total deposits grew by 1% & core customer deposits1 grew by 2% in 3Q, enabling a reduction in wholesale funding $(265) $(144) $(78) $6 $41 $44 $182 $398 Customer CDs FHLB Advances Core Customer Deposits1 +$671 (+2%) Wholesale Funding Sources $(1,100) (-10%) Total Deposits +$450 (+1%) Interest-Bearing Demand Savings Money Market Other Wholesale Funding Brokered CDs Network Transaction Deposits $(614) Noninterest-Bearing Demand
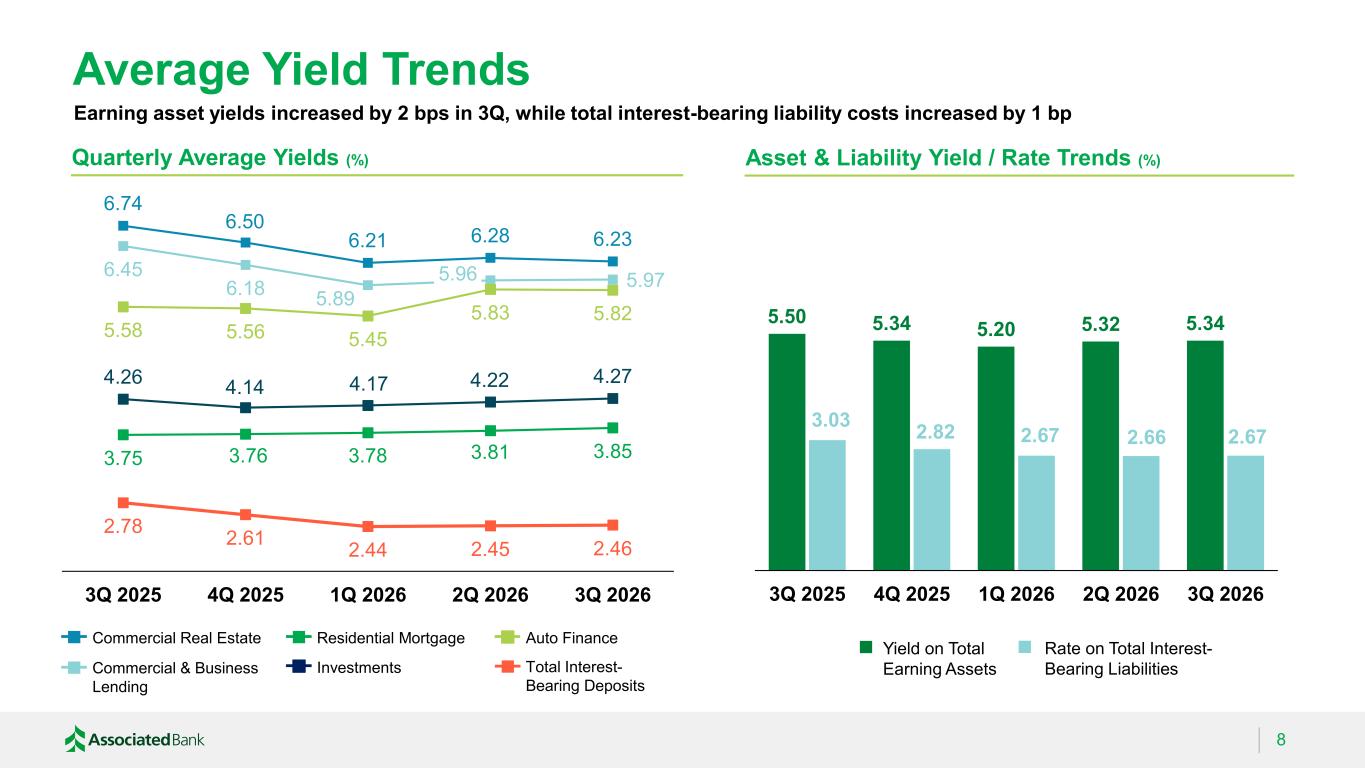
Average Yield Trends 8 Quarterly Average Yields (%) 6.74 6.50 6.21 6.28 6.23 6.45 6.18 5.89 5.96 5.97 5.58 5.56 5.45 5.83 5.82 3.75 3.76 3.78 3.81 3.85 4.26 4.14 4.17 4.22 4.27 2.78 2.61 2.44 2.45 2.46 3Q 2025 4Q 2025 1Q 2026 2Q 2026 3Q 2026 Residential Mortgage Commercial & Business Lending Commercial Real Estate Total Interest- Bearing Deposits Auto Finance Asset & Liability Yield / Rate Trends (%) Rate on Total Interest- Bearing Liabilities Yield on Total Earning Assets 5.50 5.34 5.20 5.32 5.34 3.03 2.82 2.67 2.66 2.67 3Q 2025 4Q 2025 1Q 2026 2Q 2026 3Q 2026 Investments Earning asset yields increased by 2 bps in 3Q, while total interest-bearing liability costs increased by 1 bp
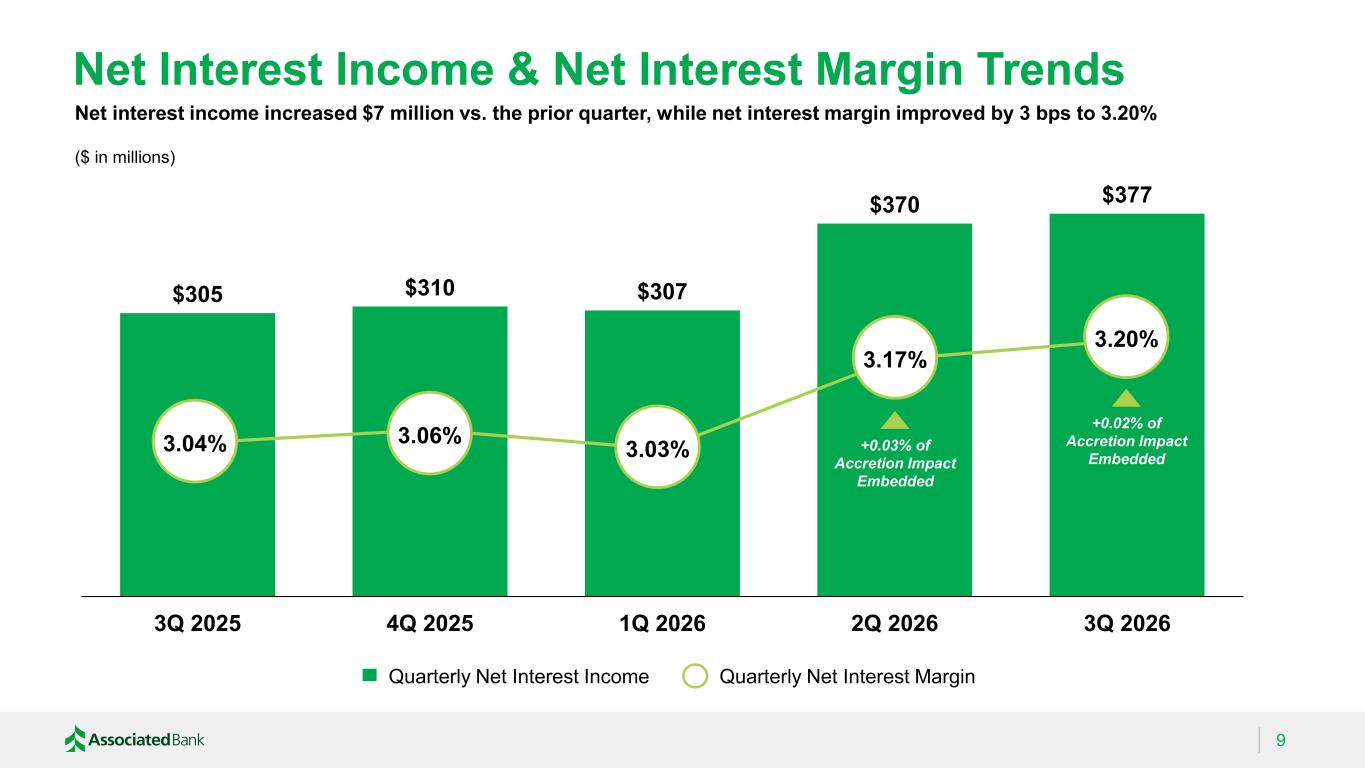
Net Interest Income & Net Interest Margin Trends 9 $305 $310 $307 $370 $377 3Q 2025 4Q 2025 1Q 2026 2Q 2026 3Q 2026 3.04% Quarterly Net Interest Income Quarterly Net Interest Margin 3.06% 3.03% 3.17% 3.20% Net interest income increased $7 million vs. the prior quarter, while net interest margin improved by 3 bps to 3.20% ($ in millions) +0.03% of Accretion Impact Embedded +0.02% of Accretion Impact Embedded
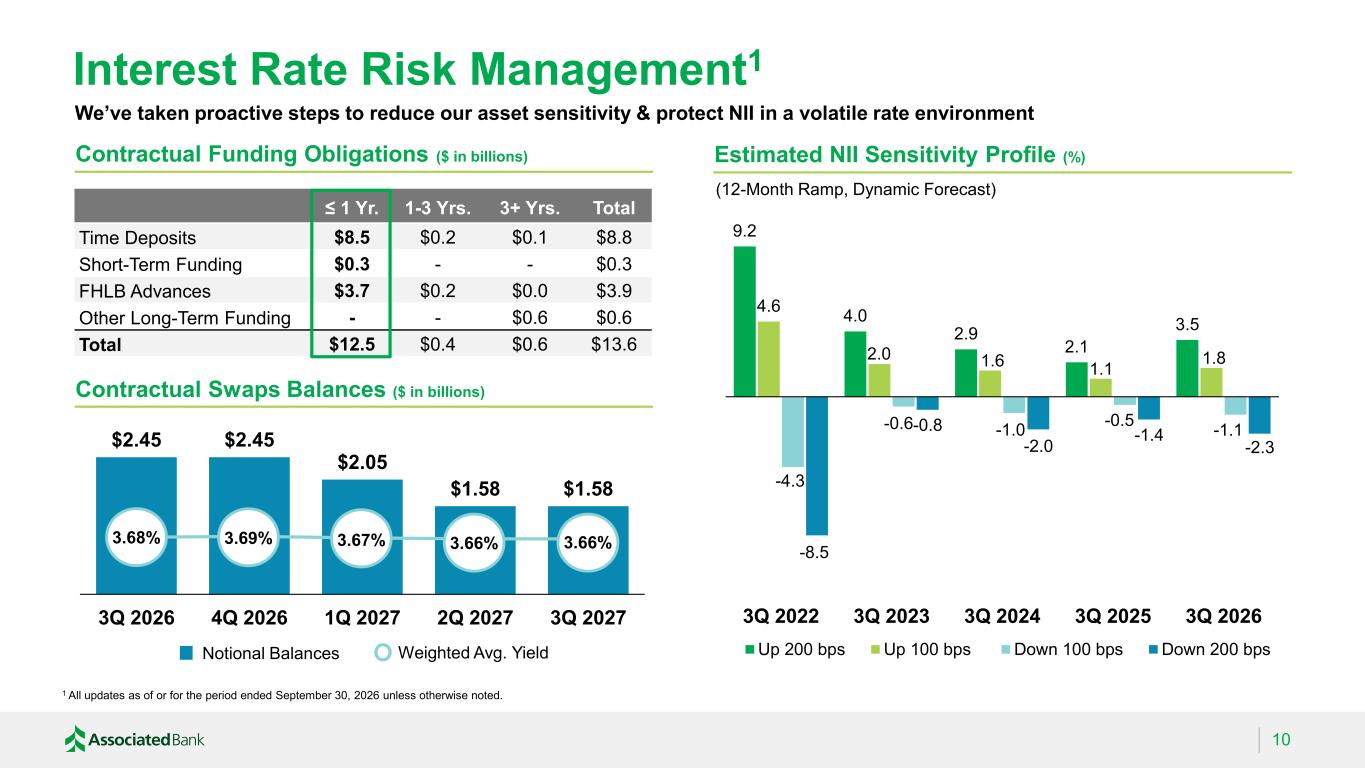
Interest Rate Risk Management1 10 Contractual Funding Obligations ($ in billions) Contractual Swaps Balances ($ in billions) Estimated NII Sensitivity Profile (%) 9.2 4.0 2.9 2.1 3.5 4.6 2.0 1.6 1.1 1.8 -4.3 -0.6 -1.0 -0.5 -1.1 -8.5 -0.8 -2.0 -1.4 -2.3 3Q 2022 3Q 2023 3Q 2024 3Q 2025 3Q 2026 Up 200 bps Up 100 bps Down 100 bps Down 200 bps (12-Month Ramp, Dynamic Forecast) $2.45 $2.45 $2.05 $1.58 $1.58 3Q 2026 4Q 2026 1Q 2027 2Q 2027 3Q 2027 ≤ 1 Yr. 1-3 Yrs. 3+ Yrs. Total Time Deposits $8.5 $0.2 $0.1 $8.8 Short-Term Funding $0.3 - - $0.3 FHLB Advances $3.7 $0.2 $0.0 $3.9 Other Long-Term Funding - - $0.6 $0.6 Total $12.5 $0.4 $0.6 $13.6 3.66%3.67%3.69%3.68% 3.66% Notional Balances Weighted Avg. Yield 1 All updates as of or for the period ended September 30, 2026 unless otherwise noted. We’ve taken proactive steps to reduce our asset sensitivity & protect NII in a volatile rate environment
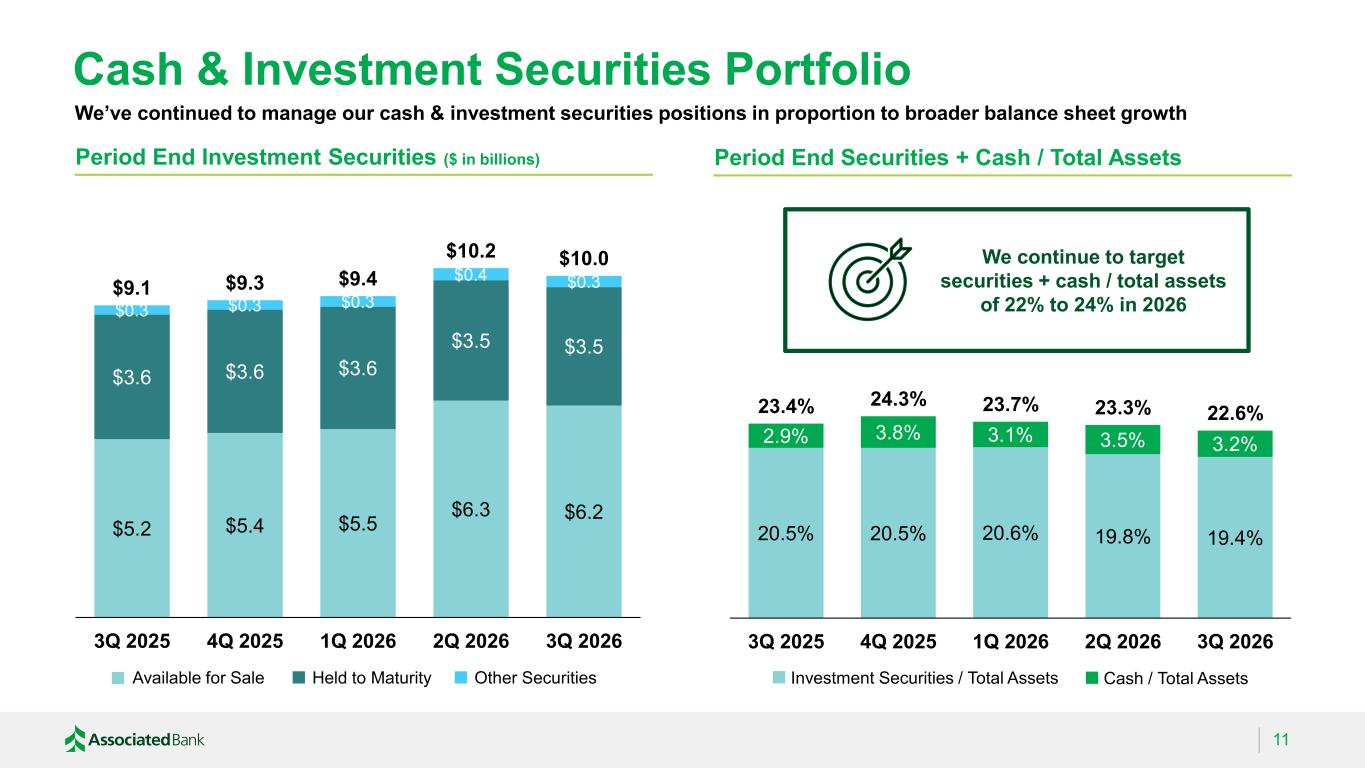
Cash & Investment Securities Portfolio 11 Period End Investment Securities ($ in billions) Period End Securities + Cash / Total Assets $5.2 $5.4 $5.5 $6.3 $6.2 $3.6 $3.6 $3.6 $3.5 $3.5 $0.3 $0.3 $0.3 $0.4 $0.3$9.1 $9.3 $9.4 $10.2 $10.0 3Q 2025 4Q 2025 1Q 2026 2Q 2026 3Q 2026 Held to MaturityAvailable for Sale Other Securities 20.5% 20.5% 20.6% 19.8% 19.4% 2.9% 3.8% 3.1% 3.5% 3.2% 23.4% 24.3% 23.7% 23.3% 22.6% 3Q 2025 4Q 2025 1Q 2026 2Q 2026 3Q 2026 Investment Securities / Total Assets Cash / Total Assets We continue to target securities + cash / total assets of 22% to 24% in 2026 We’ve continued to manage our cash & investment securities positions in proportion to broader balance sheet growth
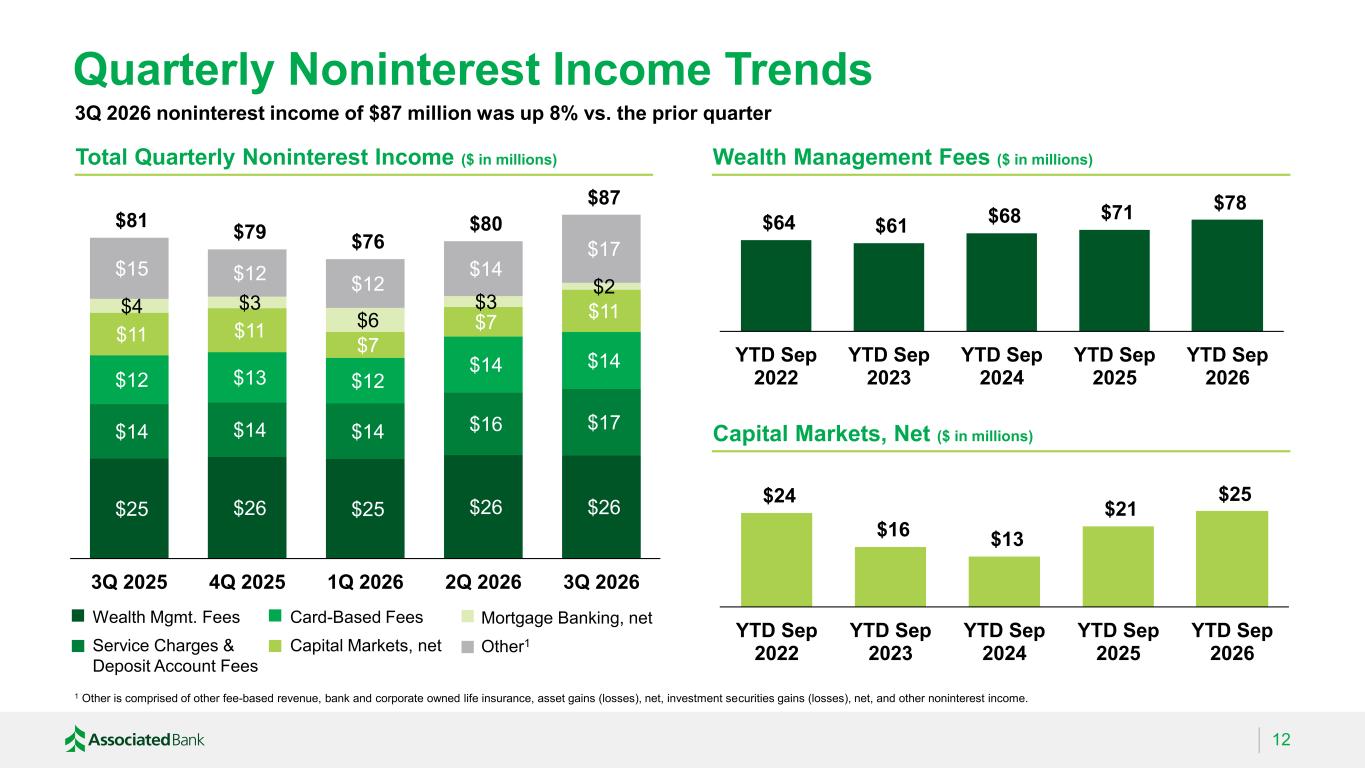
$25 $26 $25 $26 $26 $14 $14 $14 $16 $17 $12 $13 $12 $14 $14 $11 $11 $7 $7 $11 $4 $3 $6 $3 $2 $15 $12 $12 $14 $17 $81 $79 $76 $80 $87 3Q 2025 4Q 2025 1Q 2026 2Q 2026 3Q 2026 Quarterly Noninterest Income Trends 12 Wealth Mgmt. Fees Capital Markets, net Other1 Mortgage Banking, net Service Charges & Deposit Account Fees Card-Based Fees 1 Other is comprised of other fee-based revenue, bank and corporate owned life insurance, asset gains (losses), net, investment securities gains (losses), net, and other noninterest income. Capital Markets, Net ($ in millions) $24 $16 $13 $21 $25 YTD Sep 2022 YTD Sep 2023 YTD Sep 2024 YTD Sep 2025 YTD Sep 2026 $64 $61 $68 $71 $78 YTD Sep 2022 YTD Sep 2023 YTD Sep 2024 YTD Sep 2025 YTD Sep 2026 Wealth Management Fees ($ in millions)Total Quarterly Noninterest Income ($ in millions) 3Q 2026 noninterest income of $87 million was up 8% vs. the prior quarter
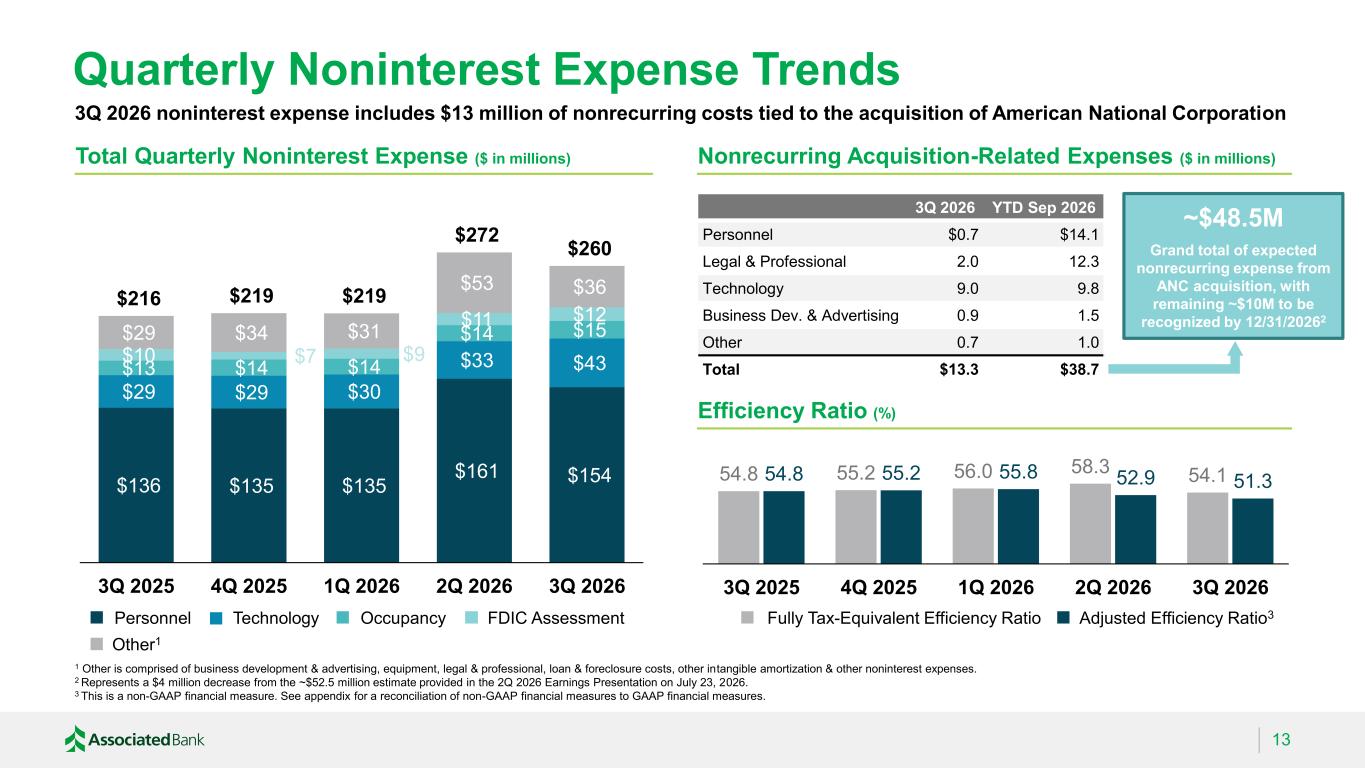
54.8 55.2 56.0 58.3 54.154.8 55.2 55.8 52.9 51.3 3Q 2025 4Q 2025 1Q 2026 2Q 2026 3Q 2026 Quarterly Noninterest Expense Trends 13 Total Quarterly Noninterest Expense ($ in millions) Efficiency Ratio (%) $136 $135 $135 $161 $154 $29 $29 $30 $33 $43 $13 $14 $14 $14 $15 $10 $7 $9 $11 $12 $29 $34 $31 $53 $36 $216 $219 $219 $272 $260 3Q 2025 4Q 2025 1Q 2026 2Q 2026 3Q 2026 Personnel Other1 Technology FDIC AssessmentOccupancy Adjusted Efficiency Ratio3Fully Tax-Equivalent Efficiency Ratio 1 Other is comprised of business development & advertising, equipment, legal & professional, loan & foreclosure costs, other intangible amortization & other noninterest expenses. 2 Represents a $4 million decrease from the ~$52.5 million estimate provided in the 2Q 2026 Earnings Presentation on July 23, 2026. 3 This is a non-GAAP financial measure. See appendix for a reconciliation of non-GAAP financial measures to GAAP financial measures. 3Q 2026 noninterest expense includes $13 million of nonrecurring costs tied to the acquisition of American National Corporation 3Q 2026 YTD Sep 2026 Personnel $0.7 $14.1 Legal & Professional 2.0 12.3 Technology 9.0 9.8 Business Dev. & Advertising 0.9 1.5 Other 0.7 1.0 Total $13.3 $38.7 Nonrecurring Acquisition-Related Expenses ($ in millions) ~$48.5M Grand total of expected nonrecurring expense from ANC acquisition, with remaining ~$10M to be recognized by 12/31/20262
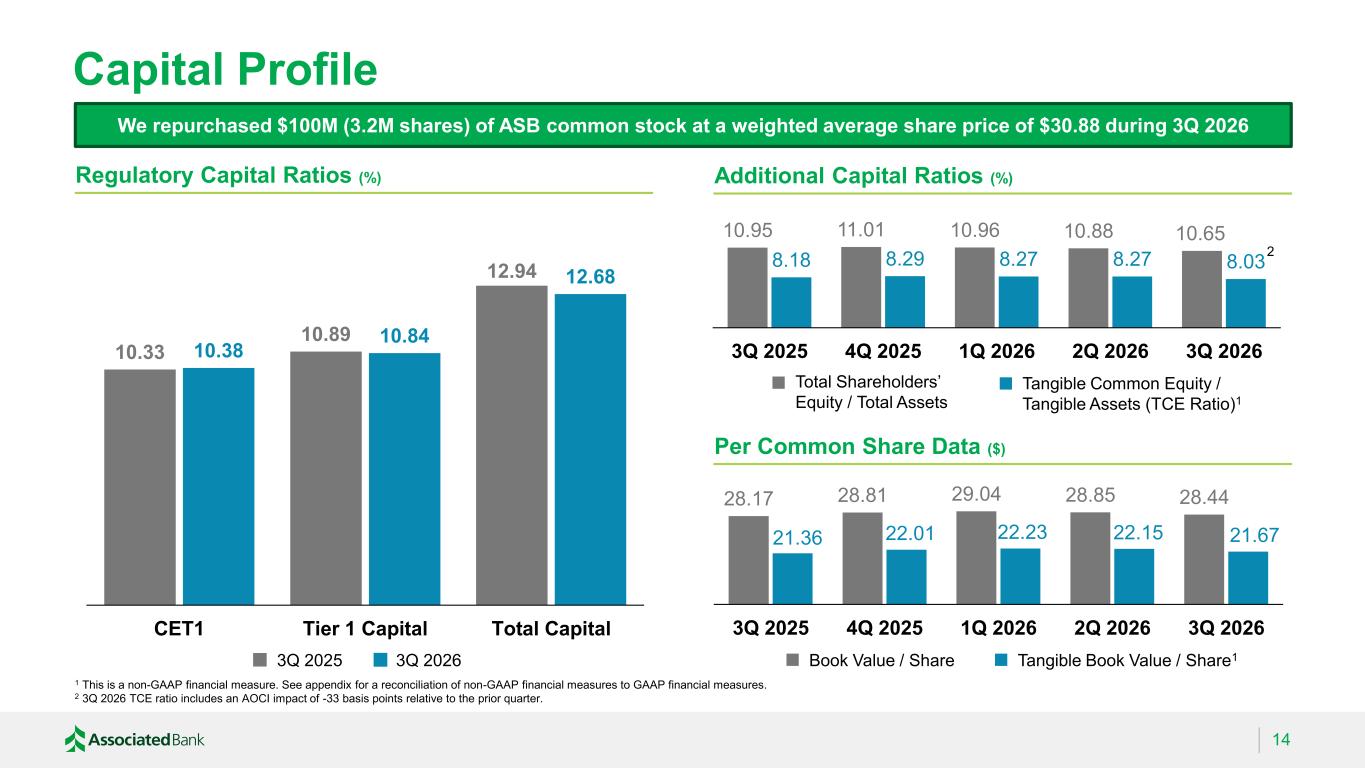
Capital Profile 14 Additional Capital Ratios (%) Per Common Share Data ($) 1 This is a non-GAAP financial measure. See appendix for a reconciliation of non-GAAP financial measures to GAAP financial measures. 2 3Q 2026 TCE ratio includes an AOCI impact of -33 basis points relative to the prior quarter. 28.17 28.81 29.04 28.85 28.44 21.36 22.01 22.23 22.15 21.67 3Q 2025 4Q 2025 1Q 2026 2Q 2026 3Q 2026 Tangible Common Equity / Tangible Assets (TCE Ratio)1 Total Shareholders’ Equity / Total Assets 10.95 11.01 10.96 10.88 10.65 8.18 8.29 8.27 8.27 8.03 3Q 2025 4Q 2025 1Q 2026 2Q 2026 3Q 2026 Tangible Book Value / Share1Book Value / Share Regulatory Capital Ratios (%) 10.33 10.89 12.94 10.38 10.84 12.68 CET1 Tier 1 Capital Total Capital 3Q 2025 3Q 2026 We repurchased $100M (3.2M shares) of ASB common stock at a weighted average share price of $30.88 during 3Q 2026 2
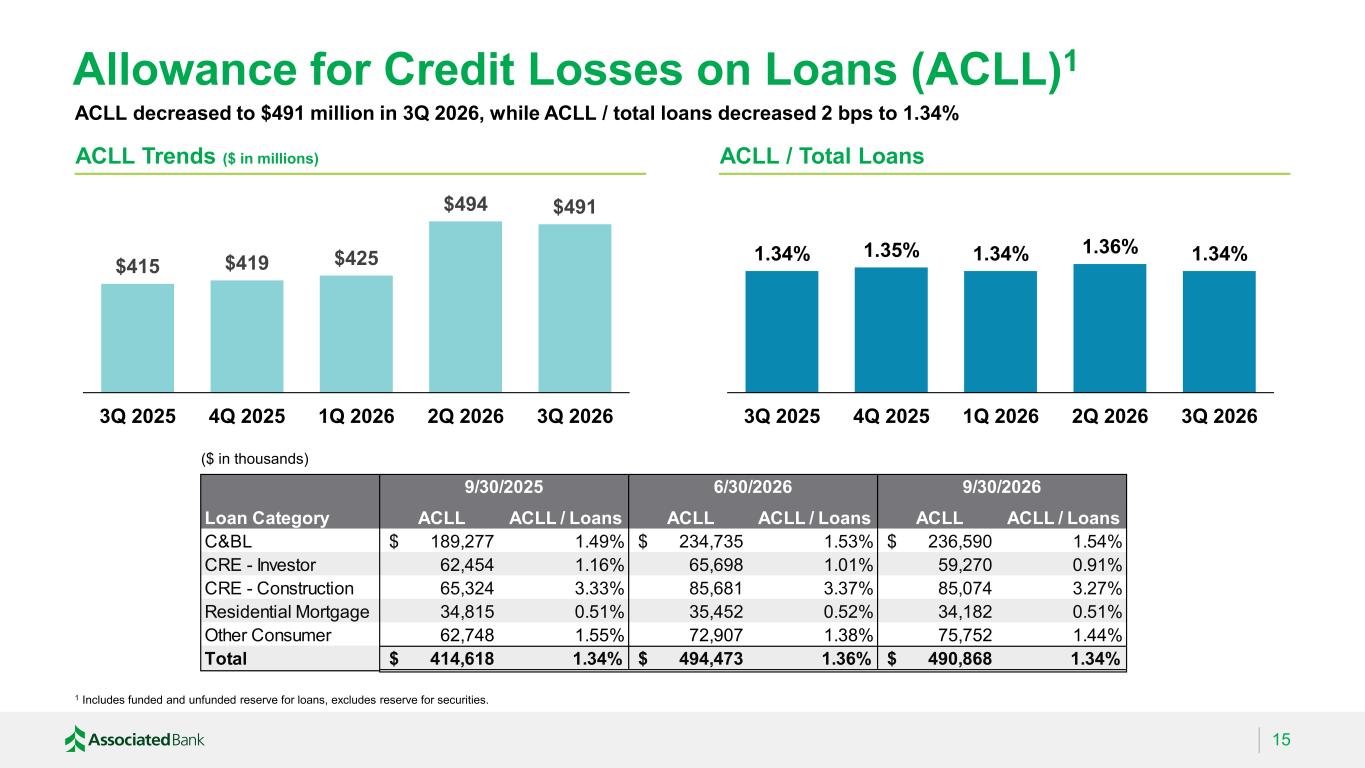
Loan Category ACLL ACLL / Loans ACLL ACLL / Loans ACLL ACLL / Loans C&BL 189,277$ 1.49% 234,735$ 1.53% 236,590$ 1.54% CRE - Investor 62,454 1.16% 65,698 1.01% 59,270 0.91% CRE - Construction 65,324 3.33% 85,681 3.37% 85,074 3.27% Residential Mortgage 34,815 0.51% 35,452 0.52% 34,182 0.51% Other Consumer 62,748 1.55% 72,907 1.38% 75,752 1.44% Total 414,618$ 1.34% 494,473$ 1.36% 490,868$ 1.34% 6/30/2026 9/30/20269/30/2025 $415 $419 $425 $494 $491 3Q 2025 4Q 2025 1Q 2026 2Q 2026 3Q 2026 Allowance for Credit Losses on Loans (ACLL)1 15 ACLL Trends ($ in millions) 1 Includes funded and unfunded reserve for loans, excludes reserve for securities. ($ in thousands) 1.34% 1.35% 1.34% 1.36% 1.34% 3Q 2025 4Q 2025 1Q 2026 2Q 2026 3Q 2026 ACLL / Total Loans ACLL decreased to $491 million in 3Q 2026, while ACLL / total loans decreased 2 bps to 1.34%
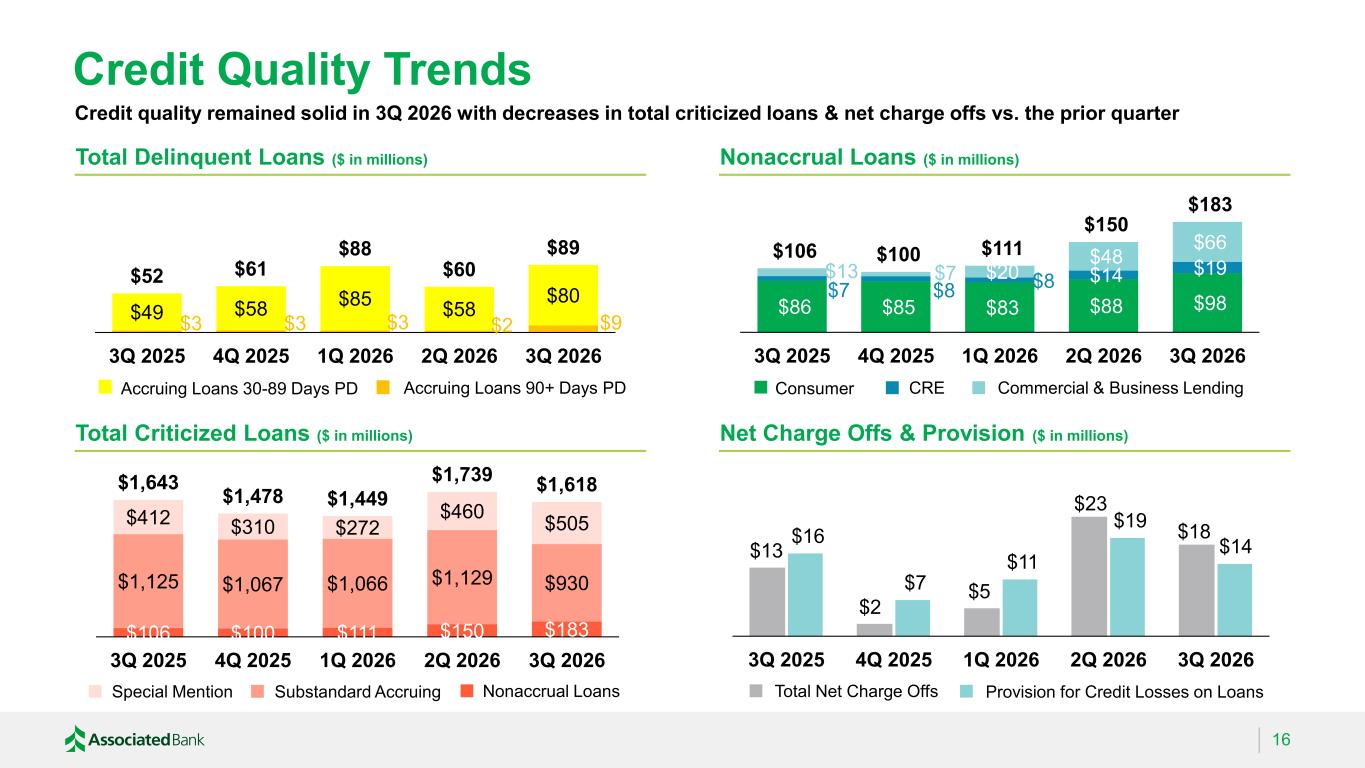
Credit Quality Trends 16 Total Delinquent Loans ($ in millions) Nonaccrual Loans ($ in millions) Total Criticized Loans ($ in millions) Net Charge Offs & Provision ($ in millions) $3 $3 $3 $2 $9 $49 $58 $85 $58 $80 $52 $61 $88 $60 $89 3Q 2025 4Q 2025 1Q 2026 2Q 2026 3Q 2026 Accruing Loans 30-89 Days PD $13 $2 $5 $23 $18 $16 $7 $11 $19 $14 3Q 2025 4Q 2025 1Q 2026 2Q 2026 3Q 2026 Total Net Charge Offs Provision for Credit Losses on Loans Accruing Loans 90+ Days PD $106 $100 $111 $150 $183 $1,125 $1,067 $1,066 $1,129 $930 $412 $310 $272 $460 $505 $1,643 $1,478 $1,449 $1,739 $1,618 3Q 2025 4Q 2025 1Q 2026 2Q 2026 3Q 2026 $86 $85 $83 $88 $98 $7 $8 $8 $14 $19 $13 $7 $20 $48 $66 $106 $100 $111 $150 $183 3Q 2025 4Q 2025 1Q 2026 2Q 2026 3Q 2026 CREConsumer Commercial & Business Lending Substandard AccruingSpecial Mention Nonaccrual Loans Credit quality remained solid in 3Q 2026 with decreases in total criticized loans & net charge offs vs. the prior quarter
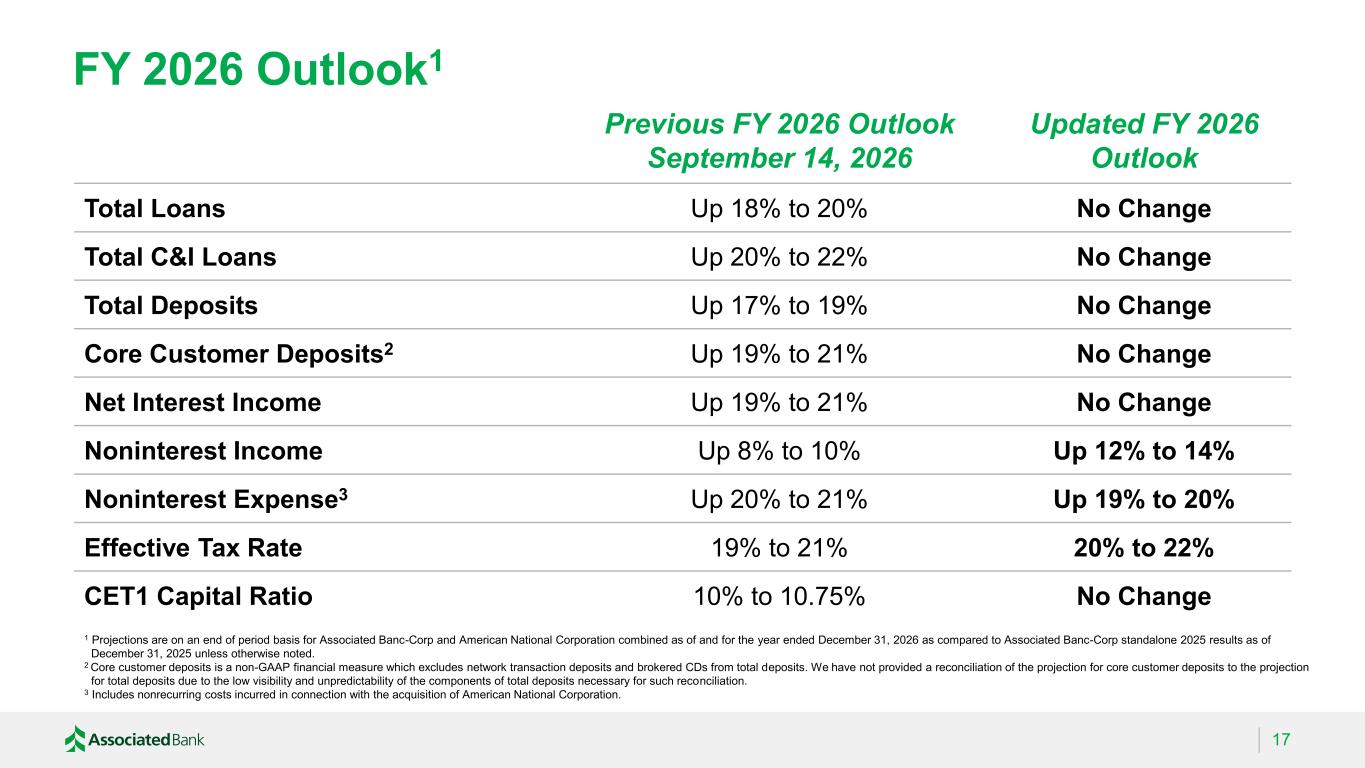
FY 2026 Outlook1 17 Previous FY 2026 Outlook September 14, 2026 Updated FY 2026 Outlook Total Loans Up 18% to 20% No Change Total C&I Loans Up 20% to 22% No Change Total Deposits Up 17% to 19% No Change Core Customer Deposits2 Up 19% to 21% No Change Net Interest Income Up 19% to 21% No Change Noninterest Income Up 8% to 10% Up 12% to 14% Noninterest Expense3 Up 20% to 21% Up 19% to 20% Effective Tax Rate 19% to 21% 20% to 22% CET1 Capital Ratio 10% to 10.75% No Change 1 Projections are on an end of period basis for Associated Banc-Corp and American National Corporation combined as of and for the year ended December 31, 2026 as compared to Associated Banc-Corp standalone 2025 results as of December 31, 2025 unless otherwise noted. 2 Core customer deposits is a non-GAAP financial measure which excludes network transaction deposits and brokered CDs from total deposits. We have not provided a reconciliation of the projection for core customer deposits to the projection for total deposits due to the low visibility and unpredictability of the components of total deposits necessary for such reconciliation. 3 Includes nonrecurring costs incurred in connection with the acquisition of American National Corporation.
Appendix Minneapolis, MN
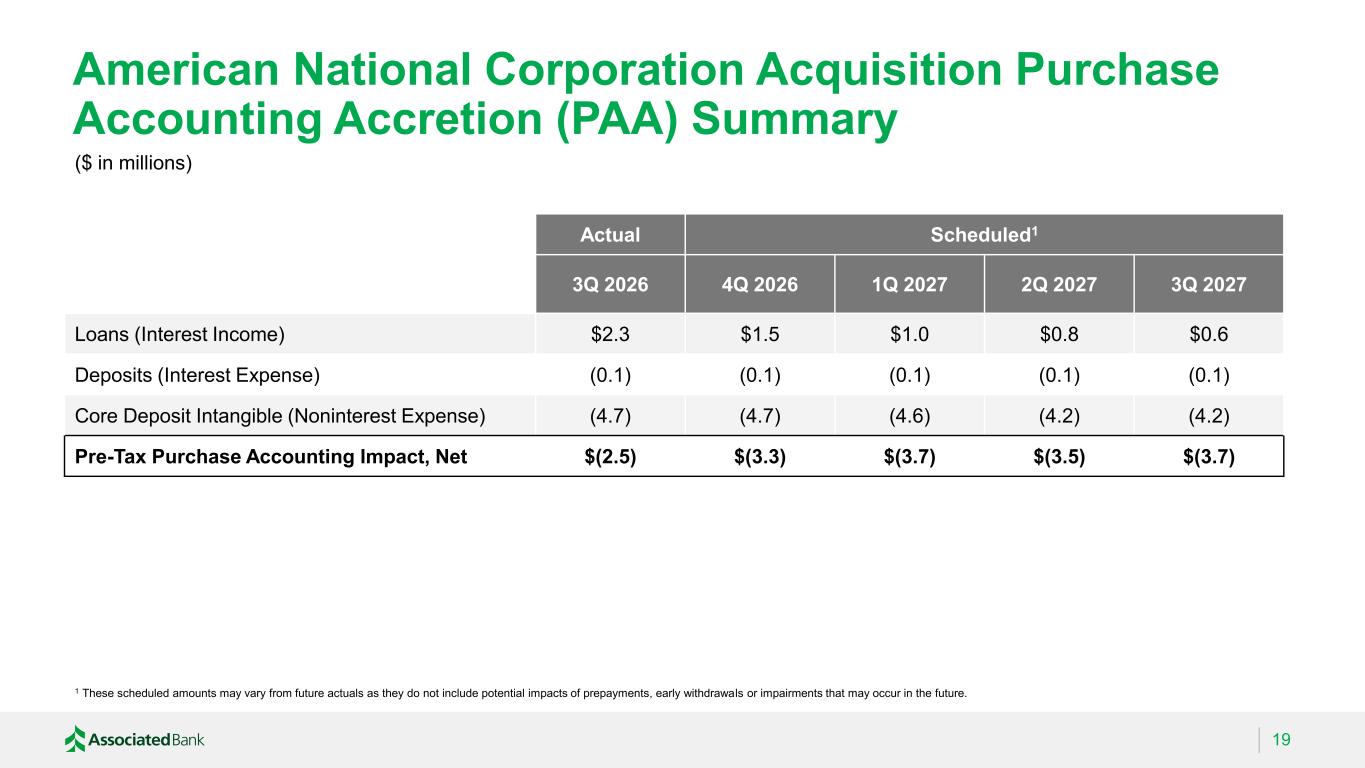
American National Corporation Acquisition Purchase Accounting Accretion (PAA) Summary 19 Actual Scheduled1 3Q 2026 4Q 2026 1Q 2027 2Q 2027 3Q 2027 Loans (Interest Income) $2.3 $1.5 $1.0 $0.8 $0.6 Deposits (Interest Expense) (0.1) (0.1) (0.1) (0.1) (0.1) Core Deposit Intangible (Noninterest Expense) (4.7) (4.7) (4.6) (4.2) (4.2) Pre-Tax Purchase Accounting Impact, Net $(2.5) $(3.3) $(3.7) $(3.5) $(3.7) ($ in millions) 1 These scheduled amounts may vary from future actuals as they do not include potential impacts of prepayments, early withdrawals or impairments that may occur in the future.
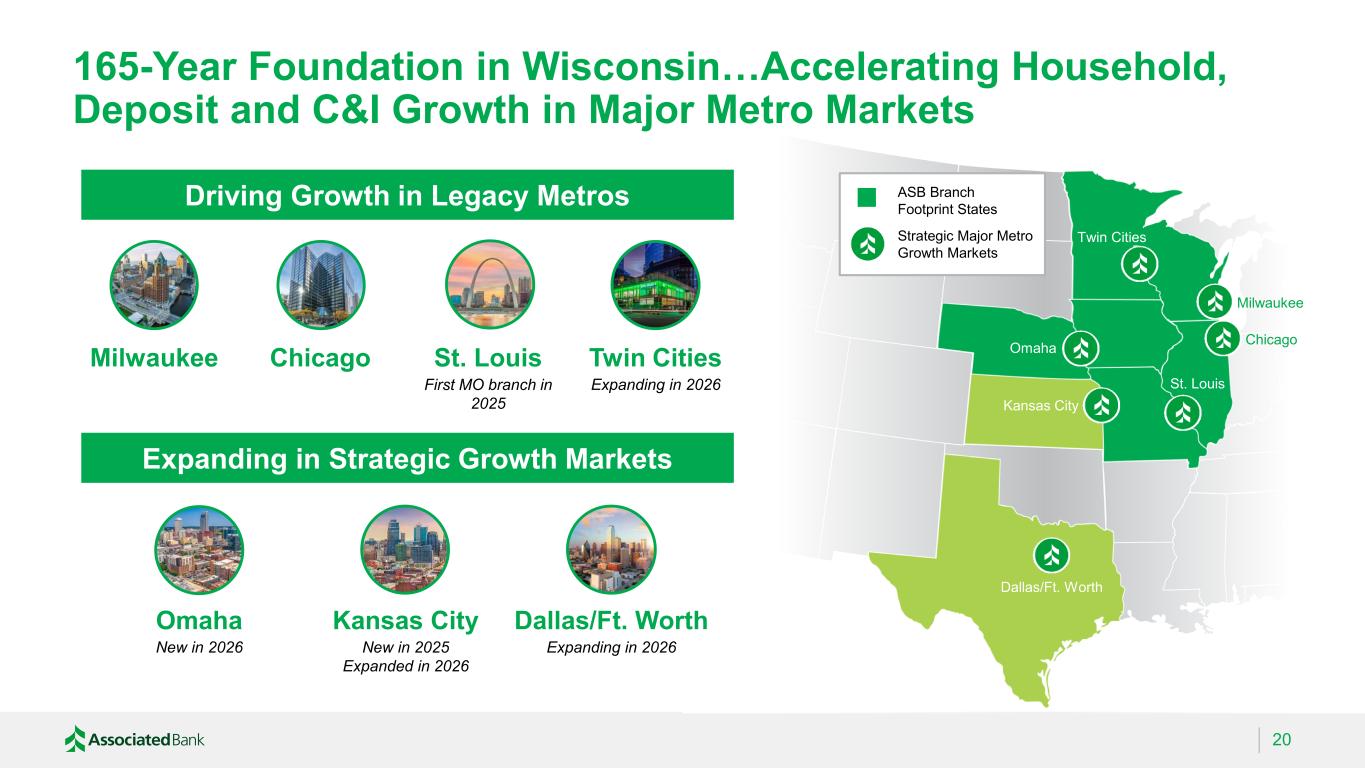
Twin Cities 165-Year Foundation in Wisconsin…Accelerating Household, Deposit and C&I Growth in Major Metro Markets 20 ASB Branch Footprint States Strategic Major Metro Growth Markets Milwaukee Chicago Omaha St. Louis Kansas City Dallas/Ft. Worth Driving Growth in Legacy Metros Expanding in Strategic Growth Markets Milwaukee Chicago Twin Cities Omaha Kansas City Dallas/Ft. Worth Expanding in 2026 New in 2026 New in 2025 Expanded in 2026 Expanding in 2026 St. Louis First MO branch in 2025
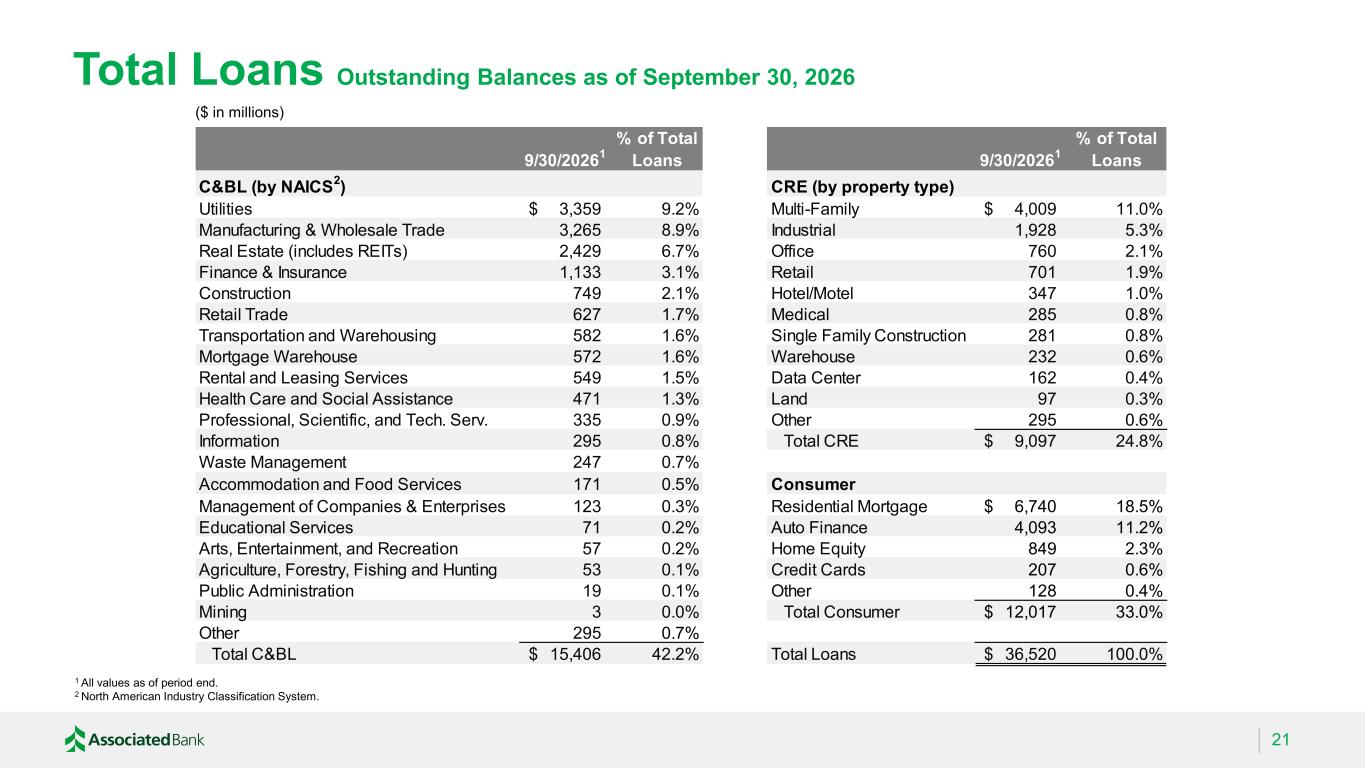
9/30/2026 1 % of Total Loans 9/30/2026 1 % of Total Loans C&BL (by NAICS 2 ) CRE (by property type) Utilities 3,359$ 9.2% Multi-Family 4,009$ 11.0% Manufacturing & Wholesale Trade 3,265 8.9% Industrial 1,928 5.3% Real Estate (includes REITs) 2,429 6.7% Office 760 2.1% Finance & Insurance 1,133 3.1% Retail 701 1.9% Construction 749 2.1% Hotel/Motel 347 1.0% Retail Trade 627 1.7% Medical 285 0.8% Transportation and Warehousing 582 1.6% Single Family Construction 281 0.8% Mortgage Warehouse 572 1.6% Warehouse 232 0.6% Rental and Leasing Services 549 1.5% Data Center 162 0.4% Health Care and Social Assistance 471 1.3% Land 97 0.3% Professional, Scientific, and Tech. Serv. 335 0.9% Other 295 0.6% Information 295 0.8% Total CRE 9,097$ 24.8% Waste Management 247 0.7% Accommodation and Food Services 171 0.5% Consumer Management of Companies & Enterprises 123 0.3% Residential Mortgage 6,740$ 18.5% Educational Services 71 0.2% Auto Finance 4,093 11.2% Arts, Entertainment, and Recreation 57 0.2% Home Equity 849 2.3% Agriculture, Forestry, Fishing and Hunting 53 0.1% Credit Cards 207 0.6% Public Administration 19 0.1% Other 128 0.4% Mining 3 0.0% Total Consumer 12,017$ 33.0% Other 295 0.7% Total C&BL 15,406$ 42.2% Total Loans 36,520$ 100.0% Total Loans Outstanding Balances as of September 30, 2026 21 1 All values as of period end. 2 North American Industry Classification System. ($ in millions)
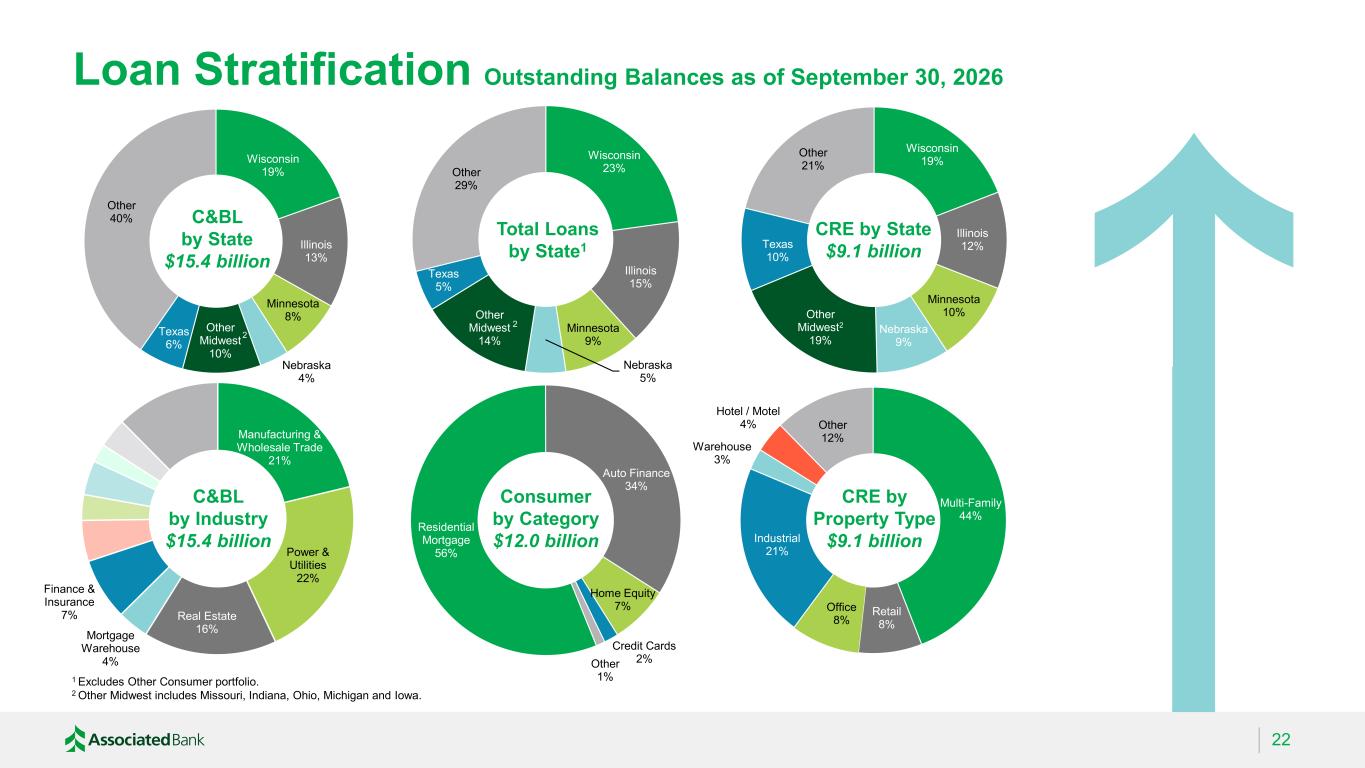
Residential Mortgage 56% Auto Finance 34% Home Equity 7% Credit Cards 2%Other 1% CRE by Property Type $9.1 billion Wisconsin 19% Illinois 12% Minnesota 10% Nebraska 9% Other Midwest2 19% Texas 10% Other 21% Loan Stratification Outstanding Balances as of September 30, 2026 22 1 Excludes Other Consumer portfolio. 2 Other Midwest includes Missouri, Indiana, Ohio, Michigan and Iowa. Multi-Family 44% Retail 8% Office 8% Industrial 21% Warehouse 3% Hotel / Motel 4% Other 12% Wisconsin 23% Illinois 15% Minnesota 9% Nebraska 5% Other Midwest 14% Texas 5% Other 29% Manufacturing & Wholesale Trade 21% Power & Utilities 22% Real Estate 16% Mortgage Warehouse 4% Finance & Insurance 7% Wisconsin 19% Illinois 13% Minnesota 8% Nebraska 4% Other Midwest 10% Texas 6% Other 40% 2 2 C&BL by State $15.4 billion Consumer by Category $12.0 billion C&BL by Industry $15.4 billion Total Loans by State1 CRE by State $9.1 billion
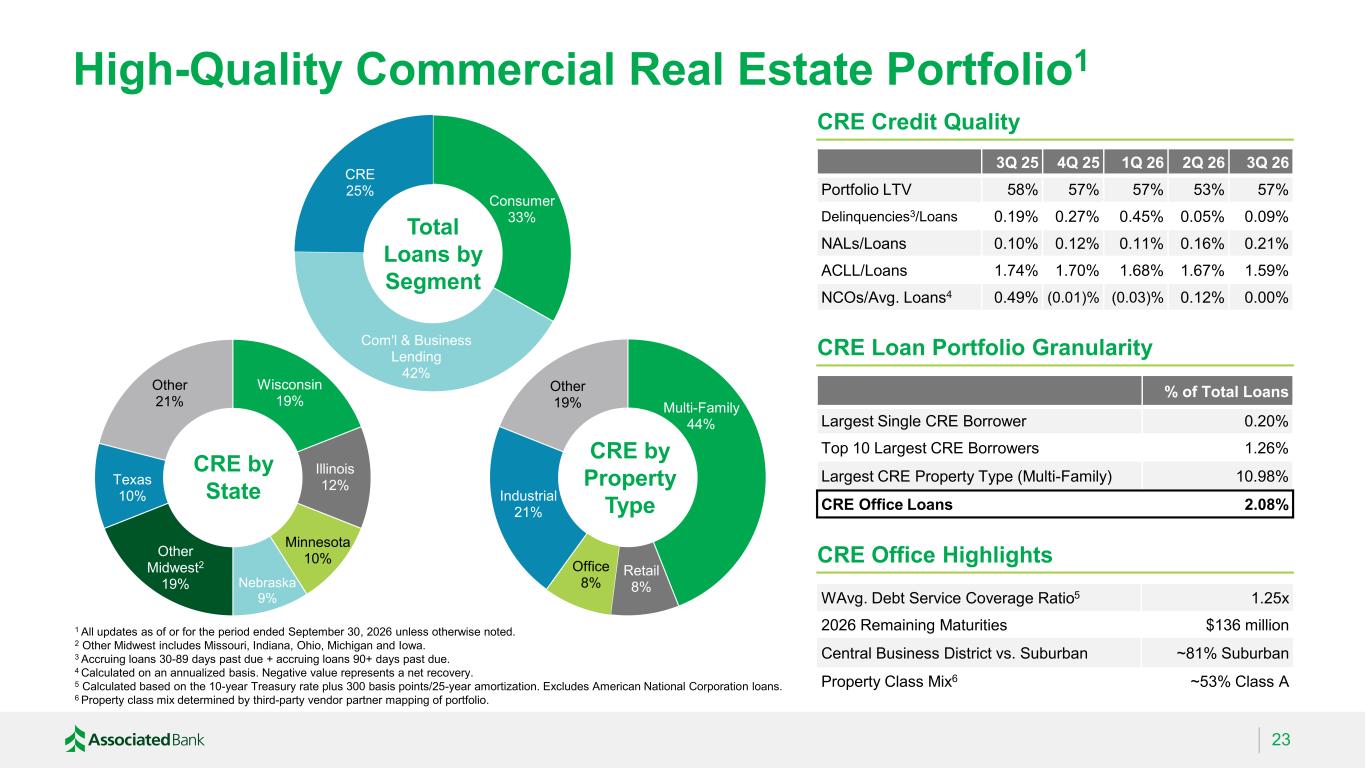
Multi-Family 44% Retail 8% Office 8% Industrial 21% Other 19% High-Quality Commercial Real Estate Portfolio1 23 3Q 25 4Q 25 1Q 26 2Q 26 3Q 26 Portfolio LTV 58% 57% 57% 53% 57% Delinquencies3/Loans 0.19% 0.27% 0.45% 0.05% 0.09% NALs/Loans 0.10% 0.12% 0.11% 0.16% 0.21% ACLL/Loans 1.74% 1.70% 1.68% 1.67% 1.59% NCOs/Avg. Loans4 0.49% (0.01)% (0.03)% 0.12% 0.00% CRE Credit Quality CRE Loan Portfolio Granularity % of Total Loans Largest Single CRE Borrower 0.20% Top 10 Largest CRE Borrowers 1.26% Largest CRE Property Type (Multi-Family) 10.98% CRE Office Loans 2.08% CRE Office Highlights WAvg. Debt Service Coverage Ratio5 1.25x 2026 Remaining Maturities $136 million Central Business District vs. Suburban ~81% Suburban Property Class Mix6 ~53% Class A Consumer 33% Com'l & Business Lending 42% CRE 25% Total Loans by Segment Wisconsin 19% Illinois 12% Minnesota 10% Nebraska 9% Other Midwest2 19% Texas 10% Other 21% CRE by State CRE by Property Type 1 All updates as of or for the period ended September 30, 2026 unless otherwise noted. 2 Other Midwest includes Missouri, Indiana, Ohio, Michigan and Iowa. 3 Accruing loans 30-89 days past due + accruing loans 90+ days past due. 4 Calculated on an annualized basis. Negative value represents a net recovery. 5 Calculated based on the 10-year Treasury rate plus 300 basis points/25-year amortization. Excludes American National Corporation loans. 6 Property class mix determined by third-party vendor partner mapping of portfolio.
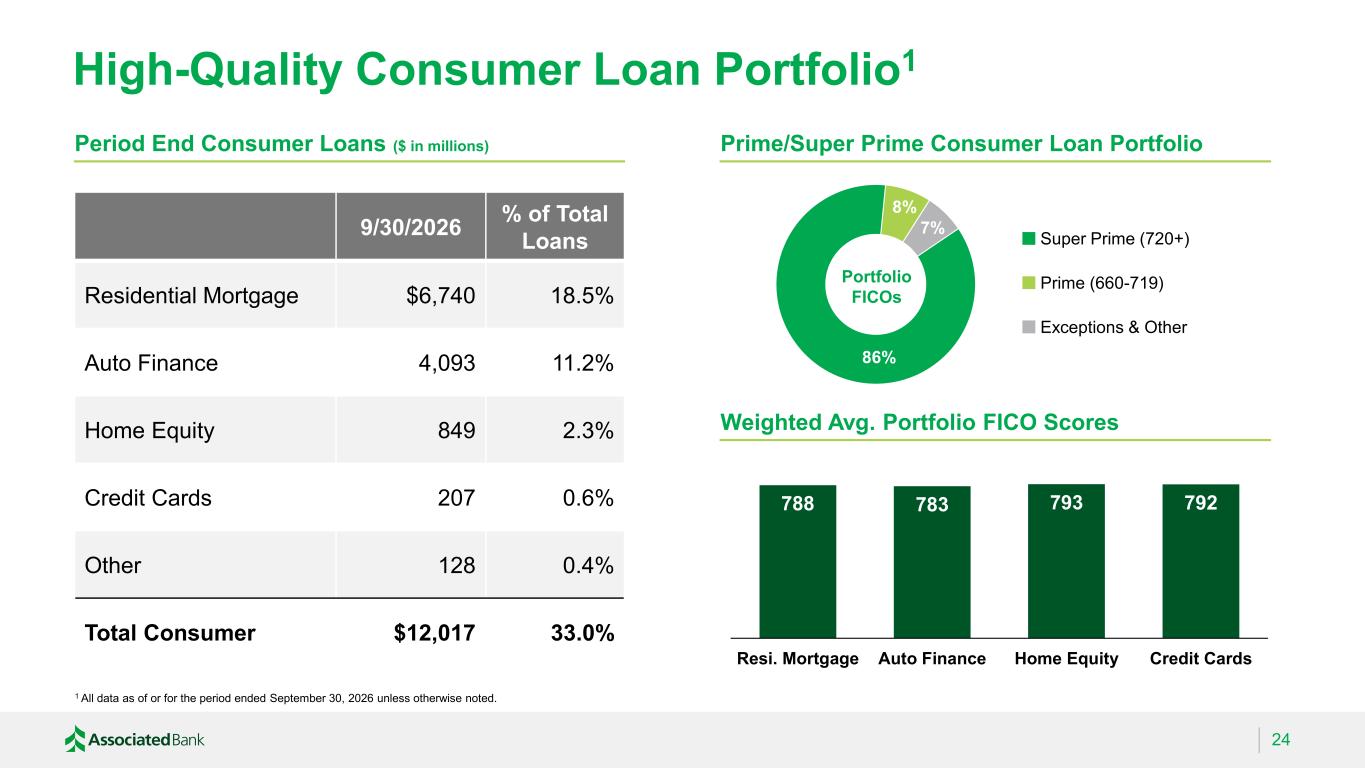
High-Quality Consumer Loan Portfolio1 24 1 All data as of or for the period ended September 30, 2026 unless otherwise noted. 9/30/2026 % of Total Loans Residential Mortgage $6,740 18.5% Auto Finance 4,093 11.2% Home Equity 849 2.3% Credit Cards 207 0.6% Other 128 0.4% Total Consumer $12,017 33.0% Prime/Super Prime Consumer Loan Portfolio 788 783 793 792 Resi. Mortgage Auto Finance Home Equity Credit Cards Weighted Avg. Portfolio FICO Scores 86% 8% 7% Portfolio FICOs Prime (660-719) Super Prime (720+) Exceptions & Other Period End Consumer Loans ($ in millions)
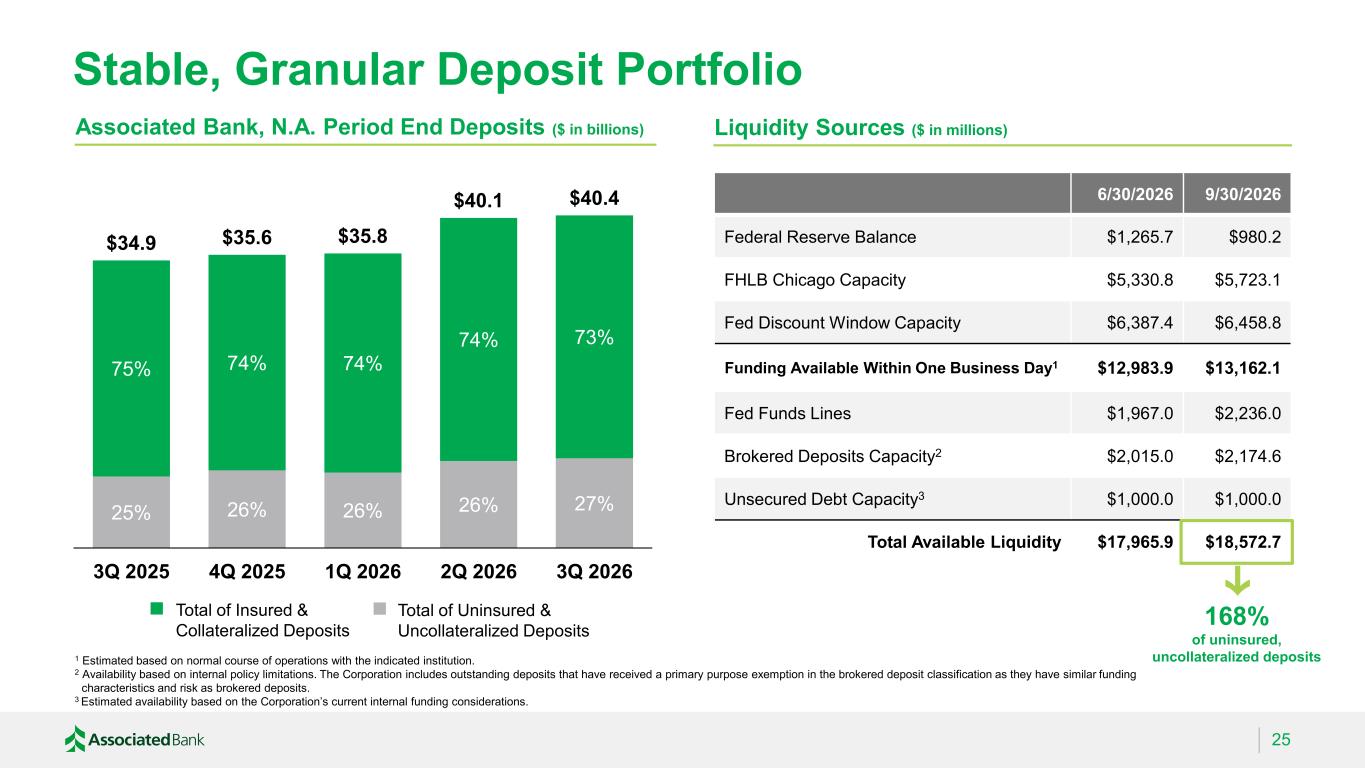
Stable, Granular Deposit Portfolio 25 Associated Bank, N.A. Period End Deposits ($ in billions) Liquidity Sources ($ in millions) 25% 26% 26% 26% 27% 75% 74% 74% 74% 73% $34.9 $35.6 $35.8 $40.1 $40.4 3Q 2025 4Q 2025 1Q 2026 2Q 2026 3Q 2026 Total of Insured & Collateralized Deposits Total of Uninsured & Uncollateralized Deposits 6/30/2026 9/30/2026 Federal Reserve Balance $1,265.7 $980.2 FHLB Chicago Capacity $5,330.8 $5,723.1 Fed Discount Window Capacity $6,387.4 $6,458.8 Funding Available Within One Business Day1 $12,983.9 $13,162.1 Fed Funds Lines $1,967.0 $2,236.0 Brokered Deposits Capacity2 $2,015.0 $2,174.6 Unsecured Debt Capacity3 $1,000.0 $1,000.0 Total Available Liquidity $17,965.9 $18,572.7 168% of uninsured, uncollateralized deposits 1 Estimated based on normal course of operations with the indicated institution. 2 Availability based on internal policy limitations. The Corporation includes outstanding deposits that have received a primary purpose exemption in the brokered deposit classification as they have similar funding characteristics and risk as brokered deposits. 3 Estimated availability based on the Corporation’s current internal funding considerations.
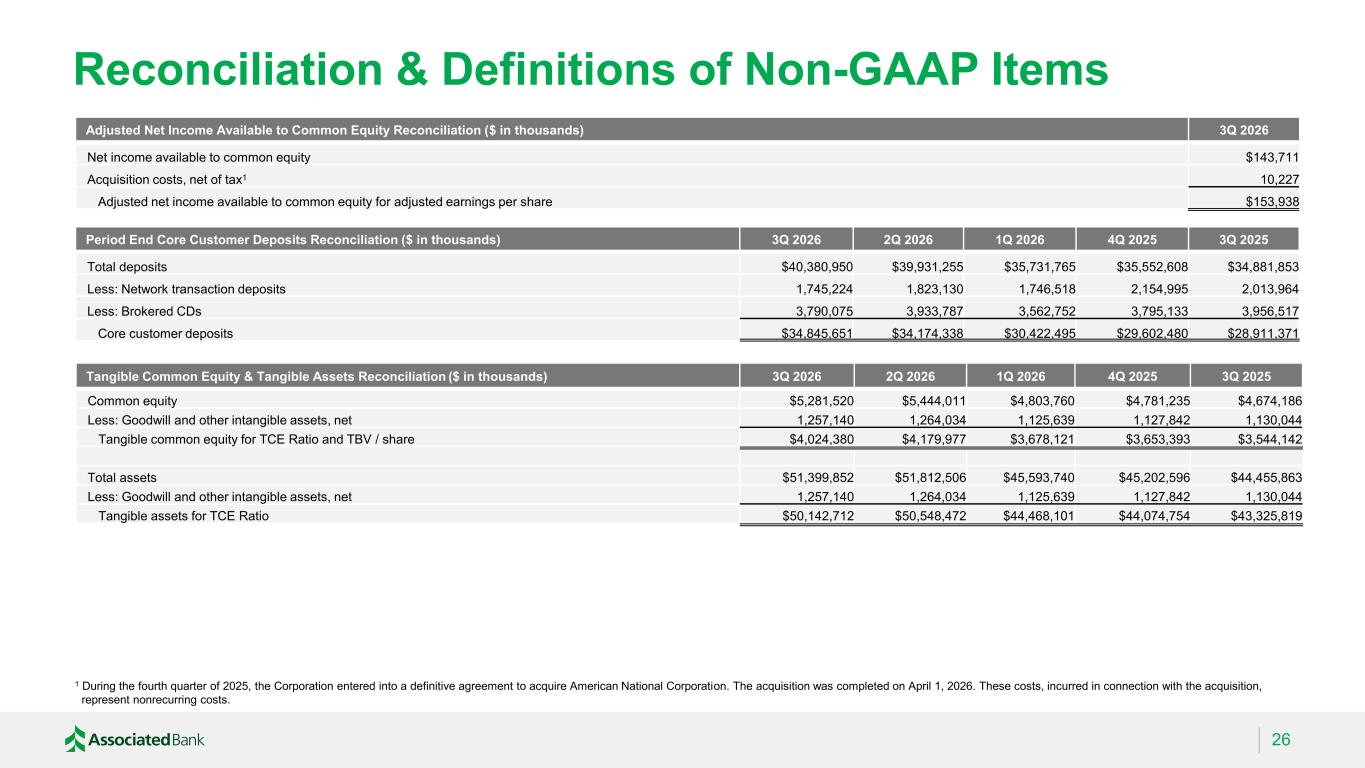
Tangible Common Equity & Tangible Assets Reconciliation ($ in thousands) 3Q 2026 2Q 2026 1Q 2026 4Q 2025 3Q 2025 Common equity $5,281,520 $5,444,011 $4,803,760 $4,781,235 $4,674,186 Less: Goodwill and other intangible assets, net 1,257,140 1,264,034 1,125,639 1,127,842 1,130,044 Tangible common equity for TCE Ratio and TBV / share $4,024,380 $4,179,977 $3,678,121 $3,653,393 $3,544,142 Total assets $51,399,852 $51,812,506 $45,593,740 $45,202,596 $44,455,863 Less: Goodwill and other intangible assets, net 1,257,140 1,264,034 1,125,639 1,127,842 1,130,044 Tangible assets for TCE Ratio $50,142,712 $50,548,472 $44,468,101 $44,074,754 $43,325,819 Reconciliation & Definitions of Non-GAAP Items 26 Period End Core Customer Deposits Reconciliation ($ in thousands) 3Q 2026 2Q 2026 1Q 2026 4Q 2025 3Q 2025 Total deposits $40,380,950 $39,931,255 $35,731,765 $35,552,608 $34,881,853 Less: Network transaction deposits 1,745,224 1,823,130 1,746,518 2,154,995 2,013,964 Less: Brokered CDs 3,790,075 3,933,787 3,562,752 3,795,133 3,956,517 Core customer deposits $34,845,651 $34,174,338 $30,422,495 $29,602,480 $28,911,371 Adjusted Net Income Available to Common Equity Reconciliation ($ in thousands) 3Q 2026 Net income available to common equity $143,711 Acquisition costs, net of tax1 10,227 Adjusted net income available to common equity for adjusted earnings per share $153,938 1 During the fourth quarter of 2025, the Corporation entered into a definitive agreement to acquire American National Corporation. The acquisition was completed on April 1, 2026. These costs, incurred in connection with the acquisition, represent nonrecurring costs.
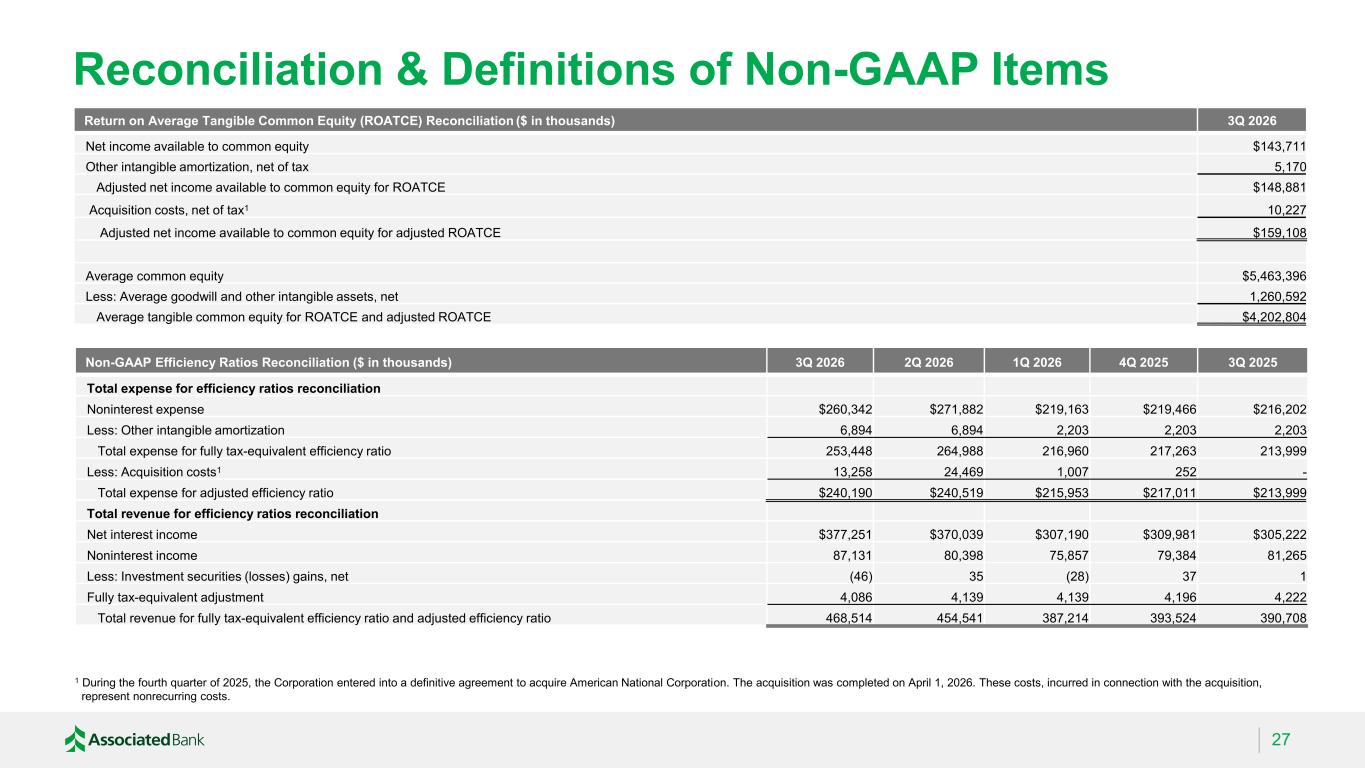
Reconciliation & Definitions of Non-GAAP Items 27 Update 1 During the fourth quarter of 2025, the Corporation entered into a definitive agreement to acquire American National Corporation. The acquisition was completed on April 1, 2026. These costs, incurred in connection with the acquisition, represent nonrecurring costs. Non-GAAP Efficiency Ratios Reconciliation ($ in thousands) 3Q 2026 2Q 2026 1Q 2026 4Q 2025 3Q 2025 Total expense for efficiency ratios reconciliation Noninterest expense $260,342 $271,882 $219,163 $219,466 $216,202 Less: Other intangible amortization 6,894 6,894 2,203 2,203 2,203 Total expense for fully tax-equivalent efficiency ratio 253,448 264,988 216,960 217,263 213,999 Less: Acquisition costs1 13,258 24,469 1,007 252 - Total expense for adjusted efficiency ratio $240,190 $240,519 $215,953 $217,011 $213,999 Total revenue for efficiency ratios reconciliation Net interest income $377,251 $370,039 $307,190 $309,981 $305,222 Noninterest income 87,131 80,398 75,857 79,384 81,265 Less: Investment securities (losses) gains, net (46) 35 (28) 37 1 Fully tax-equivalent adjustment 4,086 4,139 4,139 4,196 4,222 Total revenue for fully tax-equivalent efficiency ratio and adjusted efficiency ratio 468,514 454,541 387,214 393,524 390,708 Return on Average Tangible Common Equity (ROATCE) Reconciliation ($ in thousands) 3Q 2026 Net income available to common equity $143,711 Other intangible amortization, net of tax 5,170 Adjusted net income available to common equity for ROATCE $148,881 Acquisition costs, net of tax1 10,227 Adjusted net income available to common equity for adjusted ROATCE $159,108 Average common equity $5,463,396 Less: Average goodwill and other intangible assets, net 1,260,592 Average tangible common equity for ROATCE and adjusted ROATCE $4,202,804

Thank You De Pere, WI