1 Q3’26 1 October 2026 Investor Presentation
2 © 2026 C USTO M ERS BANC O RP, INC . / ALL RIG HTS RESERVED In addition to historical information, this presentation may contain “forward-looking statements” within the meaning of the “safe harbor” provisions of the Private Securities Litigation Reform Act of 1995. These forward-looking statements include statements with respect to Customers Bancorp, Inc.’s strategies, goals, beliefs, expectations, estimates, intentions, capital raising efforts, financial condition and results of operations, future performance and business. Statements preceded by, followed by, or that include the words “may,” “could,” “should,” “pro forma,” “looking forward,” “would,” “believe,” “expect,” “anticipate,” “estimate,” “intend,” “plan,” “project,” “confident,” or similar expressions generally indicate a forward-looking statement. These forward-looking statements involve risks and uncertainties that are subject to change based on various important factors (some of which, in whole or in part, are beyond Customers Bancorp, Inc.’s control). Numerous competitive, economic, regulatory, legal and technological events and factors, among others, could cause Customers Bancorp, Inc.’s financial performance to differ materially from the goals, plans, objectives, intentions and expectations expressed in such forward-looking statements, including: a continuation of the recent turmoil in the banking industry, responsive measures taken by us and regulatory authorities to mitigate and manage related risks, regulatory actions taken that address related issues and the costs and obligations associated therewith, such as the FDIC special assessments; the potential for negative consequences resulting from regulatory violations, investigations and examinations, including potential supervisory actions, the assessment of fines and penalties, the imposition of sanctions, the need to undertake remedial actions and possible damage to our reputation; technological changes, including acceptance and success of our proprietary B2B instant payments platform, cubiX, which subject to a variety of factors that are difficult to evaluate; effects of competition on deposit rates and growth, loan rates and growth and net interest margin; failure to identify and adequately and promptly address cybersecurity risks, including data breaches and cyberattacks, which may be exacerbated by our continued development and implementation of generative artificial intelligence, including risks arising from reliance on third-party artificial intelligence tools, model limitations, data integrity issues or regulatory uncertainty, and the cost of defending against them and any reputational or other financial risks following such a cybersecurity incident; public health crises and pandemics and their effects on the economic and business environments in which we operate; geopolitical conditions, including acts or threats of terrorism, actions taken by the United States or other governments in response to acts or threats of terrorism and military conflicts, including the war between Russia and Ukraine and ongoing conflict in the Middle East, which could impact economic conditions in the United States; the impact that changes in the economy have on the performance of our loan and lease portfolio, the market value of our investment securities, the demand for our products and services and the availability of sources of funding; the effects of actions by the federal government, including the Board of Governors of the Federal Reserve System and other government agencies, that affect market interest rates and the money supply; actions that we and our customers take in response to these developments and the effects such actions have on our operations, products, services and customer relationships; higher inflation and its impacts; the effects of changes in U.S. trade policies, including the imposition of tariffs and retaliatory tariffs on its trading partners; and the effects of any changes in accounting standards or policies. Customers Bancorp, Inc. cautions that the foregoing factors are not exclusive, and neither such factors nor any such forward-looking statement takes into account the impact of any future events. All forward-looking statements and information set forth herein are based on management’s current beliefs and assumptions as of the date hereof and speak only as of the date they are made. For a more complete discussion of the assumptions, risks and uncertainties related to our business, you are encouraged to review Customers Bancorp, Inc.’s filings with the Securities and Exchange Commission, including its most recent annual report on Form 10-K for the year ended December 31, 2025, subsequently filed quarterly reports on Form 10-Q and current reports on Form 8-K, including any amendments thereto, that update or provide information in addition to the information included in the Form 10-K and Form 10-Q filings, if any. Customers Bancorp, Inc. does not undertake to update any forward-looking statement whether written or oral, that may be made from time to time by Customers Bancorp, Inc. or by or on behalf of Customers Bank, except as may be required under applicable law. Forward-Looking Statements
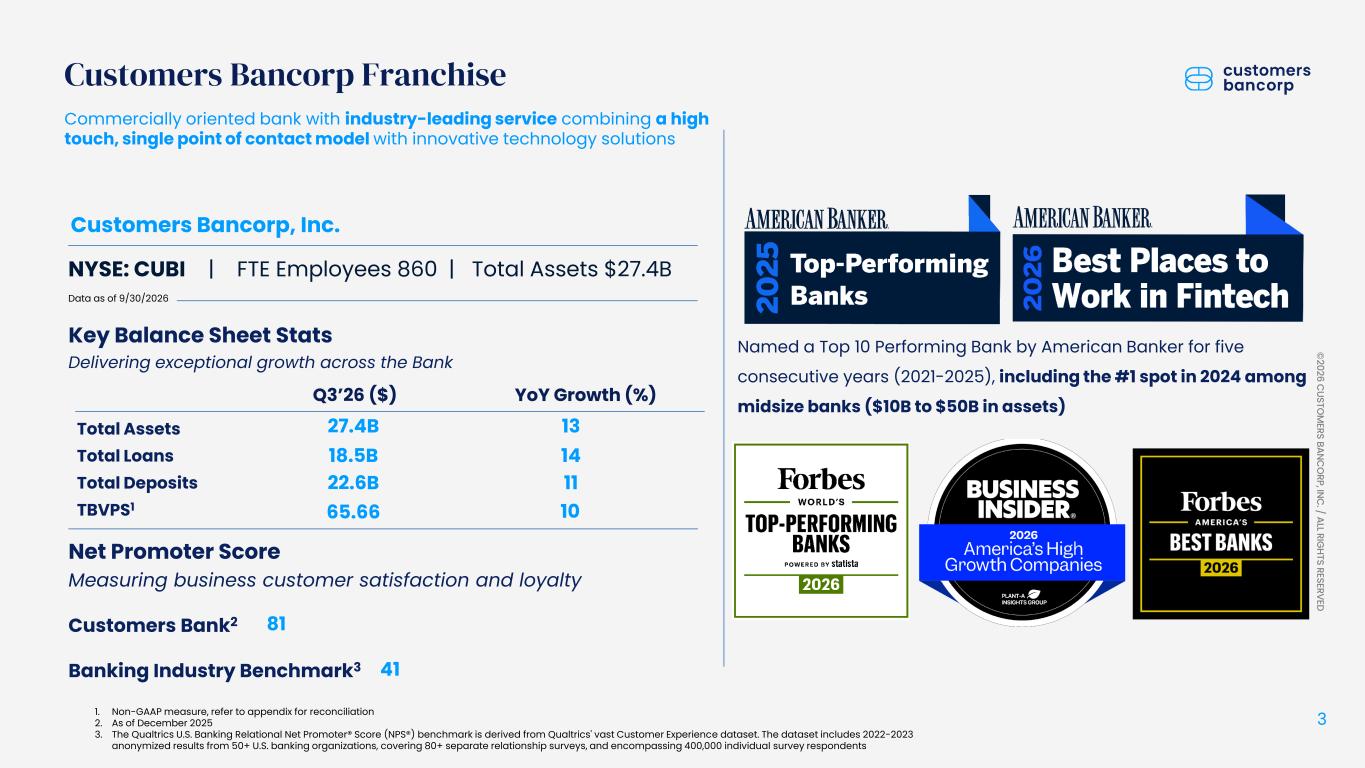
3 © 2026 C USTO M ERS BANC O RP, INC . / ALL RIG HTS RESERVED Customers Bancorp Franchise Commercially oriented bank with industry-leading service combining a high touch, single point of contact model with innovative technology solutions Net Promoter Score Measuring business customer satisfaction and loyalty Customers Bank2 Banking Industry Benchmark3 NYSE: CUBI | FTE Employees 860 | Total Assets $27.4B Data as of 9/30/2026 Customers Bancorp, Inc. 1. Non-GAAP measure, refer to appendix for reconciliation 2. As of December 2025 3. The Qualtrics U.S. Banking Relational Net Promoter® Score (NPS®) benchmark is derived from Qualtrics' vast Customer Experience dataset. The dataset includes 2022-2023 anonymized results from 50+ U.S. banking organizations, covering 80+ separate relationship surveys, and encompassing 400,000 individual survey respondents Key Balance Sheet Stats Delivering exceptional growth across the Bank Total Assets Total Loans Total Deposits TBVPS1 Q3’26 ($) 27.4B 18.5B 22.6B 65.66 YoY Growth (%) 13 14 11 10 Named a Top 10 Performing Bank by American Banker for five consecutive years (2021-2025), including the #1 spot in 2024 among midsize banks ($10B to $50B in assets) 81 41
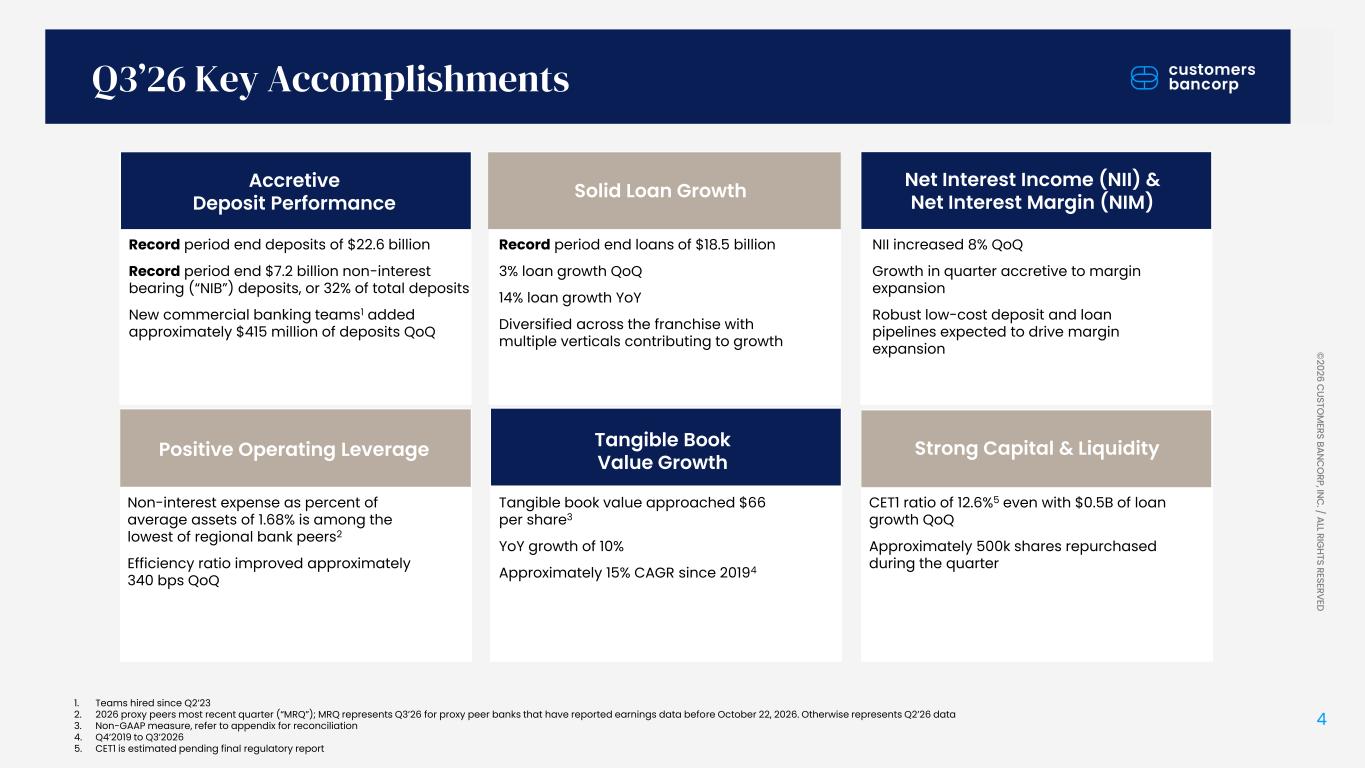
4 © 2026 C USTO M ERS BANC O RP, INC . / ALL RIG HTS RESERVED Q3’26 Key Accomplishments 1. Teams hired since Q2’23 2. 2026 proxy peers most recent quarter (“MRQ”); MRQ represents Q3’26 for proxy peer banks that have reported earnings data before October 22, 2026. Otherwise represents Q2’26 data 3. Non-GAAP measure, refer to appendix for reconciliation 4. Q4’2019 to Q3’2026 5. CET1 is estimated pending final regulatory report Record period end loans of $18.5 billion 3% loan growth QoQ 14% loan growth YoY Diversified across the franchise with multiple verticals contributing to growth Record period end deposits of $22.6 billion Record period end $7.2 billion non-interest bearing (“NIB”) deposits, or 32% of total deposits New commercial banking teams1 added approximately $415 million of deposits QoQ Solid Loan GrowthAccretive Deposit Performance NII increased 8% QoQ Growth in quarter accretive to margin expansion Robust low-cost deposit and loan pipelines expected to drive margin expansion Net Interest Income (NII) & Net Interest Margin (NIM) CET1 ratio of 12.6%5 even with $0.5B of loan growth QoQ Approximately 500k shares repurchased during the quarter Tangible book value approached $66 per share3 YoY growth of 10% Approximately 15% CAGR since 20194 Strong Capital & LiquidityTangible Book Value Growth Non-interest expense as percent of average assets of 1.68% is among the lowest of regional bank peers2 Efficiency ratio improved approximately 340 bps QoQ Positive Operating Leverage
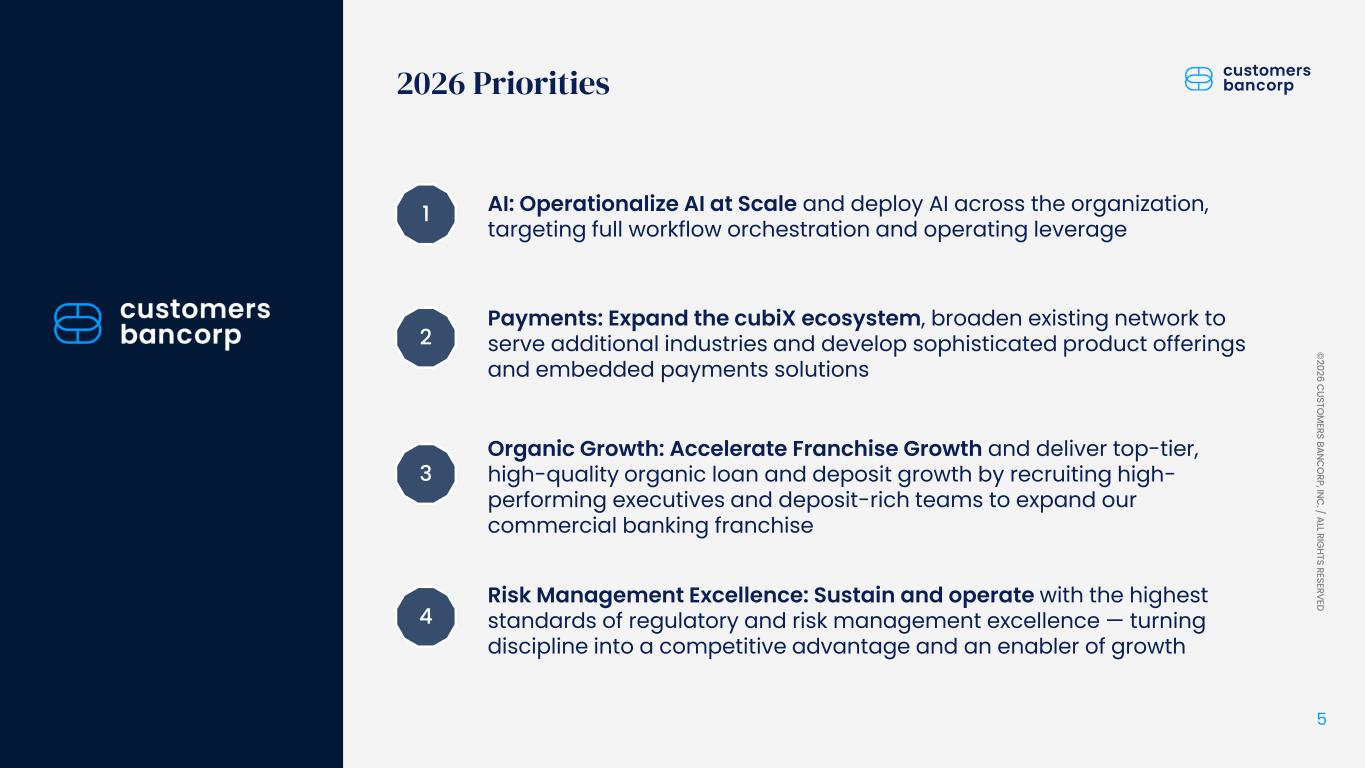
5 © 2026 C USTO M ERS BANC O RP, INC . / ALL RIG HTS RESERVED Organic Growth: Accelerate Franchise Growth and deliver top-tier, high-quality organic loan and deposit growth by recruiting high- performing executives and deposit-rich teams to expand our commercial banking franchise 1 2 3 Payments: Expand the cubiX ecosystem, broaden existing network to serve additional industries and develop sophisticated product offerings and embedded payments solutions 4 2026 Priorities AI: Operationalize AI at Scale and deploy AI across the organization, targeting full workflow orchestration and operating leverage Risk Management Excellence: Sustain and operate with the highest standards of regulatory and risk management excellence — turning discipline into a competitive advantage and an enabler of growth
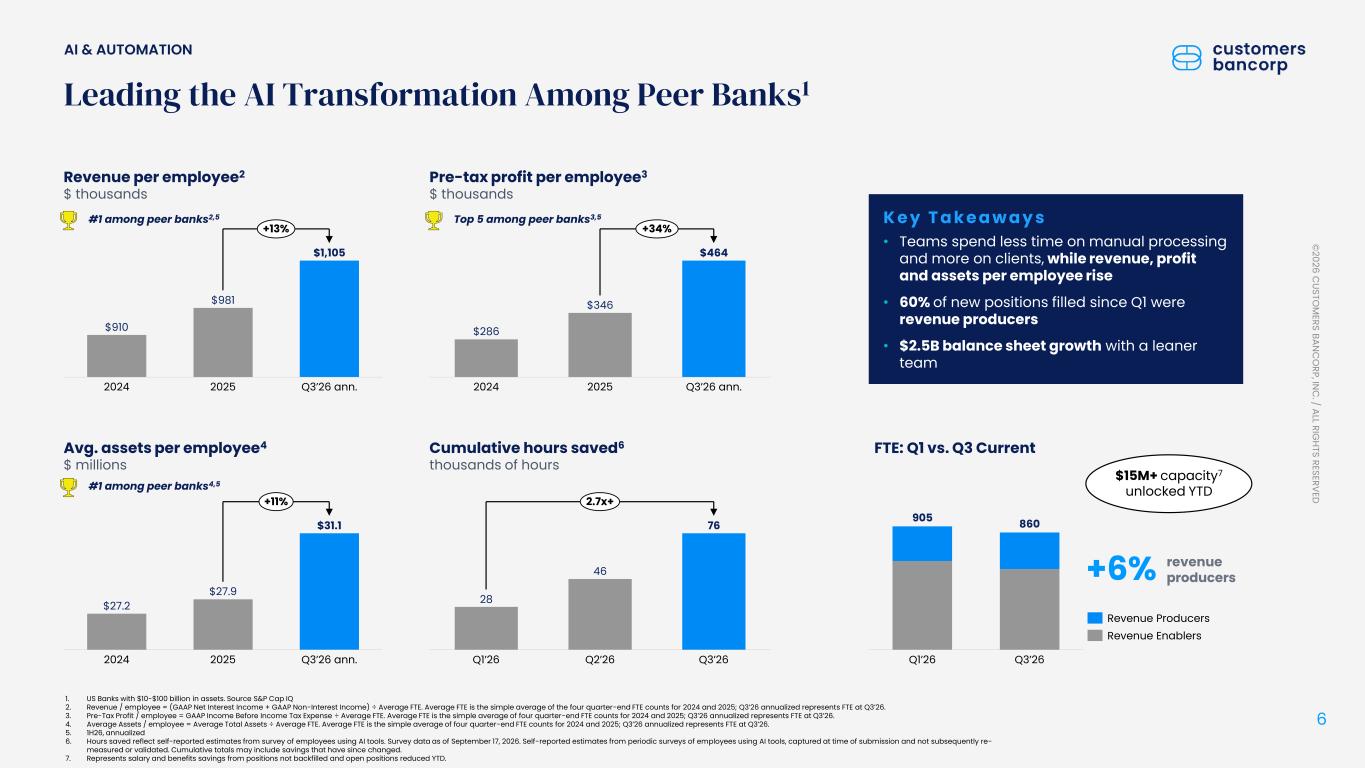
6 © 2026 C USTO M ERS BAN C O RP, IN C . / ALL RIG HTS RESERVED AI & AUTOMATION Leading the AI Transformation Among Peer Banks1 Revenue per employee2 $ thousands Pre-tax profit per employee3 $ thousands Avg. assets per employee4 $ millions Cumulative hours saved6 thousands of hours $910 $981 $1,105 2024 2025 Q3’26 ann. +13% $286 $346 $464 2024 2025 Q3’26 ann. +34% $27.2 $27.9 $31.1 2024 2025 Q3’26 ann. +11% 1. US Banks with $10-$100 billion in assets. Source S&P Cap IQ 2. Revenue / employee = (GAAP Net Interest Income + GAAP Non-Interest Income) ÷ Average FTE. Average FTE is the simple average of the four quarter-end FTE counts for 2024 and 2025; Q3’26 annualized represents FTE at Q3’26. 3. Pre-Tax Profit / employee = GAAP Income Before Income Tax Expense ÷ Average FTE. Average FTE is the simple average of four quarter-end FTE counts for 2024 and 2025; Q3’26 annualized represents FTE at Q3’26. 4. Average Assets / employee = Average Total Assets ÷ Average FTE. Average FTE is the simple average of four quarter-end FTE counts for 2024 and 2025; Q3’26 annualized represents FTE at Q3’26. 5. 1H26, annualized 6. Hours saved reflect self-reported estimates from survey of employees using AI tools. Survey data as of September 17, 2026. Self-reported estimates from periodic surveys of employees using AI tools, captured at time of submission and not subsequently re- measured or validated. Cumulative totals may include savings that have since changed. 7. Represents salary and benefits savings from positions not backfilled and open positions reduced YTD. K e y T a k e a w a y s • Teams spend less time on manual processing and more on clients, while revenue, profit and assets per employee rise • 60% of new positions filled since Q1 were revenue producers • $2.5B balance sheet growth with a leaner team +6% revenue producers #1 among peer banks2,5 Top 5 among peer banks3,5 #1 among peer banks4,5 28 46 76 Q1’26 Q2’26 Q3’26 2.7x+ $15M+ capacity7 unlocked YTD Q1’26 Q3’26 905 860 Revenue Enablers Revenue Producers FTE: Q1 vs. Q3 Current
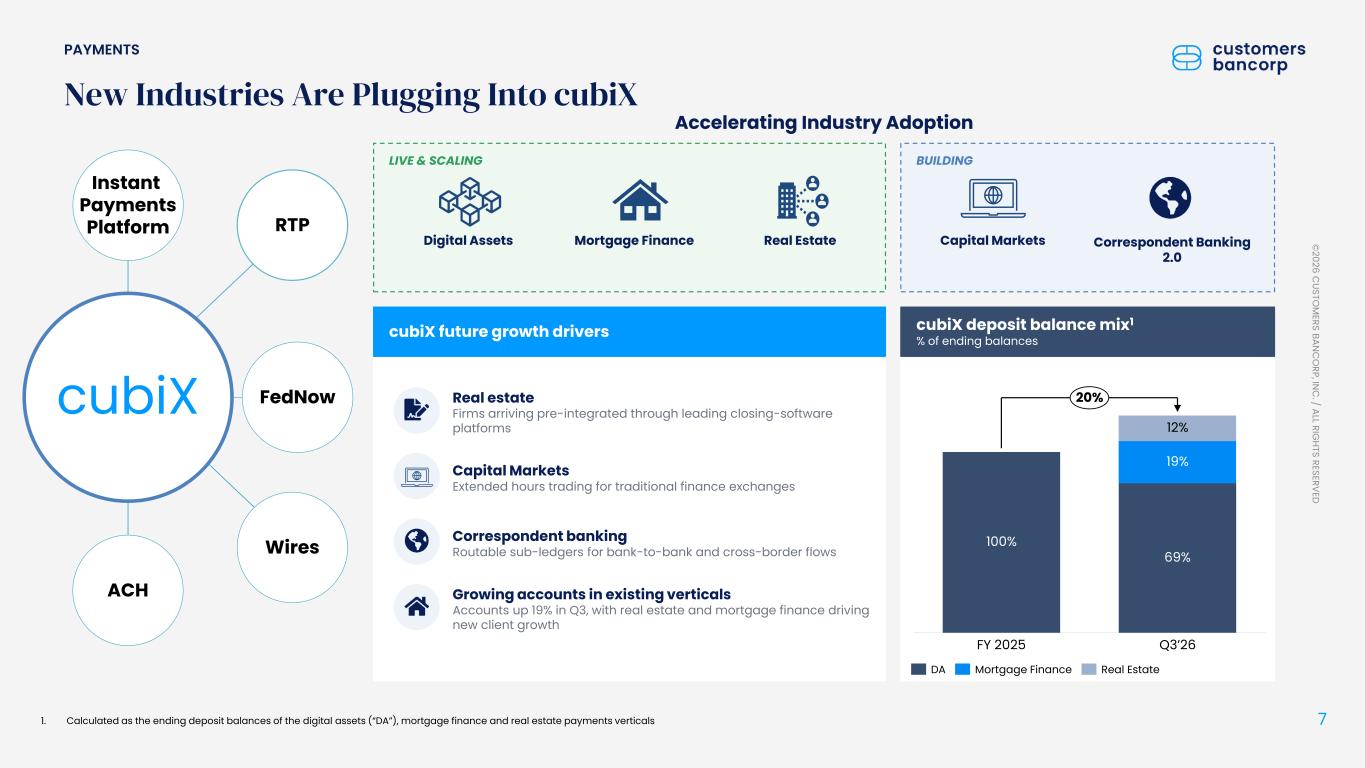
7 © 2026 C USTO M ERS BAN C O RP, IN C . / ALL RIG HTS RESERVED New Industries Are Plugging Into cubiX Accelerating Industry Adoption LIVE & SCALING Digital Assets Mortgage Finance Real Estate BUILDING Correspondent Banking 2.0 Capital Markets cubiX future growth drivers Real estate Firms arriving pre-integrated through leading closing-software platforms Capital Markets Extended hours trading for traditional finance exchanges Correspondent banking Routable sub-ledgers for bank-to-bank and cross-border flows Growing accounts in existing verticals Accounts up 19% in Q3, with real estate and mortgage finance driving new client growth cubiX deposit balance mix1 % of ending balances 1. Calculated as the ending deposit balances of the digital assets (“DA”), mortgage finance and real estate payments verticals 100% FY 2025 69% 19% 12% Q3’26 20% DA Mortgage Finance Real Estate Instant Payments Platform RTP FedNow Wires ACH cubiX PAYMENTS
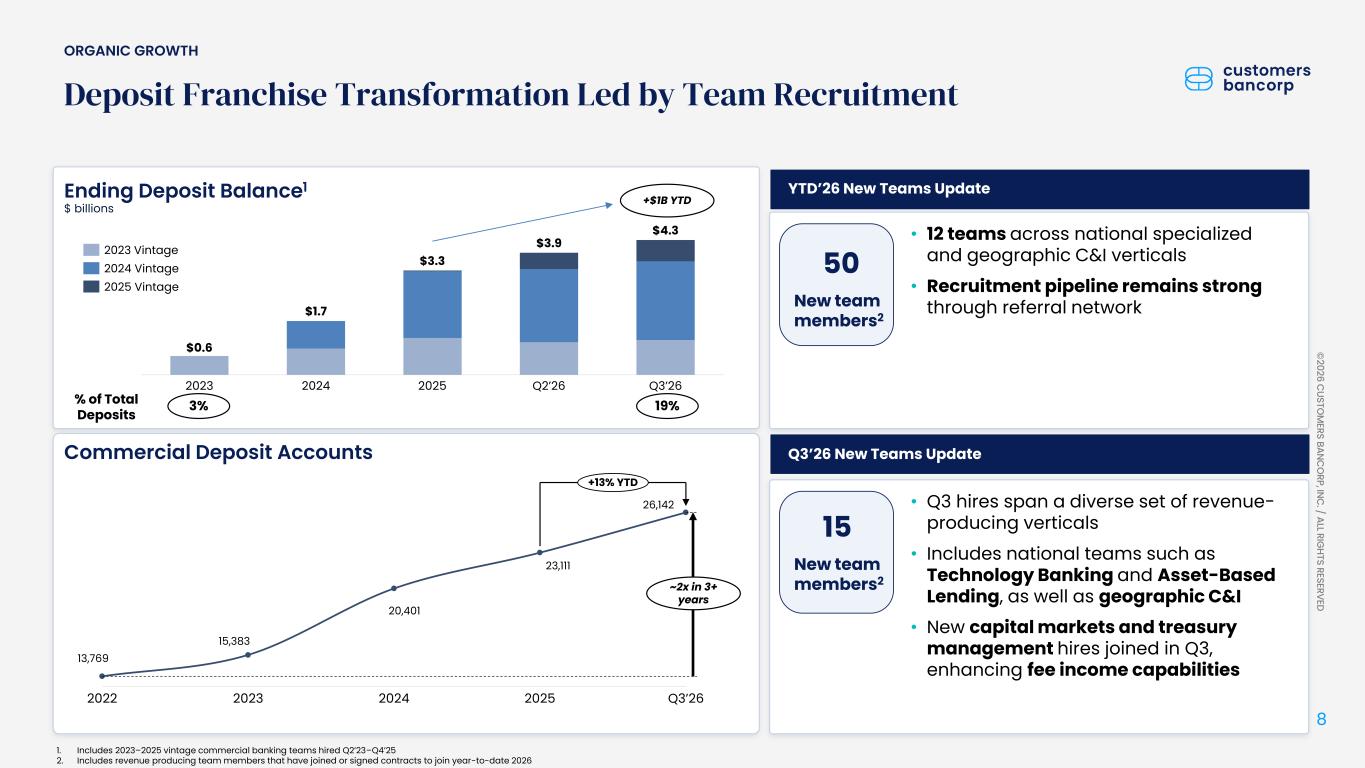
8 © 2026 C USTO M ERS BANC O RP, INC . / ALL RIG HTS RESERVED ORGANIC GROWTH Deposit Franchise Transformation Led by Team Recruitment 1. Includes 2023–2025 vintage commercial banking teams hired Q2’23–Q4’25 2. Includes revenue producing team members that have joined or signed contracts to join year-to-date 2026 $0.6 2023 2024 2025 Q2’26 Q3’26 $1.7 $3.3 $3.9 $4.3 2023 Vintage 2024 Vintage 2025 Vintage Ending Deposit Balance1 $ billions Commercial Deposit Accounts 13,769 15,383 20,401 23,111 26,142 2022 2023 2024 2025 Q3’26 +13% YTD % of Total Deposits 3% 19% ~2x in 3+ years Q3’26 New Teams Update YTD’26 New Teams Update 50 New team members2 • 12 teams across national specialized and geographic C&I verticals • Recruitment pipeline remains strong through referral network +$1B YTD • Q3 hires span a diverse set of revenue- producing verticals • Includes national teams such as Technology Banking and Asset-Based Lending, as well as geographic C&I • New capital markets and treasury management hires joined in Q3, enhancing fee income capabilities 15 New team members2
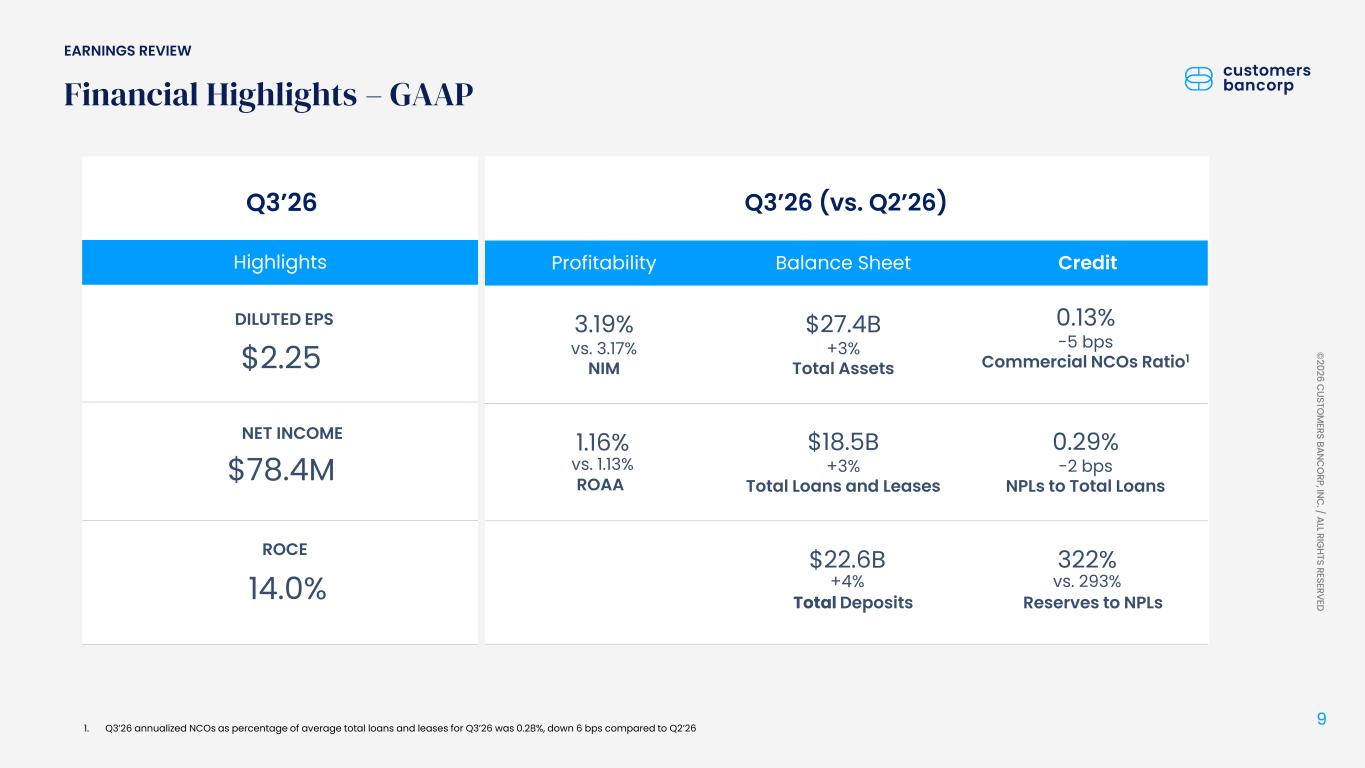
9 © 2026 C USTO M ERS BANC O RP, INC . / ALL RIG HTS RESERVED Profitability Balance Sheet Credit 3.19% vs. 3.17% NIM $27.4B +3% Total Assets 0.13% -5 bps Commercial NCOs Ratio1 $18.5B +3% Total Loans and Leases 0.29% -2 bps NPLs to Total Loans Financial Highlights – GAAP Highlights Q3’26 EARNINGS REVIEW Total Deposits $22.6B +4% Reserves to NPLs 322% vs. 293% $2.25 DILUTED EPS $78.4M NET INCOME ROCE 14.0% ROAA 1.16% vs. 1.13% 1. Q3’26 annualized NCOs as percentage of average total loans and leases for Q3’26 was 0.28%, down 6 bps compared to Q2’26 Q3’26 (vs. Q2’26)
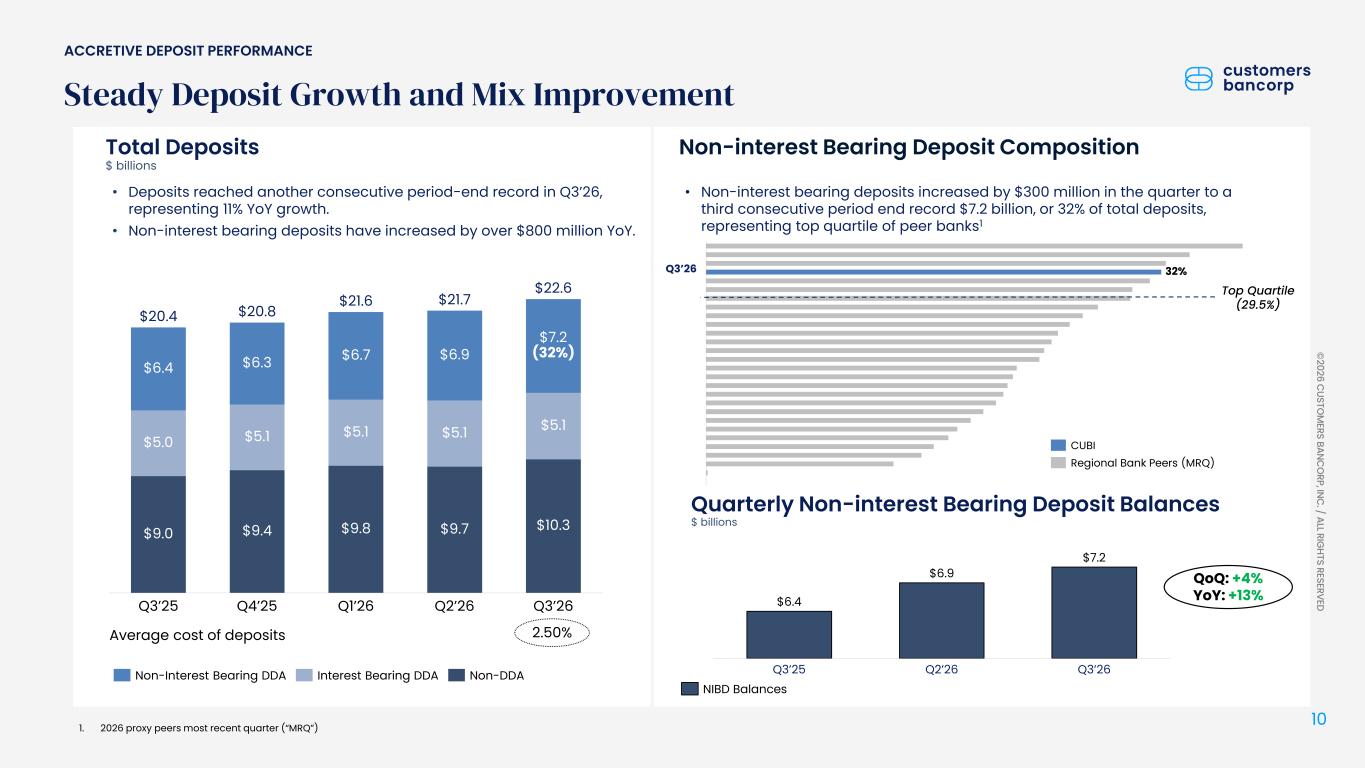
10 © 2026 C USTO M ERS BANC O RP, INC . / ALL RIG HTS RESERVED Non-interest Bearing Deposit Composition 1. 2026 proxy peers most recent quarter (“MRQ”) Total Deposits $ billions Average cost of deposits $6.4 $5.0 $9.0 Q3’25 $6.3 $5.1 $9.4 Q4’25 $6.7 $5.1 $9.8 Q1’26 $6.9 $5.1 $9.7 Q2’26 $7.2 (32%) $5.1 $10.3 Q3’26 $20.4 $20.8 $21.6 $21.7 $22.6 Non-Interest Bearing DDA Interest Bearing DDA Non-DDA • Deposits reached another consecutive period-end record in Q3’26, representing 11% YoY growth. • Non-interest bearing deposits have increased by over $800 million YoY. 2.50% Steady Deposit Growth and Mix Improvement ACCRETIVE DEPOSIT PERFORMANCE • Non-interest bearing deposits increased by $300 million in the quarter to a third consecutive period end record $7.2 billion, or 32% of total deposits, representing top quartile of peer banks1 Quarterly Non-interest Bearing Deposit Balances $ billions Q3’25 Q2’26 Q3’26 $6.4 $6.9 $7.2 NIBD Balances 32% CUBI Regional Bank Peers (MRQ) Top Quartile (29.5%) QoQ: +4% YoY: +13% Q3’26
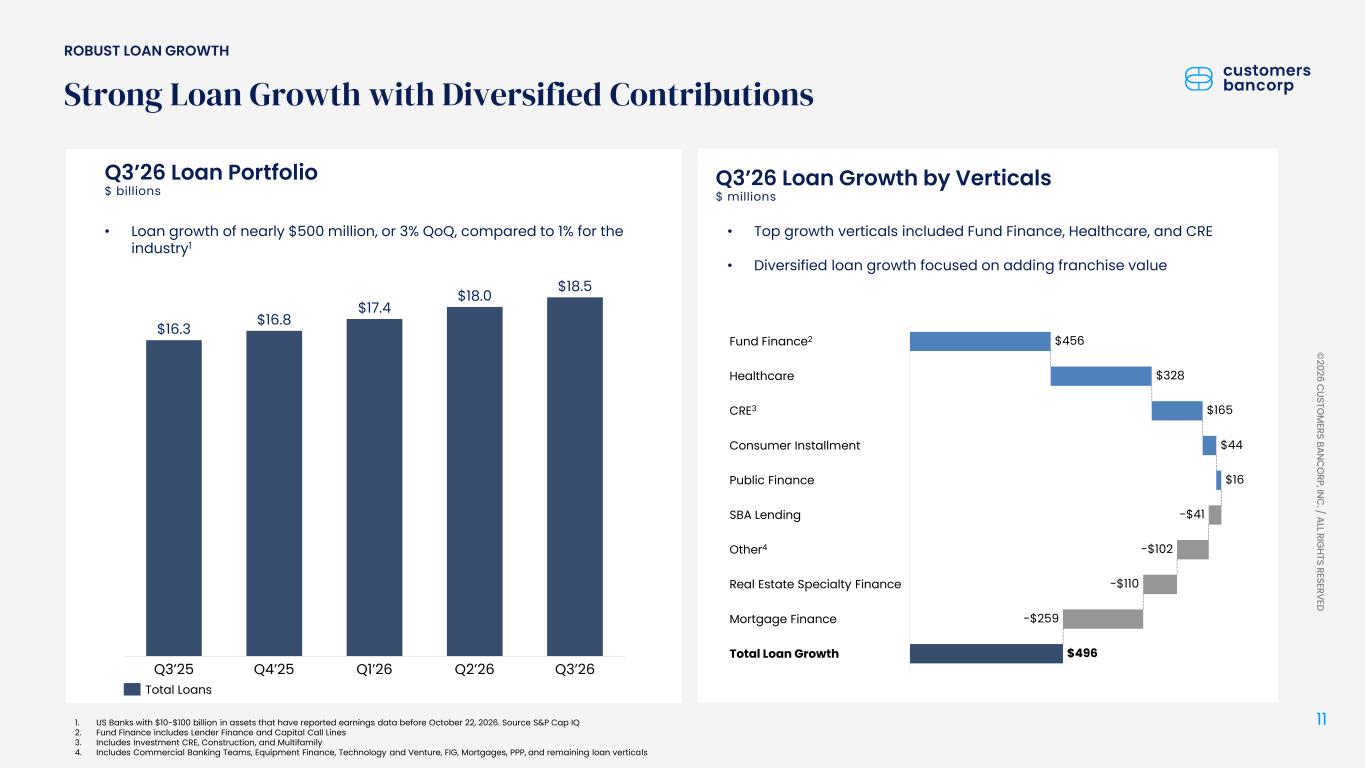
11 © 2026 C USTO M ERS BANC O RP, INC . / ALL RIG HTS RESERVED Strong Loan Growth with Diversified Contributions Q3’26 Loan Portfolio $ billions • Loan growth of nearly $500 million, or 3% QoQ, compared to 1% for the industry1 ROBUST LOAN GROWTH 1. US Banks with $10-$100 billion in assets that have reported earnings data before October 22, 2026. Source S&P Cap IQ 2. Fund Finance includes Lender Finance and Capital Call Lines 3. Includes Investment CRE, Construction, and Multifamily 4. Includes Commercial Banking Teams, Equipment Finance, Technology and Venture, FIG, Mortgages, PPP, and remaining loan verticals Fund Finance2 Healthcare CRE3 Consumer Installment Public Finance SBA Lending Other4 Real Estate Specialty Finance Mortgage Finance Total Loan Growth $456 $328 $165 $44 $16 -$41 -$102 -$110 -$259 $496 Q3’26 Loan Growth by Verticals $ millions Total Loans Q3’25 Q4’25 Q1’26 Q2’26 Q3’26 $16.3 $16.8 $17.4 $18.0 $18.5 • Top growth verticals included Fund Finance, Healthcare, and CRE • Diversified loan growth focused on adding franchise value
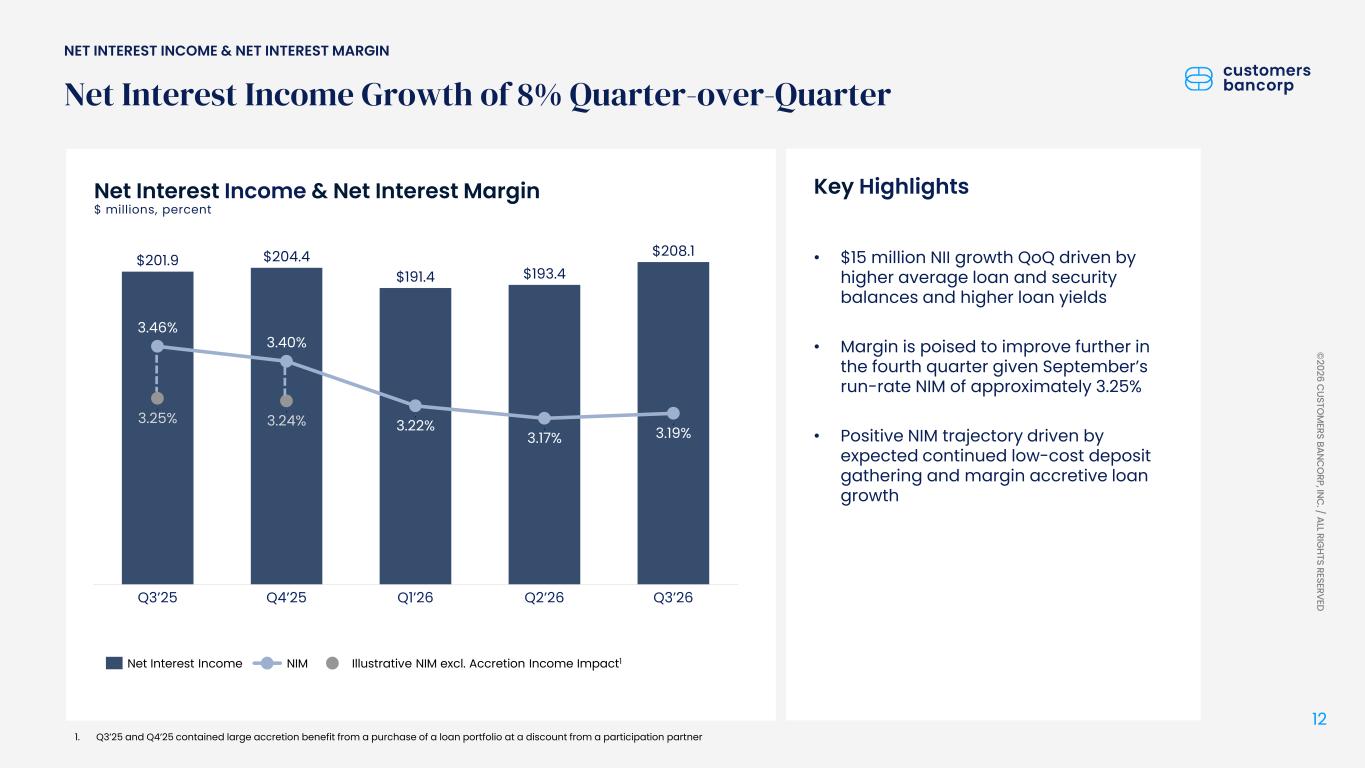
12 © 2026 C USTO M ERS BANC O RP, INC . / ALL RIG HTS RESERVED Net Interest Income Growth of 8% Quarter-over-Quarter Net Interest Income & Net Interest Margin $ millions, percent 3.46% 3.40% 3.22% 3.17% 3.19% 3.25% 3.24% Q3’25 Q4’25 Q1’26 Q2’26 Q3’26 $201.9 $204.4 $191.4 $193.4 $208.1 NET INTEREST INCOME & NET INTEREST MARGIN • $15 million NII growth QoQ driven by higher average loan and security balances and higher loan yields • Margin is poised to improve further in the fourth quarter given September’s run-rate NIM of approximately 3.25% • Positive NIM trajectory driven by expected continued low-cost deposit gathering and margin accretive loan growth Key Highlights Net Interest Income NIM Illustrative NIM excl. Accretion Income Impact1 1. Q3’25 and Q4’25 contained large accretion benefit from a purchase of a loan portfolio at a discount from a participation partner
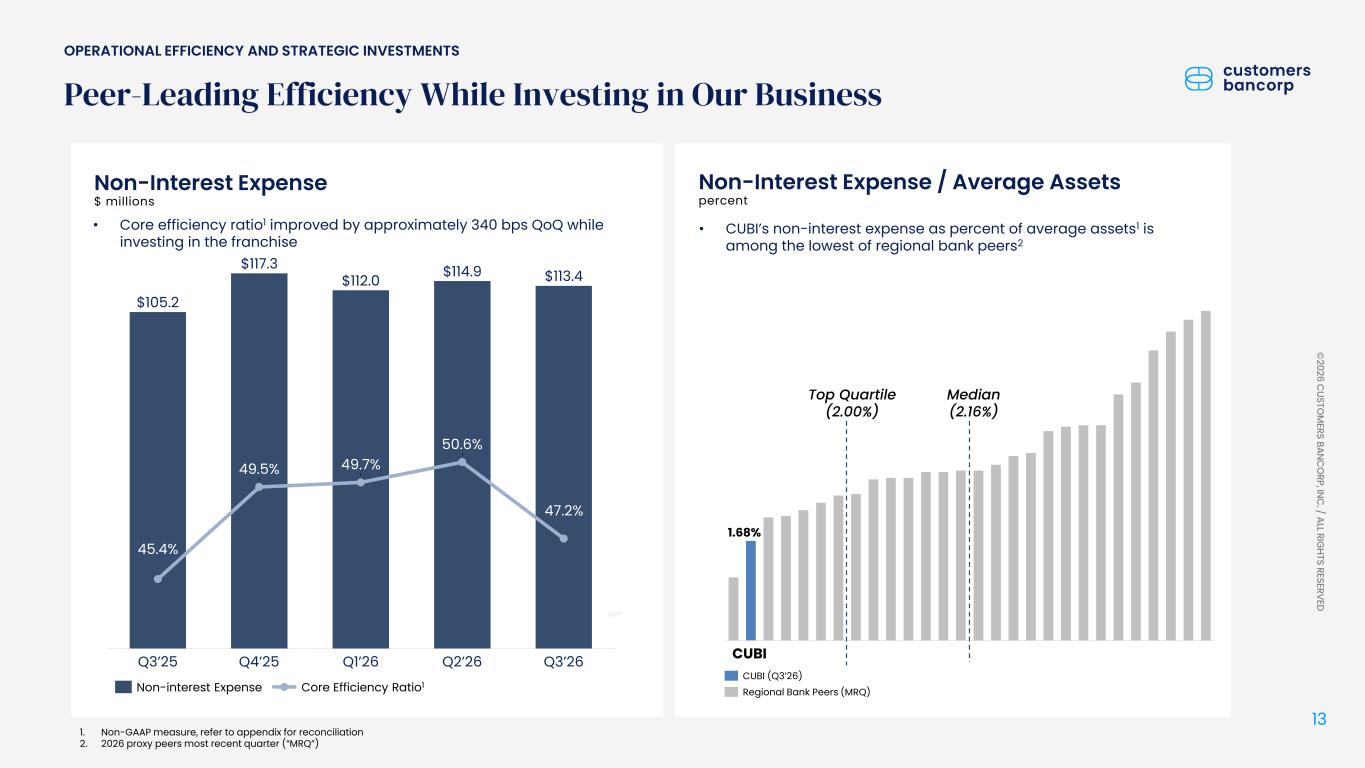
13 © 2026 C USTO M ERS BANC O RP, INC . / ALL RIG HTS RESERVED Peer-Leading Efficiency While Investing in Our Business $105.2 $117.3 $112.0 $114.9 $113.4 45.4% Q3’25 49.5% Q4’25 49.7% Q1’26 50.6% Q2’26 47.2% Q3’26 Non-Interest Expense $ millions • Core efficiency ratio1 improved by approximately 340 bps QoQ while investing in the franchise Non-Interest Expense / Average Assets percent • CUBI’s non-interest expense as percent of average assets1 is among the lowest of regional bank peers2 1.68% CUBI CUBI (Q3’26) Regional Bank Peers (MRQ) 1. Non-GAAP measure, refer to appendix for reconciliation 2. 2026 proxy peers most recent quarter (“MRQ”) Top Quartile (2.00%) Median (2.16%) OPERATIONAL EFFICIENCY AND STRATEGIC INVESTMENTS Non-interest Expense Core Efficiency Ratio1
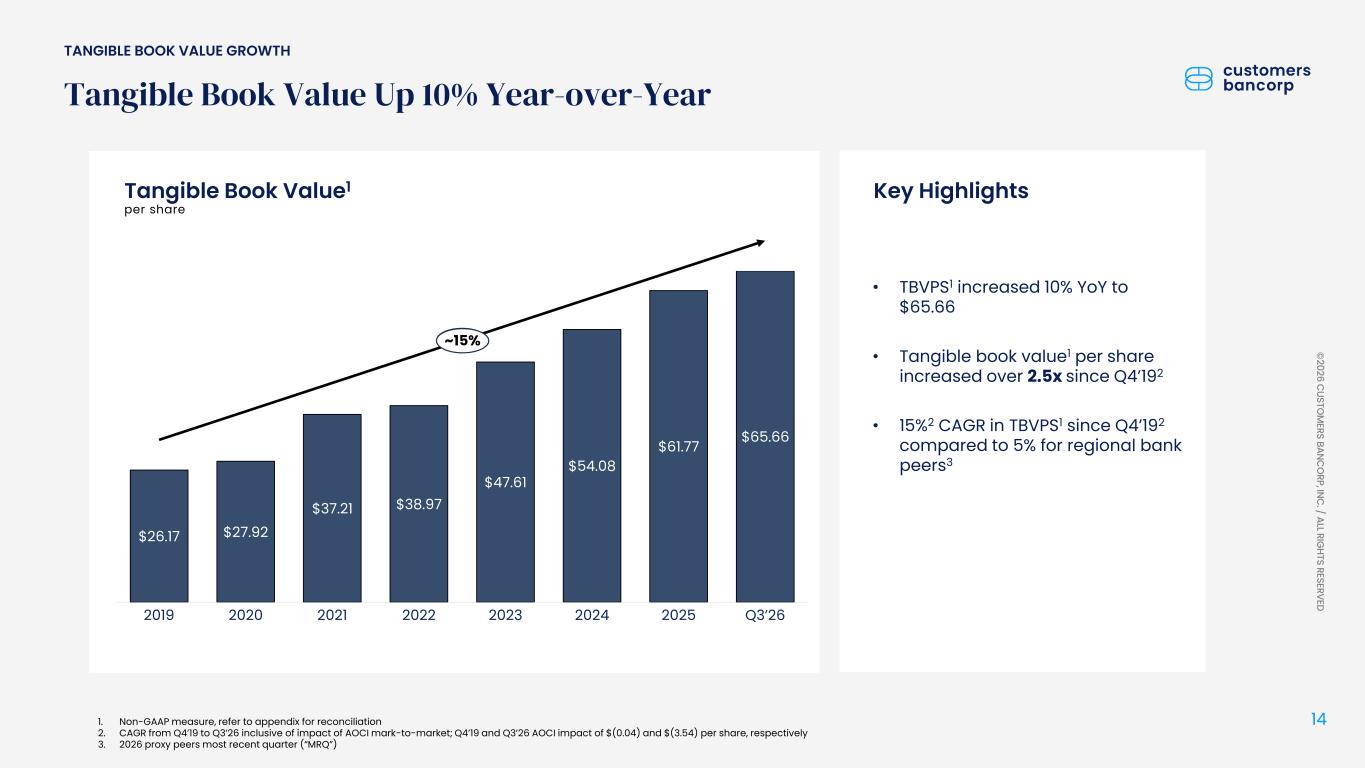
14 © 2026 C USTO M ERS BANC O RP, INC . / ALL RIG HTS RESERVED Tangible Book Value1 per share Tangible Book Value Up 10% Year-over-Year 1. Non-GAAP measure, refer to appendix for reconciliation 2. CAGR from Q4’19 to Q3’26 inclusive of impact of AOCI mark-to-market; Q4’19 and Q3’26 AOCI impact of $(0.04) and $(3.54) per share, respectively 3. 2026 proxy peers most recent quarter (“MRQ”) $26.17 $27.92 $37.21 $38.97 $47.61 $54.08 $61.77 $65.66 2019 2020 2021 2022 2023 2024 2025 Q3’26 +14% TANGIBLE BOOK VALUE GROWTH • TBVPS1 increased 10% YoY to $65.66 • Tangible book value1 per share increased over 2.5x since Q4’192 • 15%2 CAGR in TBVPS1 since Q4’192 compared to 5% for regional bank peers3 Key Highlights ~ 5
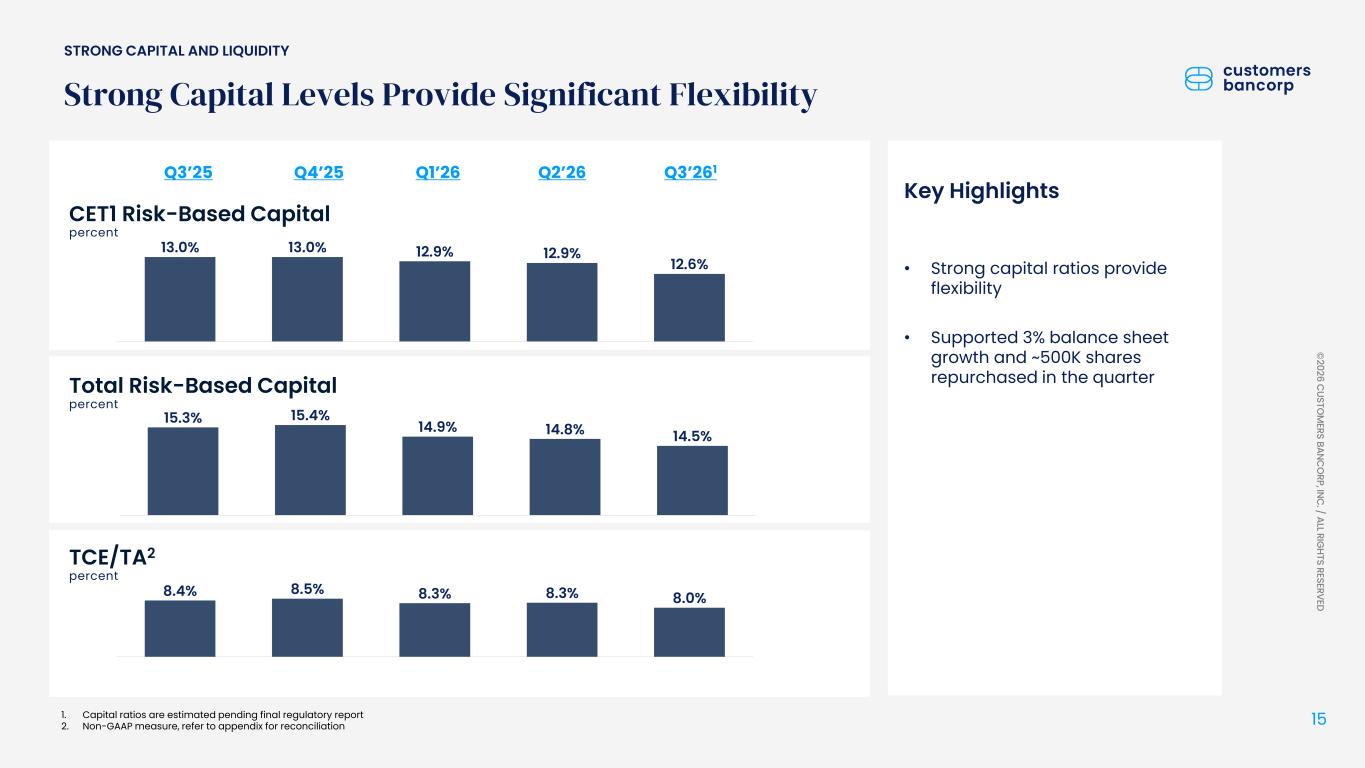
15 © 2026 C USTO M ERS BANC O RP, INC . / ALL RIG HTS RESERVED 15.3% 15.4% 14.9% 14.8% 14.5% Total Risk-Based Capital percent 8.4% 8.5% 8.3% 8.3% 8.0% TCE/TA2 percent 1. Capital ratios are estimated pending final regulatory report 2. Non-GAAP measure, refer to appendix for reconciliation Strong Capital Levels Provide Significant Flexibility 13.0% 13.0% 12.9% 12.9% 12.6% CET1 Risk-Based Capital percent STRONG CAPITAL AND LIQUIDITY • Strong capital ratios provide flexibility • Supported 3% balance sheet growth and ~500K shares repurchased in the quarter Key Highlights Q3’25 Q4’25 Q1’26 Q2’26 Q3’261
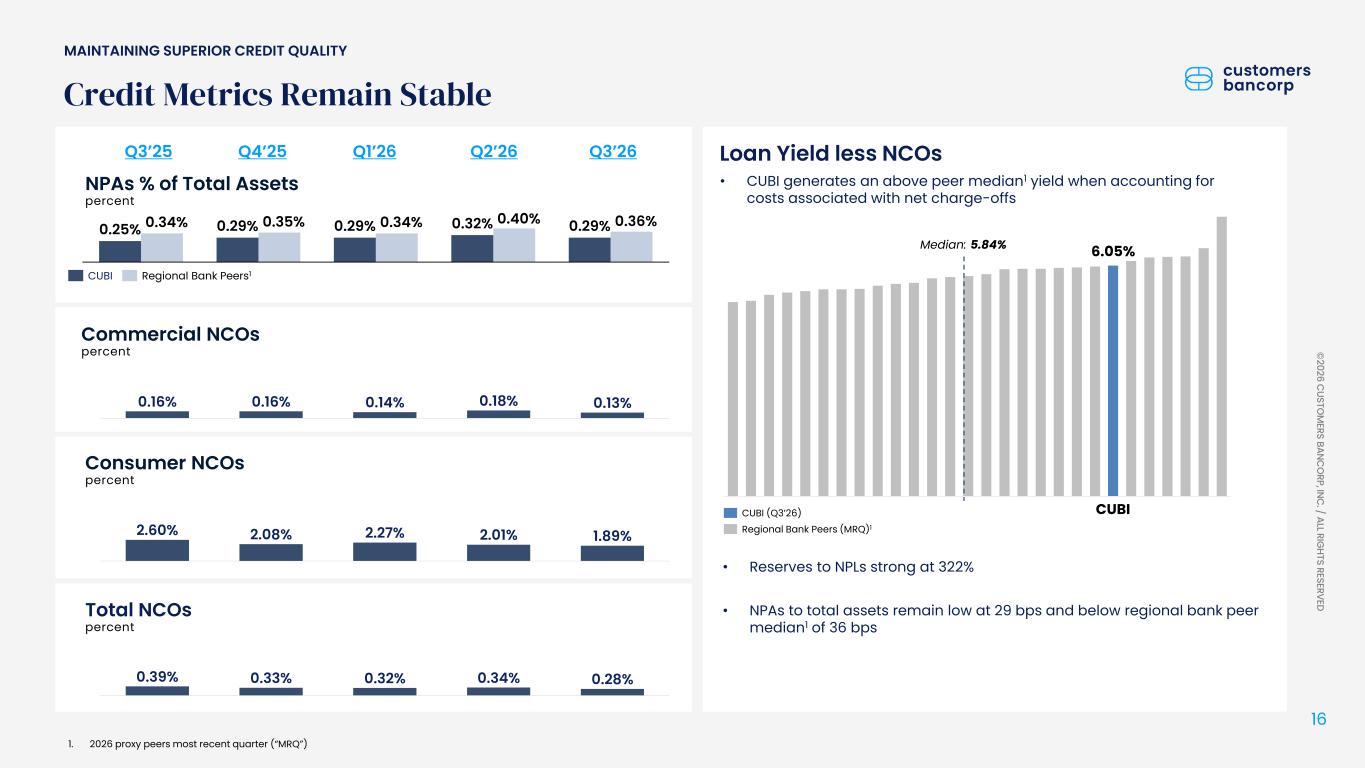
16 © 2026 C USTO M ERS BANC O RP, INC . / ALL RIG HTS RESERVED Commercial NCOs percent NPAs % of Total Assets percent Credit Metrics Remain Stable Consumer NCOs percent Total NCOs percent MAINTAINING SUPERIOR CREDIT QUALITY 1. 2026 proxy peers most recent quarter (“MRQ”) • Reserves to NPLs strong at 322% • NPAs to total assets remain low at 29 bps and below regional bank peer median1 of 36 bps Q3’25 Q4’25 0.16% 0.16% 0.14% 0.18% 0.13% 2.60% 2.08% 2.27% 2.01% 1.89% 0.39% 0.33% 0.32% 0.34% 0.28% 0.25% 0.29% 0.29% 0.32% 0.29%0.34% 0.35% 0.34% 0.40% 0.36% CUBI Regional Bank Peers1 Q1’26 Loan Yield less NCOs • CUBI generates an above peer median1 yield when accounting for costs associated with net charge-offs Median: 5.84% 6.05% CUBICUBI (Q3’26) Regional Bank Peers (MRQ)1 Q2’26 Q3’26
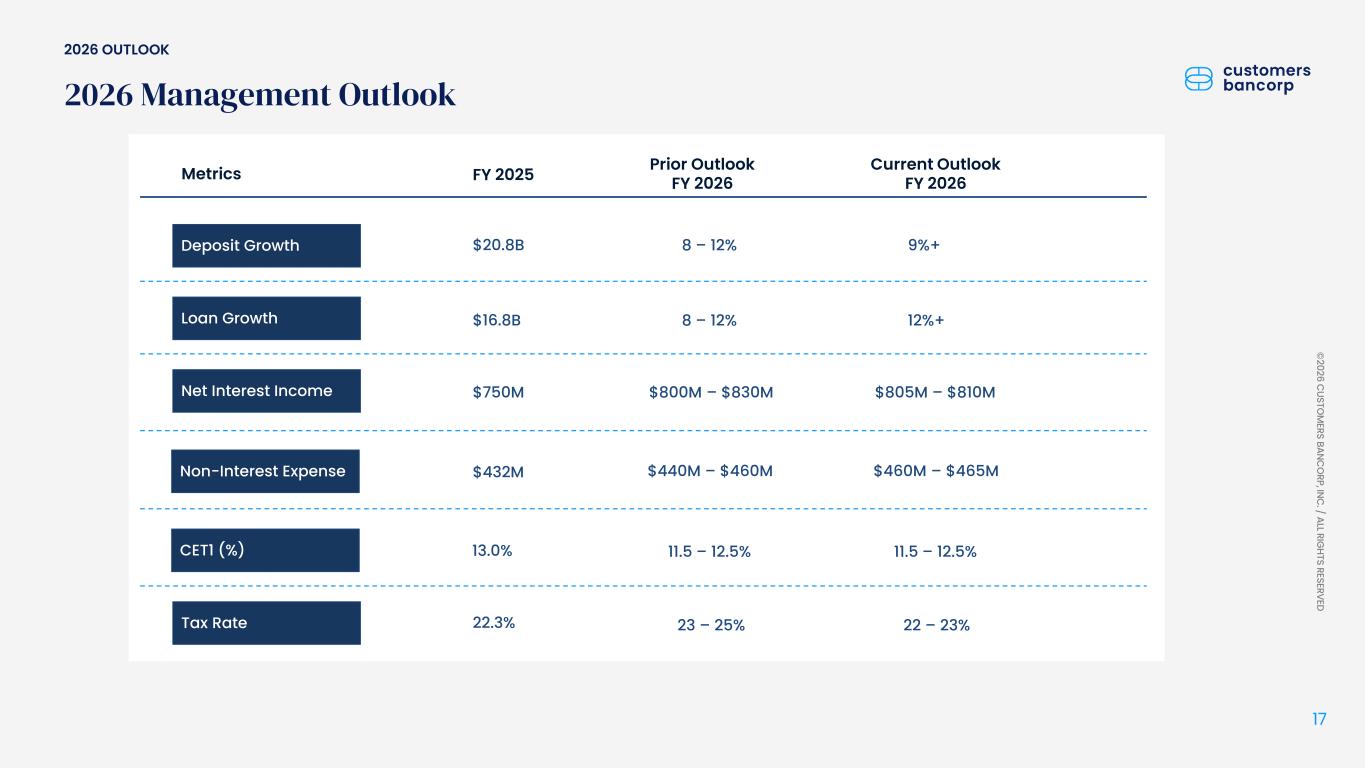
17 © 2026 C USTO M ERS BANC O RP, INC . / ALL RIG HTS RESERVED 2026 Management Outlook Metrics Deposit Growth Loan Growth Net Interest Income Tax Rate CET1 (%) FY 2025 $20.8B $16.8B $750M 22.3% 13.0% 8 – 12% 23 – 25% Non-Interest Expense $432M Prior Outlook FY 2026 8 – 12% $800M – $830M $440M – $460M 11.5 – 12.5% 2026 OUTLOOK 9%+ 22 – 23% Current Outlook FY 2026 12%+ $805M – $810M $460M – $465M 11.5 – 12.5%
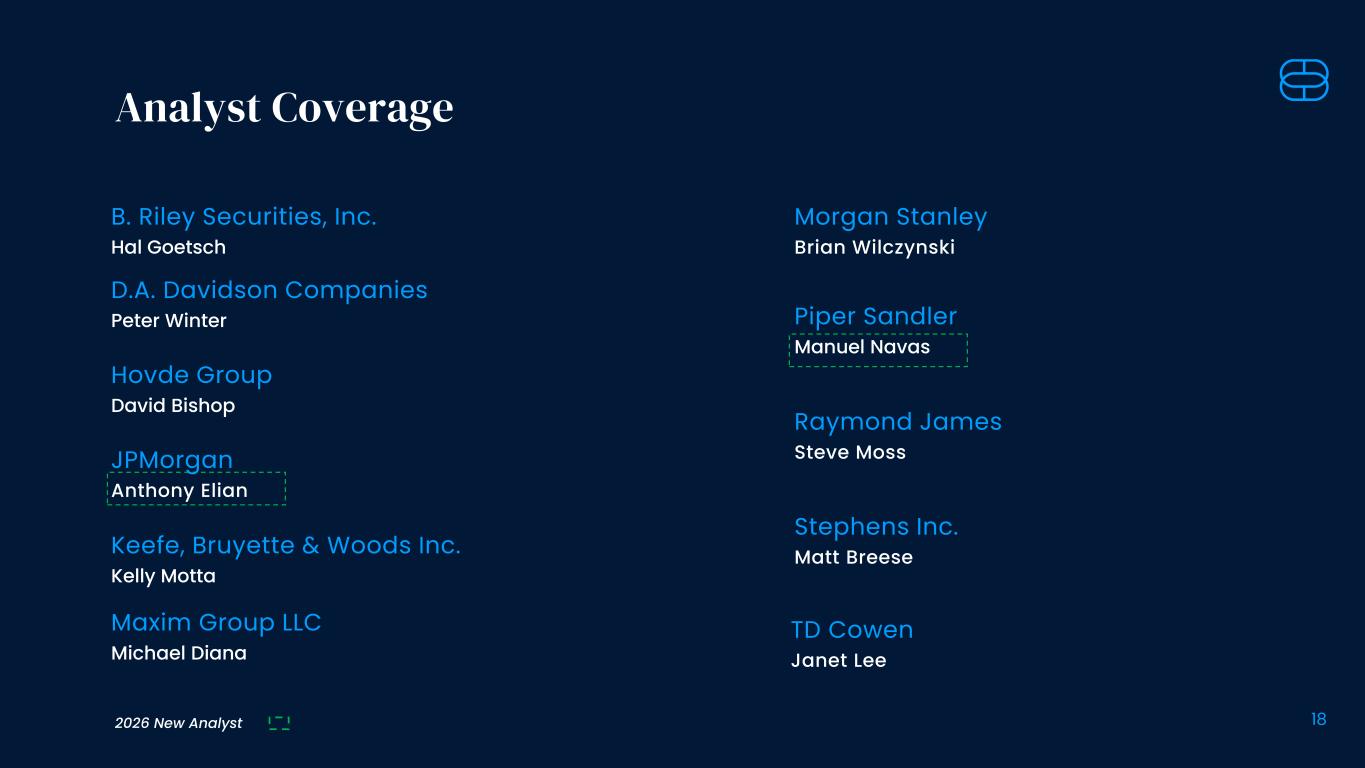
18 Analyst Coverage D.A. Davidson Companies Peter Winter Hovde Group David Bishop Keefe, Bruyette & Woods Inc. Kelly Motta Morgan Stanley Brian Wilczynski Stephens Inc. Matt Breese Raymond James Steve Moss B. Riley Securities, Inc. Hal Goetsch TD Cowen Janet Lee 2026 New Analyst JPMorgan Anthony Elian Piper Sandler Manuel Navas Maxim Group LLC Michael Diana

19 Appendix
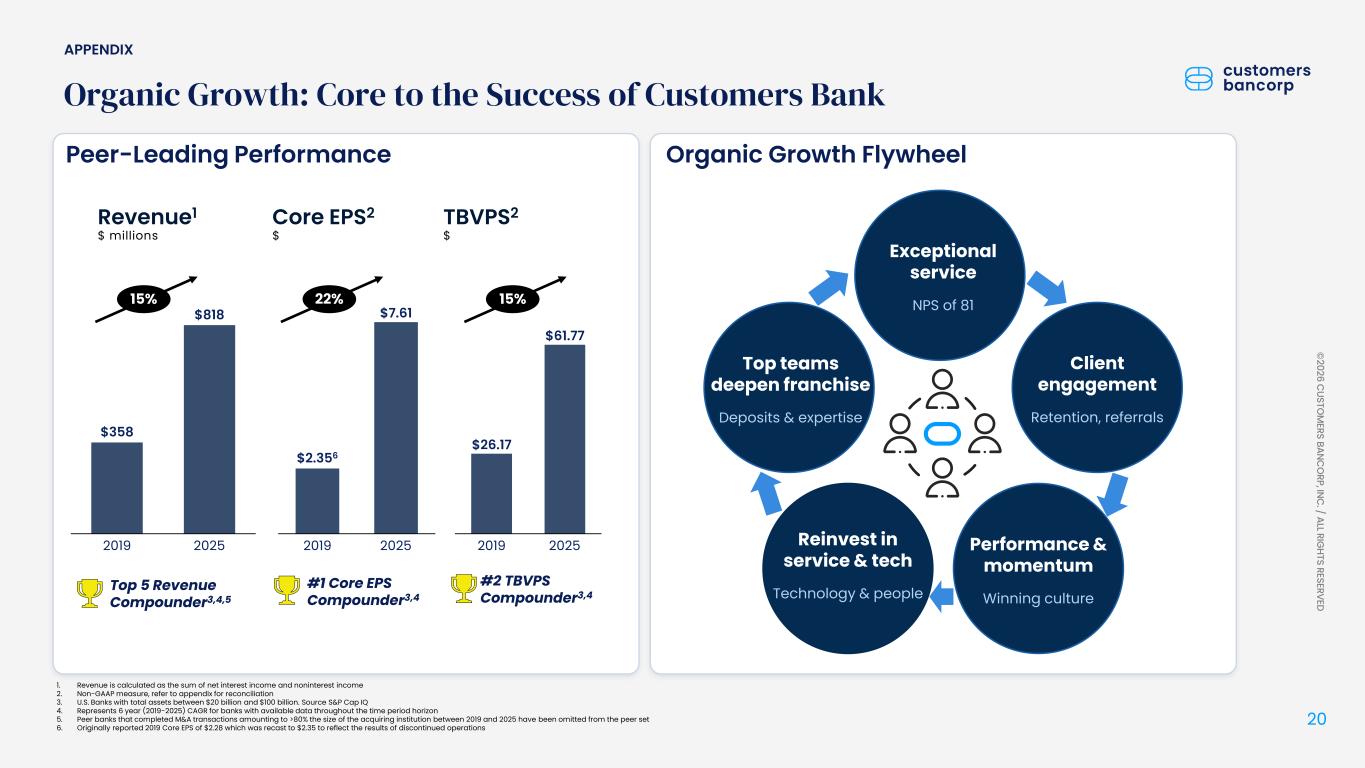
20 © 2026 C USTO M ERS BANC O RP, INC . / ALL RIG HTS RESERVED Organic Growth: Core to the Success of Customers Bank 1. Revenue is calculated as the sum of net interest income and noninterest income 2. Non-GAAP measure, refer to appendix for reconciliation 3. U.S. Banks with total assets between $20 billion and $100 billion. Source S&P Cap IQ 4. Represents 6 year (2019-2025) CAGR for banks with available data throughout the time period horizon 5. Peer banks that completed M&A transactions amounting to >80% the size of the acquiring institution between 2019 and 2025 have been omitted from the peer set 6. Originally reported 2019 Core EPS of $2.28 which was recast to $2.35 to reflect the results of discontinued operations Organic Growth FlywheelPeer-Leading Performance $7.61 2019 2025 $2.356 2019 2025 $358 $818 $26.17 $61.77 2019 2025 Top 5 Revenue Compounder3,4,5 #1 Core EPS Compounder3,4 Core EPS2 $ Revenue1 $ millions TBVPS2 $ #2 TBVPS Compounder3,4 Exceptional service NPS of 81 Client engagement Retention, referrals Performance & momentum Winning culture Reinvest in service & tech Technology & people Top teams deepen franchise Deposits & expertise APPENDIX 15% 22% 15%
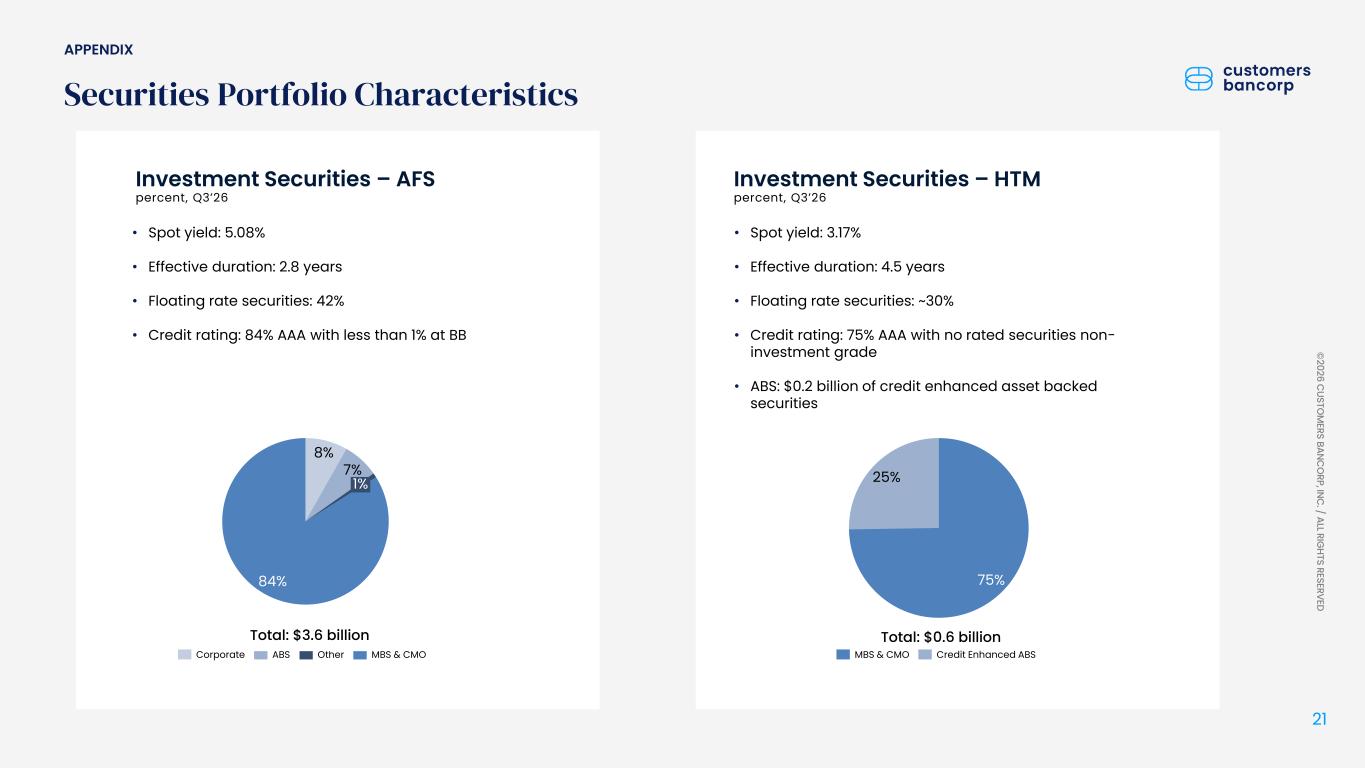
21 © 2026 C USTO M ERS BANC O RP, INC . / ALL RIG HTS RESERVED Investment Securities – AFS percent, Q3’26 Securities Portfolio Characteristics • Spot yield: 5.08% • Effective duration: 2.8 years • Floating rate securities: 42% • Credit rating: 84% AAA with less than 1% at BB Investment Securities – HTM percent, Q3’26 • Spot yield: 3.17% • Effective duration: 4.5 years • Floating rate securities: ~30% • Credit rating: 75% AAA with no rated securities non- investment grade • ABS: $0.2 billion of credit enhanced asset backed securities 75% 25% MBS & CMO Credit Enhanced ABS Total: $0.6 billion Corporate ABS Other MBS & CMO Total: $3.6 billion 8% 7% 84% 1% APPENDIX
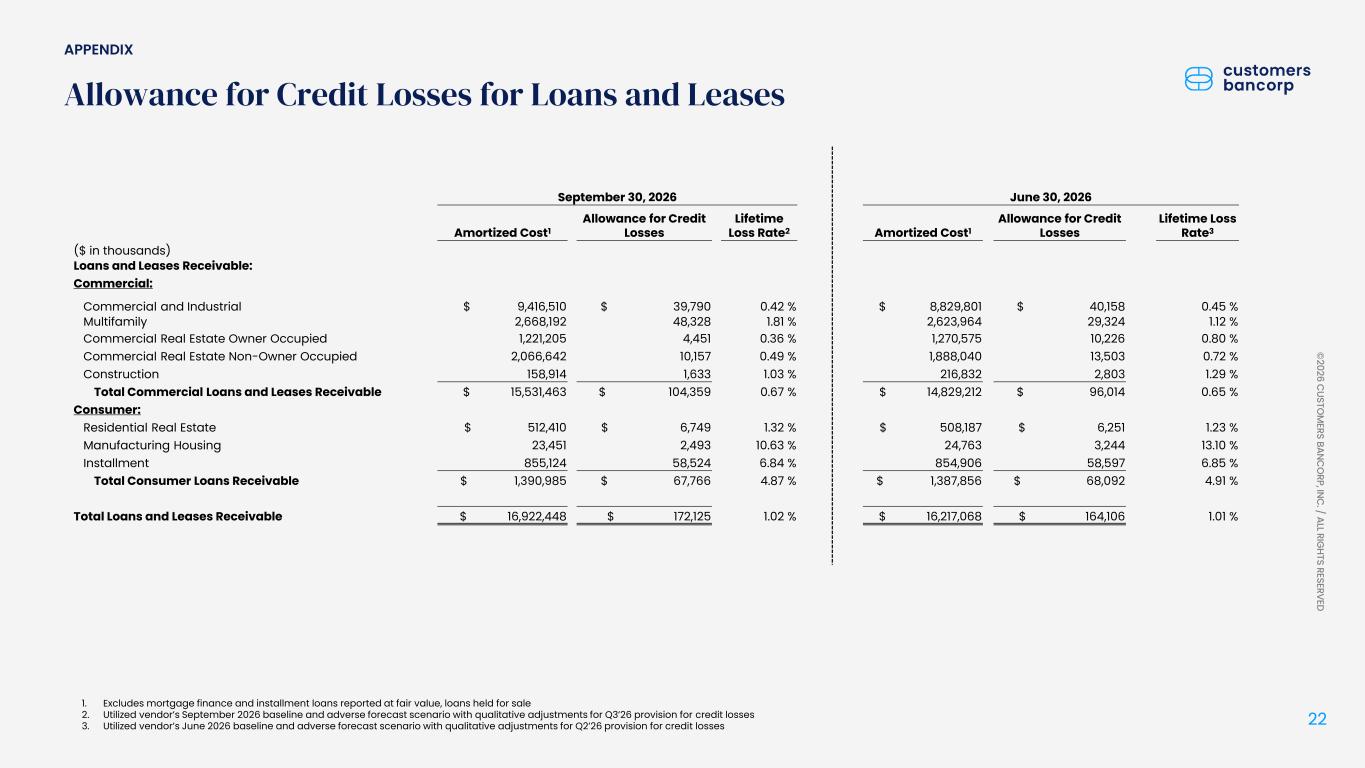
22 © 2026 C USTO M ERS BANC O RP, INC . / ALL RIG HTS RESERVED 1. Excludes mortgage finance and installment loans reported at fair value, loans held for sale 2. Utilized vendor’s September 2026 baseline and adverse forecast scenario with qualitative adjustments for Q3’26 provision for credit losses 3. Utilized vendor’s June 2026 baseline and adverse forecast scenario with qualitative adjustments for Q2’26 provision for credit losses Allowance for Credit Losses for Loans and Leases September 30, 2026 June 30, 2026 Amortized Cost1 Allowance for Credit Losses Lifetime Loss Rate2 Amortized Cost1 Allowance for Credit Losses Lifetime Loss Rate3 ($ in thousands) Loans and Leases Receivable: Commercial: Commercial and Industrial $ 9,416,510 $ 39,790 0.42 % $ 8,829,801 $ 40,158 0.45 % Multifamily 2,668,192 48,328 1.81 % 2,623,964 29,324 1.12 % Commercial Real Estate Owner Occupied 1,221,205 4,451 0.36 % 1,270,575 10,226 0.80 % Commercial Real Estate Non-Owner Occupied 2,066,642 10,157 0.49 % 1,888,040 13,503 0.72 % Construction 158,914 1,633 1.03 % 216,832 2,803 1.29 % Total Commercial Loans and Leases Receivable $ 15,531,463 $ 104,359 0.67 % $ 14,829,212 $ 96,014 0.65 % Consumer: Residential Real Estate $ 512,410 $ 6,749 1.32 % $ 508,187 $ 6,251 1.23 % Manufacturing Housing 23,451 2,493 10.63 % 24,763 3,244 13.10 % Installment 855,124 58,524 6.84 % 854,906 58,597 6.85 % Total Consumer Loans Receivable $ 1,390,985 $ 67,766 4.87 % $ 1,387,856 $ 68,092 4.91 % Total Loans and Leases Receivable $ 16,922,448 $ 172,125 1.02 % $ 16,217,068 $ 164,106 1.01 % APPENDIX
23 © 2026 C USTO M ERS BANC O RP, INC . / ALL RIG HTS RESERVED Customers believes that the non-GAAP measurements disclosed within this document are useful for investors, regulators, management and others to evaluate our core results of operations and financial condition relative to other financial institutions. These non-GAAP financial measures are frequently used by securities analysts, investors, and other interested parties in the evaluation of companies in Customers' industry. These non-GAAP financial measures exclude from corresponding GAAP measures the impact of certain elements that we do not believe are representative of our ongoing financial results, which we believe enhance an overall understanding of our performance and increases comparability of our period to period results. Investors should consider our performance and financial condition as reported under GAAP and all other relevant information when assessing our performance or financial condition. The non-GAAP measures presented are not necessarily comparable to non-GAAP measures that may be presented by other financial institutions. Although non-GAAP financial measures are frequently used in the evaluation of a company, they have limitations as analytical tools and should not be considered in isolation or as a substitute for analysis of our results of operations or financial condition as reported under GAAP. Starting in Q3 2025, certain adjustments to GAAP measures were no longer included as our intention going forward is to limit these adjustments to those items of greatest significance. The following tables present reconciliations of GAAP to non-GAAP measures disclosed within this document. Reconciliation of Non-GAAP Measures – Unaudited APPENDIX
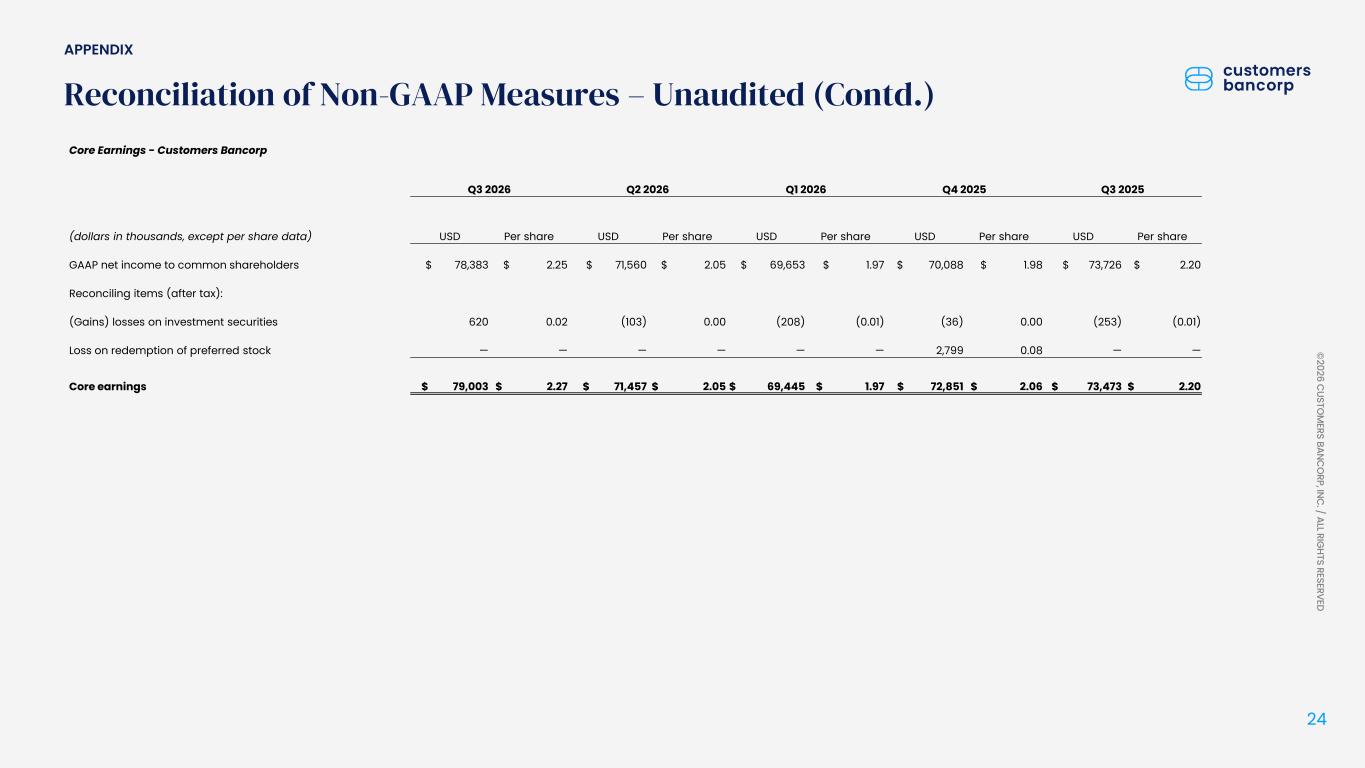
24 © 2026 C USTO M ERS BANC O RP, INC . / ALL RIG HTS RESERVED Reconciliation of Non-GAAP Measures – Unaudited (Contd.) Core Earnings - Customers Bancorp Q3 2026 Q2 2026 Q1 2026 Q4 2025 Q3 2025 (dollars in thousands, except per share data) USD Per share USD Per share USD Per share USD Per share USD Per share GAAP net income to common shareholders $ 78,383 $ 2.25 $ 71,560 $ 2.05 $ 69,653 $ 1.97 $ 70,088 $ 1.98 $ 73,726 $ 2.20 Reconciling items (after tax): (Gains) losses on investment securities 620 0.02 (103) 0.00 (208) (0.01) (36) 0.00 (253) (0.01) Loss on redemption of preferred stock — — — — — — 2,799 0.08 — — Core earnings $ 79,003 $ 2.27 $ 71,457 $ 2.05 $ 69,445 $ 1.97 $ 72,851 $ 2.06 $ 73,473 $ 2.20 APPENDIX
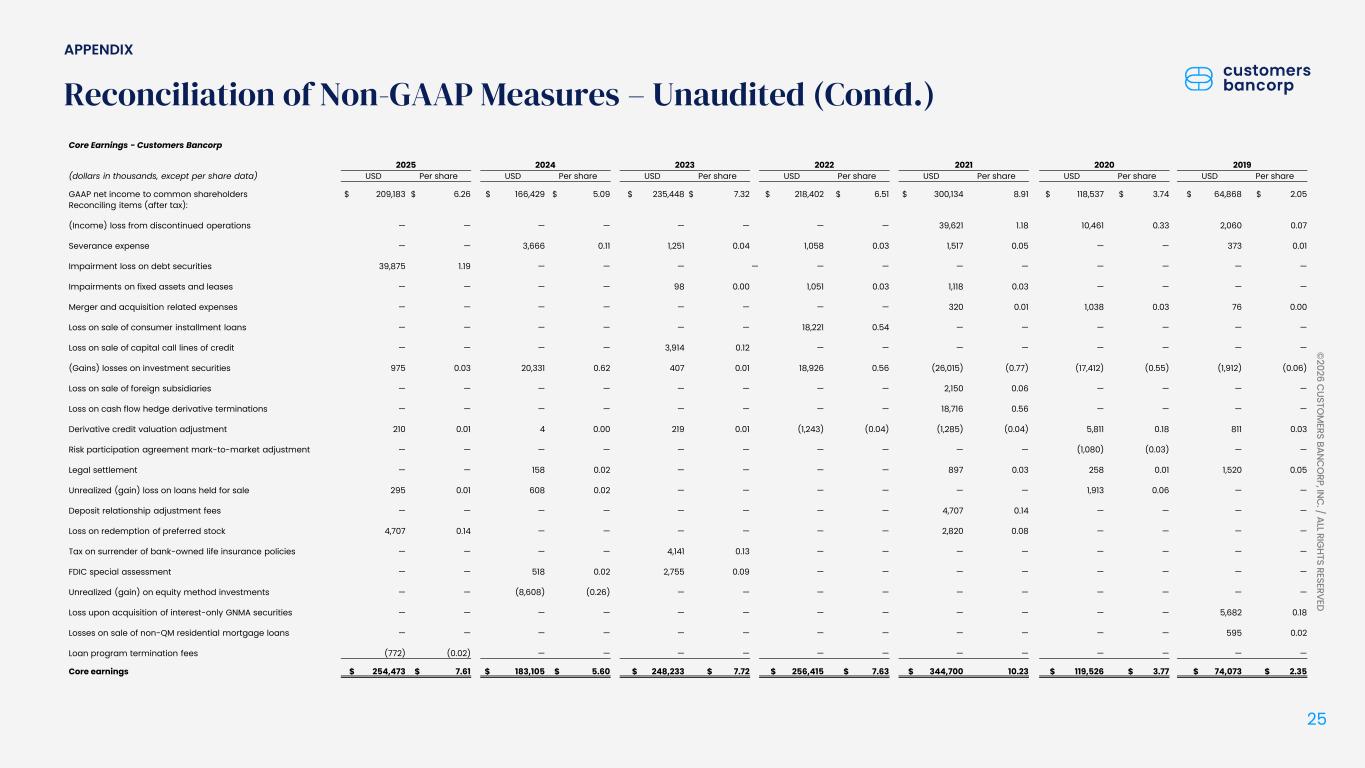
25 © 2026 C USTO M ERS BANC O RP, INC . / ALL RIG HTS RESERVED Reconciliation of Non-GAAP Measures – Unaudited (Contd.) Core Earnings - Customers Bancorp 2025 2024 2023 2022 2021 2020 2019 (dollars in thousands, except per share data) USD Per share USD Per share USD Per share USD Per share USD Per share USD Per share USD Per share GAAP net income to common shareholders $ 209,183 $ 6.26 $ 166,429 $ 5.09 $ 235,448 $ 7.32 $ 218,402 $ 6.51 $ 300,134 8.91 $ 118,537 $ 3.74 $ 64,868 $ 2.05 Reconciling items (after tax): (Income) loss from discontinued operations — — — — — — — — 39,621 1.18 10,461 0.33 2,060 0.07 Severance expense — — 3,666 0.11 1,251 0.04 1,058 0.03 1,517 0.05 — — 373 0.01 Impairment loss on debt securities 39,875 1.19 — — — — — — — — — — — — Impairments on fixed assets and leases — — — — 98 0.00 1,051 0.03 1,118 0.03 — — — — Merger and acquisition related expenses — — — — — — — — 320 0.01 1,038 0.03 76 0.00 Loss on sale of consumer installment loans — — — — — — 18,221 0.54 — — — — — — Loss on sale of capital call lines of credit — — — — 3,914 0.12 — — — — — — — — (Gains) losses on investment securities 975 0.03 20,331 0.62 407 0.01 18,926 0.56 (26,015) (0.77) (17,412) (0.55) (1,912) (0.06) Loss on sale of foreign subsidiaries — — — — — — — — 2,150 0.06 — — — — Loss on cash flow hedge derivative terminations — — — — — — — — 18,716 0.56 — — — — Derivative credit valuation adjustment 210 0.01 4 0.00 219 0.01 (1,243) (0.04) (1,285) (0.04) 5,811 0.18 811 0.03 Risk participation agreement mark-to-market adjustment — — — — — — — — — — (1,080) (0.03) — — Legal settlement — — 158 0.02 — — — — 897 0.03 258 0.01 1,520 0.05 Unrealized (gain) loss on loans held for sale 295 0.01 608 0.02 — — — — — — 1,913 0.06 — — Deposit relationship adjustment fees — — — — — — — — 4,707 0.14 — — — — Loss on redemption of preferred stock 4,707 0.14 — — — — — — 2,820 0.08 — — — — Tax on surrender of bank-owned life insurance policies — — — — 4,141 0.13 — — — — — — — — FDIC special assessment — — 518 0.02 2,755 0.09 — — — — — — — — Unrealized (gain) on equity method investments — — (8,608) (0.26) — — — — — — — — — — Loss upon acquisition of interest-only GNMA securities — — — — — — — — — — — — 5,682 0.18 Losses on sale of non-QM residential mortgage loans — — — — — — — — — — — — 595 0.02 Loan program termination fees (772) (0.02) — — — — — — — — — — — — Core earnings $ 254,473 $ 7.61 $ 183,105 $ 5.60 $ 248,233 $ 7.72 $ 256,415 $ 7.63 $ 344,700 10.23 $ 119,526 $ 3.77 $ 74,073 $ 2.35 APPENDIX
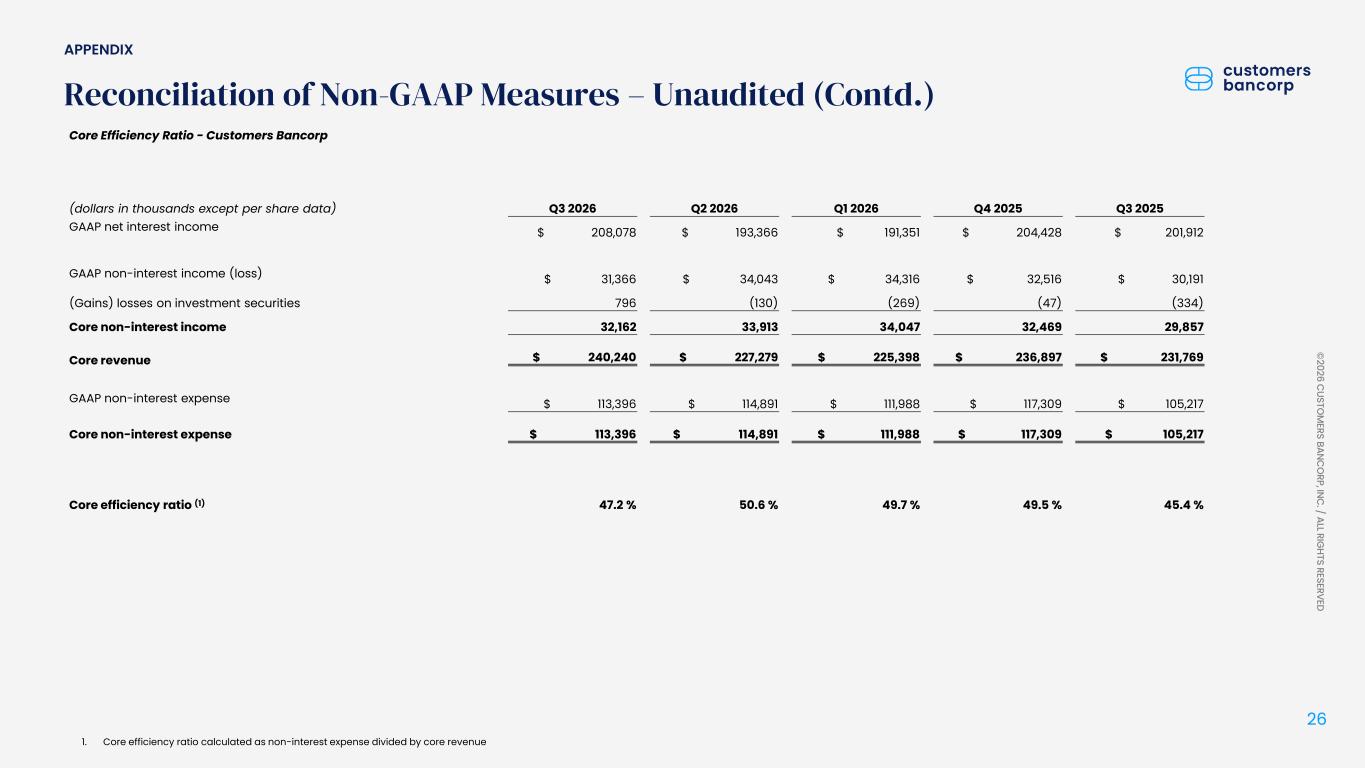
26 © 2026 C USTO M ERS BANC O RP, INC . / ALL RIG HTS RESERVED Reconciliation of Non-GAAP Measures – Unaudited (Contd.) 1. Core efficiency ratio calculated as non-interest expense divided by core revenue Core Efficiency Ratio - Customers Bancorp (dollars in thousands except per share data) Q3 2026 Q2 2026 Q1 2026 Q4 2025 Q3 2025 GAAP net interest income $ 208,078 $ 193,366 $ 191,351 $ 204,428 $ 201,912 GAAP non-interest income (loss) $ 31,366 $ 34,043 $ 34,316 $ 32,516 $ 30,191 (Gains) losses on investment securities 796 (130) (269) (47) (334) Core non-interest income 32,162 33,913 34,047 32,469 29,857 Core revenue $ 240,240 $ 227,279 $ 225,398 $ 236,897 $ 231,769 GAAP non-interest expense $ 113,396 $ 114,891 $ 111,988 $ 117,309 $ 105,217 Core non-interest expense $ 113,396 $ 114,891 $ 111,988 $ 117,309 $ 105,217 Core efficiency ratio (1) 47.2 % 50.6 % 49.7 % 49.5 % 45.4 % APPENDIX
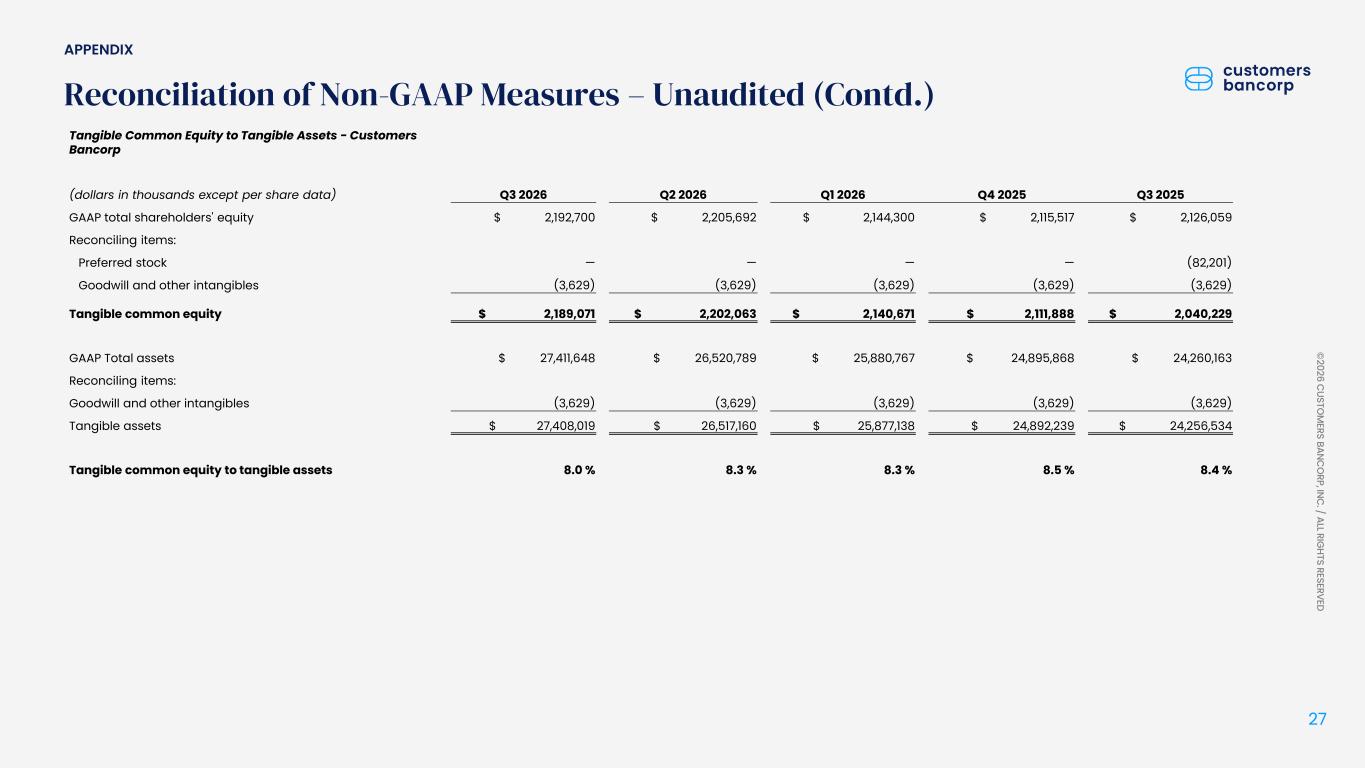
27 © 2026 C USTO M ERS BANC O RP, INC . / ALL RIG HTS RESERVED Reconciliation of Non-GAAP Measures – Unaudited (Contd.) Tangible Common Equity to Tangible Assets - Customers Bancorp (dollars in thousands except per share data) Q3 2026 Q2 2026 Q1 2026 Q4 2025 Q3 2025 GAAP total shareholders' equity $ 2,192,700 $ 2,205,692 $ 2,144,300 $ 2,115,517 $ 2,126,059 Reconciling items: Preferred stock — — — — (82,201) Goodwill and other intangibles (3,629) (3,629) (3,629) (3,629) (3,629) Tangible common equity $ 2,189,071 $ 2,202,063 $ 2,140,671 $ 2,111,888 $ 2,040,229 GAAP Total assets $ 27,411,648 $ 26,520,789 $ 25,880,767 $ 24,895,868 $ 24,260,163 Reconciling items: Goodwill and other intangibles (3,629) (3,629) (3,629) (3,629) (3,629) Tangible assets $ 27,408,019 $ 26,517,160 $ 25,877,138 $ 24,892,239 $ 24,256,534 Tangible common equity to tangible assets 8.0 % 8.3 % 8.3 % 8.5 % 8.4 % APPENDIX
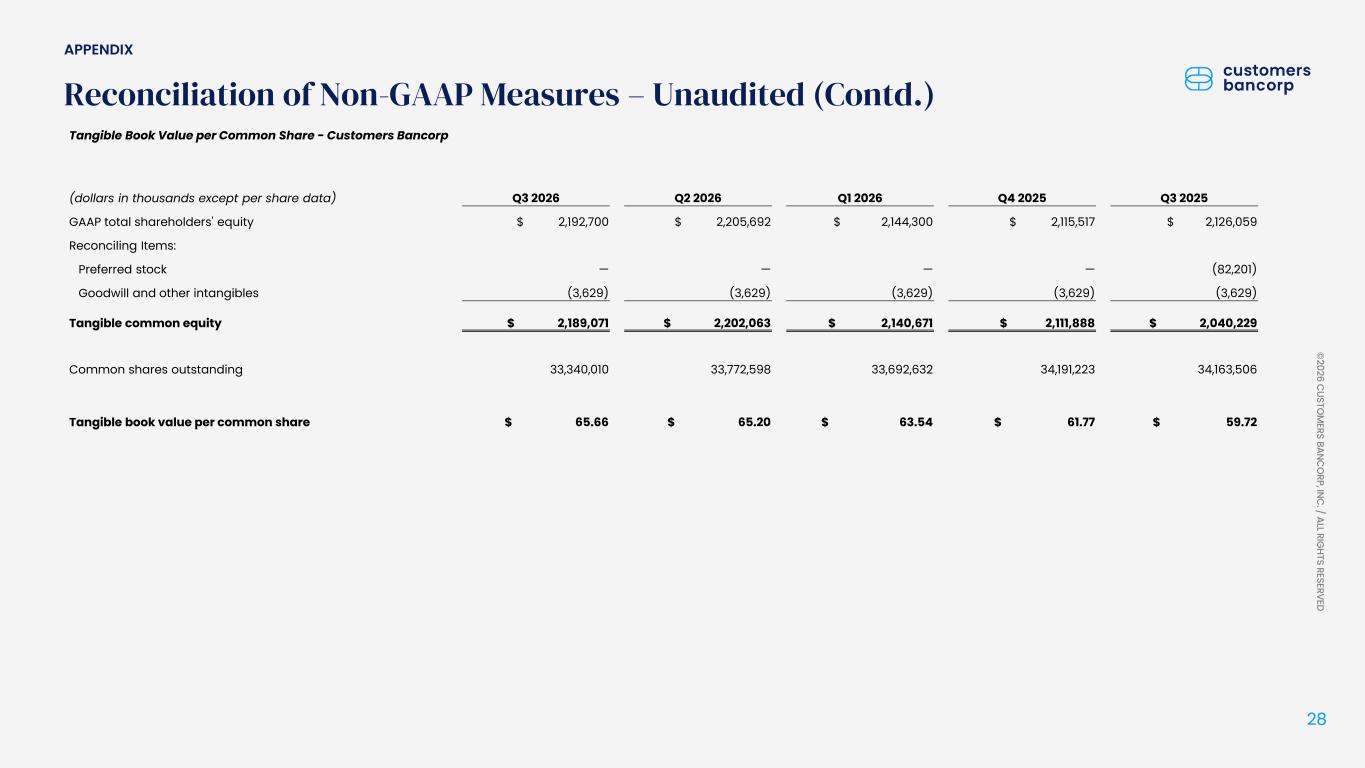
28 © 2026 C USTO M ERS BANC O RP, INC . / ALL RIG HTS RESERVED Reconciliation of Non-GAAP Measures – Unaudited (Contd.) Tangible Book Value per Common Share - Customers Bancorp (dollars in thousands except per share data) Q3 2026 Q2 2026 Q1 2026 Q4 2025 Q3 2025 GAAP total shareholders' equity $ 2,192,700 $ 2,205,692 $ 2,144,300 $ 2,115,517 $ 2,126,059 Reconciling Items: Preferred stock — — — — (82,201) Goodwill and other intangibles (3,629) (3,629) (3,629) (3,629) (3,629) Tangible common equity $ 2,189,071 $ 2,202,063 $ 2,140,671 $ 2,111,888 $ 2,040,229 Common shares outstanding 33,340,010 33,772,598 33,692,632 34,191,223 34,163,506 Tangible book value per common share $ 65.66 $ 65.20 $ 63.54 $ 61.77 $ 59.72 APPENDIX
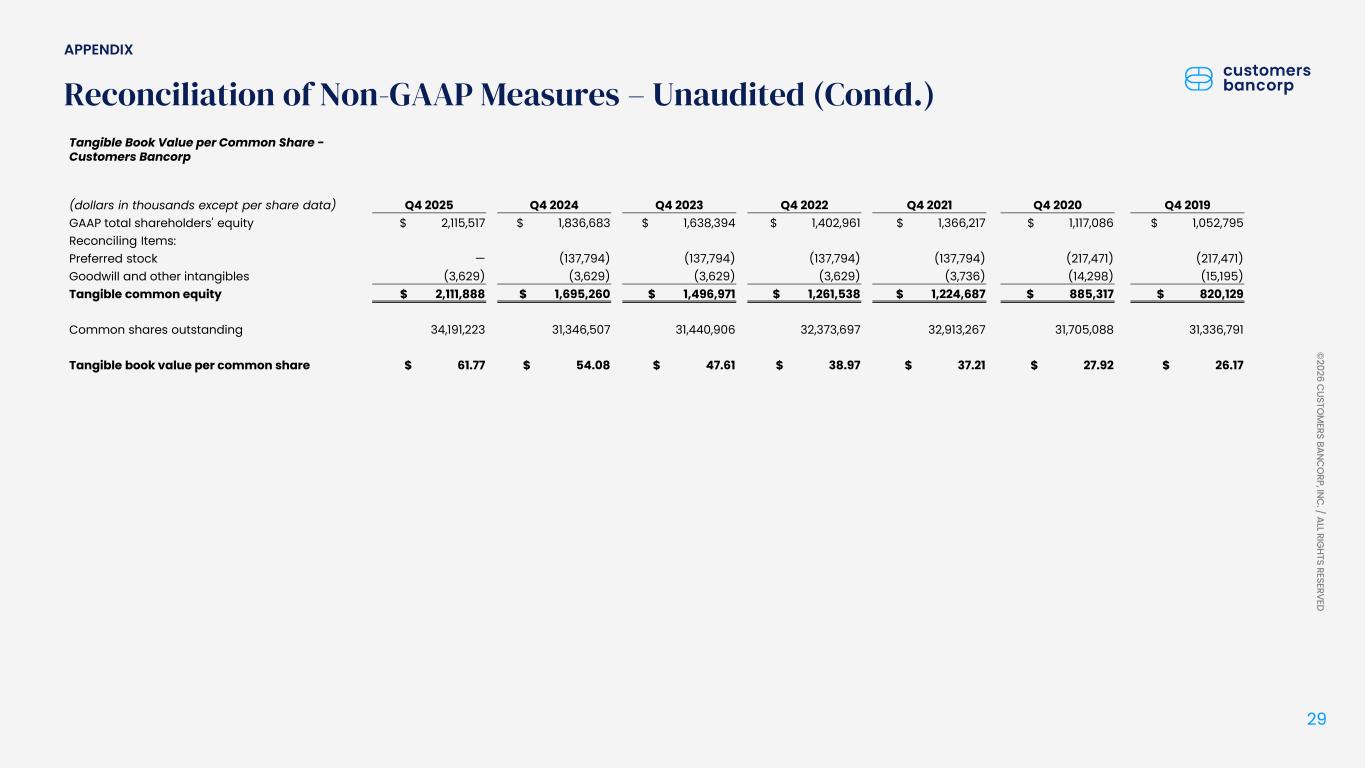
29 © 2026 C USTO M ERS BANC O RP, INC . / ALL RIG HTS RESERVED Reconciliation of Non-GAAP Measures – Unaudited (Contd.) Tangible Book Value per Common Share - Customers Bancorp (dollars in thousands except per share data) Q4 2025 Q4 2024 Q4 2023 Q4 2022 Q4 2021 Q4 2020 Q4 2019 GAAP total shareholders' equity $ 2,115,517 $ 1,836,683 $ 1,638,394 $ 1,402,961 $ 1,366,217 $ 1,117,086 $ 1,052,795 Reconciling Items: Preferred stock — (137,794) (137,794) (137,794) (137,794) (217,471) (217,471) Goodwill and other intangibles (3,629) (3,629) (3,629) (3,629) (3,736) (14,298) (15,195) Tangible common equity $ 2,111,888 $ 1,695,260 $ 1,496,971 $ 1,261,538 $ 1,224,687 $ 885,317 $ 820,129 Common shares outstanding 34,191,223 31,346,507 31,440,906 32,373,697 32,913,267 31,705,088 31,336,791 Tangible book value per common share $ 61.77 $ 54.08 $ 47.61 $ 38.97 $ 37.21 $ 27.92 $ 26.17 APPENDIX