
NASDAQ: OPBK OP Bancorp Earnings Presentation Parent Company of Open Bank • Los Angeles, California Third Quarter 2026 October 22, 2026 Exhibit 99.2
OP BANCORP • NASDAQ: OPBK | Third Quarter 2026 Forward -Looking Statements Certain matters set forth herein constitute “forward-looking statements” within the meaning of Section 27A of the Securities Act of 1933, as amended, and Section 21E of the Securities Exchange Act of 1934, as amended. All statements that are not statements of historical fact are forward looking. Forward-looking statements in this presentation include comments about the Company’s current business plans and expectations regarding future operating results, as well as management’s statements about expected future events and economic developments, plans, strategies and objectives. All such statements reflect the current intentions, beliefs and expectations of the Company’s executive management based on currently available information and current and expected market conditions. Forward-looking statements can sometimes be identified by the use of forward-looking language, such as “likely result in,” “expects,” “anticipates,” “estimates,” “forecasts,” “projects,” “intends to,” or may include other similar words or phrases, such as “believes,” “plans,” “trend,” “objective,” “continues,” “remains,” or similar expressions, or future or conditional verbs, such as “will,” “would,” “should,” “could,” “may,” “might,” “can,” or similar verbs. Readers should not construe these statements as assurances of a given level of performance, or as promises that we will take the actions our management currently expects. Our forward-looking statements are subject to risks and uncertainties that could cause actual results, performance or achievements to differ materially from those projected, or that could cause us to change plans or strategies or otherwise to take actions that differ from those we currently expect. The known risks and uncertainties that may have these effects are described in Part II, Item 1A, of our Quarterly Report on Form 10-Q for the period ended June 30, 2026 under the heading “Risk Factors”, and in our other filings with the Securities and Exchange Commission. You should read all forward-looking statements in the context of the foregoing and should not consider them to be reliable predictions of future events or as assurances of a particular level of performance or intended course of action. Any forward-looking statement speaks only as of the date on which it is made, and we do not undertake any obligation to update or review any forward- looking statement, whether as a result of new information, future developments or otherwise except as required by applicable law. 2
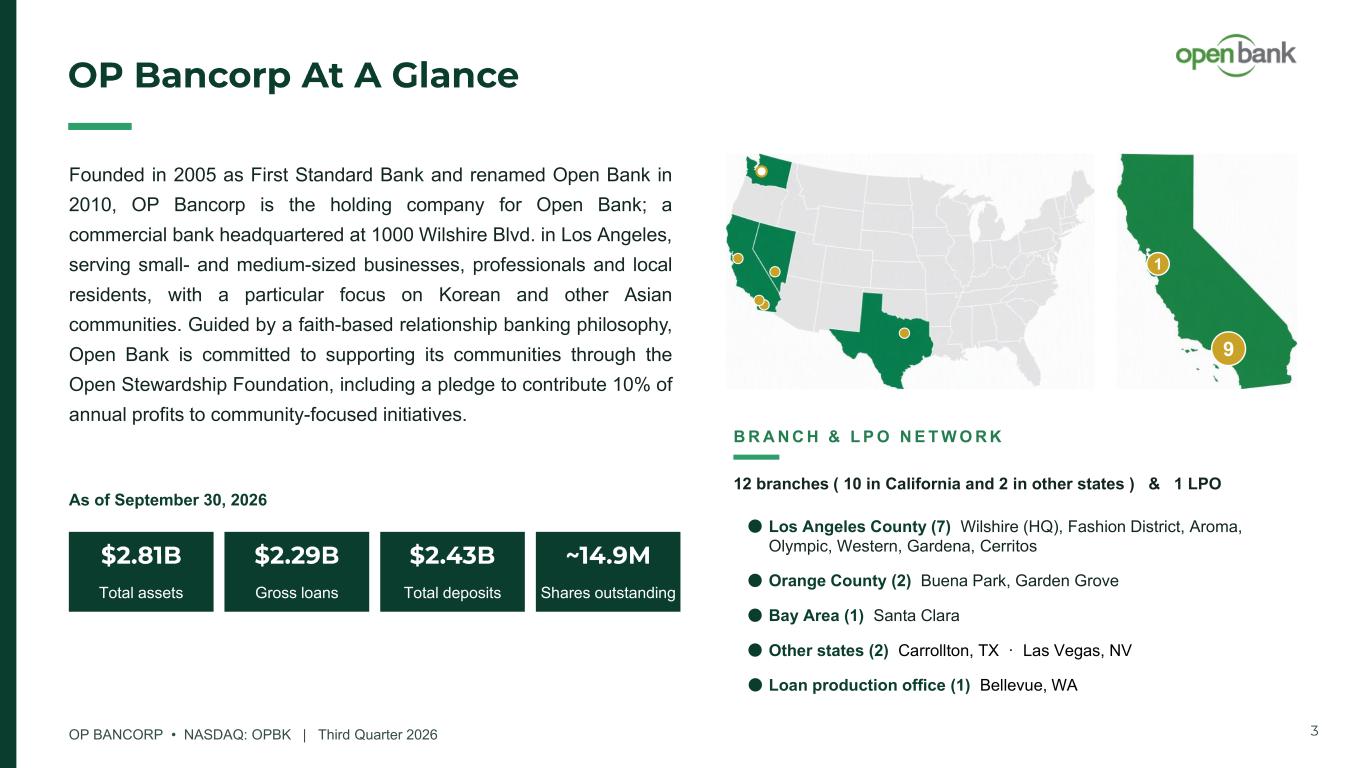
OP BANCORP • NASDAQ: OPBK | Third Quarter 2026 OP Bancorp At A Glance 9 1 12 branches ( 10 in California and 2 in other states ) & 1 LPO B R A N C H & L P O N E T W O R K Los Angeles County (7) Wilshire (HQ), Fashion District, Aroma, Olympic, Western, Gardena, Cerritos Orange County (2) Buena Park, Garden Grove Bay Area (1) Santa Clara Other states (2) Carrollton, TX · Las Vegas, NV Loan production office (1) Bellevue, WA Founded in 2005 as First Standard Bank and renamed Open Bank in 2010, OP Bancorp is the holding company for Open Bank; a commercial bank headquartered at 1000 Wilshire Blvd. in Los Angeles, serving small- and medium-sized businesses, professionals and local residents, with a particular focus on Korean and other Asian communities. Guided by a faith-based relationship banking philosophy, Open Bank is committed to supporting its communities through the Open Stewardship Foundation, including a pledge to contribute 10% of annual profits to community-focused initiatives. $2.81B Total assets $2.29B Gross loans $2.43B Total deposits ~14.9M Shares outstanding 3 As of September 30, 2026

THIRD QUARTER 2026 Financial Results
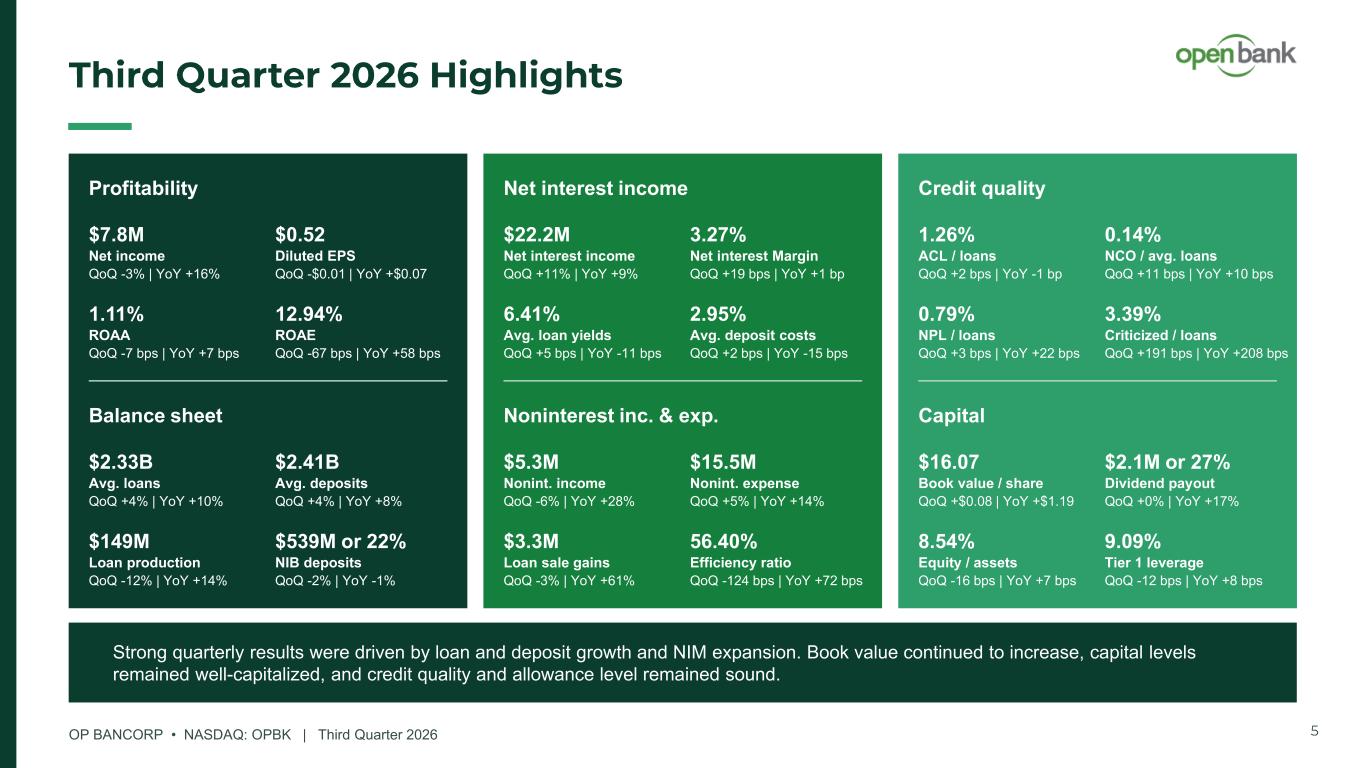
OP BANCORP • NASDAQ: OPBK | Third Quarter 2026 Third Quarter 2026 Highlights Strong quarterly results were driven by loan and deposit growth and NIM expansion. Book value continued to increase, capital levels remained well-capitalized, and credit quality and allowance level remained sound. Profitability Net income $7.8M QoQ -3% | YoY +16% Diluted EPS $0.52 QoQ -$0.01 | YoY +$0.07 ROAA 1.11% QoQ -7 bps | YoY +7 bps ROAE 12.94% QoQ -67 bps | YoY +58 bps Balance sheet Avg. loans $2.33B QoQ +4% | YoY +10% Avg. deposits $2.41B QoQ +4% | YoY +8% Loan production $149M QoQ -12% | YoY +14% NIB deposits $539M or 22% QoQ -2% | YoY -1% Net interest income Net interest income $22.2M QoQ +11% | YoY +9% Net interest Margin 3.27% QoQ +19 bps | YoY +1 bp Avg. loan yields 6.41% QoQ +5 bps | YoY -11 bps Avg. deposit costs 2.95% QoQ +2 bps | YoY -15 bps Noninterest inc. & exp. Nonint. income $5.3M QoQ -6% | YoY +28% Nonint. expense $15.5M QoQ +5% | YoY +14% Loan sale gains $3.3M QoQ -3% | YoY +61% Efficiency ratio 56.40% QoQ -124 bps | YoY +72 bps Credit quality NCO / avg. loans 0.14% QoQ +11 bps | YoY +10 bps ACL / loans 1.26% QoQ +2 bps | YoY -1 bp NPL / loans 0.79% QoQ +3 bps | YoY +22 bps Criticized / loans 3.39% QoQ +191 bps | YoY +208 bps Capital Equity / assets 8.54% QoQ -16 bps | YoY +7 bps Book value / share $16.07 QoQ +$0.08 | YoY +$1.19 Dividend payout $2.1M or 27% QoQ +0% | YoY +17% Tier 1 leverage 9.09% QoQ -12 bps | YoY +8 bps 5
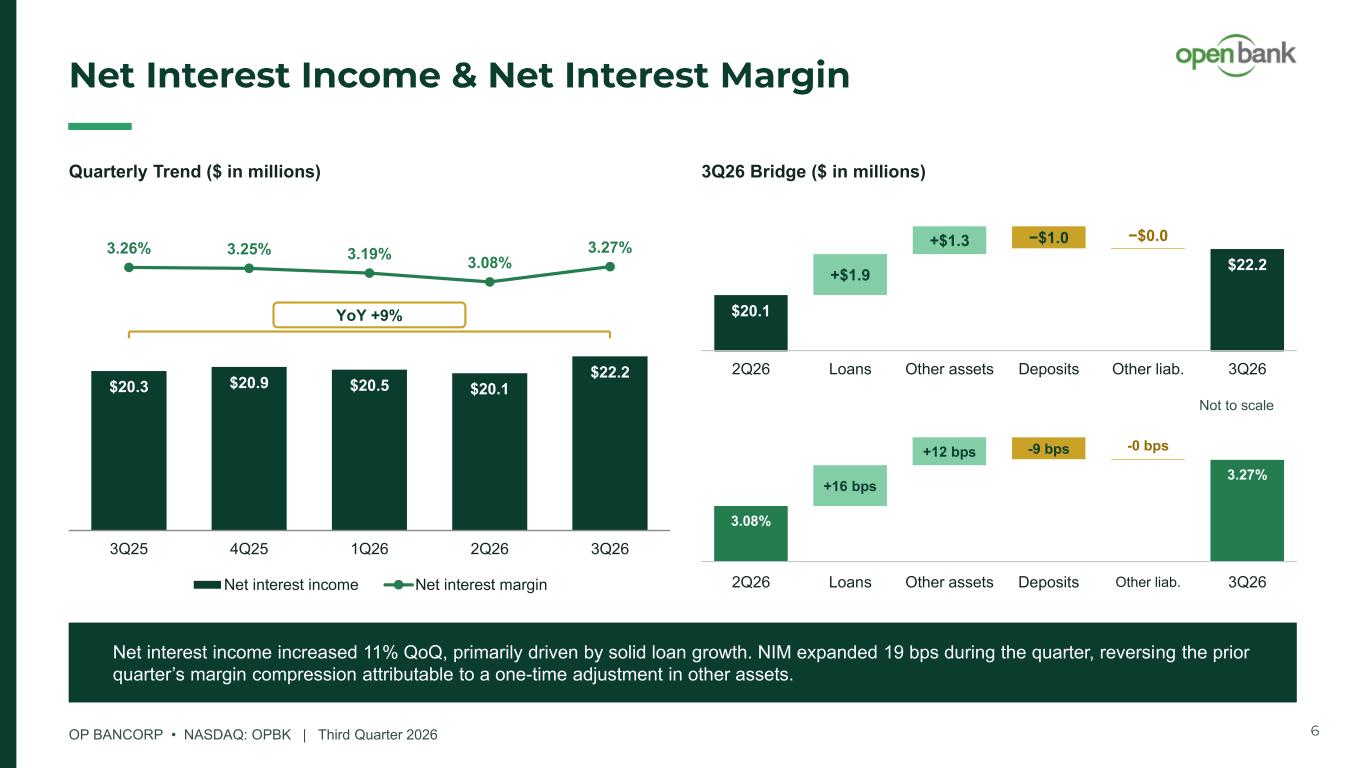
OP BANCORP • NASDAQ: OPBK | Third Quarter 2026 Net Interest Income & Net Interest Margin Quarterly Trend ($ in millions) $20.3 $20.9 $20.5 $20.1 $22.2 3.26% 3.25% 3.19% 3.08% 3.27% 3Q25 4Q25 1Q26 2Q26 3Q26 Net interest income Net interest margin 3Q26 Bridge ($ in millions) −$1.0 −$0.0 +$1.9 +$1.3 $20.1 $22.2 2Q26 Loans Other assets Deposits Other liab. 3Q26 Net interest income increased 11% QoQ, primarily driven by solid loan growth. NIM expanded 19 bps during the quarter, reversing the prior quarter’s margin compression attributable to a one-time adjustment in other assets. 6 3.08% 2Q26 +16 bps Loans +12 bps Other assets -9 bps Deposits -0 bps Other liab. 3.27% 3Q26 Not to scale YoY +9%
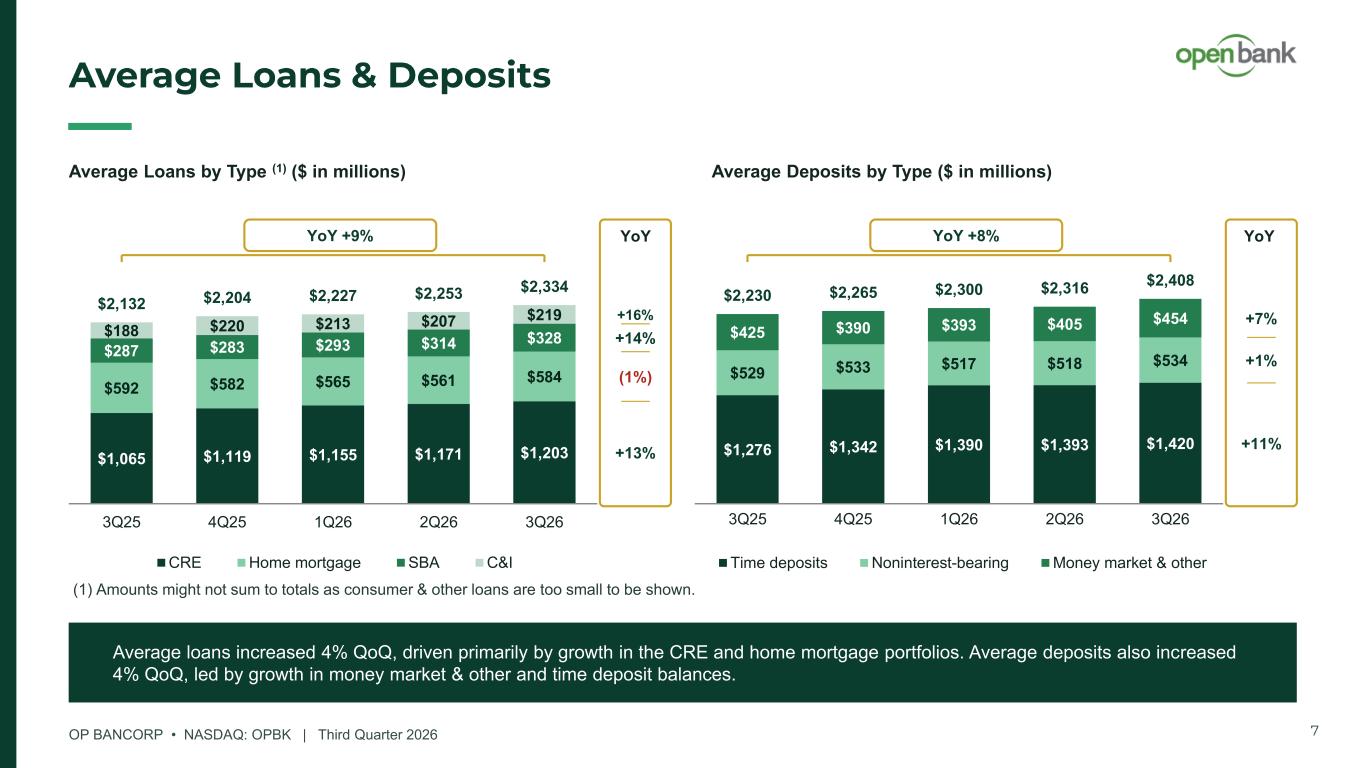
OP BANCORP • NASDAQ: OPBK | Third Quarter 2026 Average Loans & Deposits Average loans increased 4% QoQ, driven primarily by growth in the CRE and home mortgage portfolios. Average deposits also increased 4% QoQ, led by growth in money market & other and time deposit balances. Average Loans by Type (1) ($ in millions) $1,065 $1,119 $1,155 $1,171 $1,203 $592 $582 $565 $561 $584 $287 $283 $293 $314 $328$188 $220 $213 $207 $219 $2,132 $2,204 $2,227 $2,253 $2,334 3Q25 4Q25 1Q26 2Q26 3Q26 CRE Home mortgage SBA C&I Average Deposits by Type ($ in millions) $1,276 $1,342 $1,390 $1,393 $1,420 $529 $533 $517 $518 $534 $425 $390 $393 $405 $454 $2,230 $2,265 $2,300 $2,316 $2,408 3Q25 4Q25 1Q26 2Q26 3Q26 Time deposits Noninterest-bearing Money market & other (1) Amounts might not sum to totals as consumer & other loans are too small to be shown. 7 YoY +9% YoY +16% +14% (1%) +13% YoY +8% YoY +7% +1% +11%
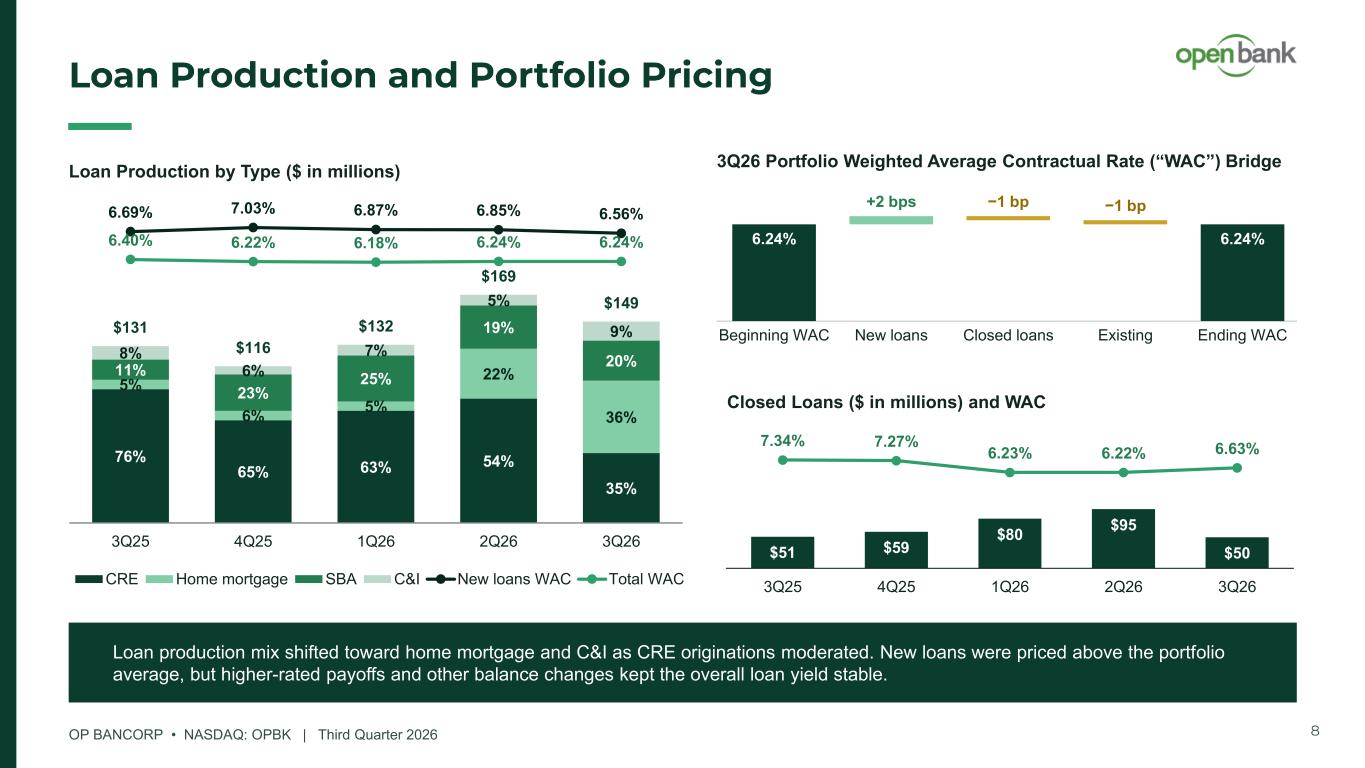
OP BANCORP • NASDAQ: OPBK | Third Quarter 2026 Loan Production and Portfolio Pricing Loan Production by Type ($ in millions) 76% 65% 63% 54% 35% 5% 6% 5% 22% 36% 11% 23% 25% 19% 20% 8% 6% 7% 5% 9% 6.69% 7.03% 6.87% 6.85% 6.56% 6.40% 6.22% 6.18% 6.24% 6.24% $131 $116 $132 $169 $149 3Q25 4Q25 1Q26 2Q26 3Q26 CRE Home mortgage SBA C&I New loans WAC Total WAC 3Q26 Portfolio Weighted Average Contractual Rate (“WAC”) Bridge Loan production mix shifted toward home mortgage and C&I as CRE originations moderated. New loans were priced above the portfolio average, but higher-rated payoffs and other balance changes kept the overall loan yield stable. 8 6.24% Beginning WAC +2 bps New loans −1 bp Closed loans −1 bp Existing 6.24% Ending WAC Closed Loans ($ in millions) and WAC $51 $59 $80 $95 $50 7.34% 7.27% 6.23% 6.22% 6.63% 3Q25 4Q25 1Q26 2Q26 3Q26
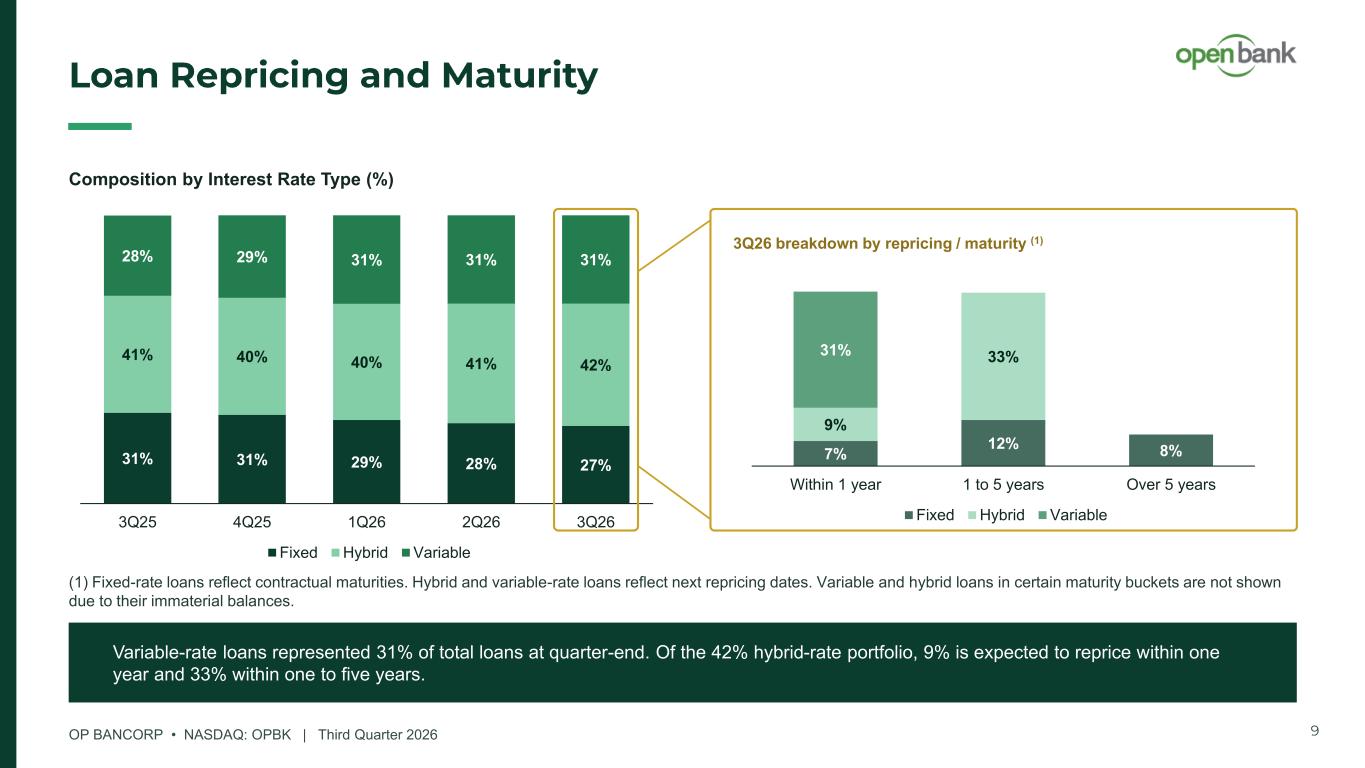
OP BANCORP • NASDAQ: OPBK | Third Quarter 2026 Loan Repricing and Maturity Variable-rate loans represented 31% of total loans at quarter-end. Of the 42% hybrid-rate portfolio, 9% is expected to reprice within one year and 33% within one to five years. 9 Composition by Interest Rate Type (%) 31% 31% 29% 28% 27% 41% 40% 40% 41% 42% 28% 29% 31% 31% 31% 3Q25 4Q25 1Q26 2Q26 3Q26 Fixed Hybrid Variable 7% 12% 8% 9% 33%31% Within 1 year 1 to 5 years Over 5 years Fixed Hybrid Variable (1) Fixed-rate loans reflect contractual maturities. Hybrid and variable-rate loans reflect next repricing dates. Variable and hybrid loans in certain maturity buckets are not shown due to their immaterial balances. 3Q26 breakdown by repricing / maturity (1)
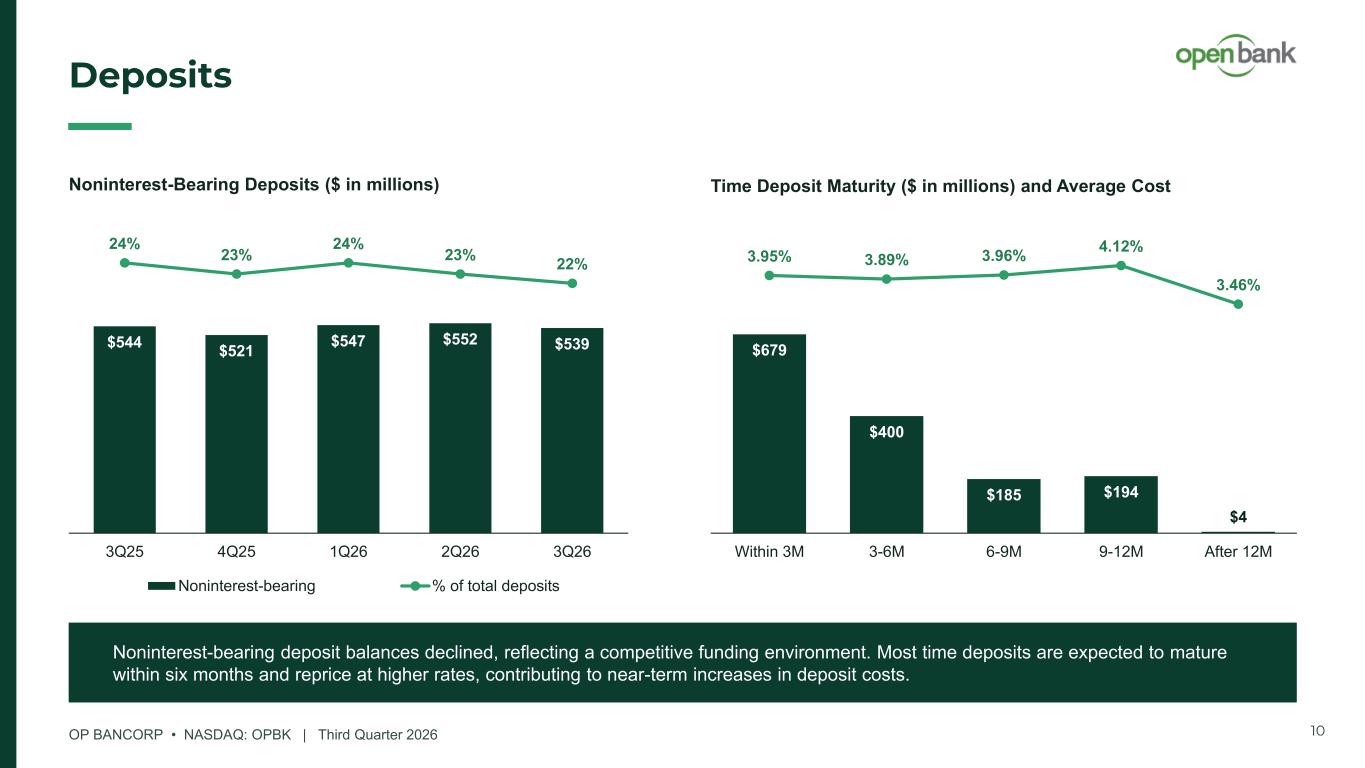
OP BANCORP • NASDAQ: OPBK | Third Quarter 2026 Deposits Noninterest-bearing deposit balances declined, reflecting a competitive funding environment. Most time deposits are expected to mature within six months and reprice at higher rates, contributing to near-term increases in deposit costs. 10 Time Deposit Maturity ($ in millions) and Average Cost $679 $400 $185 $194 $4 3.95% 3.89% 3.96% 4.12% 3.46% Within 3M 3-6M 6-9M 9-12M After 12M Noninterest-Bearing Deposits ($ in millions) $544 $521 $547 $552 $539 24% 23% 24% 23% 22% 3Q25 4Q25 1Q26 2Q26 3Q26 Noninterest-bearing % of total deposits
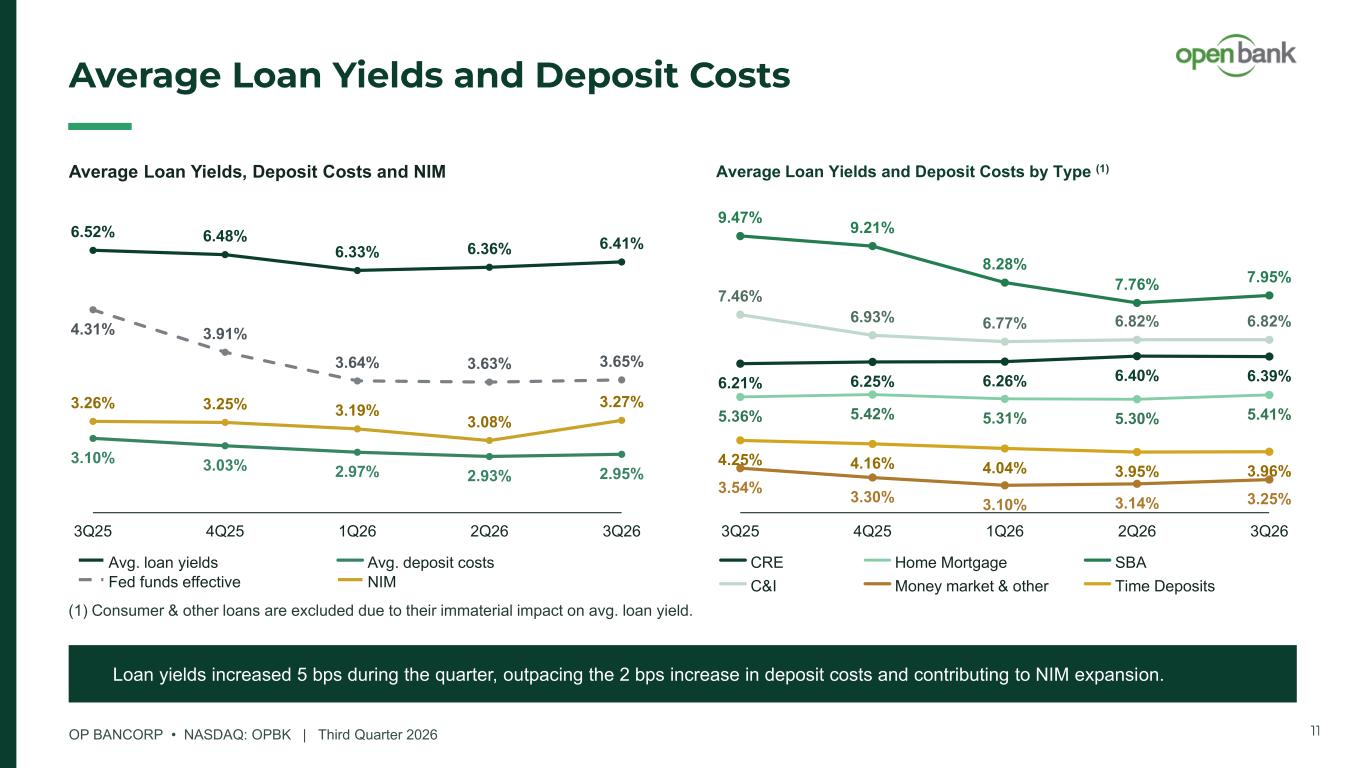
OP BANCORP • NASDAQ: OPBK | Third Quarter 2026 Average Loan Yields and Deposit Costs Loan yields increased 5 bps during the quarter, outpacing the 2 bps increase in deposit costs and contributing to NIM expansion. 11 6.21% 6.25% 6.26% 6.40% 6.39% 5.36% 5.42% 5.31% 5.30% 5.41% 9.47% 9.21% 8.28% 7.76% 7.95% 7.46% 6.93% 6.77% 6.82% 6.82% 3.54% 3.30% 3.10% 3.14% 3.25% 4.25% 4.16% 4.04% 3.95% 3.96% 3Q25 4Q25 1Q26 2Q26 3Q26 Average Loan Yields and Deposit Costs by Type (1) (1) Consumer & other loans are excluded due to their immaterial impact on avg. loan yield. 3.10% 3.03% 2.97% 2.93% 2.95% 4.31% 3.91% 3.64% 3.63% 3.65% 3.26% 3.25% 3.19% 3.08% 3.27% 6.52% 6.48% 6.33% 6.36% 6.41% 3Q25 4Q25 1Q26 2Q26 3Q26 Average Loan Yields, Deposit Costs and NIM Avg. loan yields Avg. deposit costs Fed funds effective NIM CRE Home Mortgage SBA C&I Money market & other Time Deposits
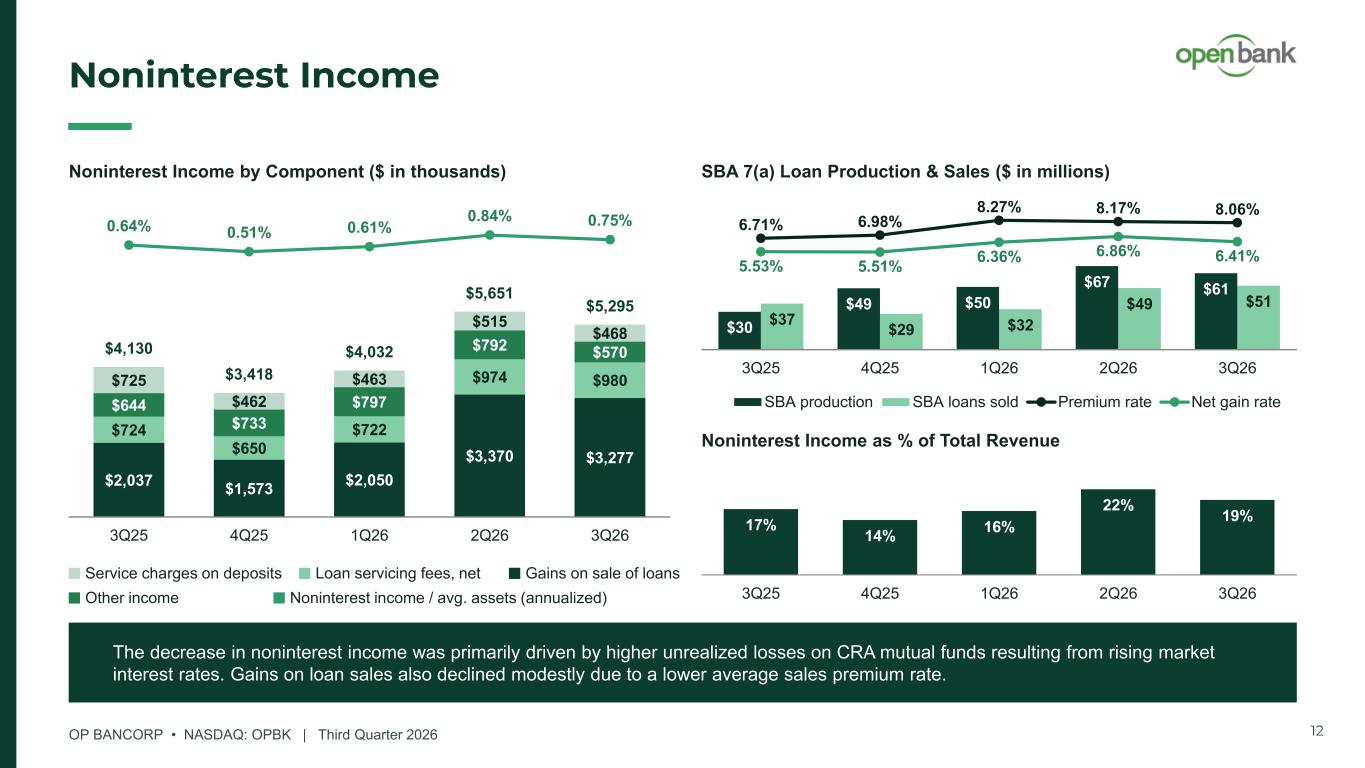
OP BANCORP • NASDAQ: OPBK | Third Quarter 2026 Noninterest Income Noninterest Income by Component ($ in thousands) $2,037 $1,573 $2,050 $3,370 $3,277 $724 $650 $722 $974 $980 $644 $733 $797 $792 $570 $725 $462 $463 $515 $468 $4,130 $3,418 $4,032 $5,651 $5,295 0.64% 0.51% 0.61% 0.84% 0.75% 3Q25 4Q25 1Q26 2Q26 3Q26 SBA 7(a) Loan Production & Sales ($ in millions) $30 $49 $50 $67 $61 $37 $29 $32 $49 $51 6.71% 6.98% 8.27% 8.17% 8.06% 5.53% 5.51% 6.36% 6.86% 6.41% 3Q25 4Q25 1Q26 2Q26 3Q26 SBA production SBA loans sold Premium rate Net gain rate The decrease in noninterest income was primarily driven by higher unrealized losses on CRA mutual funds resulting from rising market interest rates. Gains on loan sales also declined modestly due to a lower average sales premium rate. 12 Noninterest Income as % of Total Revenue 17% 14% 16% 22% 19% 3Q25 4Q25 1Q26 2Q26 3Q26 Service charges on deposits Loan servicing fees, net Gains on sale of loans Other income Noninterest income / avg. assets (annualized)
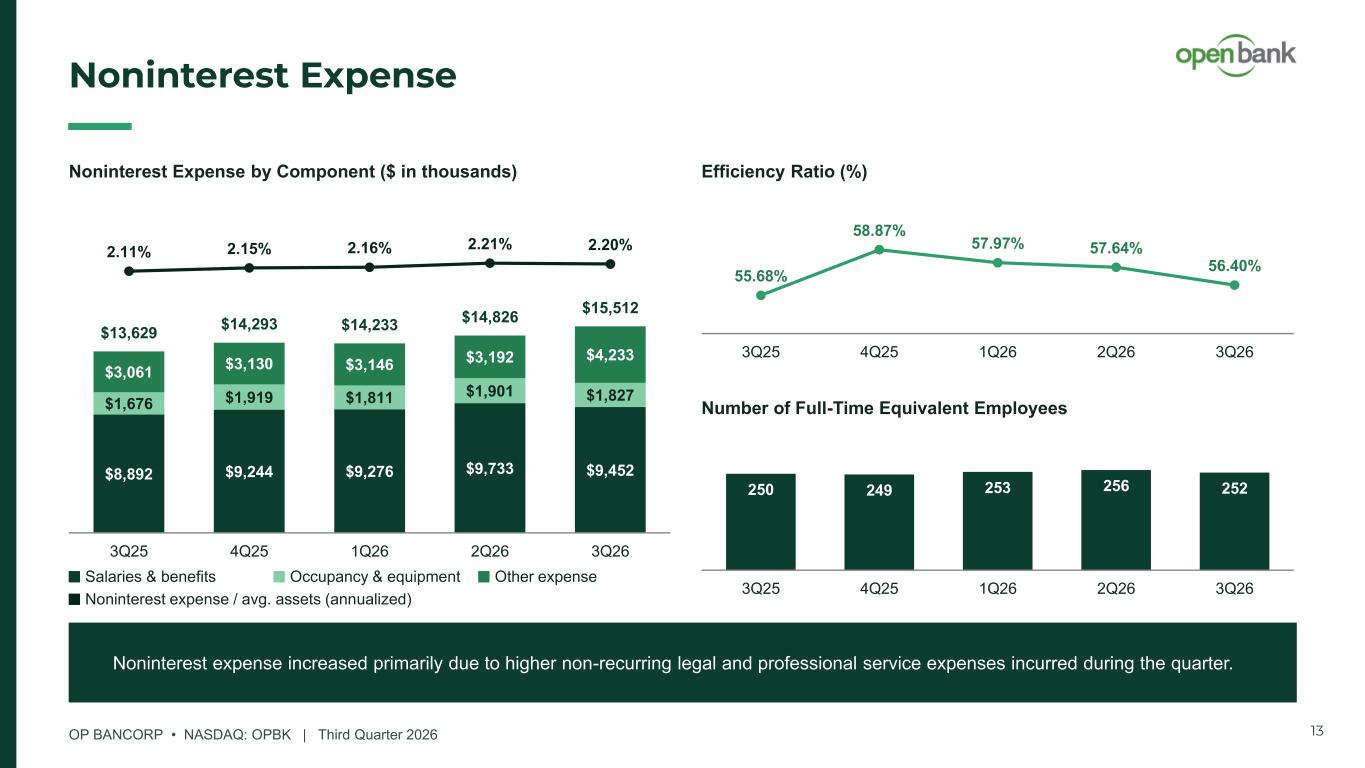
OP BANCORP • NASDAQ: OPBK | Third Quarter 2026 Noninterest Expense Noninterest Expense by Component ($ in thousands) $8,892 $9,244 $9,276 $9,733 $9,452 $1,676 $1,919 $1,811 $1,901 $1,827 $3,061 $3,130 $3,146 $3,192 $4,233 $13,629 $14,293 $14,233 $14,826 $15,512 2.11% 2.15% 2.16% 2.21% 2.20% 3Q25 4Q25 1Q26 2Q26 3Q26 Efficiency Ratio (%) 55.68% 58.87% 57.97% 57.64% 56.40% 3Q25 4Q25 1Q26 2Q26 3Q26 Number of Full-Time Equivalent Employees 250 249 253 256 252 3Q25 4Q25 1Q26 2Q26 3Q26 Noninterest expense increased primarily due to higher non-recurring legal and professional service expenses incurred during the quarter. 13 Salaries & benefits Occupancy & equipment Other expense Noninterest expense / avg. assets (annualized)
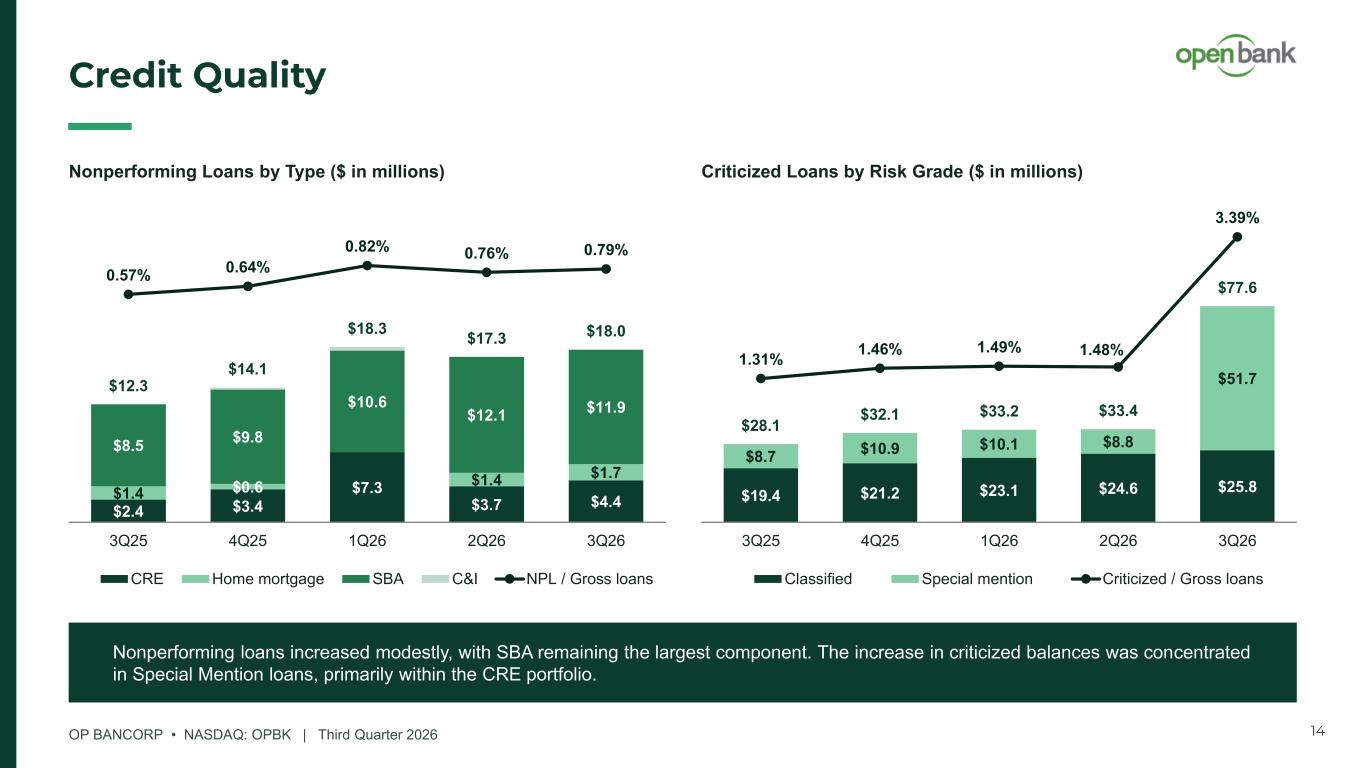
OP BANCORP • NASDAQ: OPBK | Third Quarter 2026 Credit Quality Nonperforming Loans by Type ($ in millions) $2.4 $3.4 $7.3 $3.7 $4.4 $1.4 $0.6 $1.4 $1.7 $8.5 $9.8 $10.6 $12.1 $11.9 $12.3 $14.1 $18.3 $17.3 $18.0 0.57% 0.64% 0.82% 0.76% 0.79% 3Q25 4Q25 1Q26 2Q26 3Q26 CRE Home mortgage SBA C&I NPL / Gross loans Criticized Loans by Risk Grade ($ in millions) $19.4 $21.2 $23.1 $24.6 $25.8 $8.7 $10.9 $10.1 $8.8 $51.7 $28.1 $32.1 $33.2 $33.4 $77.6 1.31% 1.46% 1.49% 1.48% 3.39% 3Q25 4Q25 1Q26 2Q26 3Q26 Classified Special mention Criticized / Gross loans 14 Nonperforming loans increased modestly, with SBA remaining the largest component. The increase in criticized balances was concentrated in Special Mention loans, primarily within the CRE portfolio.
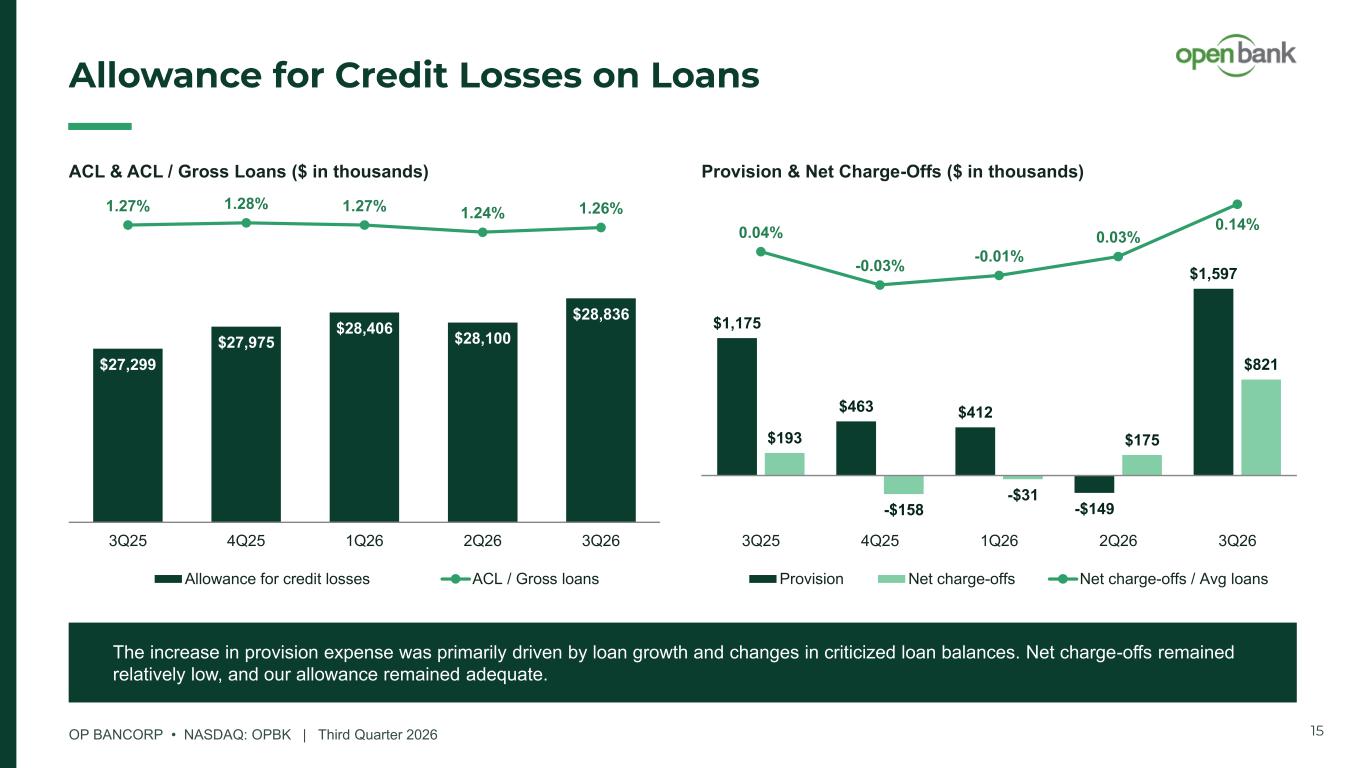
OP BANCORP • NASDAQ: OPBK | Third Quarter 2026 Allowance for Credit Losses on Loans ACL & ACL / Gross Loans ($ in thousands) $27,299 $27,975 $28,406 $28,100 $28,836 1.27% 1.28% 1.27% 1.24% 1.26% 3Q25 4Q25 1Q26 2Q26 3Q26 Allowance for credit losses ACL / Gross loans Provision & Net Charge-Offs ($ in thousands) $1,175 $463 $412 -$149 $1,597 $193 -$158 -$31 $175 $821 0.04% -0.03% -0.01% 0.03% 0.14% 3Q25 4Q25 1Q26 2Q26 3Q26 Provision Net charge-offs Net charge-offs / Avg loans The increase in provision expense was primarily driven by loan growth and changes in criticized loan balances. Net charge-offs remained relatively low, and our allowance remained adequate. 15
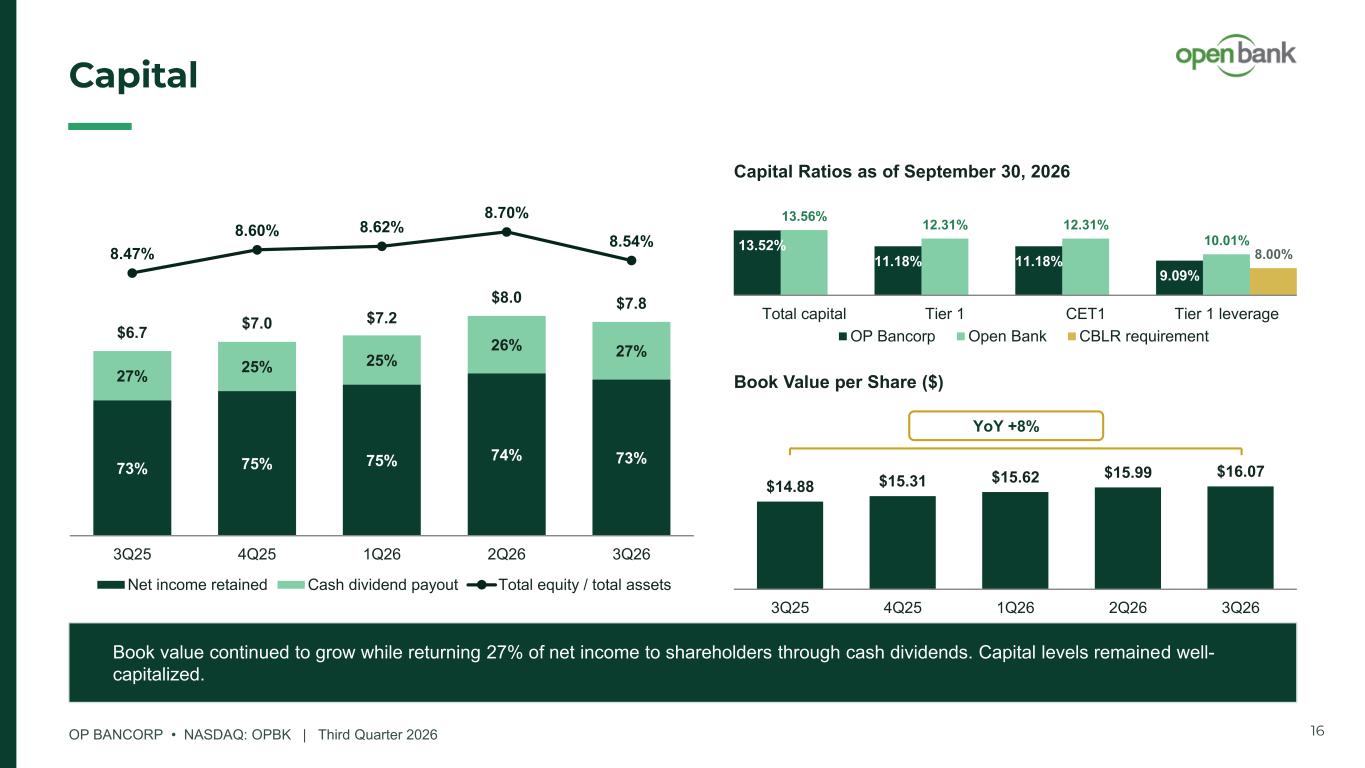
OP BANCORP • NASDAQ: OPBK | Third Quarter 2026 Capital Capital Return ($ in millions) 73% 75% 75% 74% 73% 27% 25% 25% 26% 27% $6.7 $7.0 $7.2 $8.0 $7.8 8.47% 8.60% 8.62% 8.70% 8.54% 3Q25 4Q25 1Q26 2Q26 3Q26 Net income retained Cash dividend payout Total equity / total assets 13.52% 11.18% 11.18% 9.09% 13.56% 12.31% 12.31% 10.01% 8.00% Total capital Tier 1 CET1 Tier 1 leverage OP Bancorp Open Bank CBLR requirement Capital Ratios as of September 30, 2026 Book Value per Share ($) $14.88 $15.31 $15.62 $15.99 $16.07 3Q25 4Q25 1Q26 2Q26 3Q26 Book value continued to grow while returning 27% of net income to shareholders through cash dividends. Capital levels remained well- capitalized. 16 YoY +8%

SUPPLEMENTAL INFORMATION Appendix
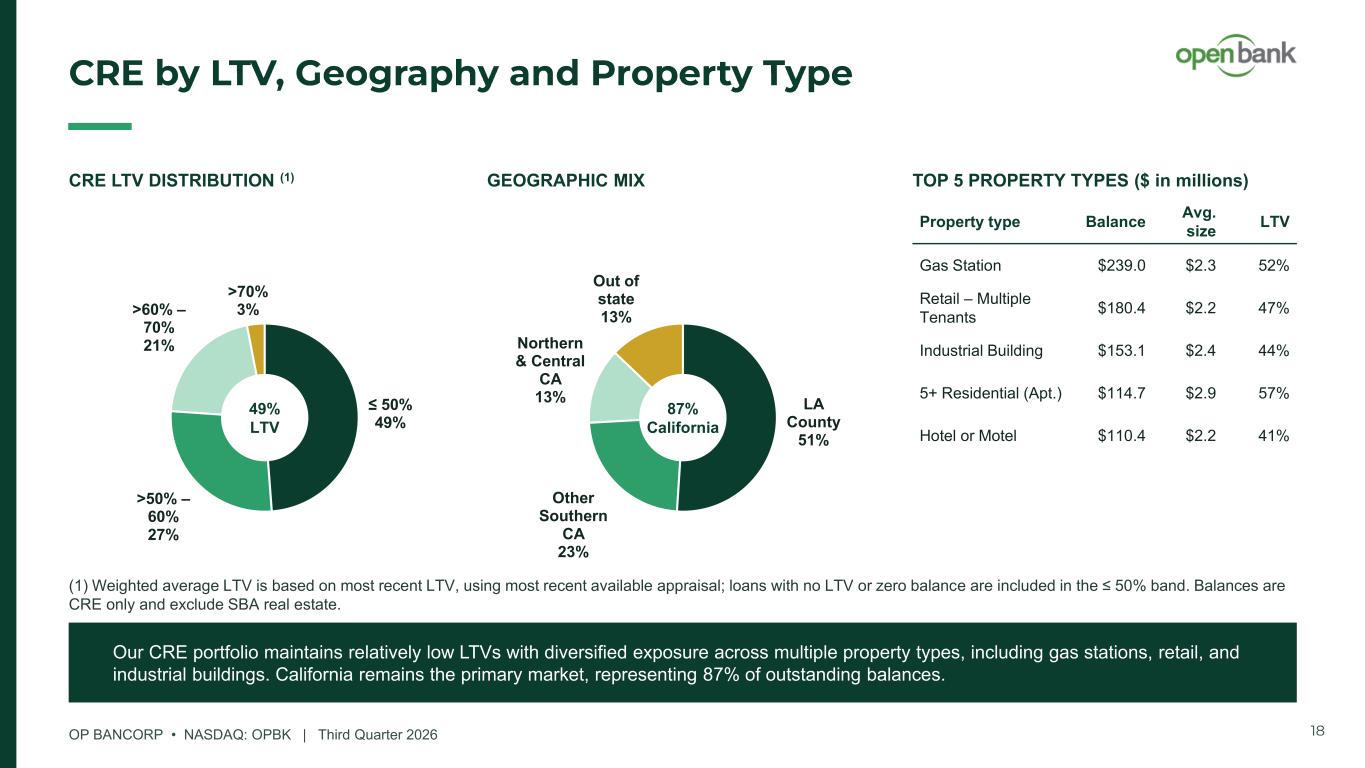
OP BANCORP • NASDAQ: OPBK | Third Quarter 2026 CRE by LTV, Geography and Property Type CRE LTV DISTRIBUTION (1) GEOGRAPHIC MIX ≤ 50% 49% >50% – 60% 27% >60% – 70% 21% >70% 3% LA County 51% Other Southern CA 23% Northern & Central CA 13% Out of state 13% Property type Balance Avg. size LTV Gas Station $239.0 $2.3 52% Retail – Multiple Tenants $180.4 $2.2 47% Industrial Building $153.1 $2.4 44% 5+ Residential (Apt.) $114.7 $2.9 57% Hotel or Motel $110.4 $2.2 41% TOP 5 PROPERTY TYPES ($ in millions) 49% LTV (1) Weighted average LTV is based on most recent LTV, using most recent available appraisal; loans with no LTV or zero balance are included in the ≤ 50% band. Balances are CRE only and exclude SBA real estate. 87% California Our CRE portfolio maintains relatively low LTVs with diversified exposure across multiple property types, including gas stations, retail, and industrial buildings. California remains the primary market, representing 87% of outstanding balances. 18
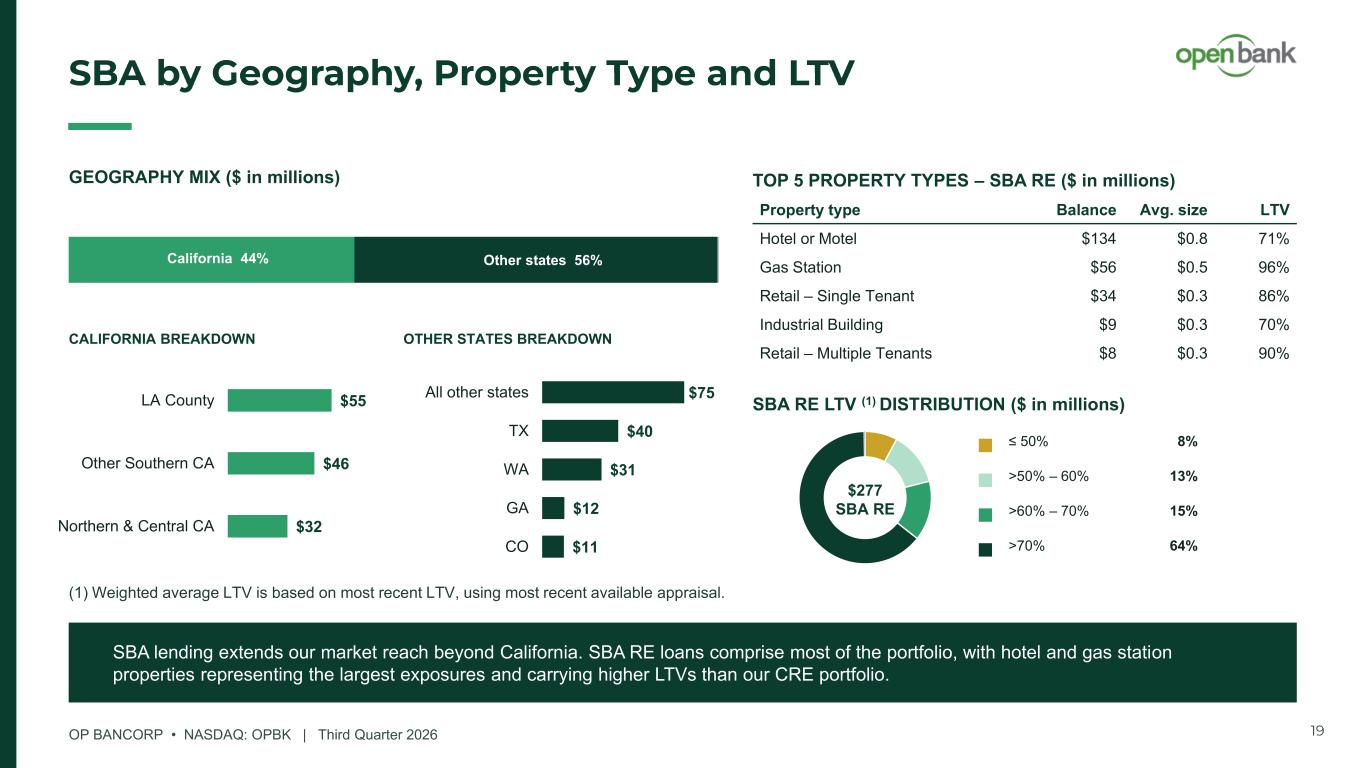
OP BANCORP • NASDAQ: OPBK | Third Quarter 2026 SBA by Geography, Property Type and LTV Property type Balance Avg. size LTV Hotel or Motel $134 $0.8 71% Gas Station $56 $0.5 96% Retail – Single Tenant $34 $0.3 86% Industrial Building $9 $0.3 70% Retail – Multiple Tenants $8 $0.3 90% TOP 5 PROPERTY TYPES – SBA RE ($ in millions) SBA RE LTV (1) DISTRIBUTION ($ in millions) SBA lending extends our market reach beyond California. SBA RE loans comprise most of the portfolio, with hotel and gas station properties representing the largest exposures and carrying higher LTVs than our CRE portfolio. $277 SBA RE ≤ 50% >50% – 60% >60% – 70% >70% GEOGRAPHY MIX ($ in millions) California 44% Other states 56% CALIFORNIA BREAKDOWN OTHER STATES BREAKDOWN $75 $40 $31 $12 $11 All other states TX WA GA CO $55 $46 $32 LA County Other Southern CA Northern & Central CA (1) Weighted average LTV is based on most recent LTV, using most recent available appraisal. 8% 13% 15% 64% 19
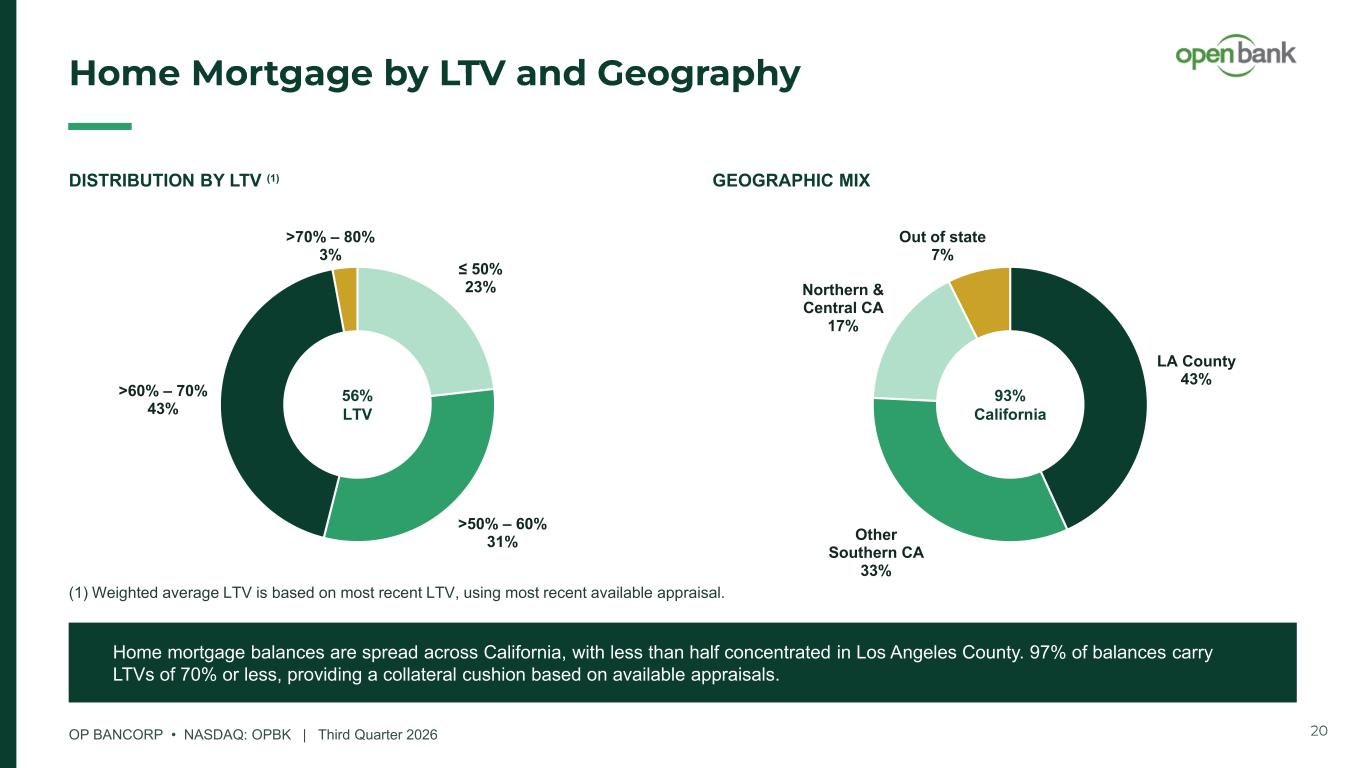
OP BANCORP • NASDAQ: OPBK | Third Quarter 2026 Home Mortgage by LTV and Geography DISTRIBUTION BY LTV (1) GEOGRAPHIC MIX ≤ 50% 23% >50% – 60% 31% >60% – 70% 43% >70% – 80% 3% LA County 43% Other Southern CA 33% Northern & Central CA 17% Out of state 7% Home mortgage balances are spread across California, with less than half concentrated in Los Angeles County. 97% of balances carry LTVs of 70% or less, providing a collateral cushion based on available appraisals. 56% LTV (1) Weighted average LTV is based on most recent LTV, using most recent available appraisal. 93% California 20
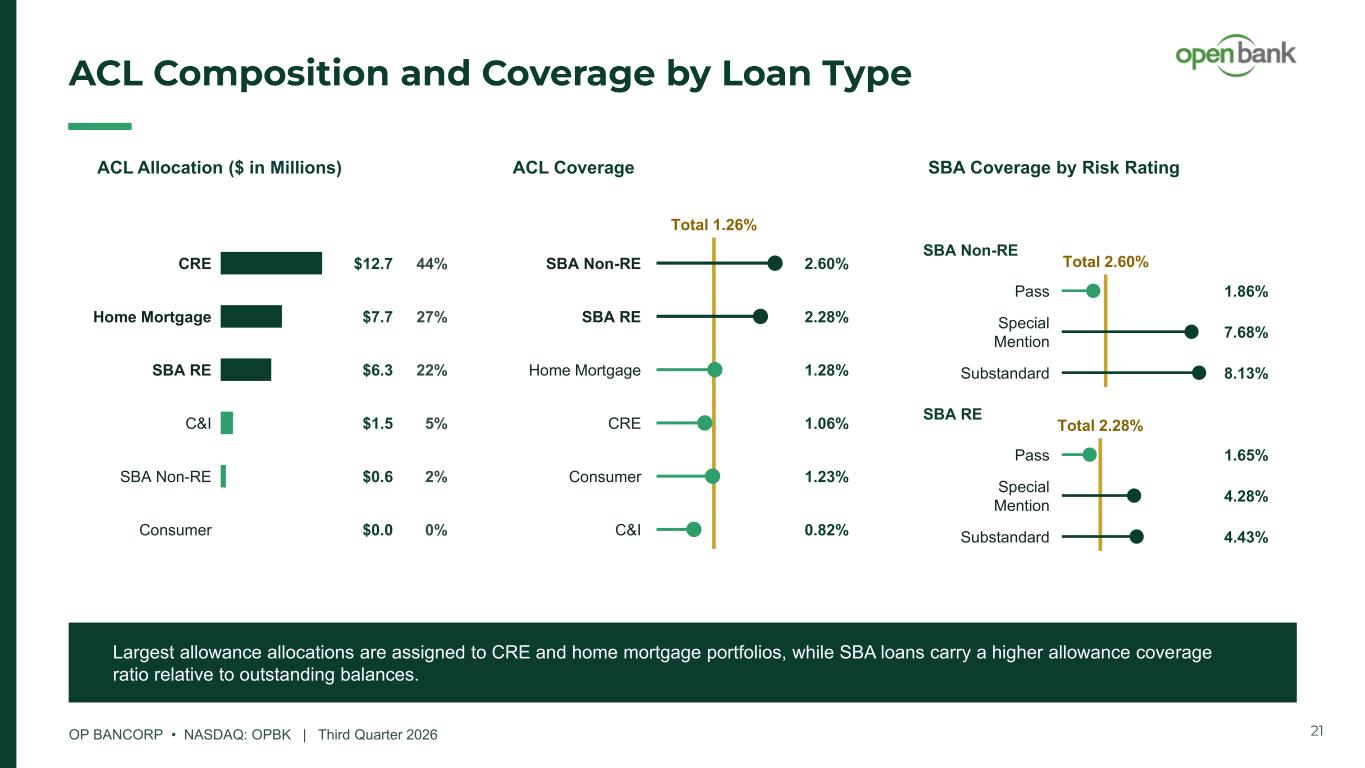
OP BANCORP • NASDAQ: OPBK | Third Quarter 2026 ACL Composition and Coverage by Loan Type ACL Allocation ($ in Millions) ACL Coverage SBA Coverage by Risk Rating CRE $12.7 44% SBA RE $6.3 22% Home Mortgage $7.7 27% C&I $1.5 5% SBA Non-RE $0.6 2% Consumer $0.0 0% Total 1.26% SBA RE 2.28% SBA Non-RE 2.60% Home Mortgage 1.28% CRE 1.06% Consumer 1.23% C&I 0.82% Total 2.28% SBA RE Total 2.60% Pass 1.65% Special Mention 4.28% Substandard 4.43% SBA Non-RE Pass 1.86% Special Mention 7.68% Substandard 8.13% Largest allowance allocations are assigned to CRE and home mortgage portfolios, while SBA loans carry a higher allowance coverage ratio relative to outstanding balances. 21
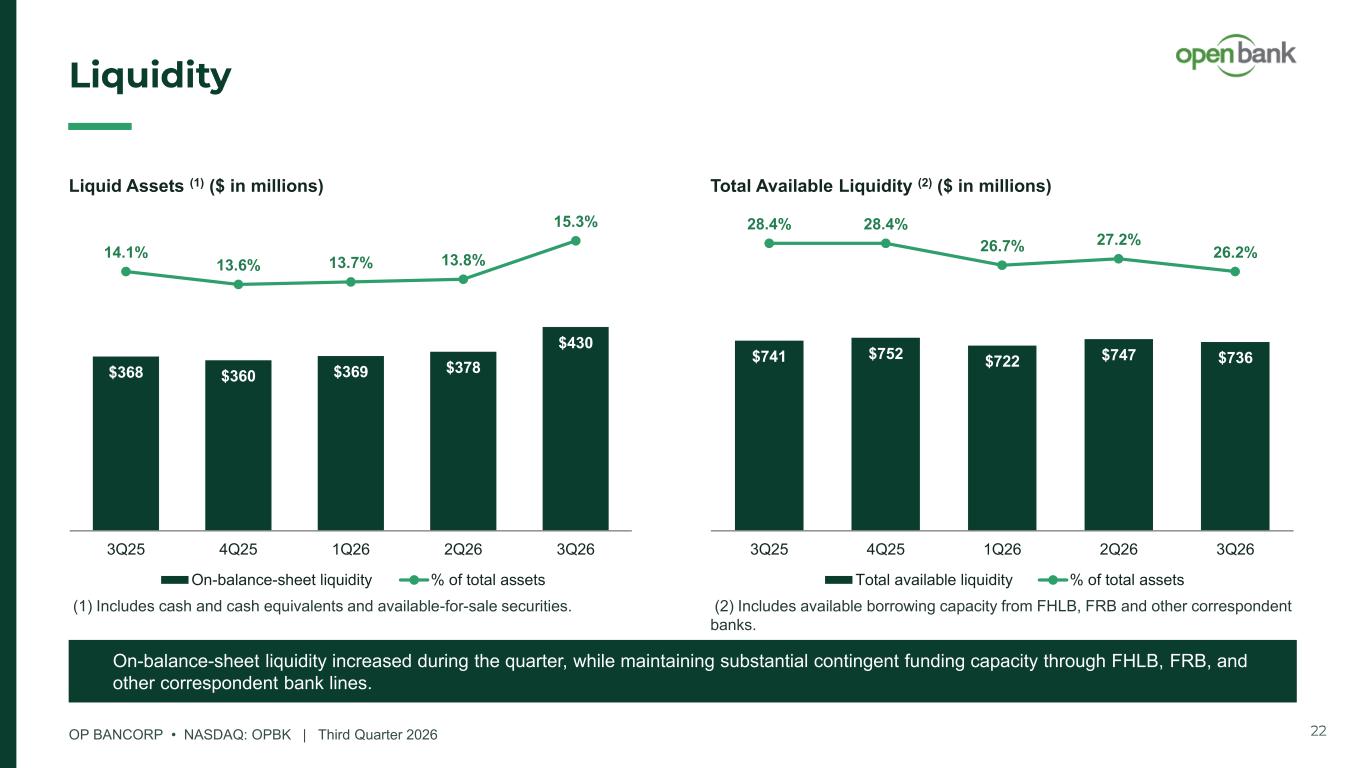
OP BANCORP • NASDAQ: OPBK | Third Quarter 2026 Liquidity Liquid Assets (1) ($ in millions) $368 $360 $369 $378 $430 14.1% 13.6% 13.7% 13.8% 15.3% 3Q25 4Q25 1Q26 2Q26 3Q26 On-balance-sheet liquidity % of total assets Total Available Liquidity (2) ($ in millions) $741 $752 $722 $747 $736 28.4% 28.4% 26.7% 27.2% 26.2% 3Q25 4Q25 1Q26 2Q26 3Q26 Total available liquidity % of total assets On-balance-sheet liquidity increased during the quarter, while maintaining substantial contingent funding capacity through FHLB, FRB, and other correspondent bank lines. 22 (1) Includes cash and cash equivalents and available-for-sale securities. (2) Includes available borrowing capacity from FHLB, FRB and other correspondent banks.

OP BANCORP • NASDAQ: OPBK Thank You Investor Relations: Jaehyun Park, EVP & CFO jaehyun.park@myopenbank.com www.myopenbank.com