
KEARNY FINANCIAL CORP. | NASDAQ: KRNY Community rooted. Commercially focused. QUARTERLY INVESTOR PRESENTATION 1ST Quarter Fiscal 2027 October 22, 2026 KEARNY FINANCIAL CORP | INVESTOR RELATIONS P E O P L E B U S I N E S S C O M M U N I T Y O P P O R T U N I T Y Exhibit 99.2
KEARNY FINANCIAL CORP. | NASDAQ: KRNY Forward Looking Statements & Non-GAAP Financial Measures This presentation includes certain “forward-looking statements,” which are made in good faith by Kearny Financial Corp. (the “Company”) pursuant to the “safe harbor” provisions of the Private Securities Litigation Reform Act of 1995. These forward-looking statements are subject to risks and uncertainties, such as statements of the Company’s plans, objectives, expectations, estimates and intentions that are subject to change based on various important factors (some of which are beyond the Company’s control). In addition to the factors described under Item 1A. Risk Factors in the Company’s Annual Report on Form 10-K, and subsequent filings with the Securities and Exchange Commission, the following factors, among others, could cause the Company’s financial performance to differ materially from the plans, objectives, expectations, estimates and intentions expressed in such forward-looking statements: • the strength of the United States economy in general and the strength of the local economy in which the Company conducts operations, • the effects of, and changes in, trade, monetary and fiscal policies and laws, including interest rate policies of the Board of Governors of the Federal Reserve System, inflation, interest rates, market and monetary fluctuations, • the impact of changes in laws, regulations and government policies affecting financial institutions (including taxation, banking, securities, insurance and tariffs), • the current or anticipated impact of military conflict, terrorism or other geopolitical events, • changes in accounting policies and practices, as may be adopted by regulatory agencies, the Financial Accounting Standards Board (“FASB”) or the Public Company Accounting Oversight Board, • technological changes, • competition among financial services providers, and • the success of the Company at managing the risks involved in the foregoing and managing its business. The Company cautions that the foregoing list of important factors is not exhaustive. Readers should not place any undue reliance on any forward- looking statements, which speak only as of the date made. The Company does not undertake any obligation to update any forward-looking statement, whether written or oral, that may be made from time to time by or on behalf of the Company. This presentation contains financial information determined by methods other than in accordance with accounting principles generally accepted in the United States of America (“GAAP”). Management uses these “non-GAAP” measures in its analysis of the Company’s performance. Management believes these non-GAAP financial measures allow for better comparability of period-to-period operating performance. Additionally, the Company believes this information is utilized by regulators and market analysts to evaluate a company’s financial condition and therefore, such information is useful to investors. These disclosures should not be viewed as a substitute for operating results determined in accordance with GAAP, nor are they necessarily comparable to non-GAAP performance measures that may be presented by other companies. A reconciliation of the non-GAAP measures used in this presentation to the most directly comparable GAAP measures is provided at the end of this presentation. 2
KEARNY FINANCIAL CORP. | NASDAQ: KRNY 3 KRNY Investment Thesis A Repositioned Franchise with a Clear Path to Higher Returns 1 Relationship Banking Commercial focus deepens primary relationships, creating deposits, treasury management and cross-sell opportunities. 2 Deposit Growth Experienced commercial and specialty bankers are expanding relationship-based deposits and strengthening the funding franchise. 3 Earnings Power Loan repricing, portfolio remix, retail realignment and efficiency initiatives are building a more scalable earnings model. 4 Capital Strength Strong capital and liquidity provide resilience and flexibility to fund disciplined growth and shareholder returns. 5 Shareholder Returns An attractive dividend provides current income as improving earnings and returns create potential valuation upside. 8.7% QoQ Deposit Growth Annualized 22 Growth in Deposit- focused Bankers over the past year $722M 2027 Maturing + Repricing Multifamily/CRE Loans 13.98% / $2.21B CET1 / Borrowing Capacity 4.80% Dividend Yield Annualized 3Financial information as of September 30, 2026.
KEARNY FINANCIAL CORP. | NASDAQ: KRNY KRNY at a Glance1 NEW JERSEY & NY METRO 4 $5.8B Deposits $7.8B Assets KRNY NASDAQ $0.8B Capital $9.88 TBV per Share $6.0B Loans $594.8M Market Cap 1884 Founded A Strong Community Banking Foundation with a Growing Commercial Focus 40 branches across 12 counties - in NJ and the NY metro area. Top 10 NJ Financial Institution - by Assets & Deposits 1 Financial information as of September 30, 2026. Source: S&P Global Market Intelligence & Company Filings 4
KEARNY FINANCIAL CORP. | NASDAQ: KRNY 5 First Quarter 2027 Performance $10.0M Net Income $0.16 Diluted EPS 2.23% Net Interest Margin Stronger Earnings, Positive Operating Leverage, and Expanding Commercial Capabilities $40.1M Net Interest Income 4.80% Dividend Yield 13.98% CET1 Ratio QUARTER HIGHLIGHTS 01 Earnings Momentum Accelerated Net income reached $10.0 million and PTPP revenue increased 14% to $13.5 million. 02 Disciplined Expense Management Non-interest expense declined 6.1%, reflecting lower costs across several operating categories. 03 Growth Coupled With Continued Loan Remix Loans grew 7.2% annualized while multifamily exposure declined. 04 Deposit Momentum Deposits grew 8.7% annualized, strengthening the funding base and supporting balance-sheet optimization. 05 Commercial Capabilities Expanded Launched a Nonprofit and Independent Education banking team to deepen relationships with mission-driven organizations. Source: Company Filings. 5
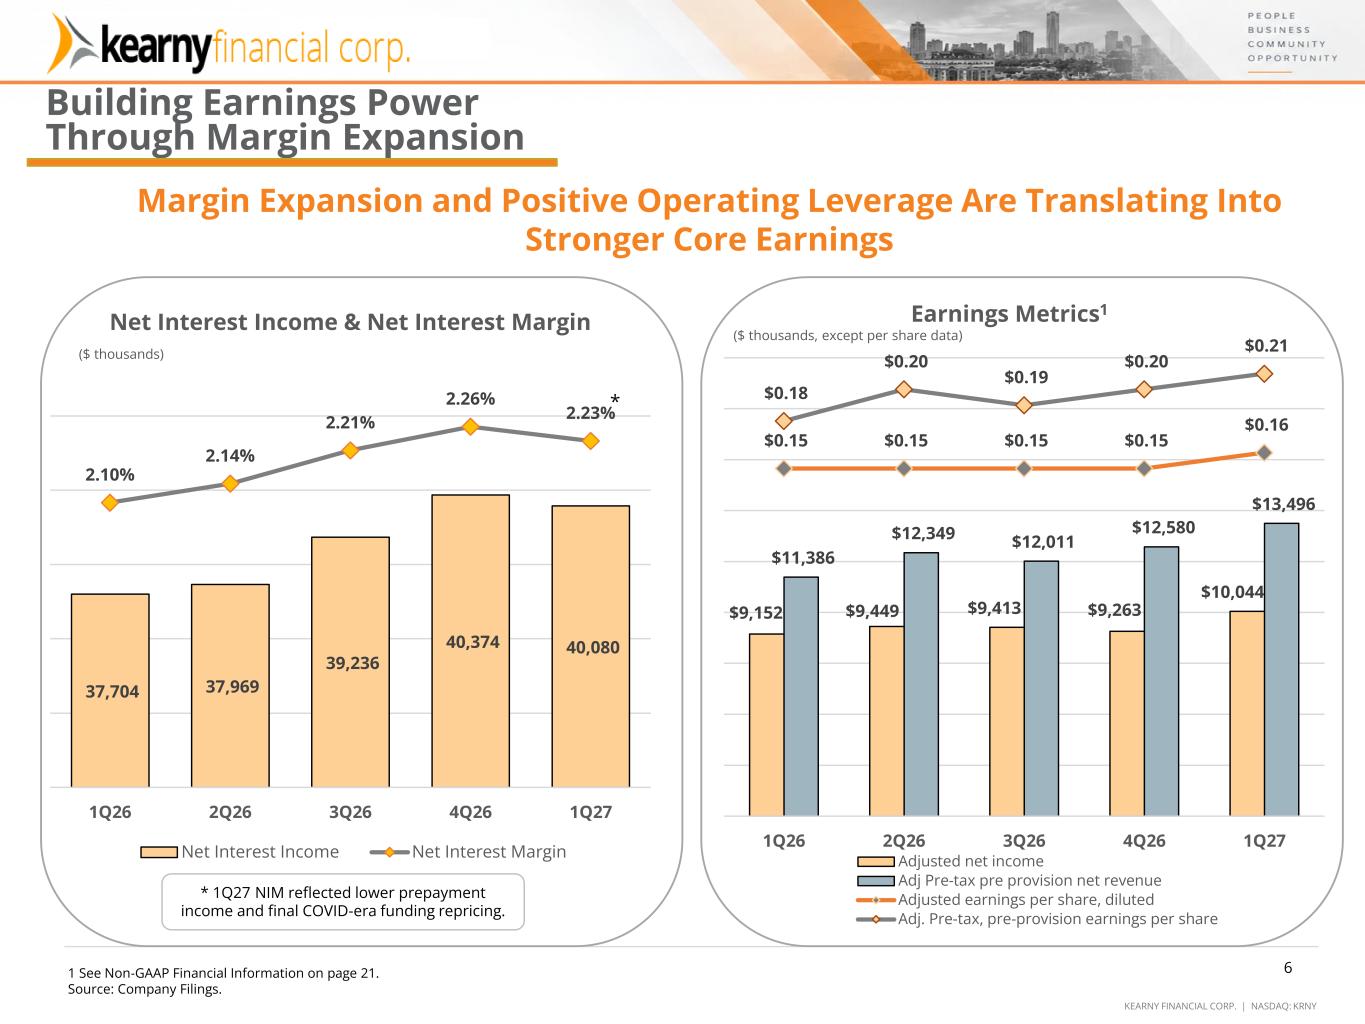
KEARNY FINANCIAL CORP. | NASDAQ: KRNY 37,704 37,969 39,236 40,374 40,080 2.10% 2.14% 2.21% 2.26% 2.23% 1Q26 2Q26 3Q26 4Q26 1Q27 Net Interest Income & Net Interest Margin Net Interest Income Net Interest Margin $9,152 $9,449 $9,413 $9,263 $10,044 $11,386 $12,349 $12,011 $12,580 $13,496 $0.15 $0.15 $0.15 $0.15 $0.16 $0.18 $0.20 $0.19 $0.20 $0.21 1Q26 2Q26 3Q26 4Q26 1Q27 Earnings Metrics1 Adjusted net income Adj Pre-tax pre provision net revenue Adjusted earnings per share, diluted Adj. Pre-tax, pre-provision earnings per share Building Earnings Power Through Margin Expansion ($ thousands, except per share data) ($ thousands) Margin Expansion and Positive Operating Leverage Are Translating Into Stronger Core Earnings * 1Q27 NIM reflected lower prepayment income and final COVID-era funding repricing. * 1 See Non-GAAP Financial Information on page 21. Source: Company Filings. 6
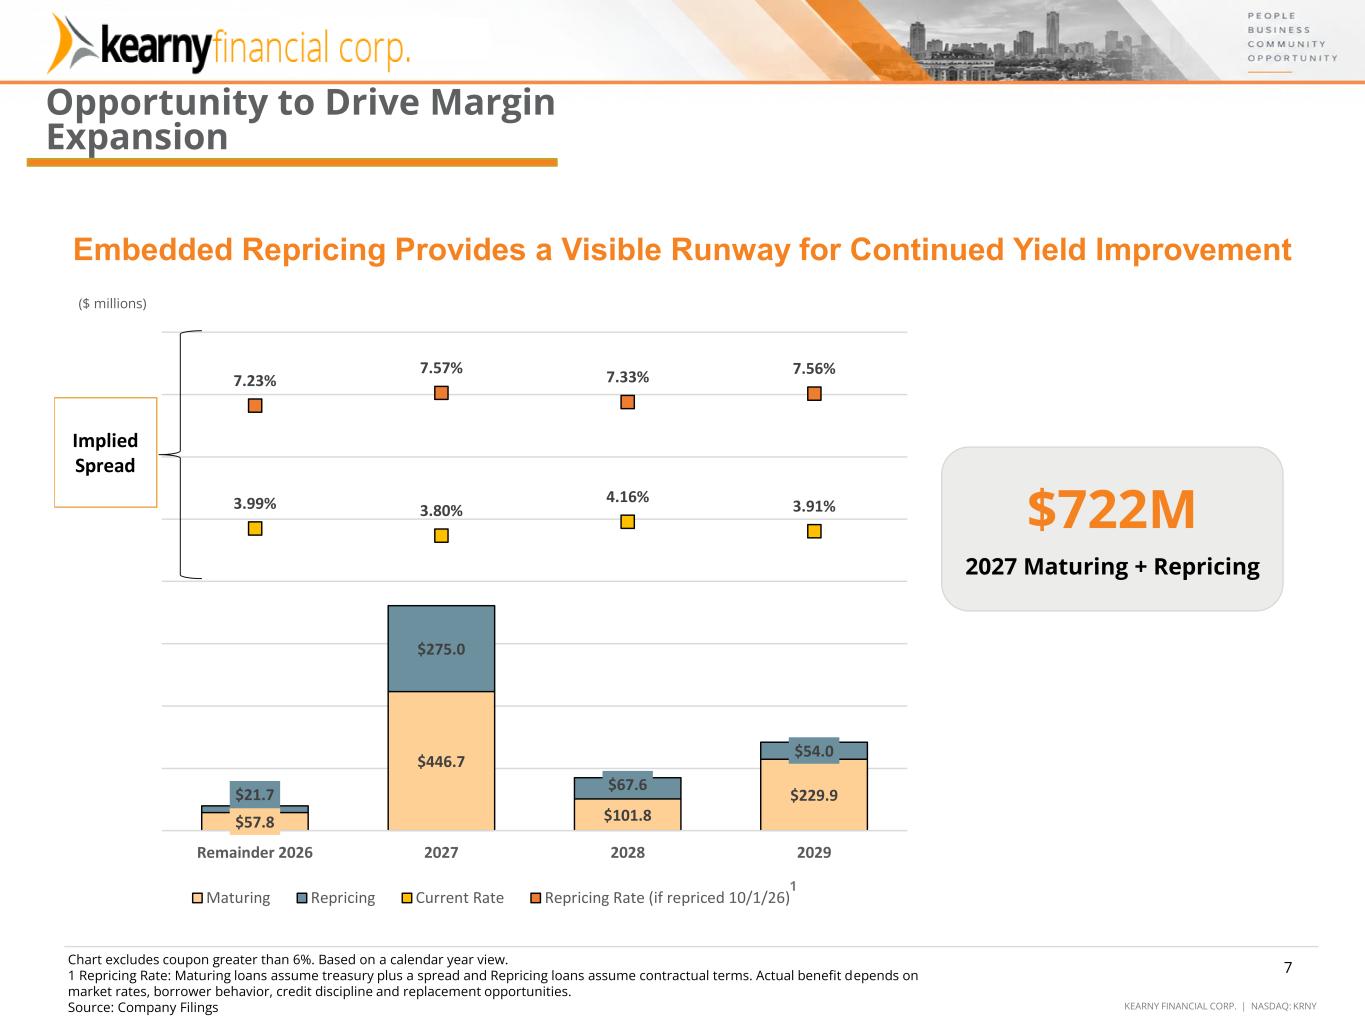
KEARNY FINANCIAL CORP. | NASDAQ: KRNY $57.8 $446.7 $101.8 $229.9 $21.7 $275.0 $67.6 $54.0 3.99% 3.80% 4.16% 3.91% 7.23% 7.57% 7.33% 7.56% Remainder 2026 2027 2028 2029 Maturing Repricing Current Rate Repricing Rate (if repriced 10/1/26) Implied Spread 7 1 Opportunity to Drive Margin Expansion ($ millions) Embedded Repricing Provides a Visible Runway for Continued Yield Improvement Chart excludes coupon greater than 6%. Based on a calendar year view. 1 Repricing Rate: Maturing loans assume treasury plus a spread and Repricing loans assume contractual terms. Actual benefit depends on market rates, borrower behavior, credit discipline and replacement opportunities. Source: Company Filings $722M 2027 Maturing + Repricing 7
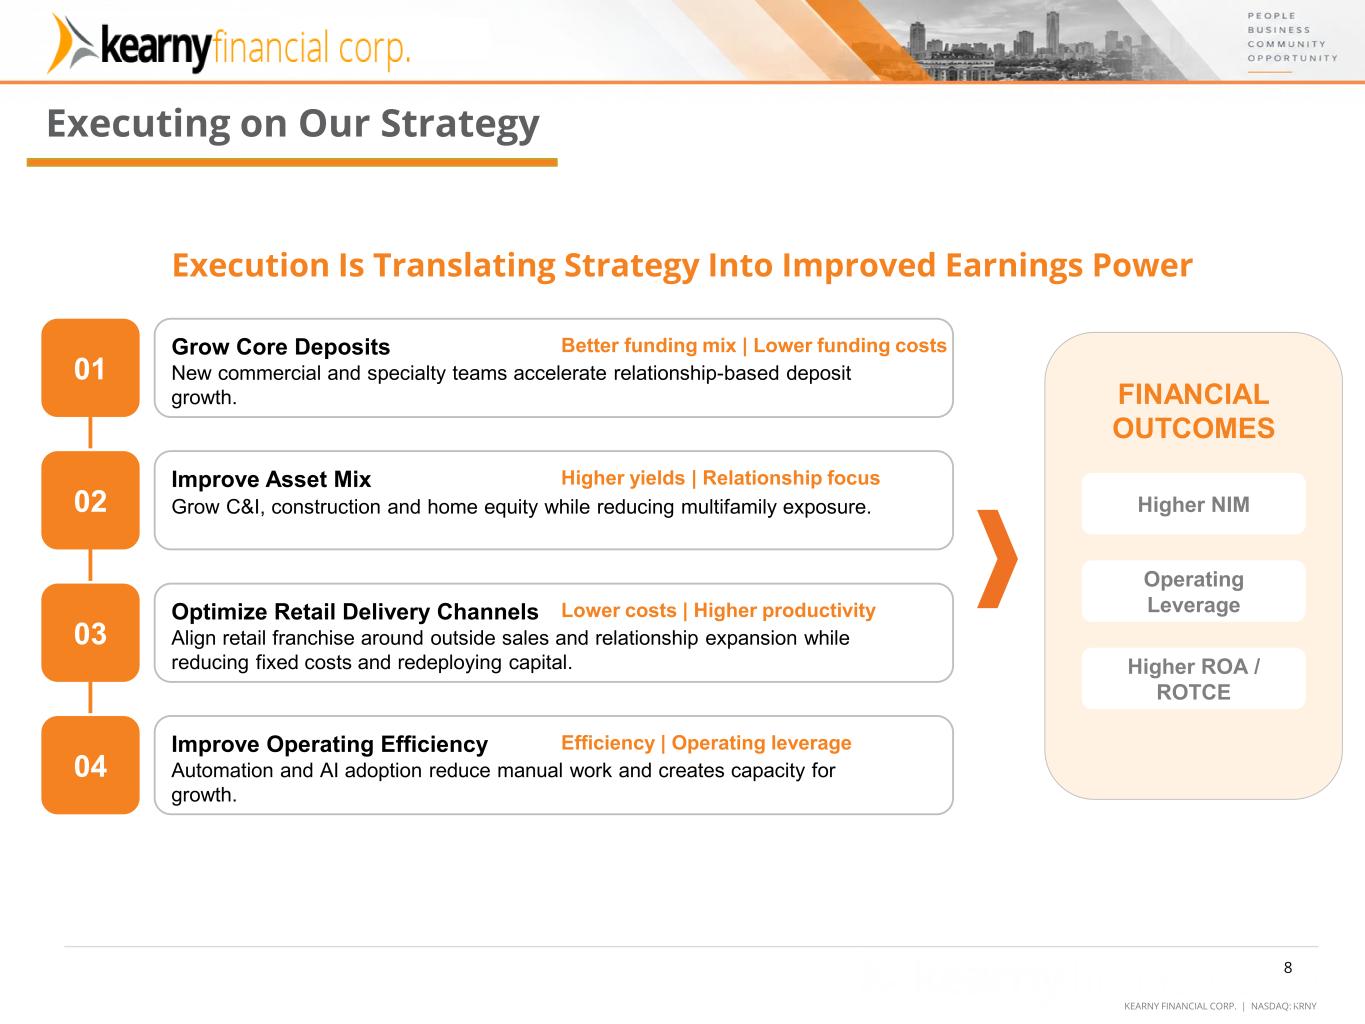
KEARNY FINANCIAL CORP. | NASDAQ: KRNY 8 Executing on Our Strategy Execution Is Translating Strategy Into Improved Earnings Power 01 Grow Core Deposits Better funding mix | Lower funding costs New commercial and specialty teams accelerate relationship-based deposit growth. 02 Improve Asset Mix Higher yields | Relationship focus Grow C&I, construction and home equity while reducing multifamily exposure. 03 Optimize Retail Delivery Channels Lower costs | Higher productivity Align retail franchise around outside sales and relationship expansion while reducing fixed costs and redeploying capital. 04 Improve Operating Efficiency Efficiency | Operating leverage Automation and AI adoption reduce manual work and creates capacity for growth. FINANCIAL OUTCOMES Higher NIM Operating Leverage Higher ROA / ROTCE 8
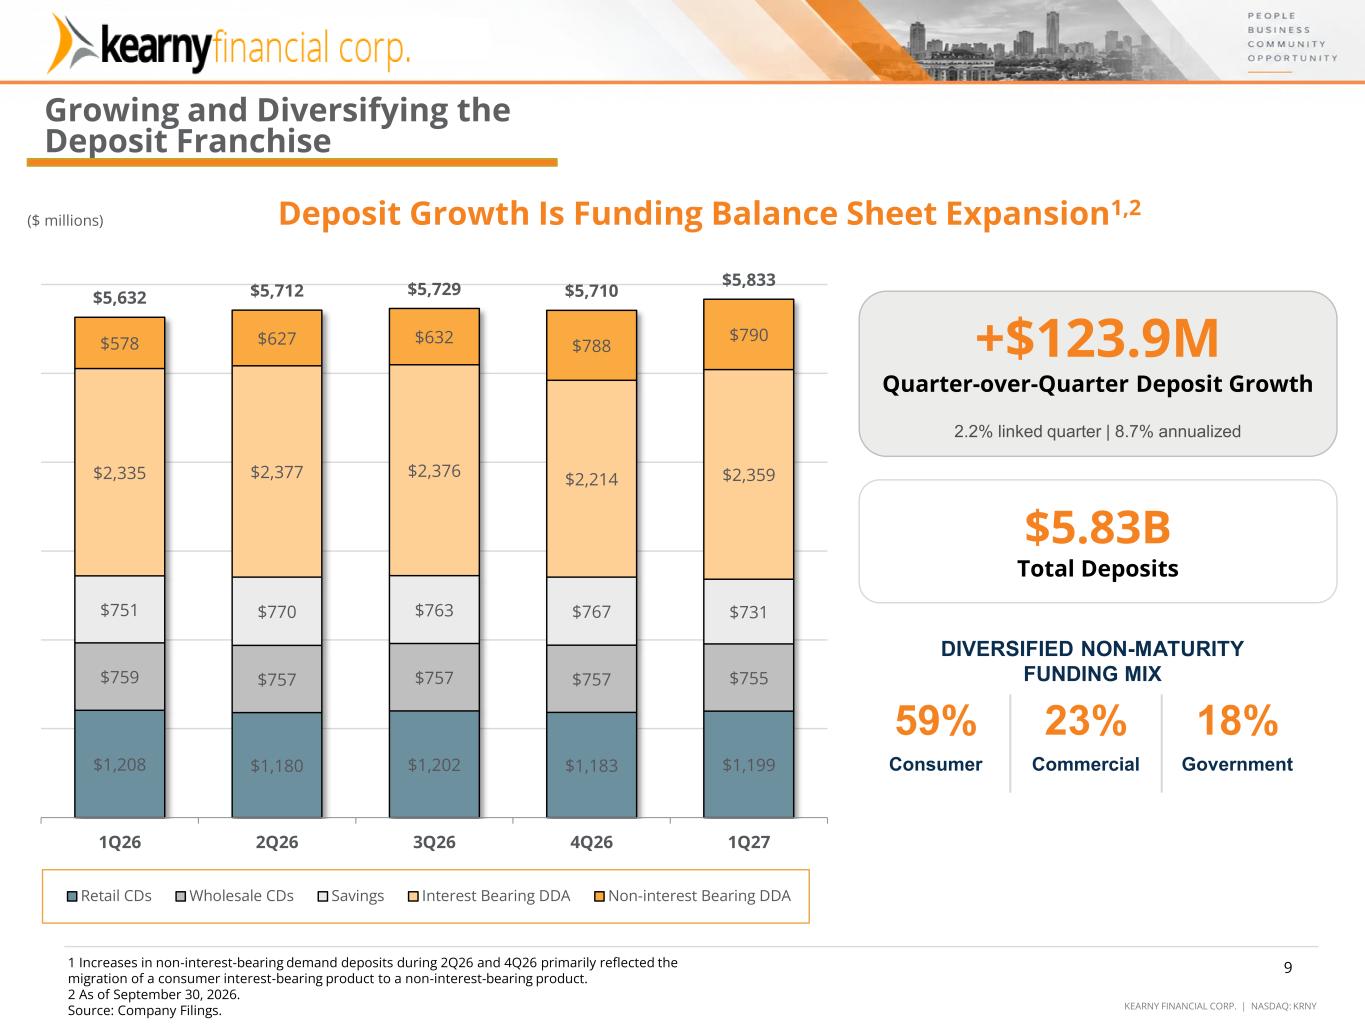
KEARNY FINANCIAL CORP. | NASDAQ: KRNY 9 ($ millions) $1,208 $1,180 $1,202 $1,183 $1,199 $759 $757 $757 $757 $755 $751 $770 $763 $767 $731 $2,335 $2,377 $2,376 $2,214 $2,359 $578 $627 $632 $788 $790 $5,632 $5,712 $5,729 $5,710 $5,833 1Q26 2Q26 3Q26 4Q26 1Q27 Retail CDs Wholesale CDs Savings Interest Bearing DDA Non-interest Bearing DDA DIVERSIFIED NON-MATURITY FUNDING MIX 59% Consumer 23% Commercial 18% Government +$123.9M Quarter-over-Quarter Deposit Growth 2.2% linked quarter | 8.7% annualized $5.83B Total Deposits Deposit Growth Is Funding Balance Sheet Expansion1,2 Growing and Diversifying the Deposit Franchise 1 Increases in non-interest-bearing demand deposits during 2Q26 and 4Q26 primarily reflected the migration of a consumer interest-bearing product to a non-interest-bearing product. 2 As of September 30, 2026. Source: Company Filings. 9
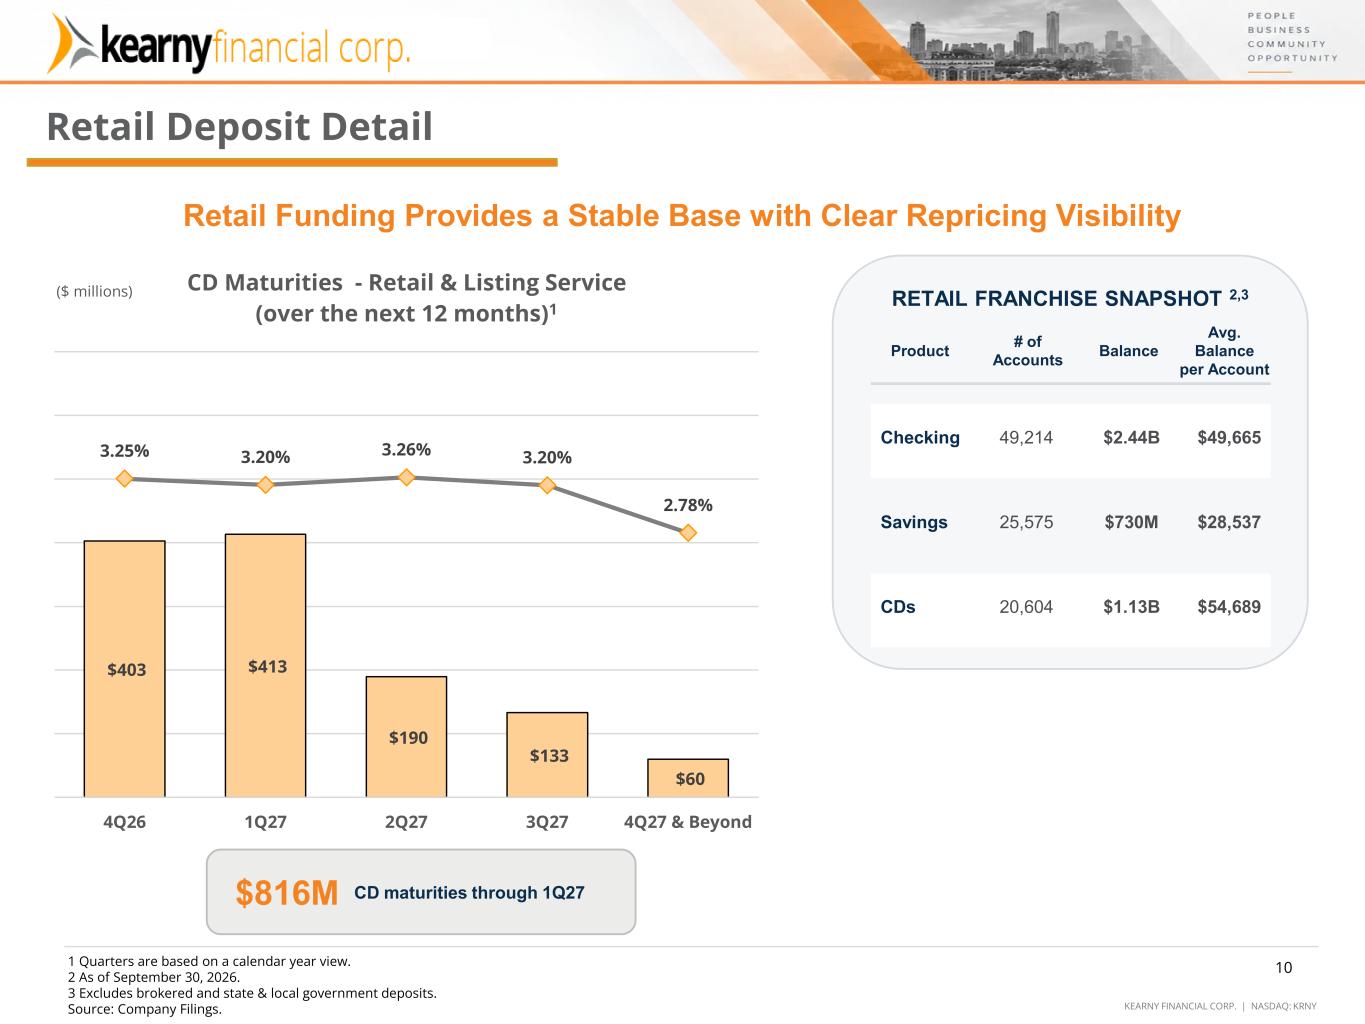
KEARNY FINANCIAL CORP. | NASDAQ: KRNY $403 $413 $190 $133 $60 3.25% 3.20% 3.26% 3.20% 2.78% 4Q26 1Q27 2Q27 3Q27 4Q27 & Beyond CD Maturities - Retail & Listing Service (over the next 12 months)1 Retail Deposit Detail RETAIL FRANCHISE SNAPSHOT 2,3 $816M CD maturities through 1Q27 Product # of Accounts Balance Avg. Balance per Account Checking 49,214 $2.44B $49,665 Savings 25,575 $730M $28,537 CDs 20,604 $1.13B $54,689 Retail Funding Provides a Stable Base with Clear Repricing Visibility ($ millions) 1 Quarters are based on a calendar year view. 2 As of September 30, 2026. 3 Excludes brokered and state & local government deposits. Source: Company Filings. 10
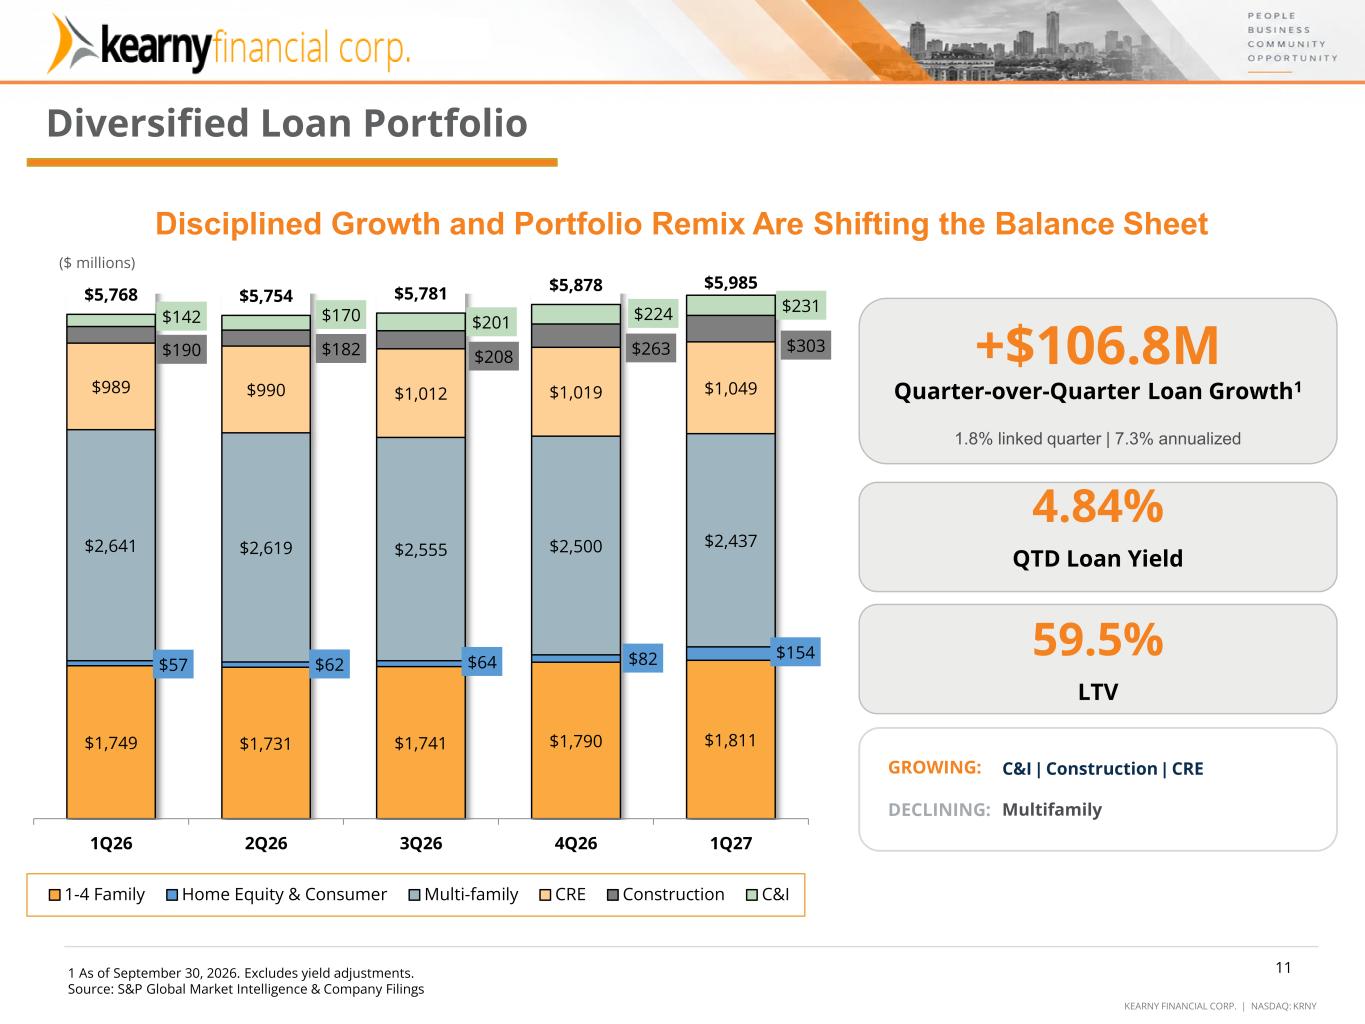
KEARNY FINANCIAL CORP. | NASDAQ: KRNY Diversified Loan Portfolio 4.84% QTD Loan Yield 59.5% LTV GROWING: C&I | Construction | CRE DECLINING: Multifamily Disciplined Growth and Portfolio Remix Are Shifting the Balance Sheet ($ millions) +$106.8M Quarter-over-Quarter Loan Growth1 1.8% linked quarter | 7.3% annualized 1 As of September 30, 2026. Excludes yield adjustments. Source: S&P Global Market Intelligence & Company Filings $1,749 $1,731 $1,741 $1,790 $1,811 $57 $62 $64 $82 $154 $2,641 $2,619 $2,555 $2,500 $2,437 $989 $990 $1,012 $1,019 $1,049 $190 $182 $208 $263 $303 $142 $170 $201 $224 $231$5,768 $5,754 $5,781 $5,878 $5,985 1Q26 2Q26 3Q26 4Q26 1Q27 1-4 Family Home Equity & Consumer Multi-family CRE Construction C&I 11
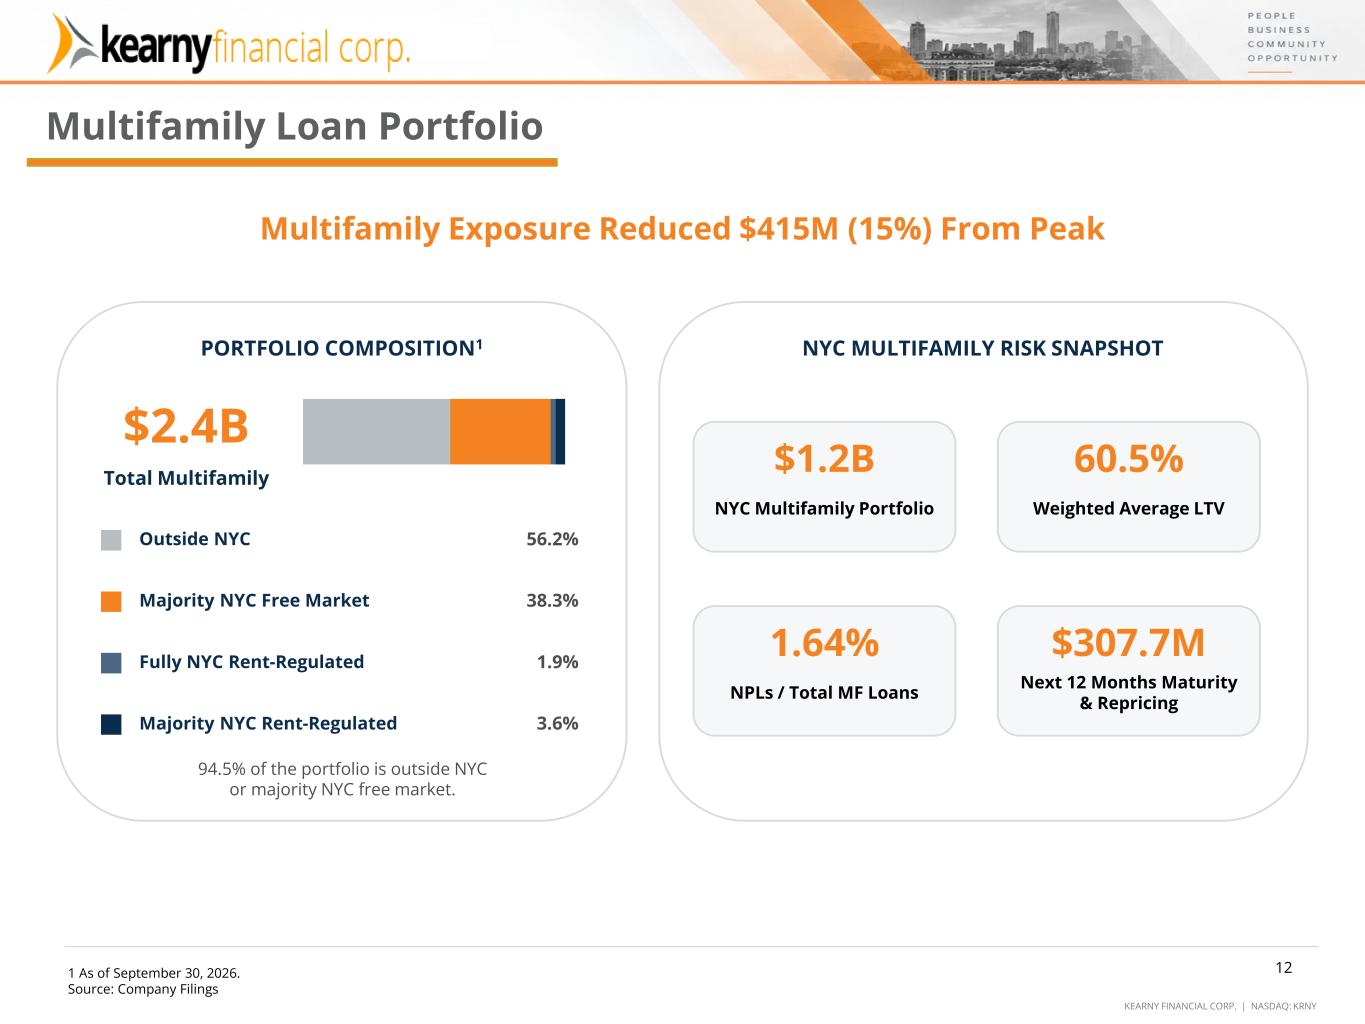
KEARNY FINANCIAL CORP. | NASDAQ: KRNY 12 Multifamily Loan Portfolio Multifamily Exposure Reduced $415M (15%) From Peak PORTFOLIO COMPOSITION1 $2.4B Total Multifamily Outside NYC 56.2% Majority NYC Free Market 38.3% Fully NYC Rent-Regulated 1.9% Majority NYC Rent-Regulated 3.6% 94.5% of the portfolio is outside NYC or majority NYC free market. NYC MULTIFAMILY RISK SNAPSHOT $1.2B NYC Multifamily Portfolio 60.5% Weighted Average LTV 1.64% NPLs / Total MF Loans $307.7M Next 12 Months Maturity & Repricing 1 As of September 30, 2026. Source: Company Filings 12
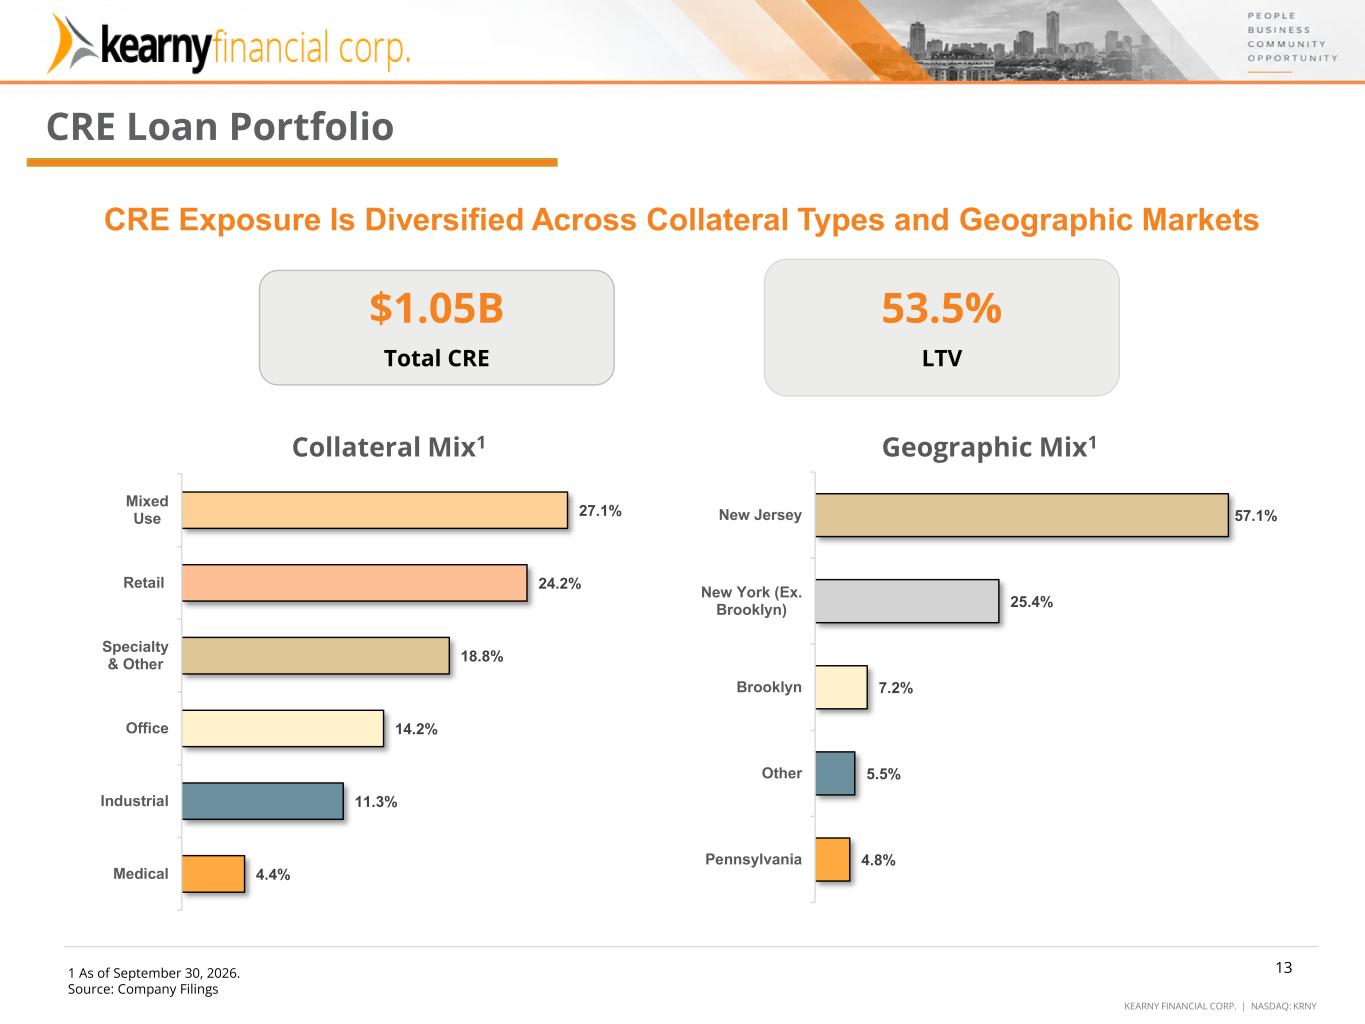
KEARNY FINANCIAL CORP. | NASDAQ: KRNY 13 CRE Loan Portfolio CRE Exposure Is Diversified Across Collateral Types and Geographic Markets $1.05B Total CRE 53.5% LTV 4.4% 11.3% 14.2% 18.8% 24.2% 27.1% Medical Industrial Office Specialty & Other Retail Mixed Use Collateral Mix1 4.8% 5.5% 7.2% 25.4% 57.1% Pennsylvania Other Brooklyn New York (Ex. Brooklyn) New Jersey Geographic Mix1 1 As of September 30, 2026. Source: Company Filings 13
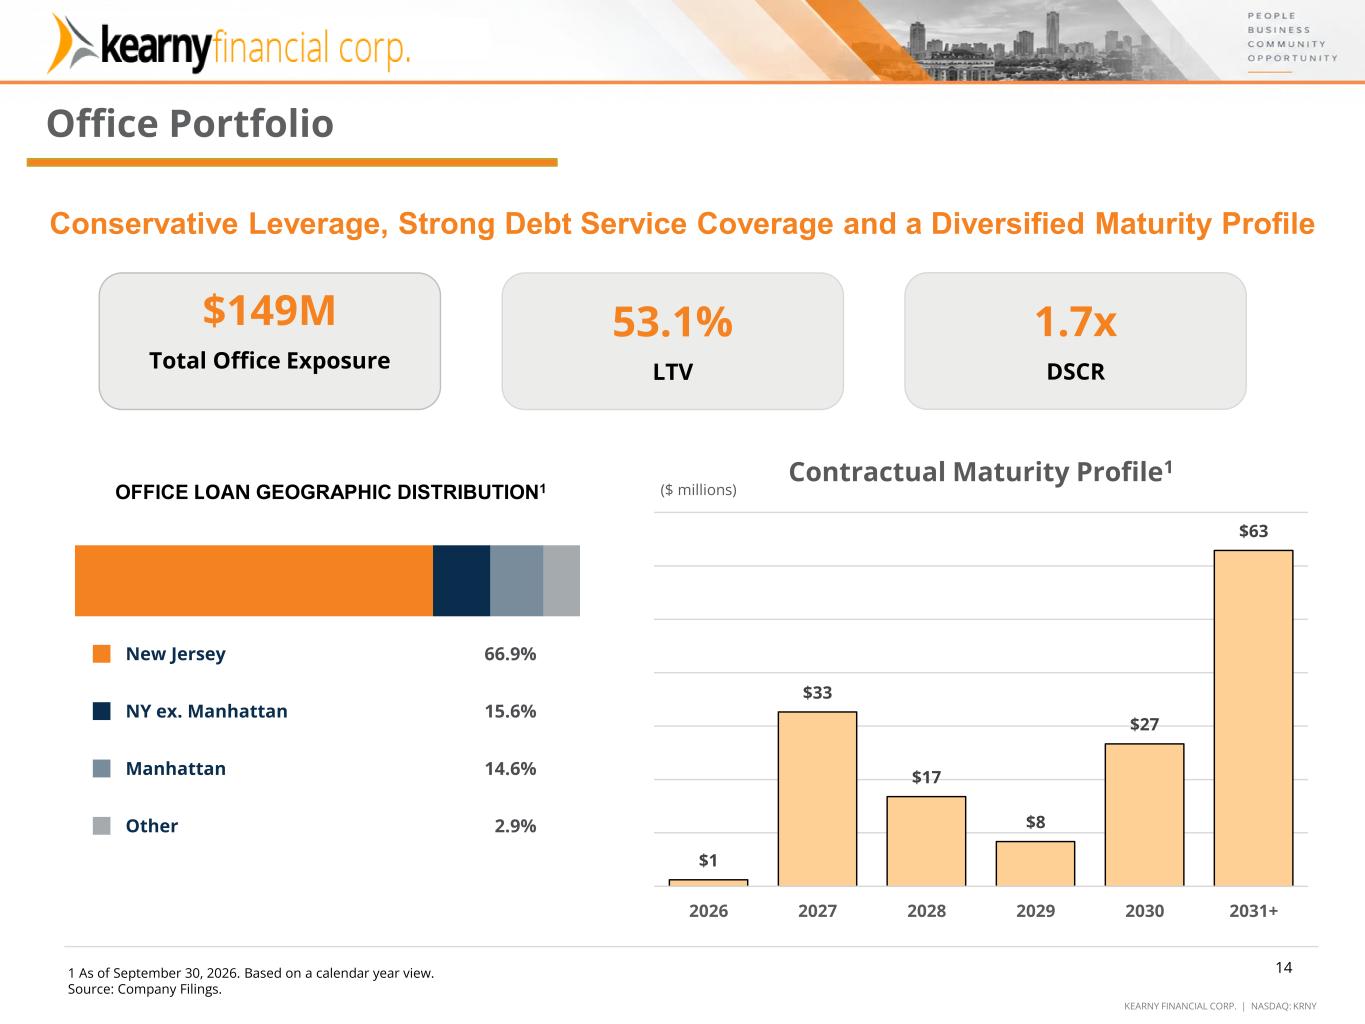
KEARNY FINANCIAL CORP. | NASDAQ: KRNY 14 $1 $33 $17 $8 $27 $63 2026 2027 2028 2029 2030 2031+ Contractual Maturity Profile1 Office Portfolio Conservative Leverage, Strong Debt Service Coverage and a Diversified Maturity Profile $149M Total Office Exposure 53.1% LTV 1.7x DSCR OFFICE LOAN GEOGRAPHIC DISTRIBUTION1 New Jersey 66.9% NY ex. Manhattan 15.6% Manhattan 14.6% Other 2.9% ($ millions) 1 As of September 30, 2026. Based on a calendar year view. Source: Company Filings. 14
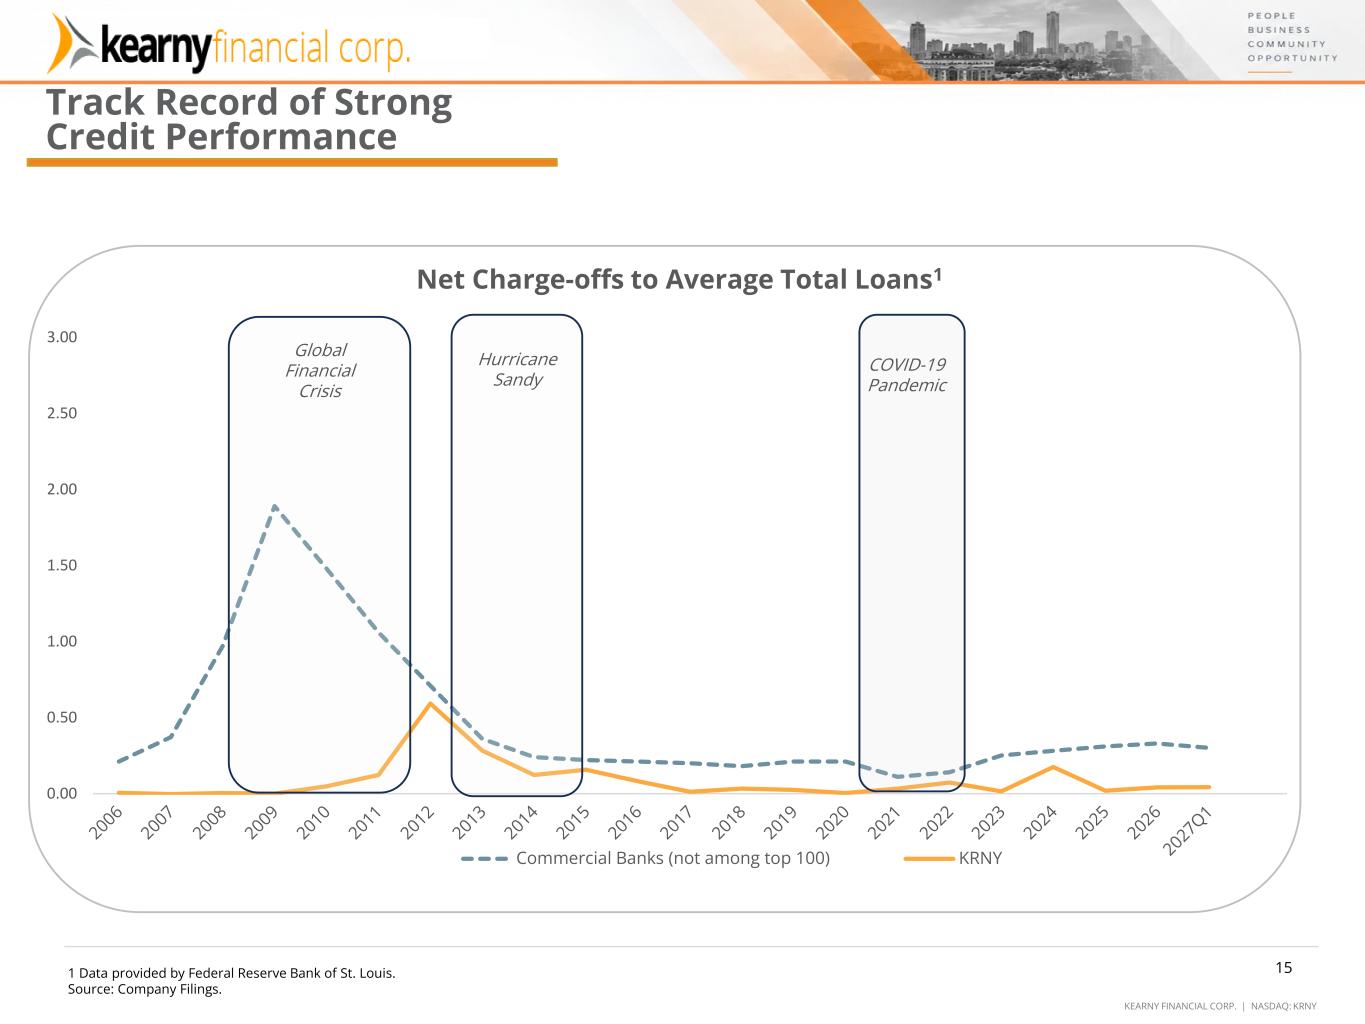
KEARNY FINANCIAL CORP. | NASDAQ: KRNY 0.00 0.50 1.00 1.50 2.00 2.50 3.00 Net Charge-offs to Average Total Loans1 Commercial Banks (not among top 100) KRNY Global Financial Crisis Hurricane Sandy COVID-19 Pandemic 1 Data provided by Federal Reserve Bank of St. Louis. Source: Company Filings. 15 Track Record of Strong Credit Performance 1 Data provided by Federal Reserve Bank of St. Louis. Source: Company Filings. 15
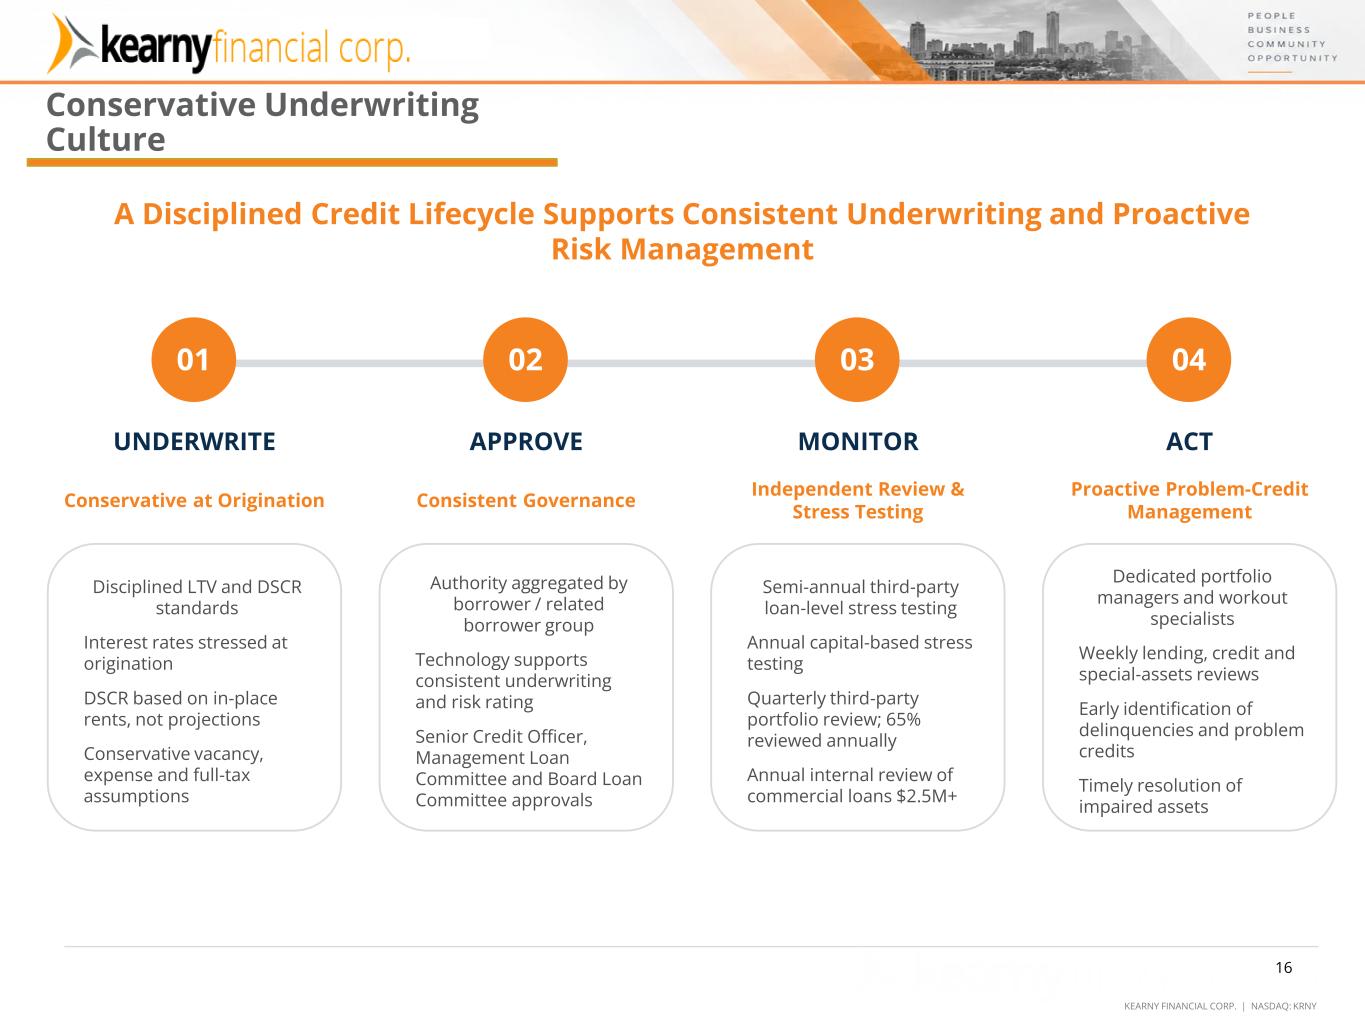
KEARNY FINANCIAL CORP. | NASDAQ: KRNY 16 Conservative Underwriting Culture A Disciplined Credit Lifecycle Supports Consistent Underwriting and Proactive Risk Management 01 UNDERWRITE Conservative at Origination Disciplined LTV and DSCR standards Interest rates stressed at origination DSCR based on in-place rents, not projections Conservative vacancy, expense and full-tax assumptions 02 APPROVE Consistent Governance Authority aggregated by borrower / related borrower group Technology supports consistent underwriting and risk rating Senior Credit Officer, Management Loan Committee and Board Loan Committee approvals 03 MONITOR Independent Review & Stress Testing Semi-annual third-party loan-level stress testing Annual capital-based stress testing Quarterly third-party portfolio review; 65% reviewed annually Annual internal review of commercial loans $2.5M+ 04 ACT Proactive Problem-Credit Management Dedicated portfolio managers and workout specialists Weekly lending, credit and special-assets reviews Early identification of delinquencies and problem credits Timely resolution of impaired assets 16
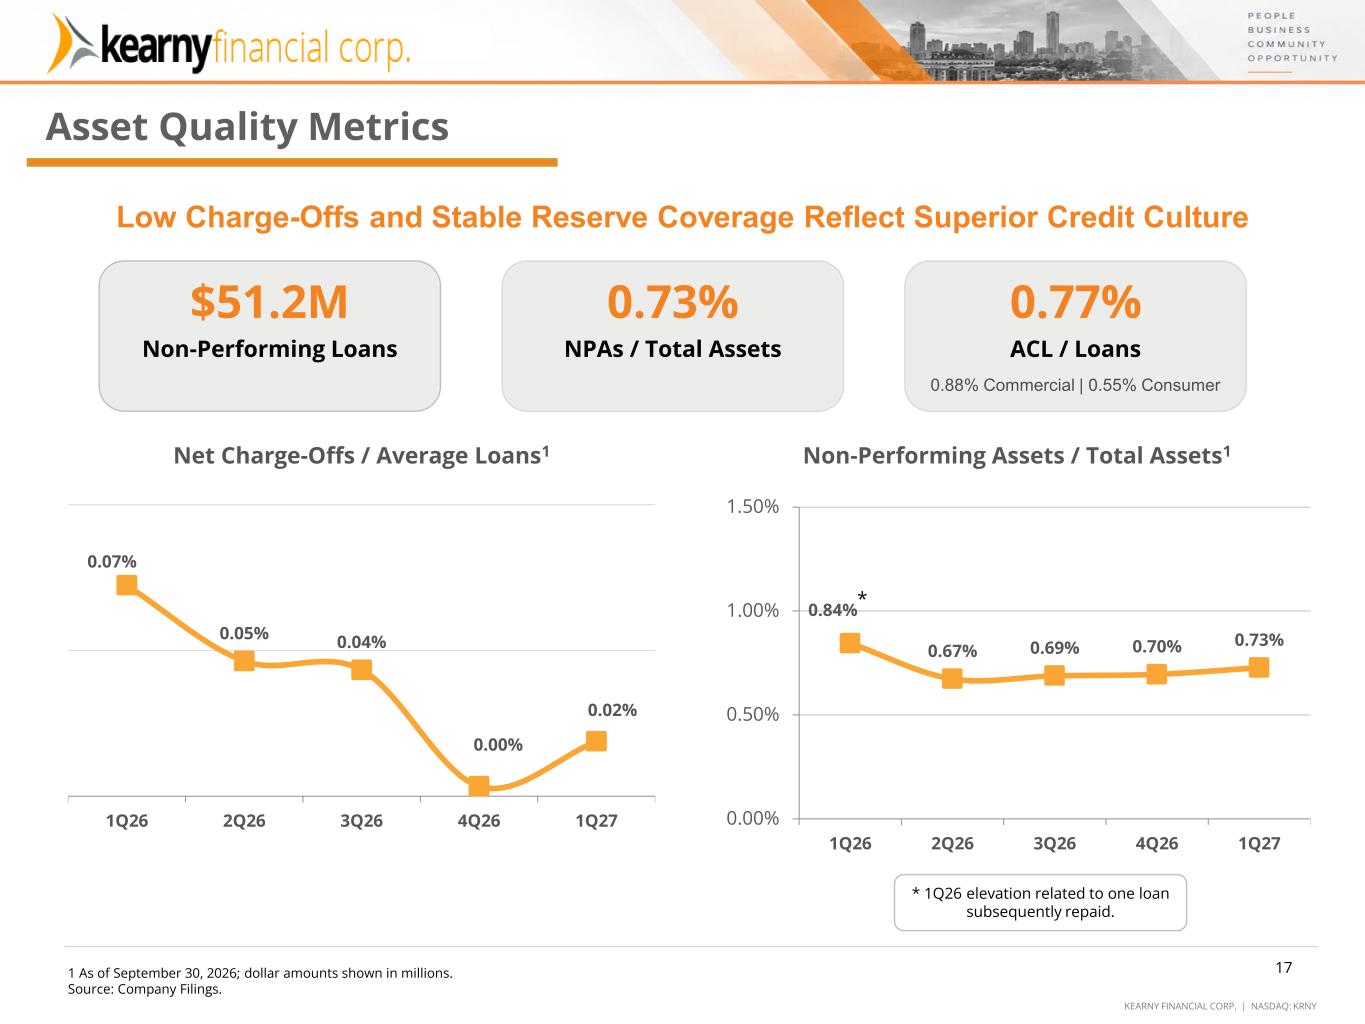
KEARNY FINANCIAL CORP. | NASDAQ: KRNY 0.84% 0.67% 0.69% 0.70% 0.73% 0.00% 0.50% 1.00% 1.50% 1Q26 2Q26 3Q26 4Q26 1Q27 Non-Performing Assets / Total Assets1 17 * 1Q26 elevation related to one loan subsequently repaid. 0.07% 0.05% 0.04% 0.00% 0.02% 1Q26 2Q26 3Q26 4Q26 1Q27 Net Charge-Offs / Average Loans1 Asset Quality Metrics Low Charge-Offs and Stable Reserve Coverage Reflect Superior Credit Culture $51.2M Non-Performing Loans 0.73% NPAs / Total Assets 0.77% ACL / Loans 0.88% Commercial | 0.55% Consumer * 1 As of September 30, 2026; dollar amounts shown in millions. Source: Company Filings. 17
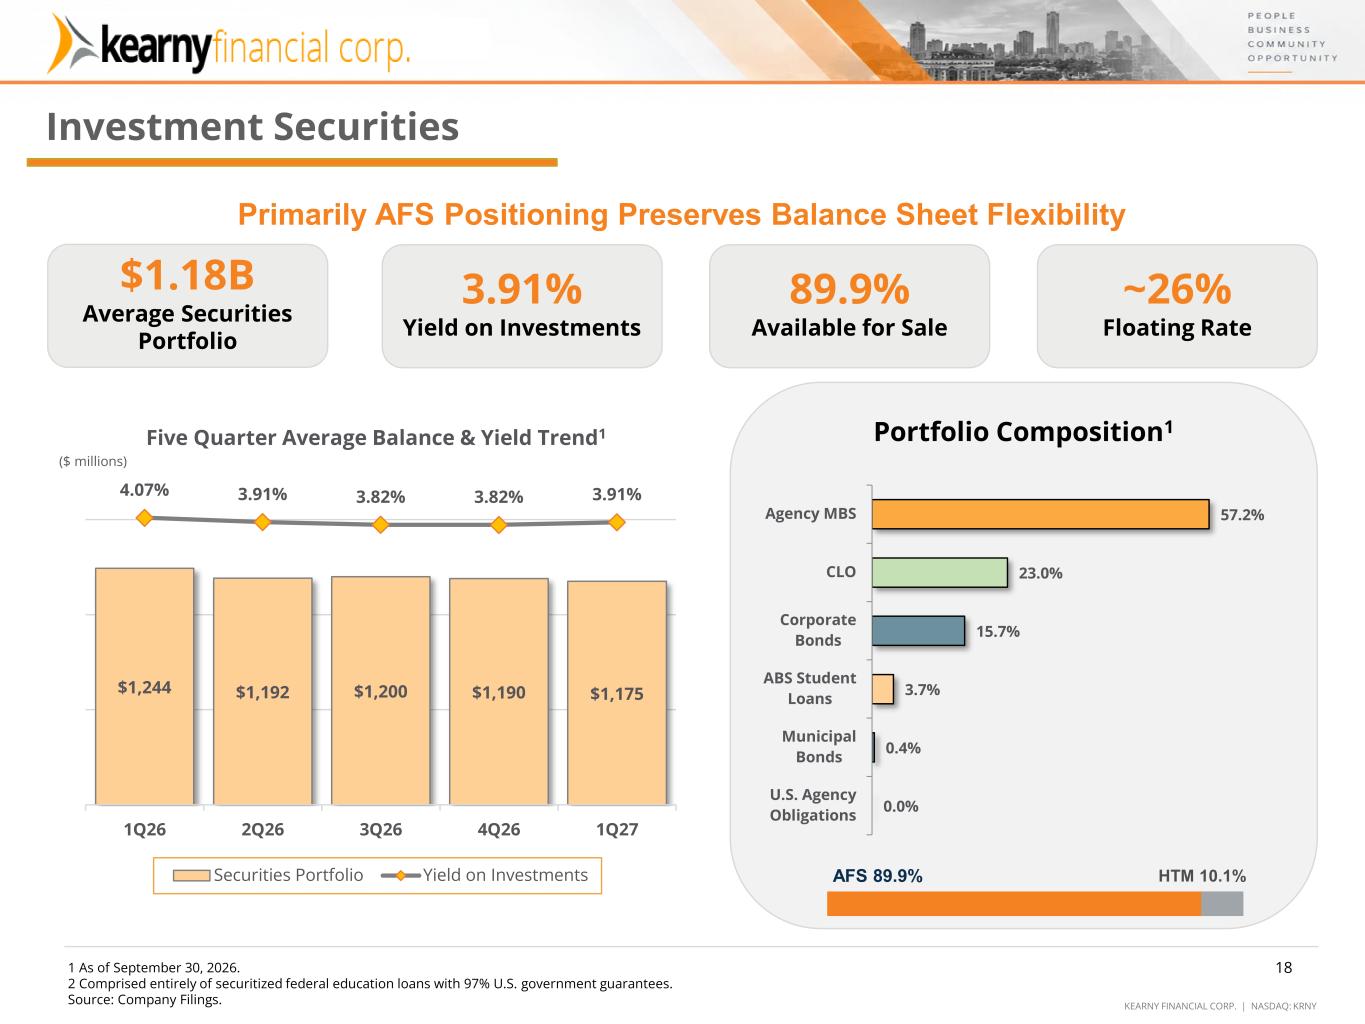
KEARNY FINANCIAL CORP. | NASDAQ: KRNY 1 As of June 30, 2026. 2 Comprised entirely of securitized federal education loans with 97% U.S. government guarantees. Source: Company Filings. 18 $1,244 $1,192 $1,200 $1,190 $1,175 4.07% 3.91% 3.82% 3.82% 3.91% 1Q26 2Q26 3Q26 4Q26 1Q27 Five Quarter Average Balance & Yield Trend1 Securities Portfolio Yield on Investments ($ millions) Investment Securities $1.18B Average Securities Portfolio 3.91% Yield on Investments 89.9% Available for Sale ~26% Floating Rate Primarily AFS Positioning Preserves Balance Sheet Flexibility Portfolio Composition1 0.0% 0.4% 3.7% 15.7% 23.0% 57.2% U.S. Agency Obligations Municipal Bonds ABS Student Loans Corporate Bonds CLO Agency MBS AFS 89.9% HTM 10.1% 1 As of September 30, 2026. 2 Comprised entirely of securitized federal education loans with 97% U.S. government guarantees. Source: Company Filings. 18
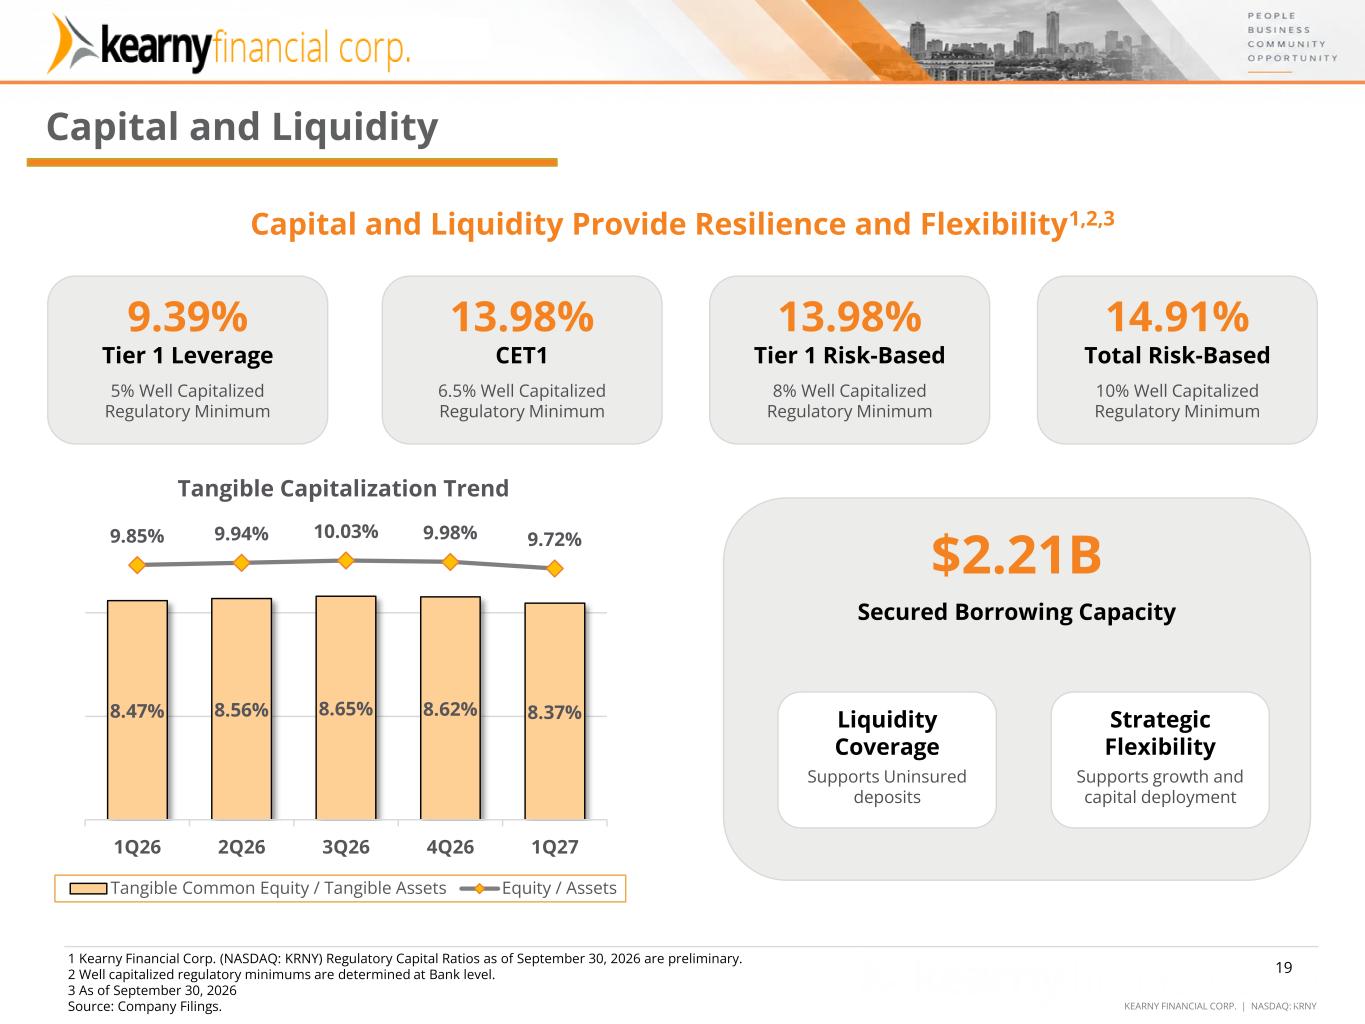
KEARNY FINANCIAL CORP. | NASDAQ: KRNY 19 8.47% 8.56% 8.65% 8.62% 8.37% 9.85% 9.94% 10.03% 9.98% 9.72% 1Q26 2Q26 3Q26 4Q26 1Q27 Tangible Capitalization Trend Tangible Common Equity / Tangible Assets Equity / Assets Capital and Liquidity Capital and Liquidity Provide Resilience and Flexibility1,2,3 9.39% Tier 1 Leverage 5% Well Capitalized Regulatory Minimum 13.98% CET1 6.5% Well Capitalized Regulatory Minimum 13.98% Tier 1 Risk-Based 8% Well Capitalized Regulatory Minimum 14.91% Total Risk-Based 10% Well Capitalized Regulatory Minimum $2.21B Secured Borrowing Capacity Liquidity Coverage Supports Uninsured deposits Strategic Flexibility Supports growth and capital deployment 1 Kearny Financial Corp. (NASDAQ: KRNY) Regulatory Capital Ratios as of September 30, 2026 are preliminary. 2 Well capitalized regulatory minimums are determined at Bank level. 3 As of September 30, 2026 Source: Company Filings. 19
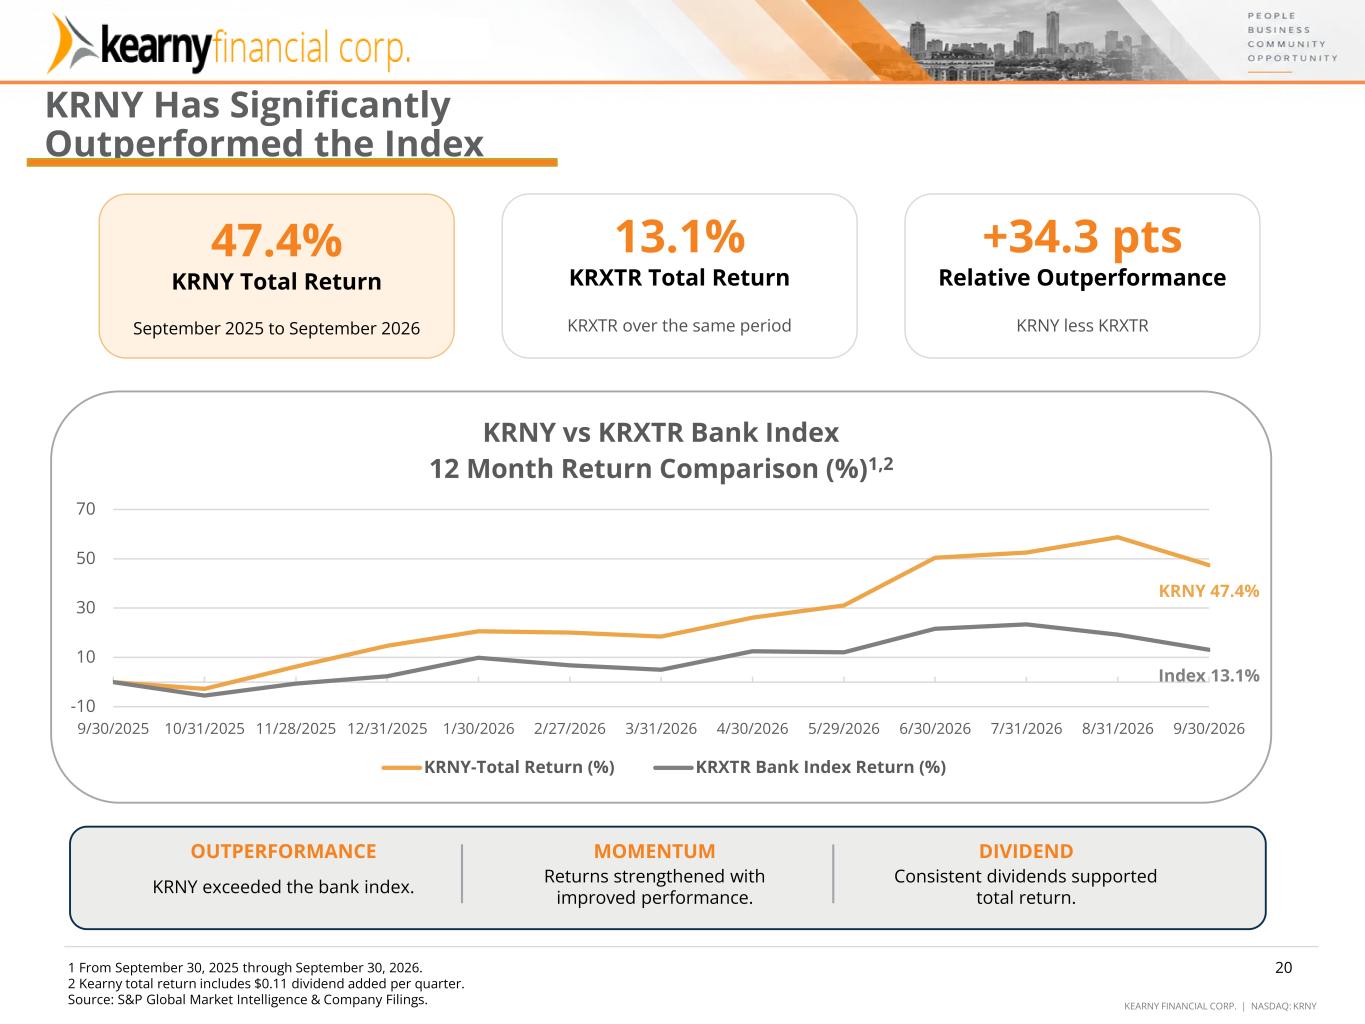
KEARNY FINANCIAL CORP. | NASDAQ: KRNY 20 KRNY 47.4% Index 13.1% -10 10 30 50 70 9/30/2025 10/31/2025 11/28/2025 12/31/2025 1/30/2026 2/27/2026 3/31/2026 4/30/2026 5/29/2026 6/30/2026 7/31/2026 8/31/2026 9/30/2026 KRNY vs KRXTR Bank Index 12 Month Return Comparison (%)1,2 KRNY-Total Return (%) KRXTR Bank Index Return (%) 47.4% KRNY Total Return September 2025 to September 2026 13.1% KRXTR Total Return KRXTR over the same period +34.3 pts Relative Outperformance KRNY less KRXTR OUTPERFORMANCE KRNY exceeded the bank index. MOMENTUM Returns strengthened with improved performance. DIVIDEND Consistent dividends supported total return. KRNY Has Significantly Outperformed the Index 1 From September 30, 2025 through September 30, 2026. 2 Kearny total return includes $0.11 dividend added per quarter. Source: S&P Global Market Intelligence & Company Filings. 20
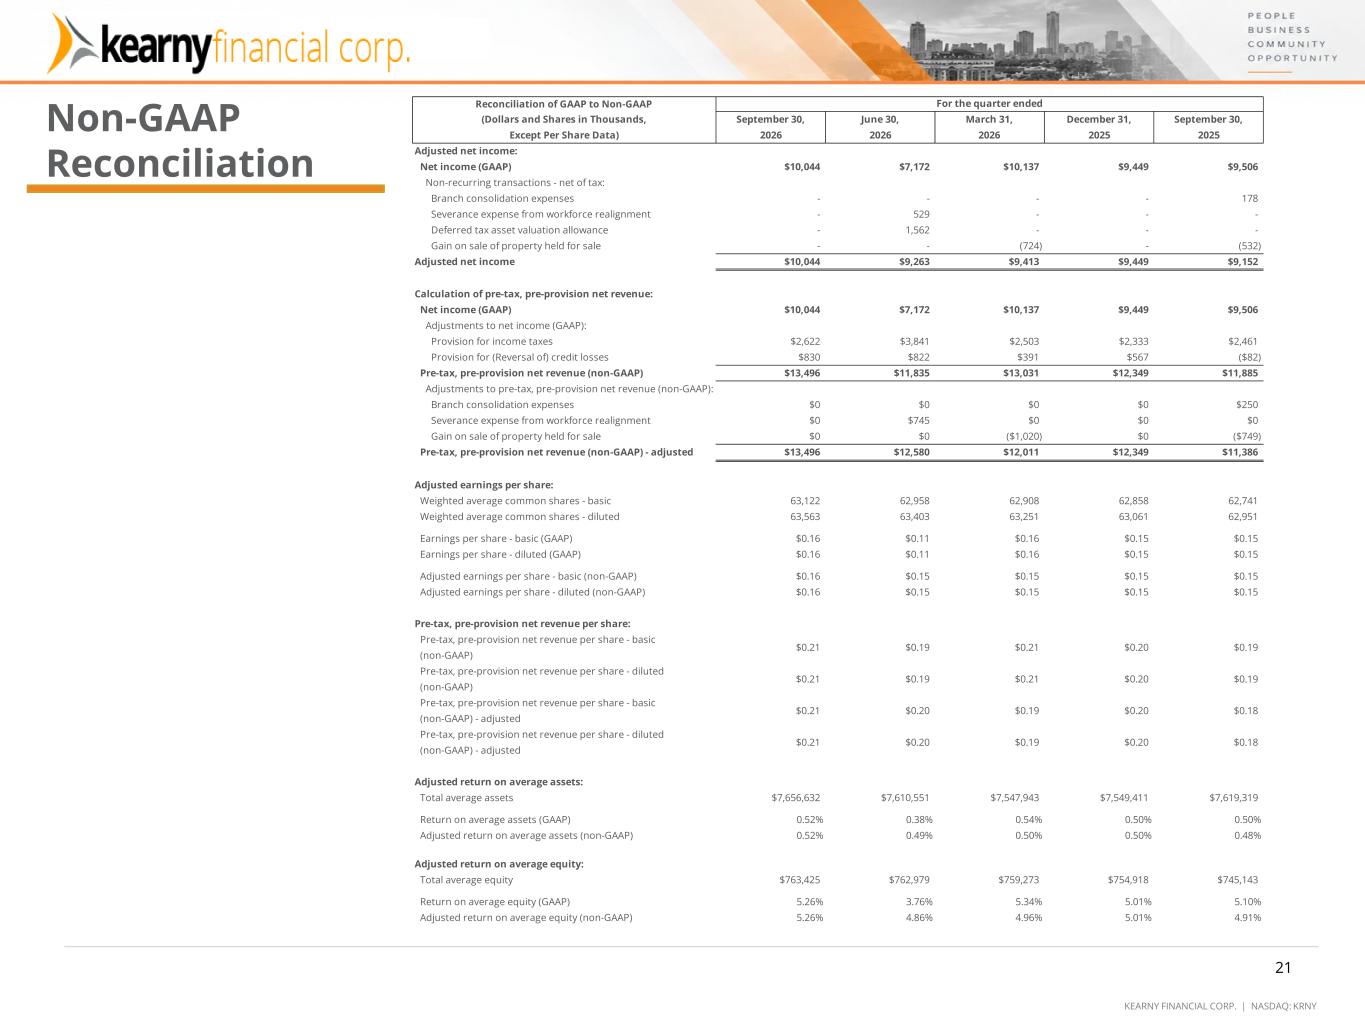
KEARNY FINANCIAL CORP. | NASDAQ: KRNY 21 Non-GAAP Reconciliation Reconciliation of GAAP to Non-GAAP (Dollars and Shares in Thousands, Except Per Share Data) September 30, 2026 June 30, 2026 March 31, 2026 December 31, 2025 September 30, 2025 Adjusted net income: Net income (GAAP) $10,044 $7,172 $10,137 $9,449 $9,506 Non-recurring transactions - net of tax: Branch consolidation expenses - - - - 178 Severance expense from workforce realignment - 529 - - - Deferred tax asset valuation allowance - 1,562 - - - Gain on sale of property held for sale - - (724) - (532) Adjusted net income $10,044 $9,263 $9,413 $9,449 $9,152 Calculation of pre-tax, pre-provision net revenue: Net income (GAAP) $10,044 $7,172 $10,137 $9,449 $9,506 Adjustments to net income (GAAP): Provision for income taxes $2,622 $3,841 $2,503 $2,333 $2,461 Provision for (Reversal of) credit losses $830 $822 $391 $567 ($82) Pre-tax, pre-provision net revenue (non-GAAP) $13,496 $11,835 $13,031 $12,349 $11,885 Adjustments to pre-tax, pre-provision net revenue (non-GAAP): Branch consolidation expenses $0 $0 $0 $0 $250 Severance expense from workforce realignment $0 $745 $0 $0 $0 Gain on sale of property held for sale $0 $0 ($1,020) $0 ($749) Pre-tax, pre-provision net revenue (non-GAAP) - adjusted $13,496 $12,580 $12,011 $12,349 $11,386 Adjusted earnings per share: Weighted average common shares - basic 63,122 62,958 62,908 62,858 62,741 Weighted average common shares - diluted 63,563 63,403 63,251 63,061 62,951 Earnings per share - basic (GAAP) $0.16 $0.11 $0.16 $0.15 $0.15 Earnings per share - diluted (GAAP) $0.16 $0.11 $0.16 $0.15 $0.15 Adjusted earnings per share - basic (non-GAAP) $0.16 $0.15 $0.15 $0.15 $0.15 Adjusted earnings per share - diluted (non-GAAP) $0.16 $0.15 $0.15 $0.15 $0.15 Pre-tax, pre-provision net revenue per share: Pre-tax, pre-provision net revenue per share - basic (non-GAAP) $0.21 $0.19 $0.21 $0.20 $0.19 Pre-tax, pre-provision net revenue per share - diluted (non-GAAP) $0.21 $0.19 $0.21 $0.20 $0.19 Pre-tax, pre-provision net revenue per share - basic (non-GAAP) - adjusted $0.21 $0.20 $0.19 $0.20 $0.18 Pre-tax, pre-provision net revenue per share - diluted (non-GAAP) - adjusted $0.21 $0.20 $0.19 $0.20 $0.18 Adjusted return on average assets: Total average assets $7,656,632 $7,610,551 $7,547,943 $7,549,411 $7,619,319 Return on average assets (GAAP) 0.52% 0.38% 0.54% 0.50% 0.50% Adjusted return on average assets (non-GAAP) 0.52% 0.49% 0.50% 0.50% 0.48% Adjusted return on average equity: Total average equity $763,425 $762,979 $759,273 $754,918 $745,143 Return on average equity (GAAP) 5.26% 3.76% 5.34% 5.01% 5.10% Adjusted return on average equity (non-GAAP) 5.26% 4.86% 4.96% 5.01% 4.91% For the quarter ended 21