Pay Versus Performance
As required by Section 953(a) of the Dodd-Frank Act and Item 402(v) of Regulation S-K, we are providing the following information about the relationship between executive compensation actually paid (“CAP”) and certain financial performance of the Company. As this is the initial year in which this information is required, we have shown the information for our last three fiscal years.
Year |
|
Summary Compensation Table Total for CEO ($ thousands)(1) |
|
Compensation Actually Paid to CEO ($ thousands)(2) |
|
Average Summary Compensation Table Total for Non-CEO Named Executive Officers (“NEOs”) ($ thousands)(3) |
|
Average Compensation Actually Paid to Non-CEO NEOs ($ thousands)(2)(3) |
|
Value of Initial Fixed $100 Investment Based on: |
|
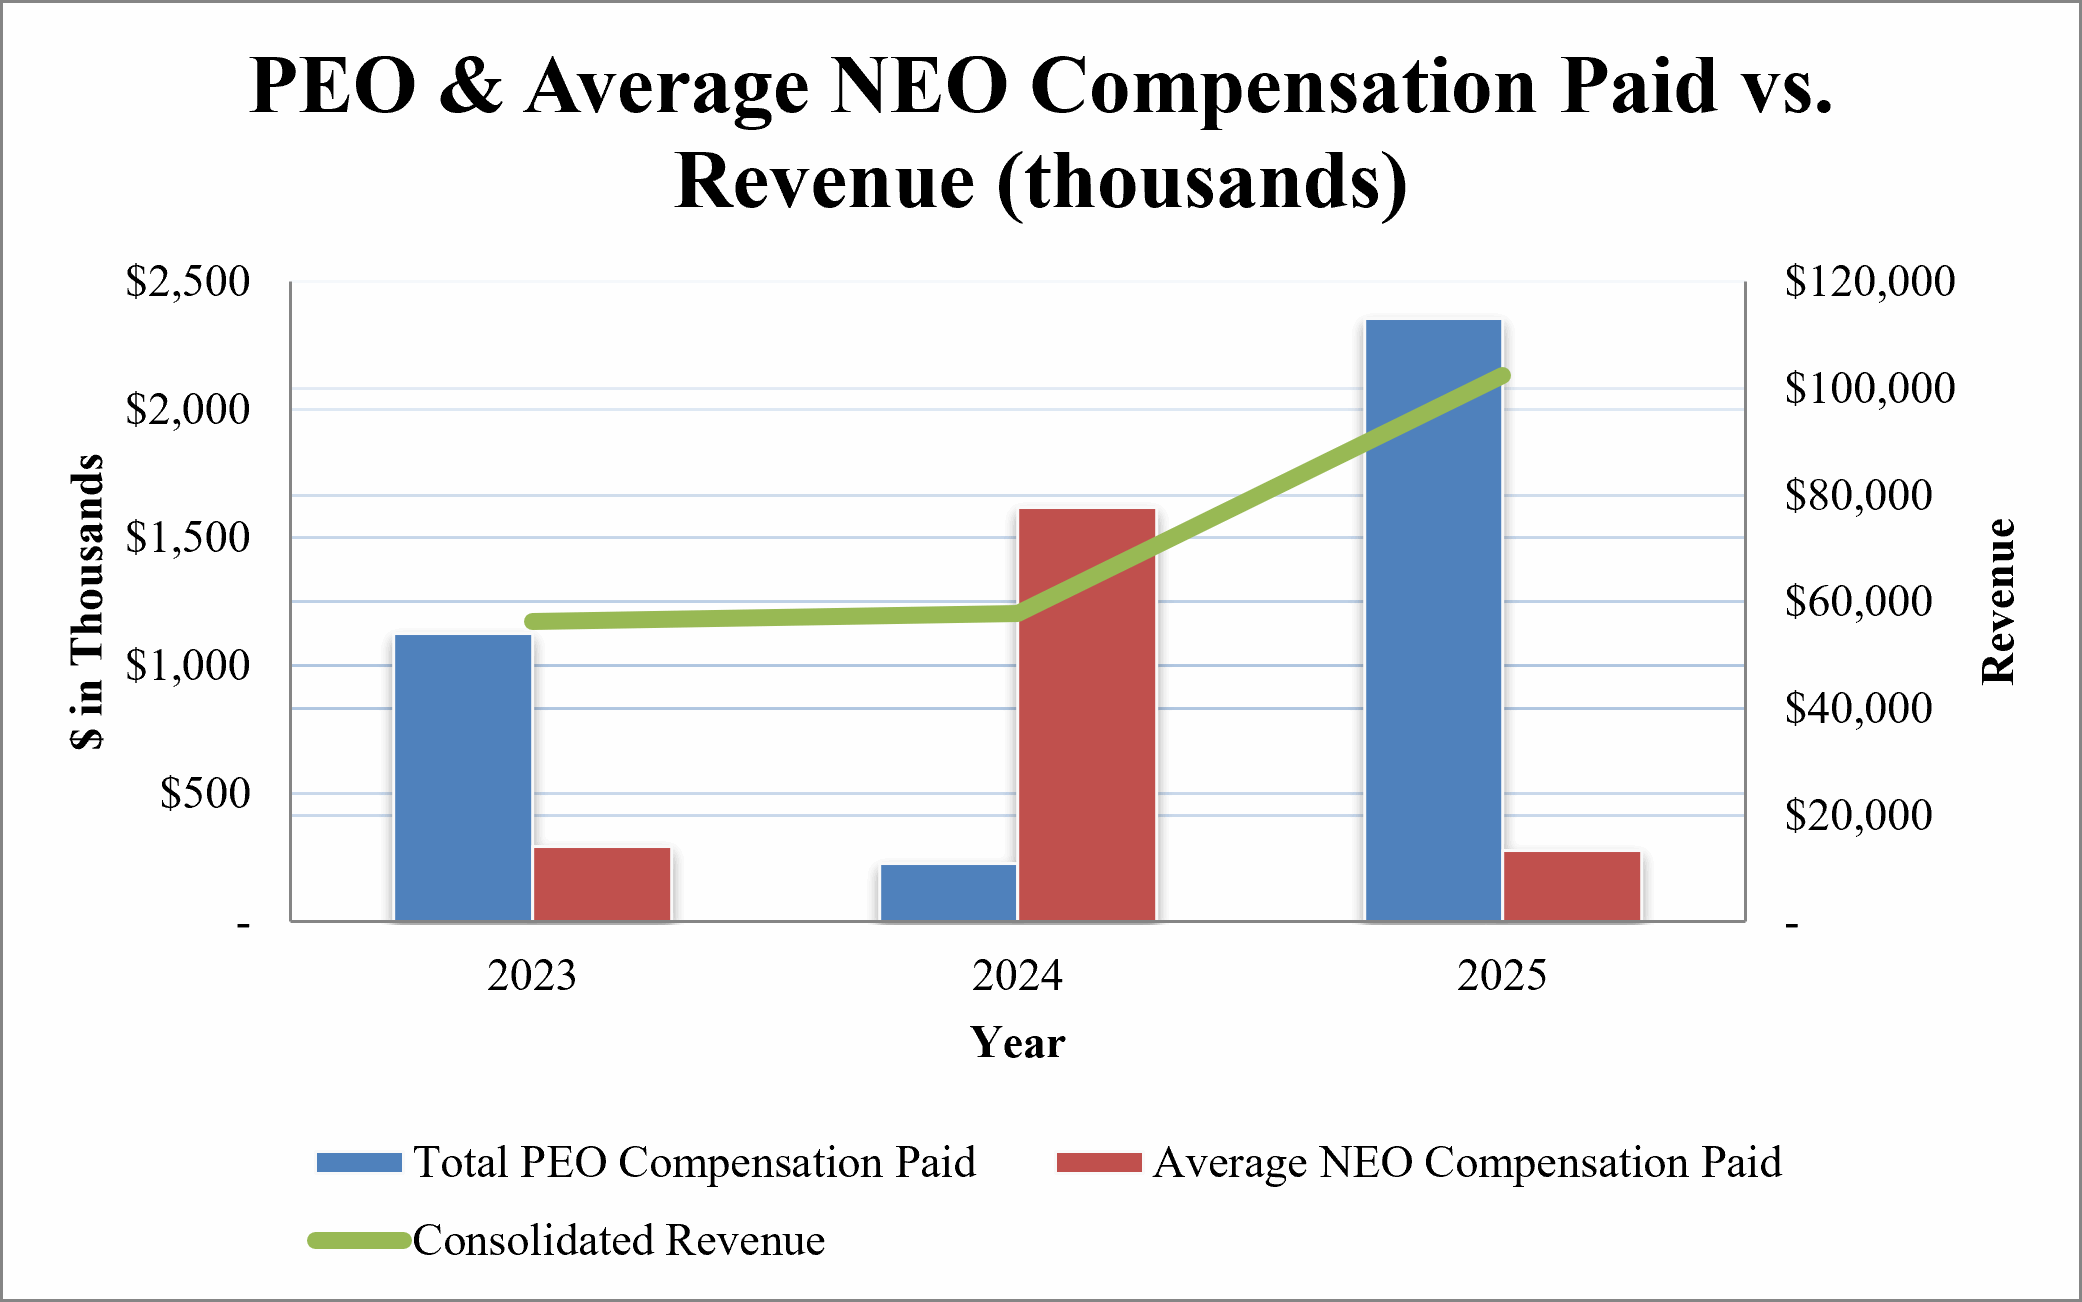
Consolidated Revenue ($ thousands) |
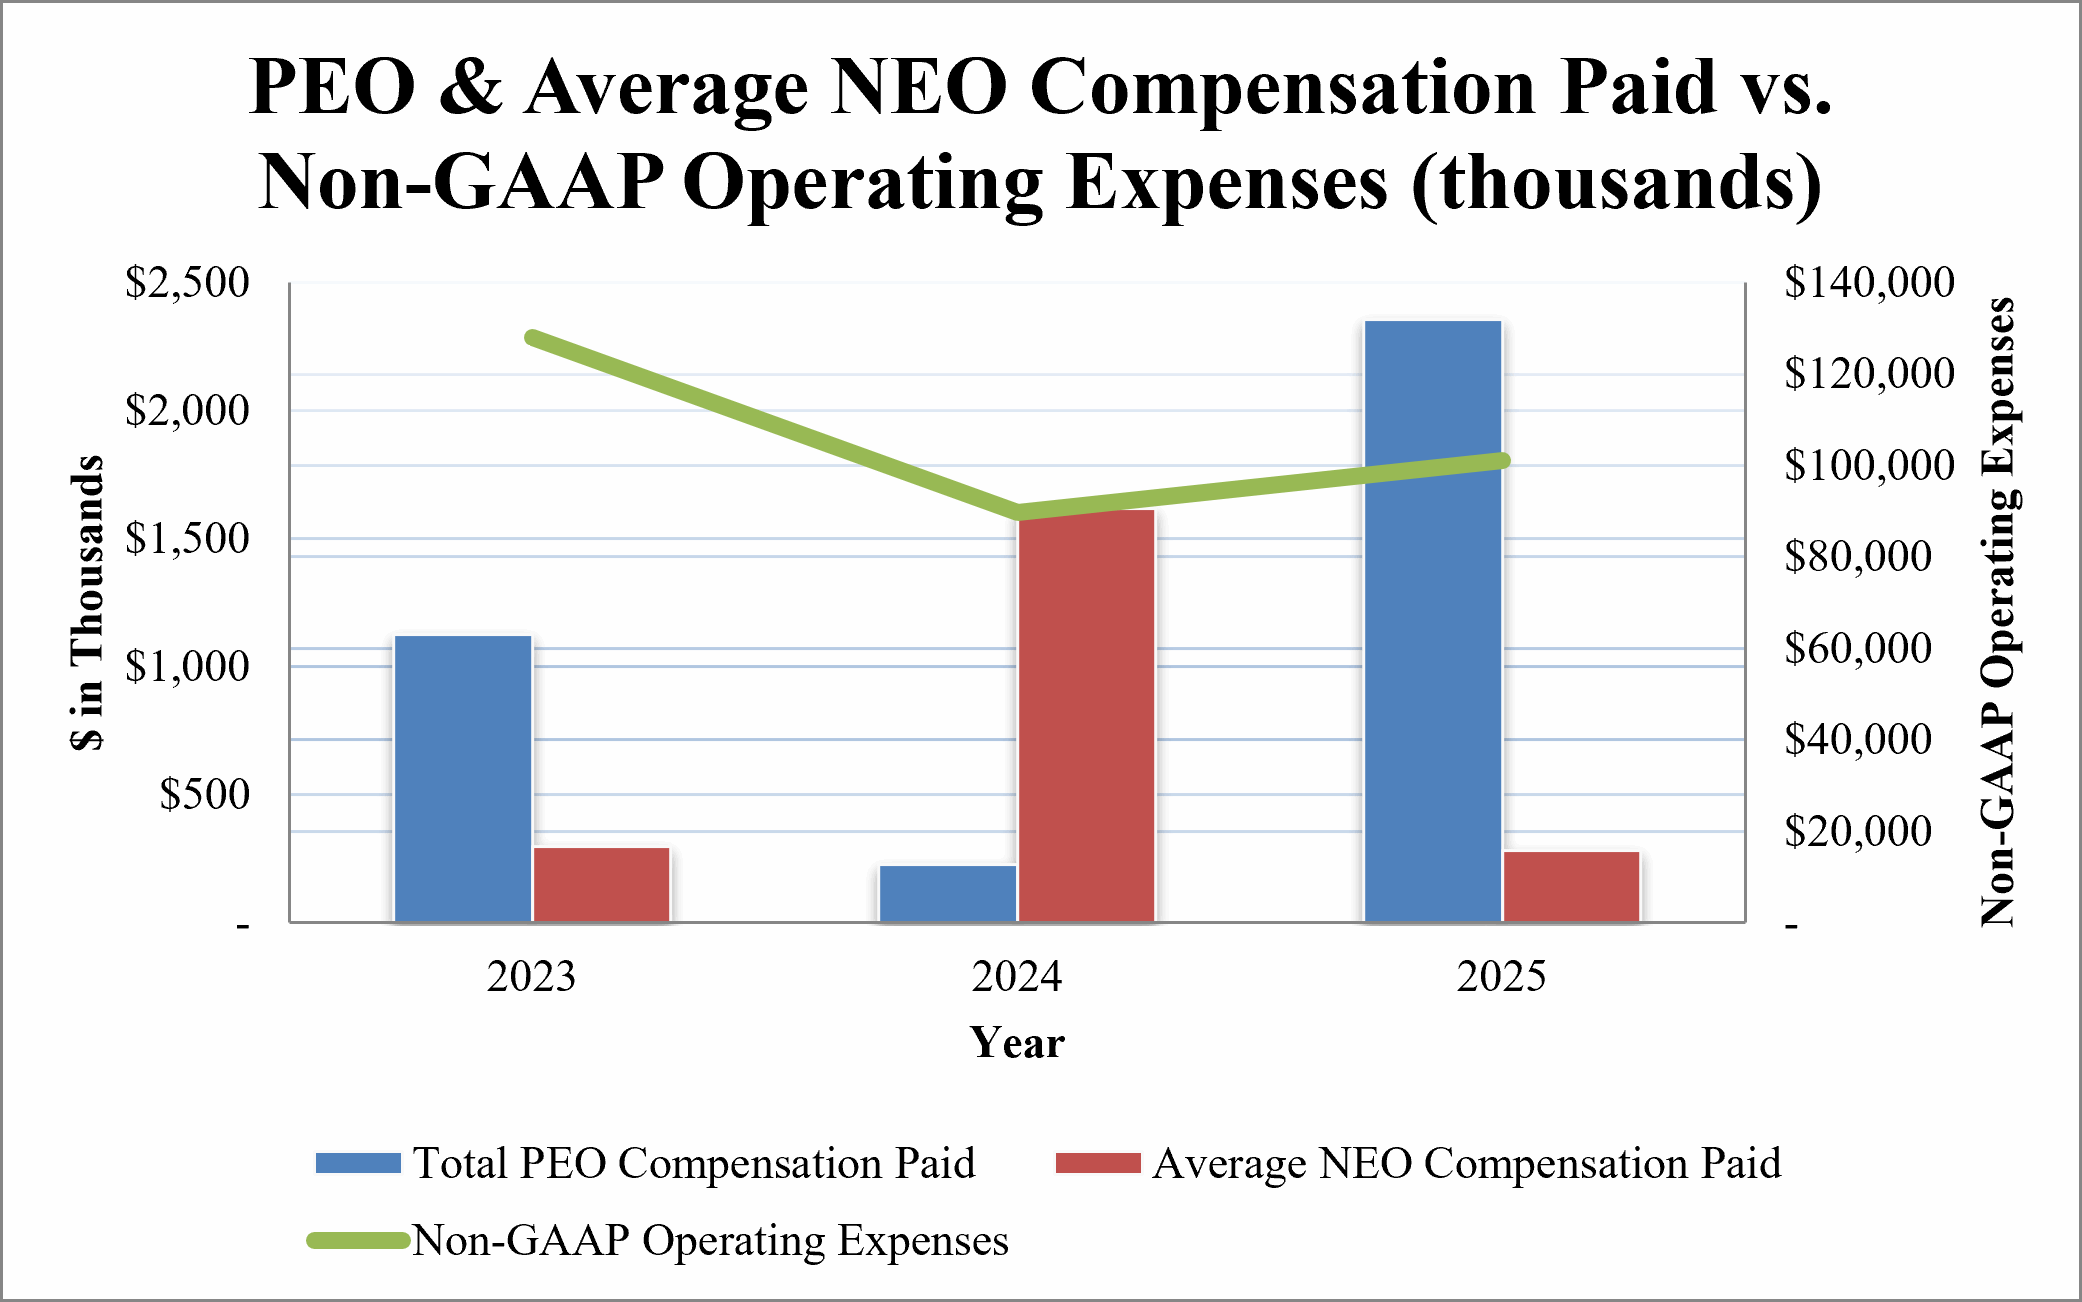
Non-GAAP Operating Expenses ($ thousands) |
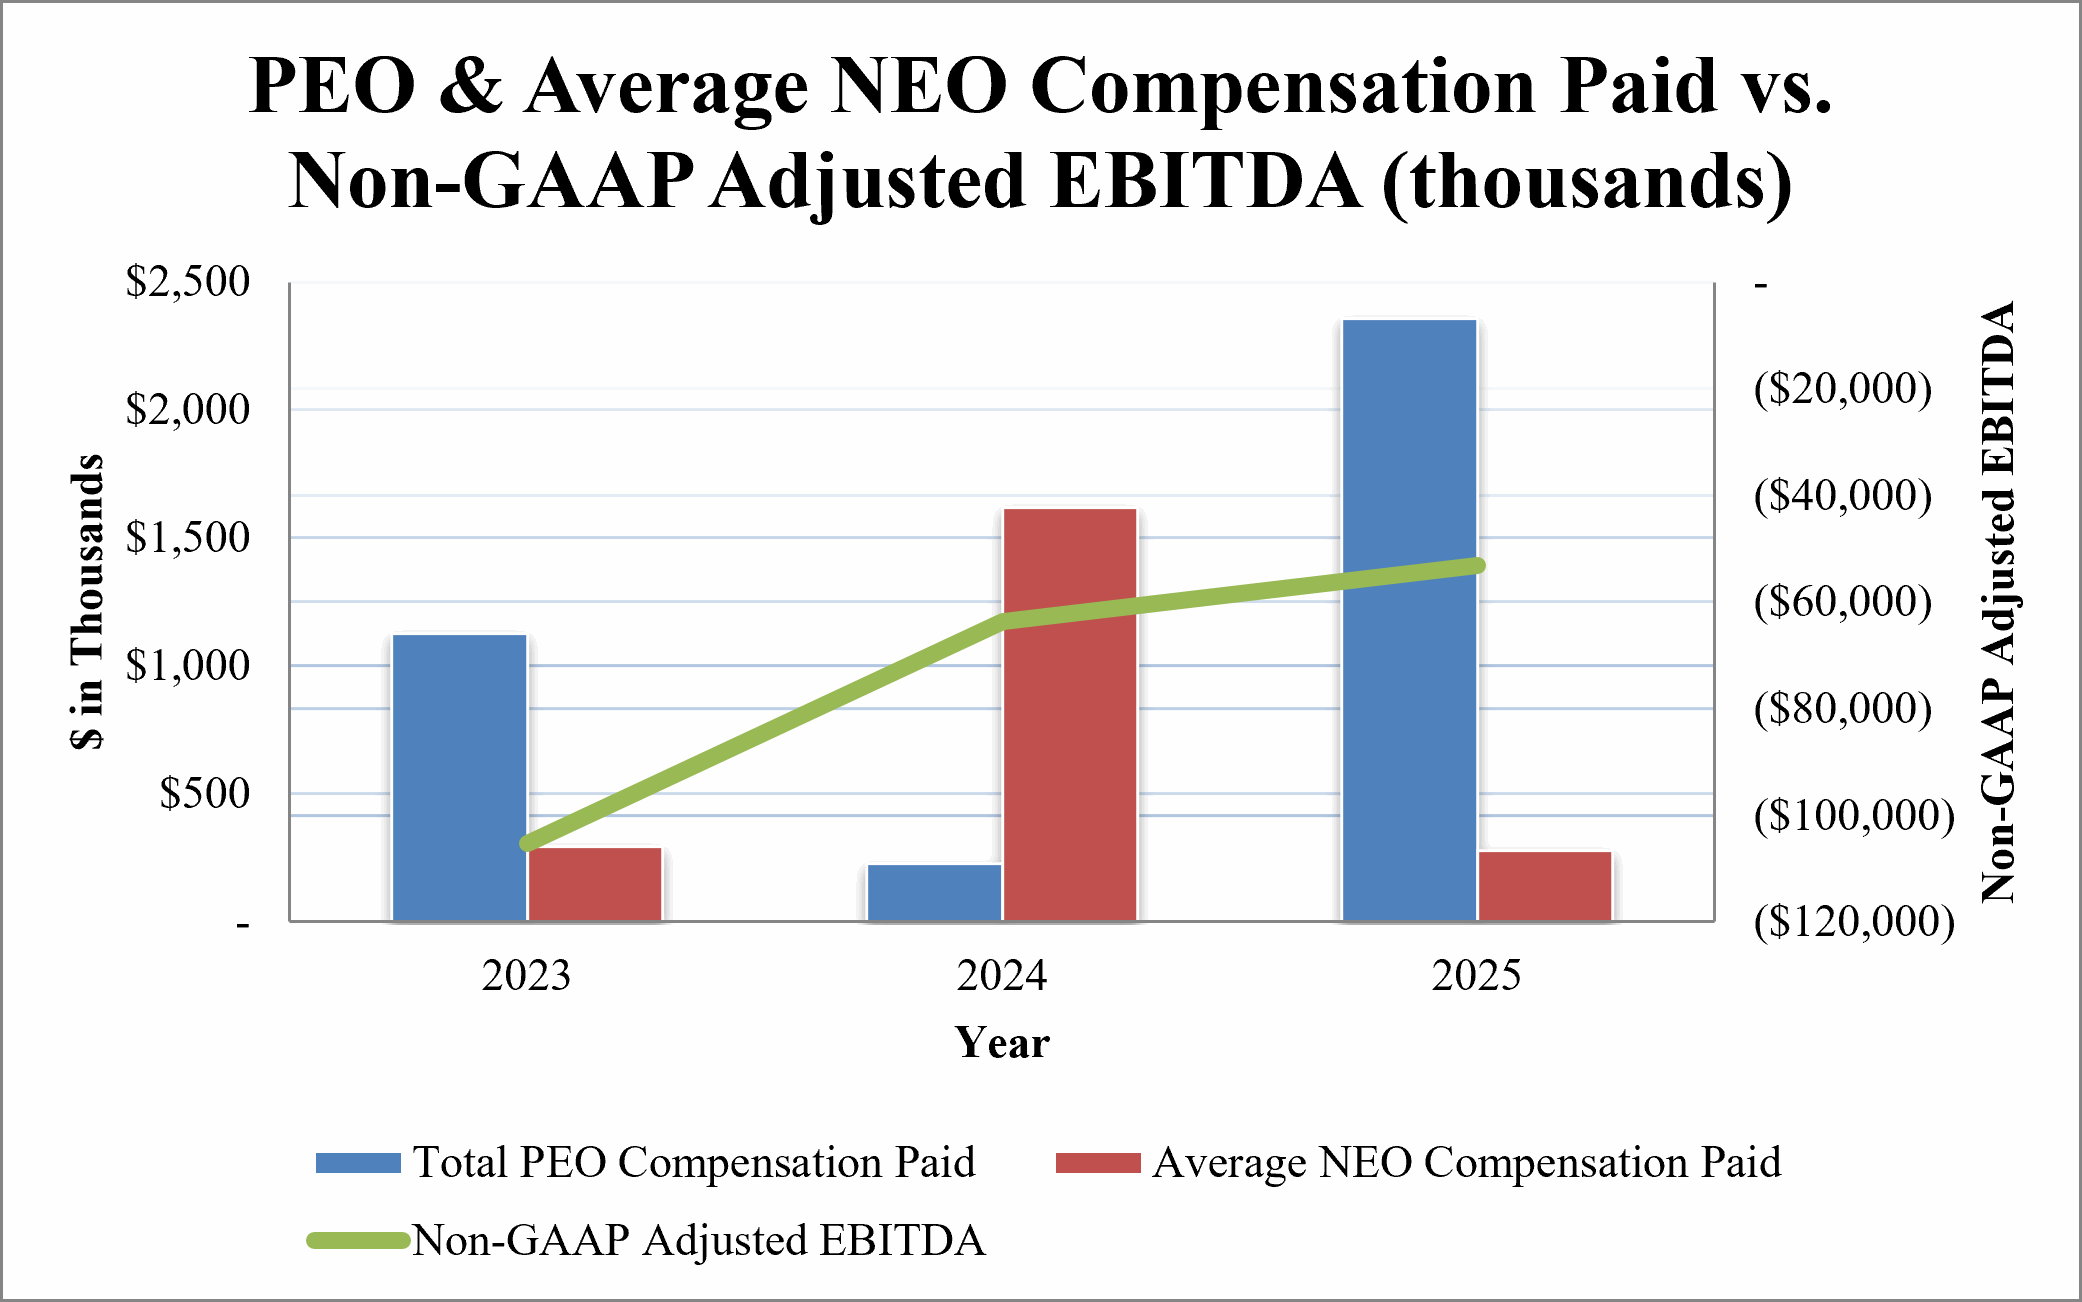
Non-GAAP Adjusted EBITDA ($ thousands) |
||
|
|
|
|
|
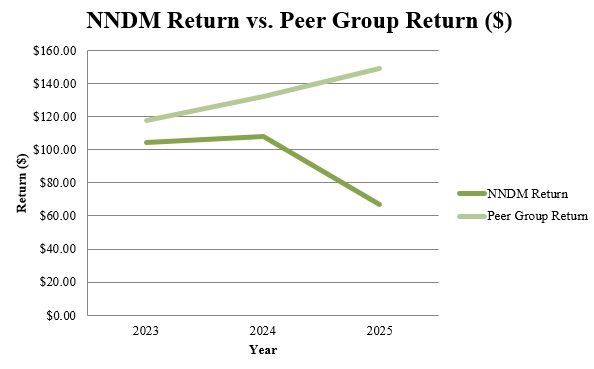
Total Shareholder Return ($)(4) |
|
Peer Group Total Shareholder Return ($)(4)(5) |
|
||||||||
2025 - Stehlin |
|
1,610 |
|
1,610 |
|
716 |
|
280 |
|
$66.96 |
|
$148.92 |
|
102,437 |
101,003 |
(53,239) |
2025 - Baharav |
|
3,263 |
|
348 |
|
" " |
|
" " |
|
" " |
|
" " |
|
" " |
" " |
" " |
2025 - Lederman |
|
793 |
|
398 |
|
" " |
|
" " |
|
" " |
|
" " |
|
" " |
" " |
" " |
2024 |
|
3,638 |
|
228 |
|
1,244 |
|
1,619 |
|
$107.83 |
|
$131.88 |
|
57,775 |
89,814 |
(63,593) |
2023 |
|
1,125 |
|
1,125 |
|
2,211 |
|
296 |
|
$104.35 |
|
$117.78 |
|
56,314 |
127,918 |
(105,317) |
(1) |
2025: Our PEO's for the year ended December 31, 2025 are Messrs. Stehlin, Baharav, and Lederman, respectively. 2024: Our PEO for the year ended December 31, 2024 is Zivi Nedivi. 2023: Our PEO for the year ended December 31, 2023 is Yoav Stern. |
(2) |
SEC rules require certain adjustments be made to the Summary Compensation Table totals to determine CAP as reported in the Pay versus Performance Table. CAP does not necessarily represent cash and/or equity value transferred to the applicable named executive officer without restriction, but rather is a value calculated under applicable SEC rules. In general, CAP is calculated as Summary Compensation Table total compensation adjusted to deduct the fair market value of equity awards as of December 31 of the applicable year or, if earlier, the vesting date (rather than the grant date) and add changes in fair value of equity awards from the prior year end in accordance with Item 402(v) of Regulation S-K, for each covered year. Named executive officers do not participate in a defined benefit plan so no adjustment for pension benefits is included in the table below. Similarly, no adjustment is made for dividends as dividends are factored into the fair value of the award. |
(3) |
The non-CEO named executive officers reflects the following individuals in each year: 2025: Jonathan Bond, General Manager of FFF; John Brenton, Chief Financial Officer; Olivier Carnal, General Manager of Essemtec; Tomer Pinchas, Former Chief Financial Officer; Nir Sade, General Manager of AME; and Assaf Zipori, Former Chief Financial Officer. 2024: Tomer Pinchas, Chief Operating Officer; Nick Geddes, Chief Technology Officer; and Yael Sandler, Chief Financial Officer, as disclosed in the Form 20-F filed on May 12, 2025. 2023: Zivi Nedivi, President; Tomer Pinchas, Chief Financial Officer & Chief Operating Officer; Nick Geddes, Chief Technology Officer; and Hanan Gino, Chief Product Officer and Head of Technology, as disclosed in the Form 20-F filed on March 21, 2024. |
(4) |
Total Stockholder Return is determined based on the value of an initial fixed investment of $100 at December 31, 2022. |
(5) |
The Peer Group referenced for purpose of the Total Stockholder Return comparison consists of the iShare Russell 2000. |
The following table outlines the adjustments made to the compensation earned by our CEO and non-CEO NEOs, as presented in the Summary Compensation Table, to derive the CAP to our CEO and non-CEO NEOs.
Item and Value Added (Deducted) |
|
2025 Stehlin |
2025 Baharav |
2025 Lederman |
|
2024 |
|
2023 |
|
For CEO: |
|
|
|
|
|
|
|
|
|
Summary Compensation Table Total |
|
1,610 |
3,263 |
793 |
|
3,638 |
|
1,125 |
|
- Summary Compensation Table “Stock Awards” column value |
|
(1,437) |
(2,915) |
(566) |
|
(2,696) |
|
— |
|
+ year-end fair value of outstanding and unvested equity awards granted in the fiscal year |
|
1,144 |
— |
— |
|
— |
|
— |
|
+/- change in fair value of outstanding and unvested equity awards granted in prior years |
|
— |
— |
— |
|
124 |
|
— |
|
+ vest date fair value of equity awards granted in the covered year |
|
293 |
— |
192 |
|
— |
|
— |
|
+/- change in fair value of prior-year equity awards vested in the fiscal year |
|
— |
— |
(21) |
|
(838) |
|
— |
|
Compensation Actually Paid |
|
1,610 |
348 |
398 |
|
228 |
|
1,125 |
|
For Non-CEO NEOs (Average): |
|
|
|
|
|
|
|
|
|
Summary Compensation Table Total |
|
716 |
" " |
" " |
|
1,244 |
|
2,211 |
|
- Summary Compensation Table “Stock Awards” column value |
|
(455) |
" " |
" " |
|
(825) |
|
(1,607) |
|
+ year-end fair value of outstanding and unvested equity awards granted in the fiscal year |
|
228 |
" " |
" " |
|
1,240 |
|
510 |
|
+/- change in fair value of outstanding and unvested equity awards granted in prior years |
|
(156) |
" " |
" " |
|
31 |
|
87 |
|
+ vest date fair value of equity awards granted in the covered year |
|
49 |
" " |
" " |
|
— |
|
— |
|
+/- change in fair value of prior-year equity awards vested in the fiscal year |
|
(102) |
" " |
" " |
|
(71) |
|
(905) |
|
Compensation Actually Paid |
|
280 |
" " |
" " |
|
1,619 |
|
296 |
|
2025 Most Important Financial Measures to Determine Compensation Actually Paid
As required by Item 402 (v) of Regulation S-K, we have identified the following performance measures as being the most important in linking actual compensation paid to our executives to our performance. The performance measures we use to evaluate our executives’ performance are described below and are not ranked by relative importance. For more information refer to the “Elements of Executive Compensation” set forth above in this Proxy Statement.
Most Important Performance Measures |
Consolidated Revenue |
Non-GAAP Operating Expenses |
Non-GAAP Adjusted EBITDA |
2025: Our PEO's for the year ended December 31, 2025 are Messrs. Stehlin, Baharav, and Lederman, respectively.
2024: Our PEO for the year ended December 31, 2024 is Zivi Nedivi.
2023: Our PEO for the year ended December 31, 2023 is Yoav Stern.
The Peer Group referenced for purpose of the Total Stockholder Return comparison consists of the iShare Russell 2000.
The following table outlines the adjustments made to the compensation earned by our CEO and non-CEO NEOs, as presented in the Summary Compensation Table, to derive the CAP to our CEO and non-CEO NEOs.
Item and Value Added (Deducted) |
|
2025 Stehlin |
2025 Baharav |
2025 Lederman |
|
2024 |
|
2023 |
|
For CEO: |
|
|
|
|
|
|
|
|
|
Summary Compensation Table Total |
|
1,610 |
3,263 |
793 |
|
3,638 |
|
1,125 |
|
- Summary Compensation Table “Stock Awards” column value |
|
(1,437) |
(2,915) |
(566) |
|
(2,696) |
|
— |
|
+ year-end fair value of outstanding and unvested equity awards granted in the fiscal year |
|
1,144 |
— |
— |
|
— |
|
— |
|
+/- change in fair value of outstanding and unvested equity awards granted in prior years |
|
— |
— |
— |
|
124 |
|
— |
|
+ vest date fair value of equity awards granted in the covered year |
|
293 |
— |
192 |
|
— |
|
— |
|
+/- change in fair value of prior-year equity awards vested in the fiscal year |
|
— |
— |
(21) |
|
(838) |
|
— |
|
Compensation Actually Paid |
|
1,610 |
348 |
398 |
|
228 |
|
1,125 |
|
For Non-CEO NEOs (Average): |
|
|
|
|
|
|
|
|
|
Summary Compensation Table Total |
|
716 |
" " |
" " |
|
1,244 |
|
2,211 |
|
- Summary Compensation Table “Stock Awards” column value |
|
(455) |
" " |
" " |
|
(825) |
|
(1,607) |
|
+ year-end fair value of outstanding and unvested equity awards granted in the fiscal year |
|
228 |
" " |
" " |
|
1,240 |
|
510 |
|
+/- change in fair value of outstanding and unvested equity awards granted in prior years |
|
(156) |
" " |
" " |
|
31 |
|
87 |
|
+ vest date fair value of equity awards granted in the covered year |
|
49 |
" " |
" " |
|
— |
|
— |
|
+/- change in fair value of prior-year equity awards vested in the fiscal year |
|
(102) |
" " |
" " |
|
(71) |
|
(905) |
|
Compensation Actually Paid |
|
280 |
" " |
" " |
|
1,619 |
|
296 |
|
2025 Most Important Financial Measures to Determine Compensation Actually Paid
As required by Item 402 (v) of Regulation S-K, we have identified the following performance measures as being the most important in linking actual compensation paid to our executives to our performance. The performance measures we use to evaluate our executives’ performance are described below and are not ranked by relative importance. For more information refer to the “Elements of Executive Compensation” set forth above in this Proxy Statement.
Most Important Performance Measures |
Consolidated Revenue |
Non-GAAP Operating Expenses |
Non-GAAP Adjusted EBITDA |
| [1] | (1) 2025: Our PEO's for the year ended December 31, 2025 are Messrs. Stehlin, Baharav, and Lederman, respectively. 2024: Our PEO for the year ended December 31, 2024 is Zivi Nedivi. 2023: Our PEO for the year ended December 31, 2023 is Yoav Stern. |
| [2] | (2) SEC rules require certain adjustments be made to the Summary Compensation Table totals to determine CAP as reported in the Pay versus Performance Table. CAP does not necessarily represent cash and/or equity value transferred to the applicable named executive officer without restriction, but rather is a value calculated under applicable SEC rules. In general, CAP is calculated as Summary Compensation Table total compensation adjusted to deduct the fair market value of equity awards as of December 31 of the applicable year or, if earlier, the vesting date (rather than the grant date) and add changes in fair value of equity awards from the prior year end in accordance with Item 402(v) of Regulation S-K, for each covered year. Named executive officers do not participate in a defined benefit plan so no adjustment for pension benefits is included in the table below. Similarly, no adjustment is made for dividends as dividends are factored into the fair value of the award. |
| [3] | (3) The non-CEO named executive officers reflects the following individuals in each year: 2025: Jonathan Bond, General Manager of FFF; John Brenton, Chief Financial Officer; Olivier Carnal, General Manager of Essemtec; Tomer Pinchas, Former Chief Financial Officer; Nir Sade, General Manager of AME; and Assaf Zipori, Former Chief Financial Officer. 2024: Tomer Pinchas, Chief Operating Officer; Nick Geddes, Chief Technology Officer; and Yael Sandler, Chief Financial Officer, as disclosed in the Form 20-F filed on May 12, 2025. 2023: Zivi Nedivi, President; Tomer Pinchas, Chief Financial Officer & Chief Operating Officer; Nick Geddes, Chief Technology Officer; and Hanan Gino, Chief Product Officer and Head of Technology, as disclosed in the Form 20-F filed on March 21, 2024. |
| [4] | (4) Total Stockholder Return is determined based on the value of an initial fixed investment of $100 at December 31, 2022. |
| [5] | (5) The Peer Group referenced for purpose of the Total Stockholder Return comparison consists of the iShare Russell 2000. |