Pay vs Performance Disclosure - USD ($)
Jul. 31, 2026
Jul. 31, 2025
Jul. 31, 2024
Jul. 31, 2023
Jul. 31, 2022
Pay Versus Performance
In this section, as required by Section 953(b) of the Dodd-Frank Wall Street Reform and Consumer Protection Act and Item 402(v) of Regulation S-K, we are providing the following information about “compensation actually paid” and the financial performance of the Company. The following table shows, for the past five fiscal years, the total compensation as reported in the Summary Compensation Table for our principal executive officers (“PEOs”) and the average for our other Named Executive Officers (“NEOs”), the compensation actually paid to our PEOs and, on an average basis, our other NEOs, our Total Shareholder Return (“TSR”), the TSR of the NASDAQ Industrial Index (our “Peer Group TSR”), our Net Income, and our company-selected measure for fiscal year 2026, Operating Income. To determine compensation actually paid, we are required to make various adjustments to amounts that have been reported in the Summary Compensation Table, as the SEC’s rule for calculating compensation actually paid emphasizes the changes in fair value of equity awards under applicable financial accounting standards (as further detailed in footnotes below).
Year |
Summary Compensation Table Total for PEO Adair |
Summary Compensation Table Total for PEO Liaw |
Comp Actually Paid to PEO Adair |
Comp Actually Paid to PEO Liaw |
Average Summary Compensation Table Total for Non-PEO NEOs |
Average Comp Actually Paid to Non-PEO NEOs |
Value of Initial Fixed $100 Investment Based On: |
Net Income $000 |
Standalone Copart Operating Income $000 |
|||||||||||||||||||||||||||||||
Copart TSR $ |
NASDAQ Industrial Index $ |
|||||||||||||||||||||||||||||||||||||||
2026 |
N/A | 2,064,740 | N/A | (5,172,956 | ) | 2,165,912 | (278,273 | ) | 79.24 | 115.61 | $ | 1,484,270 | $ | 1,652,590 | ||||||||||||||||||||||||||
2025 |
N/A | $ | 2,072,692 | N/A | $ | (1,937,010 | ) | $ | 744,238 | $ | 859,099 | 123.35 | 108.15 | $ | 1,552,449 | $ | 1,696,714 | |||||||||||||||||||||||
2024 |
$ | 845,412 | $ | 2,092,340 | $ | 8,724,928 | $ | 13,292,945 | $ | 4,301,887 | $ | 7,195,760 | 142.39 | 90.05 | $ | 1,363,020 | $ | 1,572,023 | ||||||||||||||||||||||
2023 |
$ | 384,576 | $ | 2,009,000 | $ | 18,077,203 | $ | 26,392,599 | $ | 3,526,831 | $ | 2,073,099 | 120.26 | 85.41 | $ | 1,237,741 | $ | 1,486,569 | ||||||||||||||||||||||
2022 |
$ | 265,134 | $ | 30,997,606 | $ | (9,502,692 | ) | $ | 28,889,641 | $ | 359,978 | $ | (2,285,817 | ) | 87.14 | 81.75 | $ | 1,090,130 | $ | 1,374,997 | ||||||||||||||||||||
| (1) | Mr. Adair, in his capacity as co-chief executive officer, served as the company’s co-PEO for the years 2022, 2023, and 2024 and transitioned to serving as the company’s executive chairman in 2024. Mr. Adair again became our chief executive officer effective July 31, 2026 but is treated as a non-PEO NEO for fiscal 2026 for purposes of this disclosure. |
| (2) | Mr. Liaw, in his capacity as co-chief executive officer, served as the company’s co-principal executive officer for the years 2022, 2023 and 2024, and in his capacity as chief executive officer, is the company’s principal executive officer for the year 2025 and 2026. |
| (3) | Reflects the value of the equity calculated in accordance with the SEC methodology for determining compensation actually paid for each year shown. We estimate the fair values for stock options using the Black-Scholes-Merton option pricing model, for strictly time-based options, and the Hull-White binomial lattice and a Monte Carlo simulation for performance-based stock options. The assumptions used for purposes of calculating fair values of options as of the vest date or fiscal year-end date are the same as the assumptions used for purposes of calculating the grant date fair value of options, except that we determine expected lives of options based on the “simplified method” using an average of the remaining vest and remaining term, as of the vest date or fiscal year-end date, and the risk-free rate is based on the Treasury Constant Maturity rate closest to the remaining expected life, as of the vest date or fiscal year-end date. |
| (4) | The remaining non-PEO named executive officers are (i) for fiscal 2022, John North, (ii) for fiscal 2023, Leah C. Stearns, Gavin Renfrew, and John North, (iii), for fiscal 2024, Leah C. Stearns, (iv) for fiscal 2025, A. Jayson Adair and Leah C. Stearns, and (v) for fiscal 2026, A. Jayson Adair and Leah C. Stearns. Compensation for our non-PEO named executive officers reflects the amounts in the summary compensation table for the respective years. |
| (5) | Adjustments to total compensation for Mr. Adair for fiscal 2024 as reported in the summary compensation table consist of: (a) $0 deduction for amounts reported under the “Stock Awards” and “Option Awards” columns in the summary compensation table; (b) $0 increase based on the fair value of equity awards granted in fiscal 2024 that remained outstanding and unvested as of July 31, 2024; (c) $4,365,175 increase for equity awards granted in prior fiscal years that remained outstanding and unvested as of July 31, 2024, determined based on the change in fair value of such awards from July 31, 2023, to July 31, 2024; and (d) $3,537,613 increase for awards granted in prior fiscal years that vested in fiscal 2024, determined based on the change in fair value of such awards from July 31, 2023, to the vest date. |
| (6) | Adjustments to total compensation for Mr. Adair for fiscal 2023 as reported in the summary compensation table consist of: (a) $0 deduction for amounts reported under the “Stock Awards” and “Option Awards” columns in the summary compensation table; (b) $0 increase based on the fair value of equity awards granted in fiscal 2023 that remained outstanding and unvested as of July 31, 2023; (c) $15,613,746 increase for equity awards granted in prior fiscal years that remained outstanding and unvested as of July 31, 2023, determined based on the change in fair value of such awards from July 31, 2022, to July 31, 2023; and (d) $2,078,881 increase for awards granted in prior fiscal years that vested in fiscal 2023, determined based on the change in fair value of such awards from July 31, 2022, to the vest date. |
| (7) | Adjustments to total compensation for Mr. Adair for fiscal 2022 as reported in the summary compensation table consist of: (a) $0 deduction for amounts reported under the “Stock Awards” and “Option Awards” columns in the summary compensation table; (b) $0 increase based on the fair value of equity awards granted in fiscal 2022 that remained outstanding and unvested as of July 31, 2022; (c) $7,367,408 deduction for equity awards granted in prior fiscal years that remained outstanding and unvested as of July 31, 2022, determined based on the change in fair value of such awards from July 31, 2021, to July 31, 2022; and (d) $2,400,418 deduction for awards granted in prior fiscal years that vested in fiscal 2022, determined based on the change in fair value of such awards from July 31, 2021, to the vest date. |
| (8) | Adjustments to total compensation for Mr. Liaw for fiscal 2026 as reported in the summary compensation table consist of: (a) $0 for amounts reported under the “Stock Awards” and “Option Awards” columns in the summary compensation table; (b) $0 based on the fair value of equity awards granted in fiscal 2026 that remained outstanding and unvested as of July 31, 2026; (c) $4,473,712 deduction for equity awards granted in prior fiscal years that remained outstanding and unvested as of July 31, 2026, determined based on the change in fair value of such awards from July 31, 2025, to July 31, 2026; (d) $2,763,984 deduction for awards granted in prior fiscal years that vested in fiscal 2026, determined based on the change in fair value of such awards from July 31, 2025, to the vest date. |
| (9) | Adjustments to total compensation for Mr. Liaw for fiscal 2025 as reported in the summary compensation table consist of: (a) $0 deduction for amounts reported under the “Stock Awards” and “Option Awards” columns in the summary compensation table; (b) $0 increase based on the fair value of equity awards granted in |
fiscal 2025 that remained outstanding and unvested as of July 31, 2025; (c) $5,164,810 deduction for equity awards granted in prior fiscal years that remained outstanding and unvested as of July 31, 2025 determined based on the change in fair value of such awards from July 31, 2024, to July 31, 2025; (d) $1,155,108 increase for awards granted in prior fiscal years that vested in fiscal 2025, determined based on the change in fair value of such awards from July 31, 2024, to the vest date. |
(10) |
Adjustments to total compensation for Mr. Liaw for fiscal 2024 as reported in the summary compensation table consist of: (a) $0 deduction for amounts reported under the “Stock Awards” and “Option Awards” columns in the summary compensation table; (b) $0 increase based on the fair value of equity awards granted in fiscal 2024 that remained outstanding and unvested as of July 31, 2024; (c) $8,483,535 increase for equity awards granted in prior fiscal years that remained outstanding and unvested as of July 31, 2024, determined based on the change in fair value of such awards from July 31, 2023, to July 31, 2024; (d) $2,717,069 increase for awards granted in prior fiscal years that vested in fiscal 2024, determined based on the change in fair value of such awards from July 31, 2023, to the vest date. |
(11) |
Adjustments to total compensation for Mr. Liaw for fiscal 2023 as reported in the summary compensation table consist of: (a) $0 deduction for amounts reported under the “Stock Awards” and “Option Awards” columns in the summary compensation table; (b) $0 increase based on the fair value of equity awards granted in fiscal 2023 that remained outstanding and unvested as of July 31, 2023; (c) $20,842,523 increase for equity awards granted in prior fiscal years that remained outstanding and unvested as of July 31, 2023, determined based on the change in fair value of such awards from July 31, 2022, to July 31, 2023; (d) $3,541,076 increase for awards granted in prior fiscal years that vested in fiscal 2023, determined based on the change in fair value of such awards from July 31, 2022, to the vest date. |
(12) |
Adjustments to total compensation for Mr. Liaw for fiscal 2022 as reported in the summary compensation table consist of: (a) $29,362,547 deduction for amounts reported under the “Stock Awards” and “Option Awards” columns in the summary compensation table; (b) $31,386,290 increase based on the fair value of equity awards granted in fiscal 2022 that remained outstanding and unvested as of July 31, 2022; (c) $2,388,565 deduction for equity awards granted in prior fiscal years that remained outstanding and unvested as of July 31, 2022, determined based on the change in fair value of such awards from July 31, 2021, to July 31, 2022; (d) $1,743,143 deduction for awards granted in prior fiscal years that vested in fiscal 2022, determined based on the change in fair value of such awards from July 31, 2021, to the vest date. |
| (13) | Adjustments to the non-PEO named executive officers’ average total compensation for fiscal 2026 as reported in the summary compensation table consist of: (a) $1,445,359 deduction for amounts reported under the “Stock Awards” and “Option Awards” columns in the summary compensation table; (b) $653,463 addition based on the fair value of equity awards granted in fiscal 2026 that remained outstanding and unvested as of July 31, 2026; (c) $1,304,334 deduction for equity awards granted in prior fiscal years that remained outstanding and unvested as of July 31, 2026, determined based on the change in fair value of such awards from July 31, 2025, to July 31, 2026; (d) $347,954 decrease for awards granted in prior fiscal years that vested in fiscal 2026, determined based on the change in fair value of such awards from July 31, 2025, to the vest date. |
| (14) | Adjustments to the non-PEO named executive officers’ average total compensation for fiscal 2025 as reported in the summary compensation table consist of: (a) $0 deduction for amounts reported under the “Stock Awards” and “Option Awards” columns in the summary compensation table; (b) $0 deduction based on the fair value of equity awards granted in fiscal 2025 that remained outstanding and unvested as of July 31, 2025; (c) $1,007,263 deduction for equity awards granted in prior fiscal years that remained outstanding and unvested as of July 31, 2025, determined based on the change in fair value of such awards from July 31, 2024, to July 31, 2025; (d) $1,122,125 increase for awards granted in prior fiscal years that vested in fiscal 2025, determined based on the change in fair value of such awards from July 31, 2024, to the vest date. |
| (15) | Adjustments to the non-PEO named executive officers’ average total compensation for fiscal 2024 as reported in the summary compensation table consist of: (a) $3,275,415 deduction for amounts reported under the “Stock Awards” and “Option Awards” columns in the summary compensation table; (b) $3,319,268 increase based on the fair value of equity awards granted in fiscal 2024 that remained outstanding and unvested as of July 31, 2024; (c) $2,104,064 increase for equity awards granted in prior fiscal years that remained outstanding and unvested as of July 31, 2024, determined based on the change in fair value of such awards from July 31, 2023, to July 31, 2024; (d) $745,957 increase for awards granted in prior fiscal years that vested in fiscal 2024, determined based on the change in fair value of such awards from July 31, 2023, to the vest date. |
| (16) | Adjustments to the non-PEO named executive officers’ average total compensation for fiscal 2023 as reported in the summary compensation table consist of: (a) $3,059,232 deduction for amounts reported under the “Stock Awards” and “Option Awards” columns in the summary compensation table; (b) $4,468,612 increase based on the fair value of equity awards granted in fiscal 2023 that remain outstanding and unvested as of July 31, 2023; (c) $2,904,515 deduction for equity awards granted in prior fiscal years that remained outstanding and unvested as of July 31, 2023, determined based on the change in fair value of such awards from July 31, 2022, to July 31, 2023; (d) $41,403 increase for awards granted in prior fiscal years that vested in fiscal 2023, determined based on the change in fair value of such awards from July 31, 2022, to the vest date. |
| (17) | Adjustments to the non-PEO named executive officers’ average total compensation for fiscal 2022 as reported in the summary compensation table consist of: (a) $0 deduction for amounts reported under the “Stock Awards” and “Option Awards” columns in the summary compensation table; (b) $0 deduction based on the fair value of equity awards granted in fiscal 2022 that remained outstanding and unvested as of July 31, 2022; (c) $1,930,916 deduction for equity awards granted in prior fiscal years that remained outstanding and unvested as of July 31, 2022, determined based on the change in fair value of such awards from July 31, 2021, to July 31, 2022; (d) $714,879 deduction for awards granted in prior fiscal years that vested in fiscal 2022, determined based on the change in fair value of such awards from July 31, 2021, to the vest date. |
(18) |
Copart “TSR” represents the cumulative TSR for the Company and the Peer Group TSR represents the cumulative TSR of the Nasdaq Industrial index (which is the peer group we used for the stock performance graph required by item 201(e) of Regulation S-K included in our annual report on Form 10-k for the fiscal year ended July 31, 2026), as applicable, over the period beginning July 31, 2021, and ending as of the last day of fiscal 2022, fiscal 2023, fiscal 2024, fiscal 2025, or fiscal 2026, as applicable, as calculated in the manner prescribed by item 201(e) of Regulation S-K. |
| (5) | Adjustments to total compensation for Mr. Adair for fiscal 2024 as reported in the summary compensation table consist of: (a) $0 deduction for amounts reported under the “Stock Awards” and “Option Awards” columns in the summary compensation table; (b) $0 increase based on the fair value of equity awards granted in fiscal 2024 that remained outstanding and unvested as of July 31, 2024; (c) $4,365,175 increase for equity awards granted in prior fiscal years that remained outstanding and unvested as of July 31, 2024, determined based on the change in fair value of such awards from July 31, 2023, to July 31, 2024; and (d) $3,537,613 increase for awards granted in prior fiscal years that vested in fiscal 2024, determined based on the change in fair value of such awards from July 31, 2023, to the vest date. |
| (6) | Adjustments to total compensation for Mr. Adair for fiscal 2023 as reported in the summary compensation table consist of: (a) $0 deduction for amounts reported under the “Stock Awards” and “Option Awards” columns in the summary compensation table; (b) $0 increase based on the fair value of equity awards granted in fiscal 2023 that remained outstanding and unvested as of July 31, 2023; (c) $15,613,746 increase for equity awards granted in prior fiscal years that remained outstanding and unvested as of July 31, 2023, determined based on the change in fair value of such awards from July 31, 2022, to July 31, 2023; and (d) $2,078,881 increase for awards granted in prior fiscal years that vested in fiscal 2023, determined based on the change in fair value of such awards from July 31, 2022, to the vest date. |
| (7) | Adjustments to total compensation for Mr. Adair for fiscal 2022 as reported in the summary compensation table consist of: (a) $0 deduction for amounts reported under the “Stock Awards” and “Option Awards” columns in the summary compensation table; (b) $0 increase based on the fair value of equity awards granted in fiscal 2022 that remained outstanding and unvested as of July 31, 2022; (c) $7,367,408 deduction for equity awards granted in prior fiscal years that remained outstanding and unvested as of July 31, 2022, determined based on the change in fair value of such awards from July 31, 2021, to July 31, 2022; and (d) $2,400,418 deduction for awards granted in prior fiscal years that vested in fiscal 2022, determined based on the change in fair value of such awards from July 31, 2021, to the vest date. |
| (8) | Adjustments to total compensation for Mr. Liaw for fiscal 2026 as reported in the summary compensation table consist of: (a) $0 for amounts reported under the “Stock Awards” and “Option Awards” columns in the summary compensation table; (b) $0 based on the fair value of equity awards granted in fiscal 2026 that remained outstanding and unvested as of July 31, 2026; (c) $4,473,712 deduction for equity awards granted in prior fiscal years that remained outstanding and unvested as of July 31, 2026, determined based on the change in fair value of such awards from July 31, 2025, to July 31, 2026; (d) $2,763,984 deduction for awards granted in prior fiscal years that vested in fiscal 2026, determined based on the change in fair value of such awards from July 31, 2025, to the vest date. |
| (9) | Adjustments to total compensation for Mr. Liaw for fiscal 2025 as reported in the summary compensation table consist of: (a) $0 deduction for amounts reported under the “Stock Awards” and “Option Awards” columns in the summary compensation table; (b) $0 increase based on the fair value of equity awards granted in |
fiscal 2025 that remained outstanding and unvested as of July 31, 2025; (c) $5,164,810 deduction for equity awards granted in prior fiscal years that remained outstanding and unvested as of July 31, 2025 determined based on the change in fair value of such awards from July 31, 2024, to July 31, 2025; (d) $1,155,108 increase for awards granted in prior fiscal years that vested in fiscal 2025, determined based on the change in fair value of such awards from July 31, 2024, to the vest date. |
(10) |
Adjustments to total compensation for Mr. Liaw for fiscal 2024 as reported in the summary compensation table consist of: (a) $0 deduction for amounts reported under the “Stock Awards” and “Option Awards” columns in the summary compensation table; (b) $0 increase based on the fair value of equity awards granted in fiscal 2024 that remained outstanding and unvested as of July 31, 2024; (c) $8,483,535 increase for equity awards granted in prior fiscal years that remained outstanding and unvested as of July 31, 2024, determined based on the change in fair value of such awards from July 31, 2023, to July 31, 2024; (d) $2,717,069 increase for awards granted in prior fiscal years that vested in fiscal 2024, determined based on the change in fair value of such awards from July 31, 2023, to the vest date. |
(11) |
Adjustments to total compensation for Mr. Liaw for fiscal 2023 as reported in the summary compensation table consist of: (a) $0 deduction for amounts reported under the “Stock Awards” and “Option Awards” columns in the summary compensation table; (b) $0 increase based on the fair value of equity awards granted in fiscal 2023 that remained outstanding and unvested as of July 31, 2023; (c) $20,842,523 increase for equity awards granted in prior fiscal years that remained outstanding and unvested as of July 31, 2023, determined based on the change in fair value of such awards from July 31, 2022, to July 31, 2023; (d) $3,541,076 increase for awards granted in prior fiscal years that vested in fiscal 2023, determined based on the change in fair value of such awards from July 31, 2022, to the vest date. |
(12) |
Adjustments to total compensation for Mr. Liaw for fiscal 2022 as reported in the summary compensation table consist of: (a) $29,362,547 deduction for amounts reported under the “Stock Awards” and “Option Awards” columns in the summary compensation table; (b) $31,386,290 increase based on the fair value of equity awards granted in fiscal 2022 that remained outstanding and unvested as of July 31, 2022; (c) $2,388,565 deduction for equity awards granted in prior fiscal years that remained outstanding and unvested as of July 31, 2022, determined based on the change in fair value of such awards from July 31, 2021, to July 31, 2022; (d) $1,743,143 deduction for awards granted in prior fiscal years that vested in fiscal 2022, determined based on the change in fair value of such awards from July 31, 2021, to the vest date. |
| (13) | Adjustments to the non-PEO named executive officers’ average total compensation for fiscal 2026 as reported in the summary compensation table consist of: (a) $1,445,359 deduction for amounts reported under the “Stock Awards” and “Option Awards” columns in the summary compensation table; (b) $653,463 addition based on the fair value of equity awards granted in fiscal 2026 that remained outstanding and unvested as of July 31, 2026; (c) $1,304,334 deduction for equity awards granted in prior fiscal years that remained outstanding and unvested as of July 31, 2026, determined based on the change in fair value of such awards from July 31, 2025, to July 31, 2026; (d) $347,954 decrease for awards granted in prior fiscal years that vested in fiscal 2026, determined based on the change in fair value of such awards from July 31, 2025, to the vest date. |
| (14) | Adjustments to the non-PEO named executive officers’ average total compensation for fiscal 2025 as reported in the summary compensation table consist of: (a) $0 deduction for amounts reported under the “Stock Awards” and “Option Awards” columns in the summary compensation table; (b) $0 deduction based on the fair value of equity awards granted in fiscal 2025 that remained outstanding and unvested as of July 31, 2025; (c) $1,007,263 deduction for equity awards granted in prior fiscal years that remained outstanding and unvested as of July 31, 2025, determined based on the change in fair value of such awards from July 31, 2024, to July 31, 2025; (d) $1,122,125 increase for awards granted in prior fiscal years that vested in fiscal 2025, determined based on the change in fair value of such awards from July 31, 2024, to the vest date. |
| (15) | Adjustments to the non-PEO named executive officers’ average total compensation for fiscal 2024 as reported in the summary compensation table consist of: (a) $3,275,415 deduction for amounts reported under the “Stock Awards” and “Option Awards” columns in the summary compensation table; (b) $3,319,268 increase based on the fair value of equity awards granted in fiscal 2024 that remained outstanding and unvested as of July 31, 2024; (c) $2,104,064 increase for equity awards granted in prior fiscal years that remained outstanding and unvested as of July 31, 2024, determined based on the change in fair value of such awards from July 31, 2023, to July 31, 2024; (d) $745,957 increase for awards granted in prior fiscal years that vested in fiscal 2024, determined based on the change in fair value of such awards from July 31, 2023, to the vest date. |
| (16) | Adjustments to the non-PEO named executive officers’ average total compensation for fiscal 2023 as reported in the summary compensation table consist of: (a) $3,059,232 deduction for amounts reported under the “Stock Awards” and “Option Awards” columns in the summary compensation table; (b) $4,468,612 increase based on the fair value of equity awards granted in fiscal 2023 that remain outstanding and unvested as of July 31, 2023; (c) $2,904,515 deduction for equity awards granted in prior fiscal years that remained outstanding and unvested as of July 31, 2023, determined based on the change in fair value of such awards from July 31, 2022, to July 31, 2023; (d) $41,403 increase for awards granted in prior fiscal years that vested in fiscal 2023, determined based on the change in fair value of such awards from July 31, 2022, to the vest date. |
| (17) | Adjustments to the non-PEO named executive officers’ average total compensation for fiscal 2022 as reported in the summary compensation table consist of: (a) $0 deduction for amounts reported under the “Stock Awards” and “Option Awards” columns in the summary compensation table; (b) $0 deduction based on the fair value of equity awards granted in fiscal 2022 that remained outstanding and unvested as of July 31, 2022; (c) $1,930,916 deduction for equity awards granted in prior fiscal years that remained outstanding and unvested as of July 31, 2022, determined based on the change in fair value of such awards from July 31, 2021, to July 31, 2022; (d) $714,879 deduction for awards granted in prior fiscal years that vested in fiscal 2022, determined based on the change in fair value of such awards from July 31, 2021, to the vest date. |
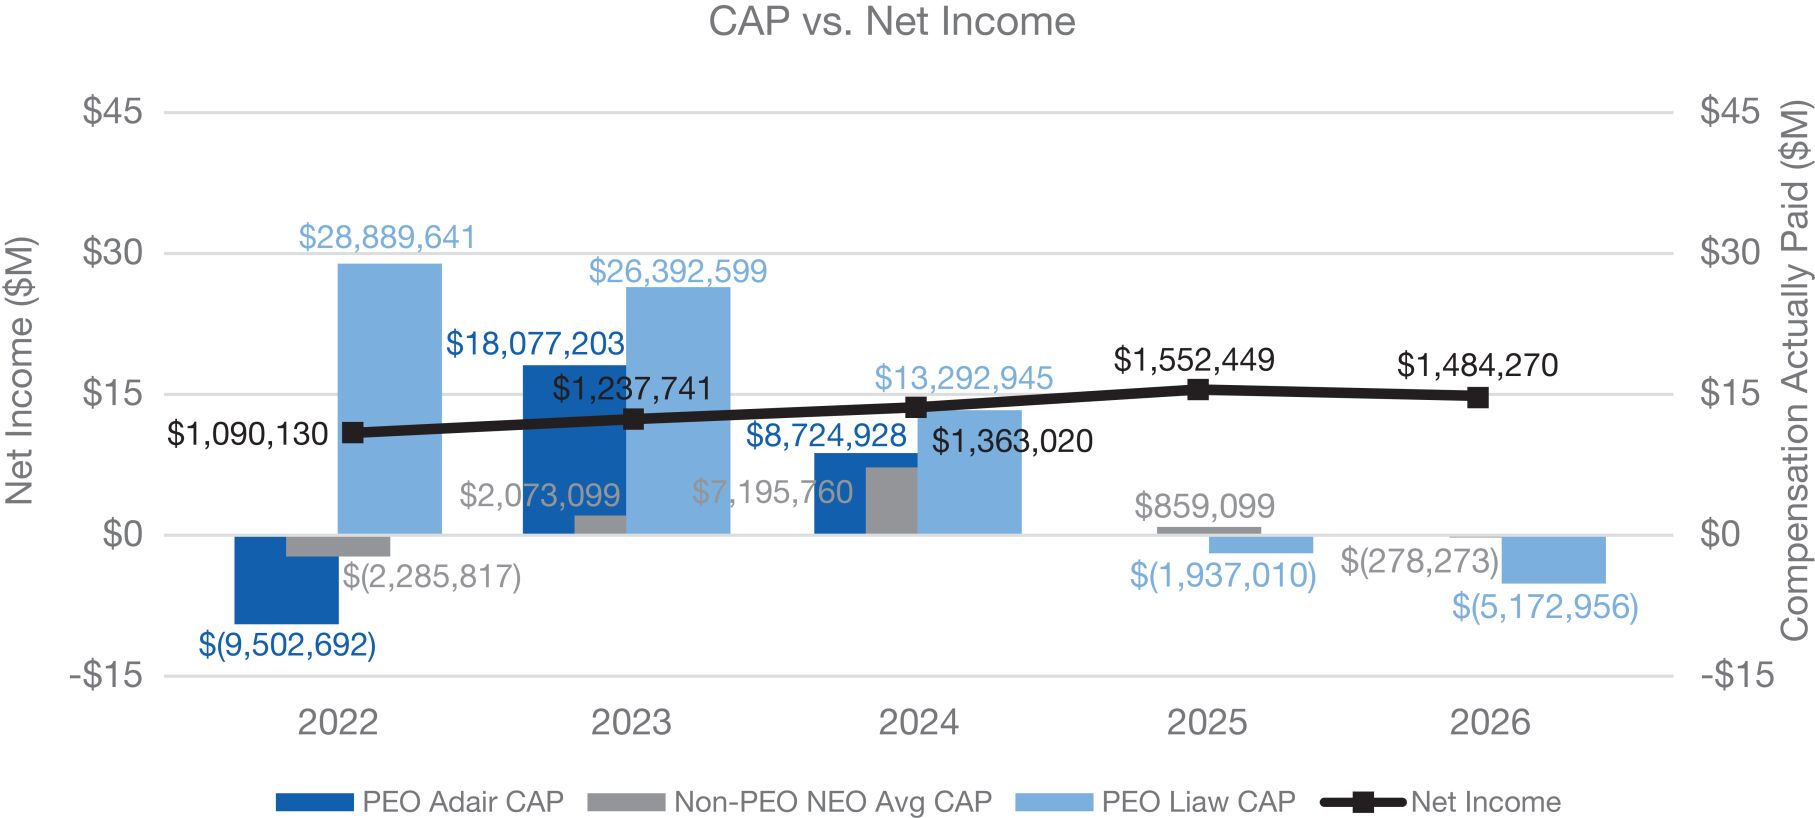
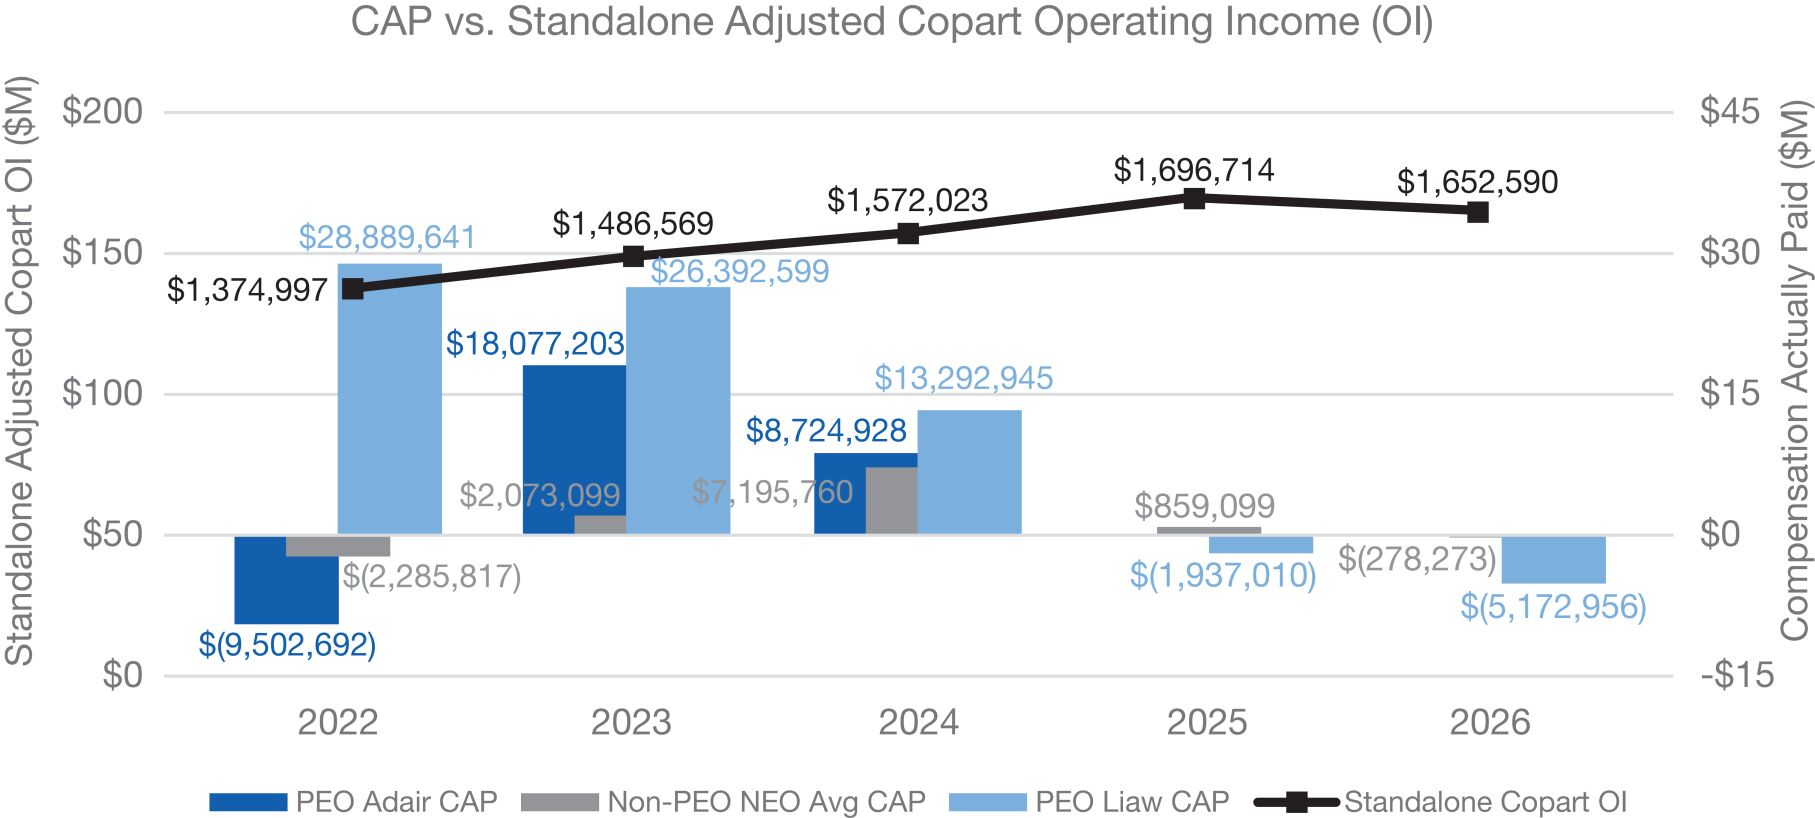
Compensation Actually Paid compared to TSR, net income, and adjusted operating income.
Compensation actually paid to A. Jayson Adair (i) increased in fiscal 2023 by $27,579,895, or 290%, from $(9,502,692) in fiscal 2022 to $18,077,203 in fiscal 2023, and (ii) decreased in fiscal 2024 by $(9,352,275), or 52%, from $18,077,203 in fiscal 2023 to $8,724,928 in fiscal 2024. Compensation actually paid to our PEO Jeffrey Liaw (i) decreased in fiscal 2023 by $(2,497,042), or 9%, from $28,889,641 in fiscal 2022 to $26,392,599 in fiscal 2023, (ii) decreased in fiscal 2024 by ($13,099,654) or 50% from $26,392,599 in fiscal year 2023 to $13,292,945 in fiscal year 2024, and (iii) decreased in fiscal 2025 by $(15,229,955), or 115%, from $13,292,945 in fiscal 2024 to $(1,937,010) in fiscal 2025, and (iv) decreased in fiscal 2026 by $3,235,946, or 167%, from $(1,937,010) in fiscal 2025 to $(5,172,956) in fiscal 2026. Average compensation actually paid to the remaining non-PEO named executive
officers (i) increased in fiscal 2023 by $4,358,916, or 191%, from $(2,285,817) in fiscal 2022 to $2,073,099 in fiscal 2023, (ii) increased in fiscal 2024 by $5,122,661, or 247%, from $2,073,099 in fiscal 2023 to $7,195,760 in fiscal 2024, (iii) decreased in fiscal 2025
by
$(6,336,661), or 88%, from $7,195,760 in fiscal 2024 to $859,099 in fiscal 2025, and (iv) decreased in fiscal 2026 by $1,137,372, or 132%, from $859,099 in fiscal 2025 to $(278,273) in fiscal 2026. Our cumulative TSR (i) increased in fiscal 2023 by $33.12, or 38%, from $87.14
as of the end of fiscal 2022 to $120.26 as of the end of fiscal 2023, (ii) increased in fiscal 2024 by $22.13, or 18%, from $120.26 as of the end of fiscal 2023 to $142.39 as of the end of fiscal 2024, and (iii) decreased in fiscal 2025 by $(19.04), or 13%, from $142.39 as of the end of fiscal 2024 to $123.35 as of the end of fiscal 2025, and (iv) decreased in fiscal 2026 by $(44.11), or 36%, from $123.35 as of the end of fiscal 2025 to $79.24 as of the end of fiscal 2026. Our net income (i) increased in fiscal 2023 by $147,611, or 14%, from $1,090,130 in fiscal 2022 to $1,237,741 in fiscal 2023, (ii) increased in fiscal 2024 by $125,279, or 10%, from $1,237,741 in fiscal 2023 to $1,363,020 in fiscal 2024, and (iii) increased in fiscal 2025 by $189,429, or 14%, from $1,363,020 in fiscal 2024 to $1,552,449 in fiscal 2025, and (iv) decreased in fiscal 2026 by $(68,179), or (4%), from $1,552,449 in fiscal 2025 to $1,484,270 in fiscal 2026. Our operating income (i) increased in fiscal 2023 by $111,572, or 8%, from $1,374,997 in fiscal 2022 to $1,486,569 in fiscal 2023, (ii) increased in fiscal 2024 by $85,454, or 6%, from $1,486,569 in fiscal 2023 to $1,572,023 in fiscal 2024, and (iii) increased in fiscal 2025 by $124,691, or 8%, from $1,572,023 in fiscal 2024 to $1,696,714 in fiscal 2025, and (iv) decreased in fiscal 2026 by $(44,124), or (3%), from $1,696,714 in fiscal 2025 to $1,652,590 in fiscal 2026. 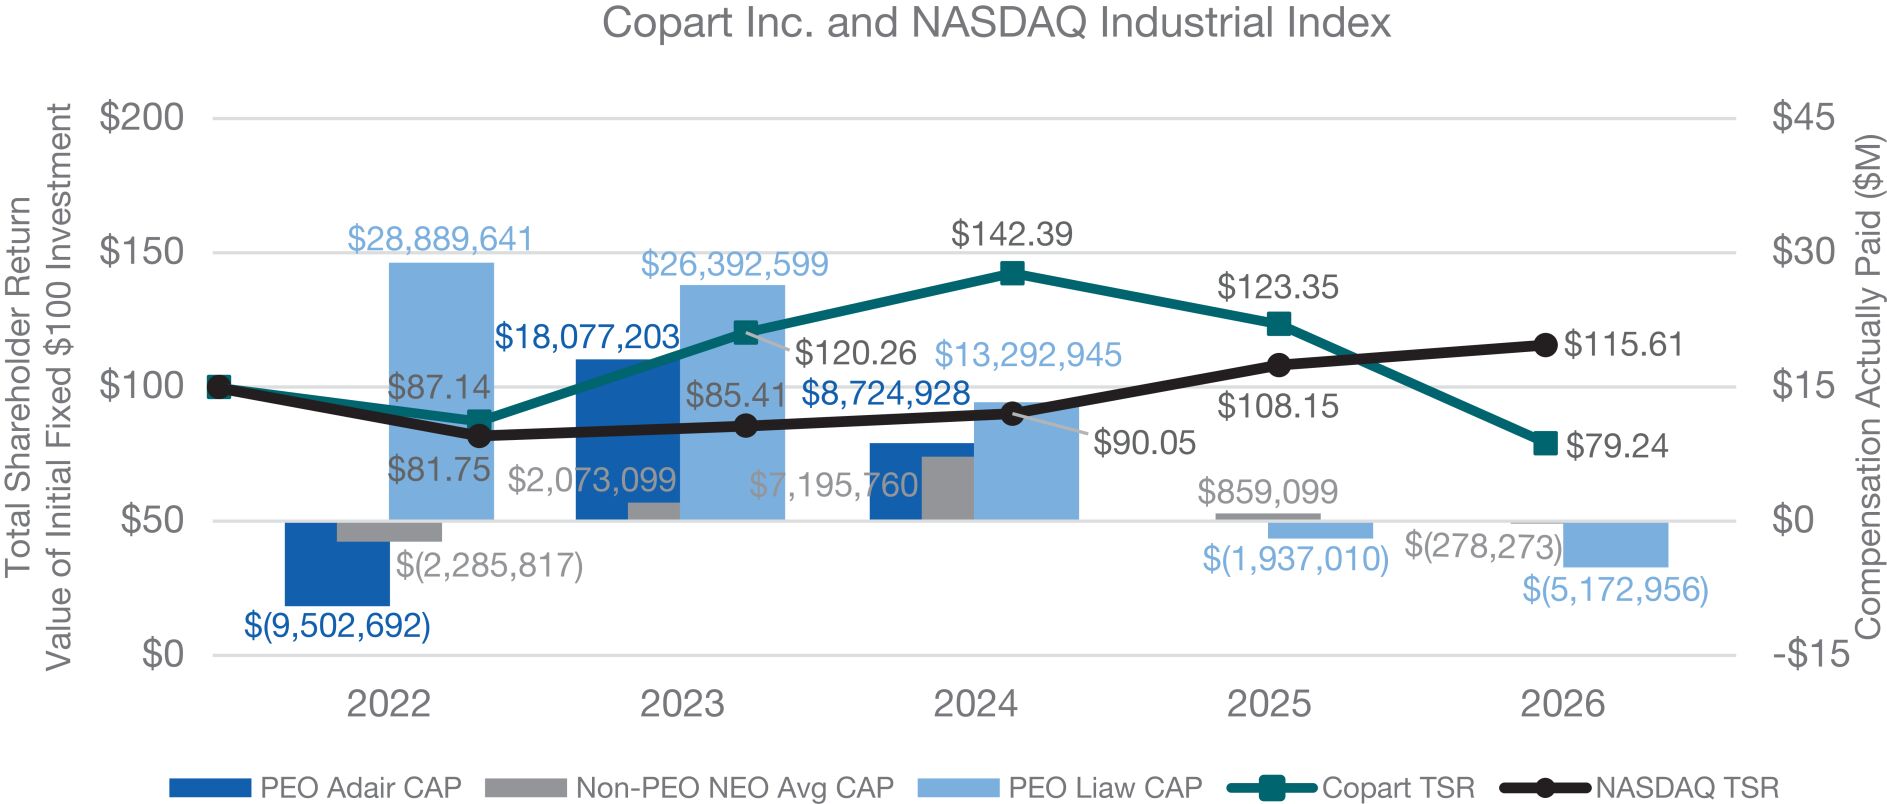
Copart TSR compared to NASDAQ Industrial Index
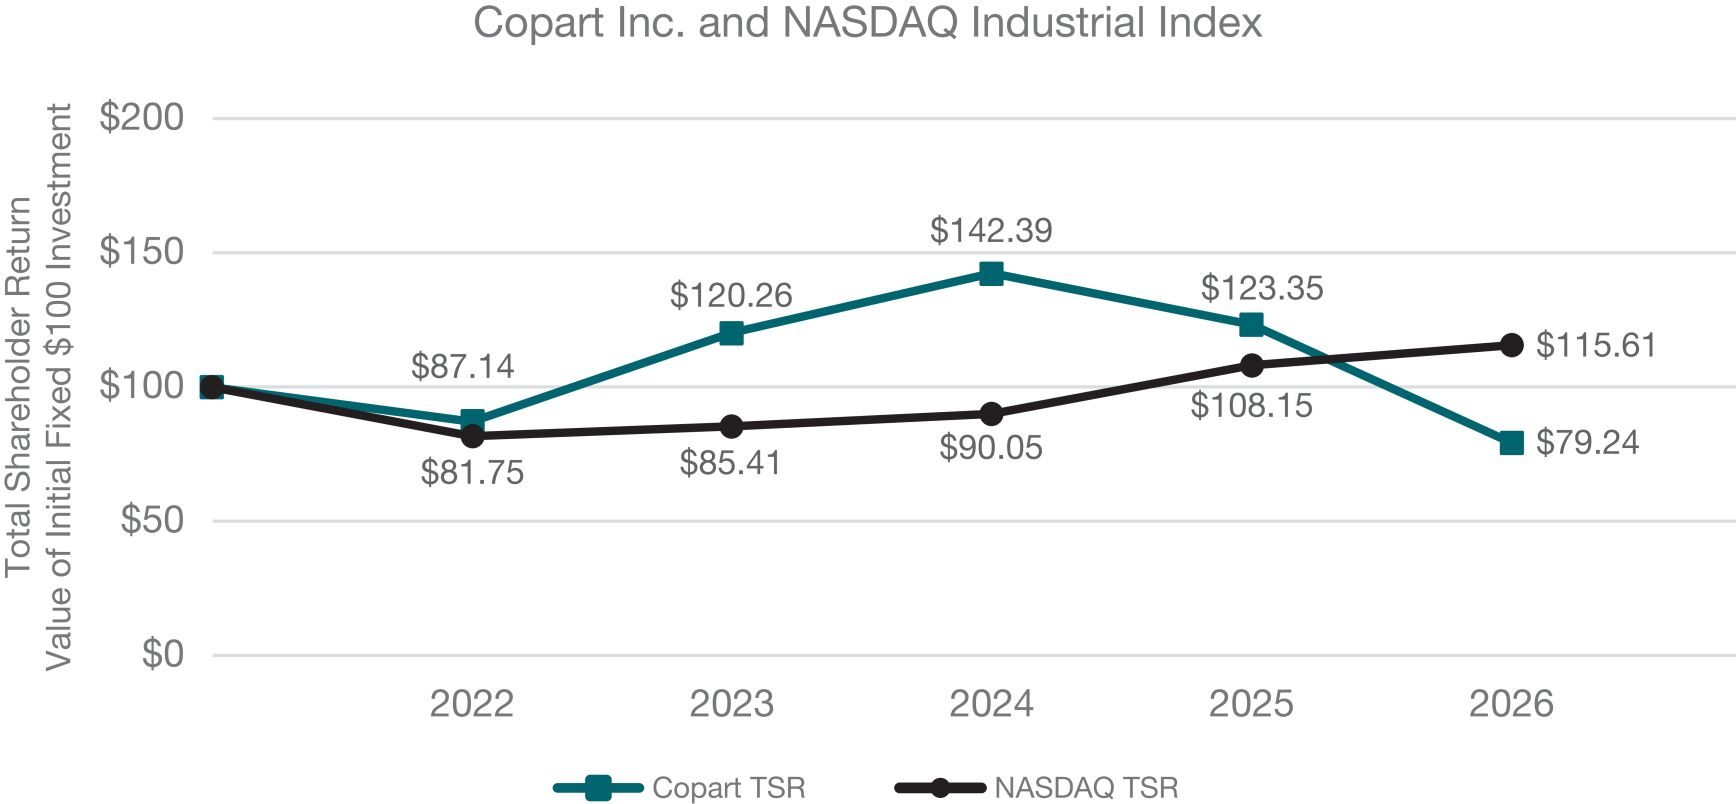
Our cumulative TSR of $79.24 for the five-year period ending July 31, 2026 was lower than our peer group TSR of $115.61 for the same period. As noted above, Our cumulative TSR (i) increased in fiscal 2023 by $33.12, or 38%, from $87.14 as of the end of fiscal 2022 to $120.26 as of the end of fiscal 2023, (ii) increased in fiscal 2024 by $22.13, or 18%, from $120.26 as of the end of fiscal 2023 to $142.39 as of the end of fiscal 2024, and (iii) decreased in fiscal 2025 by $(19.04), or 13%, from $142.39 as of the end of fiscal 2024 to $123.35 as of the end of fiscal 2025, and (iv) decreased in fiscal 2026 by $(44.11), or 36%, from $123.35 as of the end of fiscal 2025 to $79.24 as of the end of fiscal 2026. Our peer group’s cumulative TSR (i) increased in fiscal 2023 by $3.66, or 4%, from $81.75 as of the end of fiscal 2022 to $85.41 as of the end of fiscal 2023, (ii) increased in fiscal 2024 by $4.64, or 5%, from $85.41 as of the end of fiscal 2023 to $90.05 as of the end of fiscal 2024, (iii) increased in fiscal 2025 by $18.10, or 20%, from $90.05 as of the end of fiscal 2024 to $108.15 as of the end of fiscal 2025, and (iv) increased in fiscal 2026 by $7.46, or 7%, from $108.15 as of the end of fiscal 2025 to $115.61 as of the end of fiscal 2026.
2026 financial performance measures.
The financial performance measures listed below represent an unranked list of the “most important” financial performance measures linking compensation actually paid to the named executive officers for fiscal 2026 and Company performance. We do not consider any one of the following financial performance measures to be the most important measure for the Company or its executive compensation program.
| • | Net Income |
| • | Operating Income |
| • | Stock Price |