
Third Quarter 2026 Conference Call

Safe Harbor 2 This presentation contains “forward-looking statements” within the meaning of Section 27A of the Securities Act of 1933, as amended, and Section 21E of the Securities Exchange Act of 1934, as amended. These forward-looking statements reflect the current views of First Western Financial, Inc.’s (“First Western”) management with respect to, among other things, future events and First Western’s financial performance. These statements are often, but not always, made through the use of words or phrases such as “may,” “should,” “could,” “predict,” “potential,” “believe,” “will likely result,” “expect,” “continue,” “will,” “anticipate,” “seek,” “estimate,” “intend,” “plan,” “position,” “project,” “future” “forecast,” “goal,” “target,” “would” and “outlook,” or the negative variations of those words or other comparable words of a future or forward-looking nature. These forward-looking statements are not historical facts, and are based on current expectations, estimates and projections about First Western’s industry, management’s beliefs and certain assumptions made by management, many of which, by their nature, are inherently uncertain and beyond First Western’s control. Accordingly, First Western cautions you that any such forward-looking statements are not guarantees of future performance and are subject to risks, assumptions and uncertainties that are difficult to predict. Although First Western believes that the expectations reflected in these forward-looking statements are reasonable as of the date made, actual results may prove to be materially different from the results expressed or implied by the forward-looking statements. The following risks and uncertainties, among others, could cause actual results and future events to differ materially from those set forth or contemplated in the forward-looking statements: the risk of geographic concentration in Colorado, Arizona, Wyoming, California, and Montana; the risk of changes in the economy affecting real estate values and liquidity; the risk in our ability to continue to originate residential real estate loans and sell such loans; risks specific to commercial loans and borrowers; the risk of claims and litigation pertaining to our fiduciary responsibilities; the risk of changes in interest rates could reduce our net interest margins and Net interest income; increased credit risk, including as a result of deterioration in economic conditions, could require us to increase our allowance for credit losses and could have a material adverse effect on our results of operations and financial condition; the risk in our ability to maintain a strong core deposit base or other low-cost funding sources. Additional information regarding these and other risks and uncertainties to which our business and future financial performance are subject is contained in our Annual Report on Form 10-K filed with the U.S. Securities and Exchange Commission (“SEC”) on February 27, 2026 and other documents we file with the SEC from time to time. All subsequent written and oral forward-looking statements attributable to First Western or persons acting on First Western’s behalf are expressly qualified in their entirety by this paragraph. Forward-looking statements speak only as of the date of this presentation. First Western undertakes no obligation to publicly update or otherwise revise any forward-looking statements, whether as a result of new information, future events or otherwise (except as required by law). This presentation contains certain non-GAAP financial measures intended to supplement, not substitute for, comparable GAAP measures. Reconciliations of non-GAAP financial measures to GAAP financial measures are provided at the end of this presentation. Numbers in the presentation may not sum due to rounding. Our common stock is not a deposit or savings account. Our common stock is not insured by the Federal Deposit Insurance Corporation or any governmental agency or instrumentality. Except as otherwise indicated, this presentation speaks as of the date hereof. The delivery of this presentation shall not, under any circumstances, create any implication that there has been no change in the affairs of the Company after the date hereof.
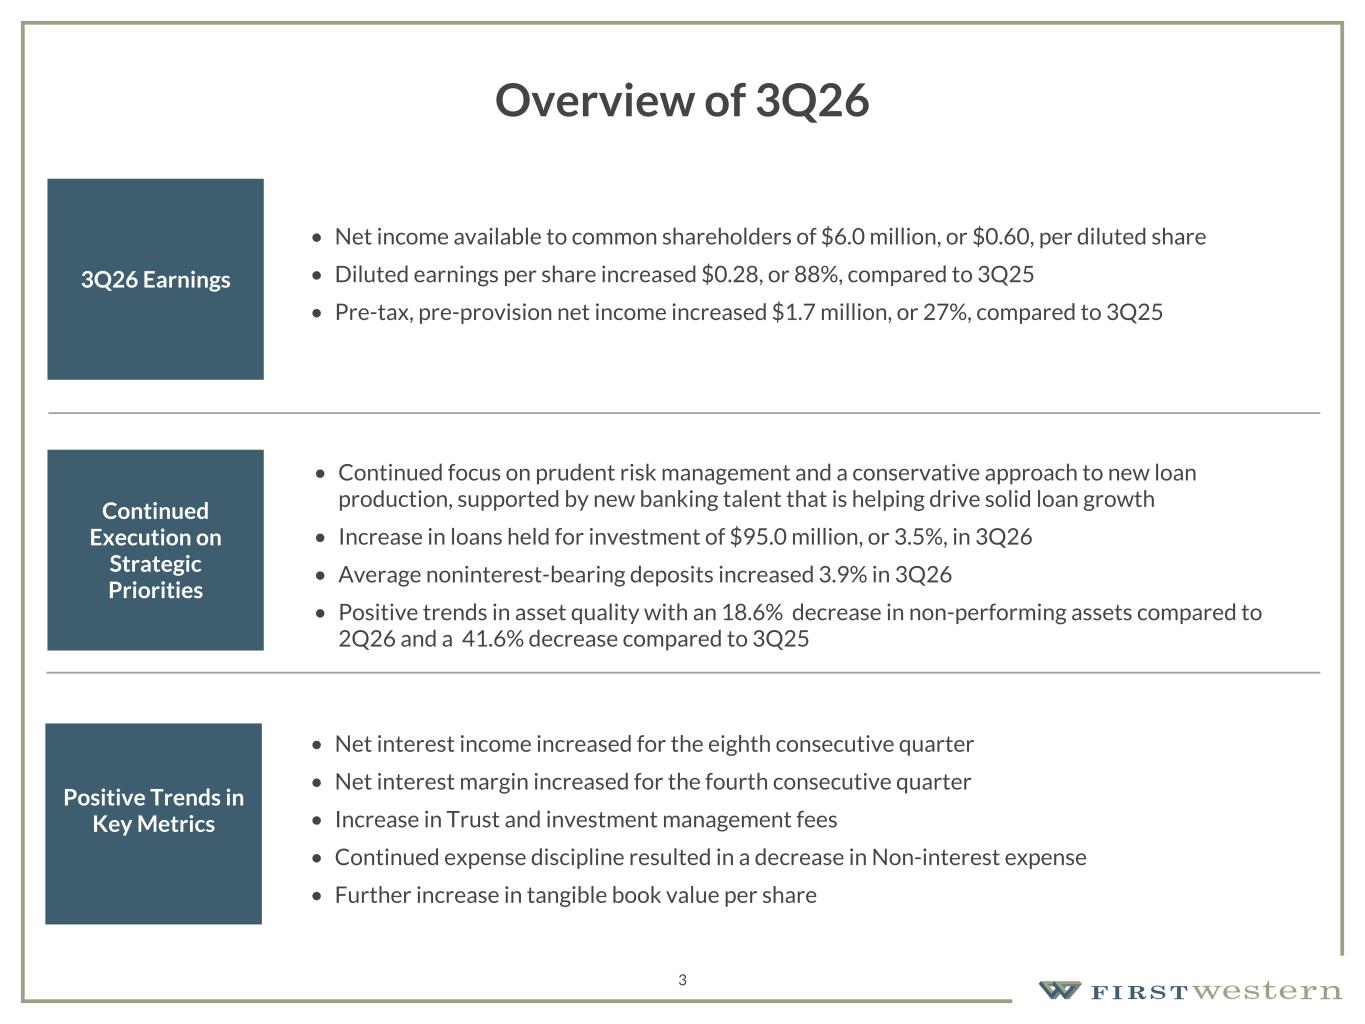
157 180 196 164 166 168 62 94 111 154 161 132 122 125 129 76 78 86 255 255 255 Chart color Table color Special Headlines Slide Headlines / Text on light background Primary Colors Secondary Colors Primary Background / Call Out Boxes / Text on dark background Chart color Table Color Tertiary Colors Chart color Table Color Chart Color Chart Color Approved Fonts AaBbCc 123 Lora (bold) Slide Headlines / Special Headlines AaBbCc 123 Lato(regular, bold, italics) Body Copy / Subheadings / Small Text Descriptions Overview of 3Q26 3Q26 Earnings • Net income available to common shareholders of $6.0 million, or $0.60, per diluted share • Diluted earnings per share increased $0.28, or 88%, compared to 3Q25 • Pre-tax, pre-provision net income increased $1.7 million, or 27%, compared to 3Q25 Continued Execution on Strategic Priorities • Continued focus on prudent risk management and a conservative approach to new loan production, supported by new banking talent that is helping drive solid loan growth • Increase in loans held for investment of $95.0 million, or 3.5%, in 3Q26 • Average noninterest-bearing deposits increased 3.9% in 3Q26 • Positive trends in asset quality with an 18.6% decrease in non-performing assets compared to 2Q26 and a 41.6% decrease compared to 3Q25 Positive Trends in Key Metrics • Net interest income increased for the eighth consecutive quarter • Net interest margin increased for the fourth consecutive quarter • Increase in Trust and investment management fees • Continued expense discipline resulted in a decrease in Non-interest expense • Further increase in tangible book value per share 3
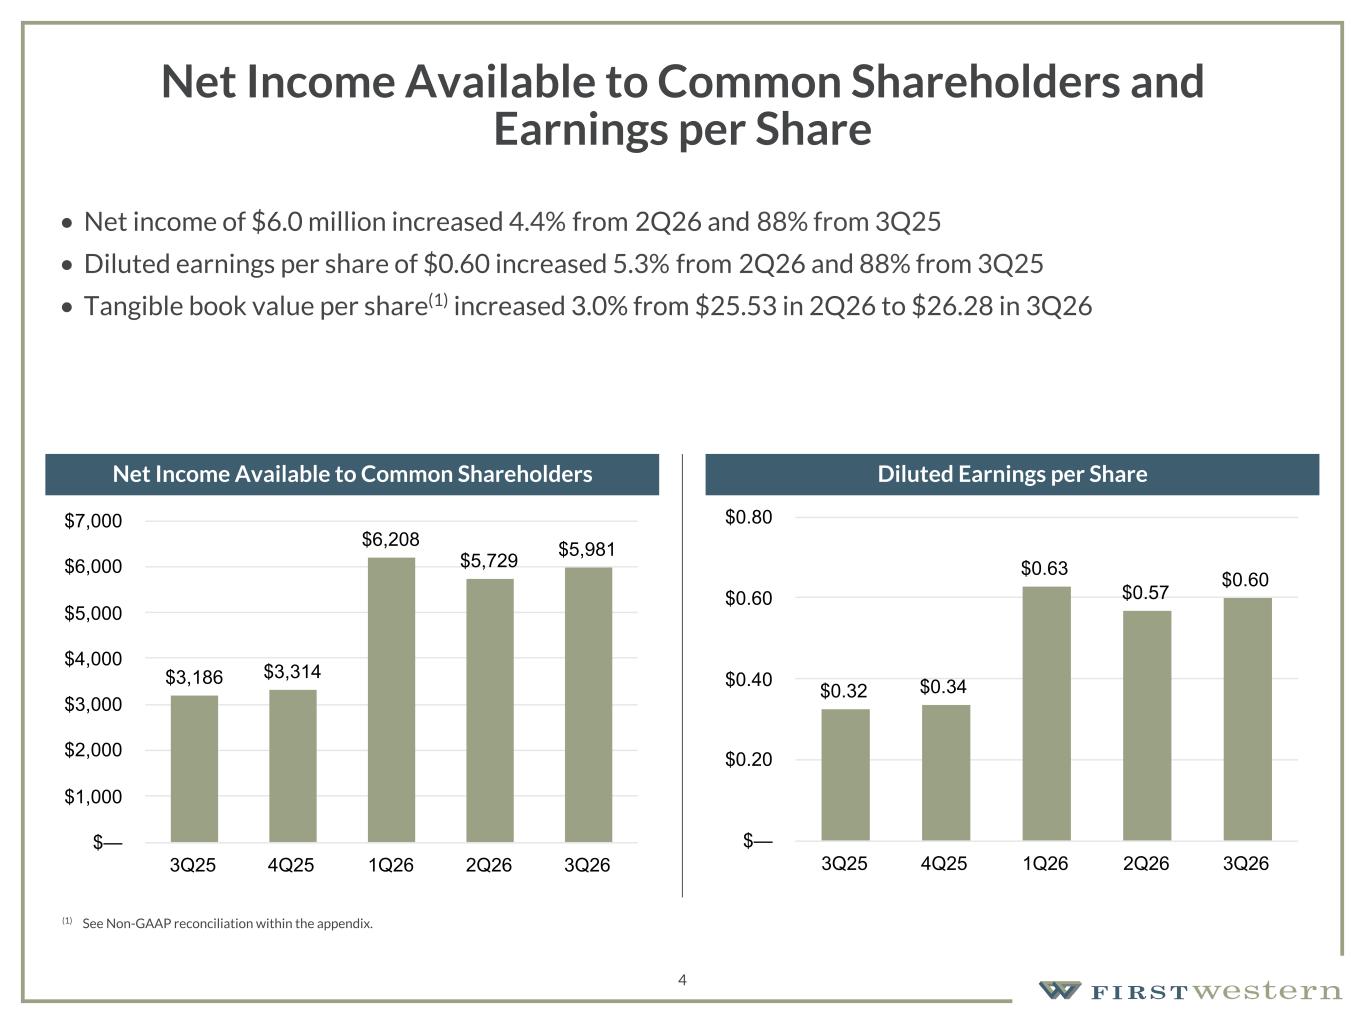
157 180 196 164 166 168 62 94 111 154 161 132 122 125 129 76 78 86 255 255 255 Chart color Table color Special Headlines Slide Headlines / Text on light background Primary Colors Secondary Colors Primary Background / Call Out Boxes / Text on dark background Chart color Table Color Tertiary Colors Chart color Table Color Chart Color Chart Color Approved Fonts AaBbCc 123 Lora (bold) Slide Headlines / Special Headlines AaBbCc 123 Lato(regular, bold, italics) Body Copy / Subheadings / Small Text Descriptions 4 Net Income Available to Common Shareholders and Earnings per Share • Net income of $6.0 million increased 4.4% from 2Q26 and 88% from 3Q25 • Diluted earnings per share of $0.60 increased 5.3% from 2Q26 and 88% from 3Q25 • Tangible book value per share(1) increased 3.0% from $25.53 in 2Q26 to $26.28 in 3Q26 Net Income Available to Common Shareholders Diluted Earnings per Share $3,186 $3,314 $6,208 $5,729 $5,981 3Q25 4Q25 1Q26 2Q26 3Q26 $— $1,000 $2,000 $3,000 $4,000 $5,000 $6,000 $7,000 $0.32 $0.34 $0.63 $0.57 $0.60 3Q25 4Q25 1Q26 2Q26 3Q26 $— $0.20 $0.40 $0.60 $0.80 (1) See Non-GAAP reconciliation within the appendix.
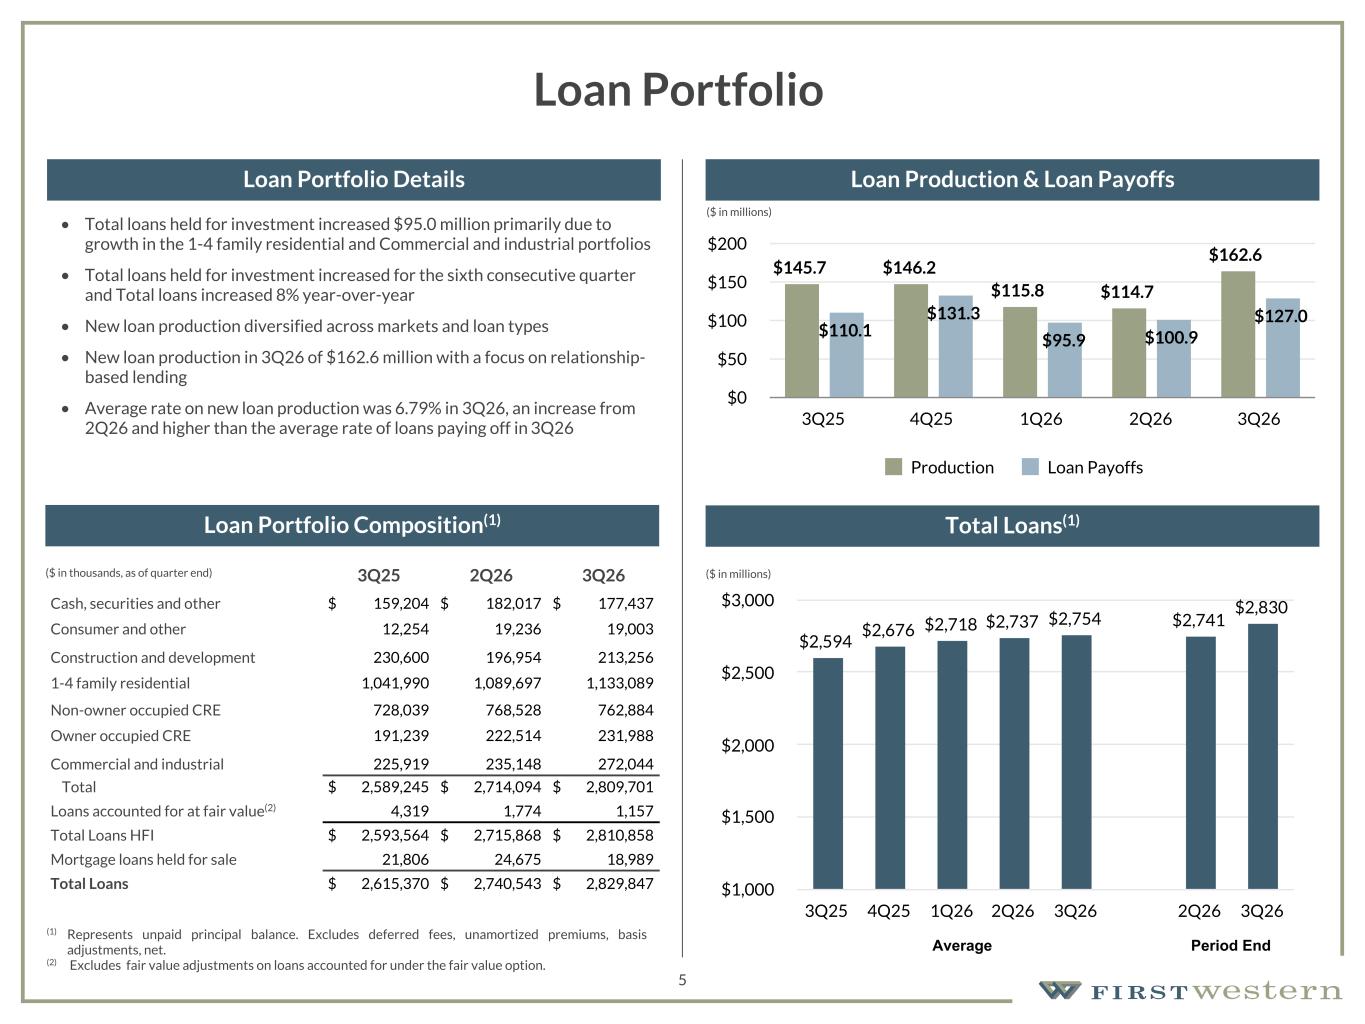
157 180 196 164 166 168 62 94 111 154 161 132 122 125 129 76 78 86 255 255 255 Chart color Table color Special Headlines Slide Headlines / Text on light background Primary Colors Secondary Colors Primary Background / Call Out Boxes / Text on dark background Chart color Table Color Tertiary Colors Chart color Table Color Chart Color Chart Color Approved Fonts AaBbCc 123 Lora (bold) Slide Headlines / Special Headlines AaBbCc 123 Lato (regular, bold, italics) Body Copy / Subheadings / Small Text Descriptions 5 Loan Portfolio • Total loans held for investment increased $95.0 million primarily due to growth in the 1-4 family residential and Commercial and industrial portfolios • Total loans held for investment increased for the sixth consecutive quarter and Total loans increased 8% year-over-year • New loan production diversified across markets and loan types • New loan production in 3Q26 of $162.6 million with a focus on relationship- based lending • Average rate on new loan production was 6.79% in 3Q26, an increase from 2Q26 and higher than the average rate of loans paying off in 3Q26 3Q25 2Q26 3Q26 Cash, securities and other $ 159,204 $ 182,017 $ 177,437 Consumer and other 12,254 19,236 19,003 Construction and development 230,600 196,954 213,256 1-4 family residential 1,041,990 1,089,697 1,133,089 Non-owner occupied CRE 728,039 768,528 762,884 Owner occupied CRE 191,239 222,514 231,988 Commercial and industrial 225,919 235,148 272,044 Total $ 2,589,245 $ 2,714,094 $ 2,809,701 Loans accounted for at fair value(2) 4,319 1,774 1,157 Total Loans HFI $ 2,593,564 $ 2,715,868 $ 2,810,858 Mortgage loans held for sale 21,806 24,675 18,989 Total Loans $ 2,615,370 $ 2,740,543 $ 2,829,847 (1) Represents unpaid principal balance. Excludes deferred fees, unamortized premiums, basis adjustments, net. (2) Excludes fair value adjustments on loans accounted for under the fair value option. ($ in thousands, as of quarter end) Loan Portfolio Composition(1) Loan Portfolio Details Loan Production & Loan Payoffs Total Loans(1) $2,594 $2,676 $2,718 $2,737 $2,754 $2,741 $2,830 3Q25 4Q25 1Q26 2Q26 3Q26 2Q26 3Q26 $1,000 $1,500 $2,000 $2,500 $3,000 Average Period End $145.7 $146.2 $115.8 $114.7 $162.6 $110.1 $131.3 $95.9 $100.9 $127.0 Production Loan Payoffs 3Q25 4Q25 1Q26 2Q26 3Q26 $0 $50 $100 $150 $200 ($ in millions) ($ in millions)
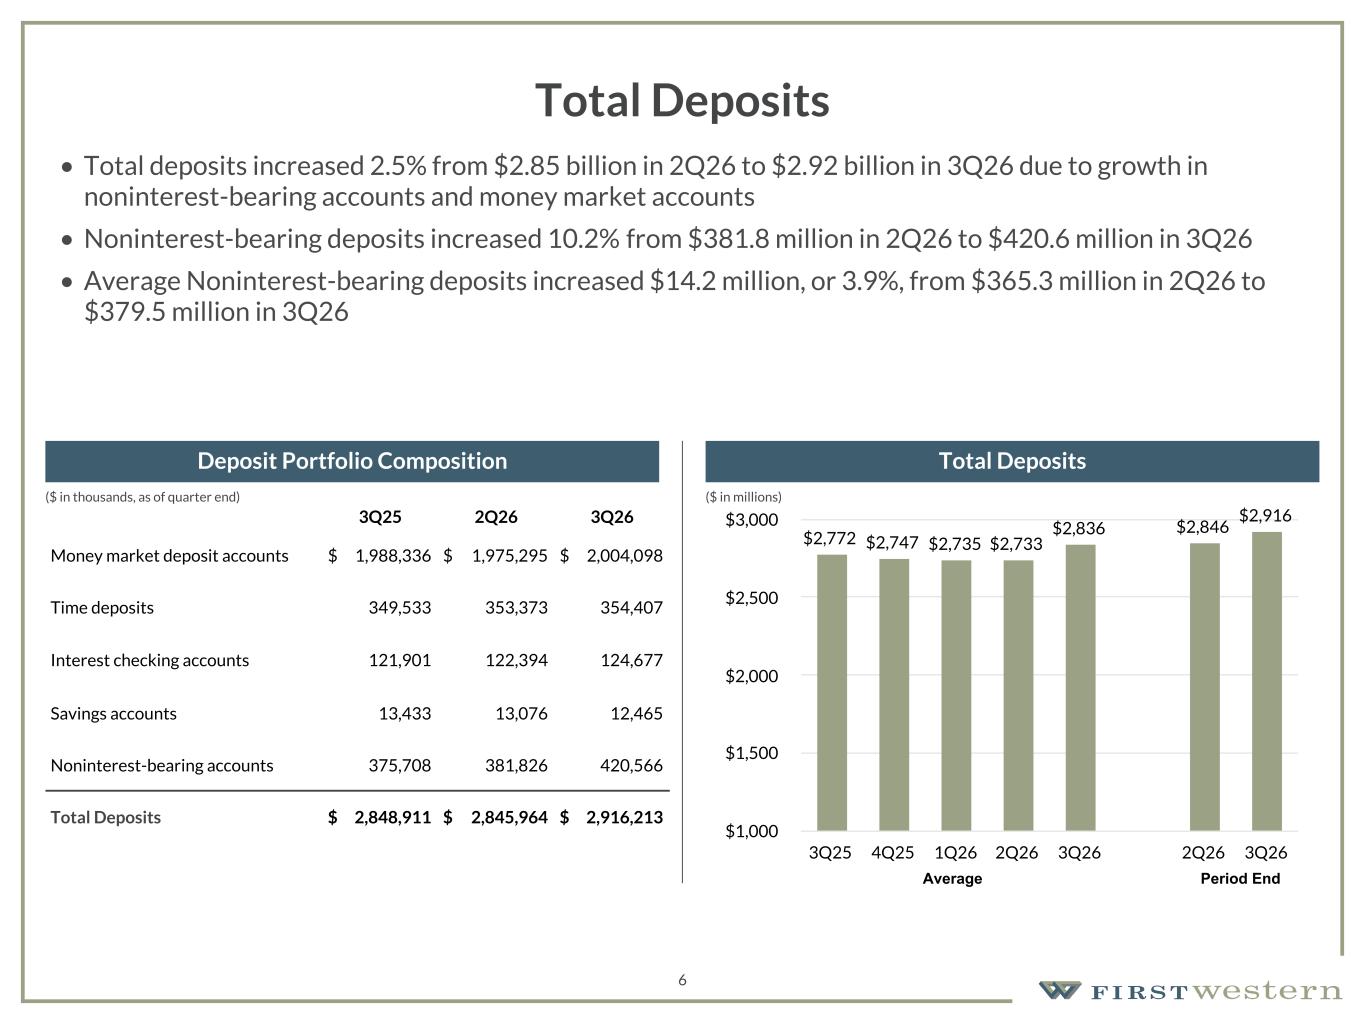
157 180 196 164 166 168 62 94 111 154 161 132 122 125 129 76 78 86 255 255 255 Chart color Table color Special Headlines Slide Headlines / Text on light background Primary Colors Secondary Colors Primary Background / Call Out Boxes / Text on dark background Chart color Table Color Tertiary Colors Chart color Table Color Chart Color Chart Color Approved Fonts AaBbCc 123 Lora (bold) Slide Headlines / Special Headlines AaBbCc 123 Lato (regular, bold, italics) Body Copy / Subheadings / Small Text Descriptions 6 Total Deposits • Total deposits increased 2.5% from $2.85 billion in 2Q26 to $2.92 billion in 3Q26 due to growth in noninterest-bearing accounts and money market accounts • Noninterest-bearing deposits increased 10.2% from $381.8 million in 2Q26 to $420.6 million in 3Q26 • Average Noninterest-bearing deposits increased $14.2 million, or 3.9%, from $365.3 million in 2Q26 to $379.5 million in 3Q26 3Q25 2Q26 3Q26 Money market deposit accounts $ 1,988,336 $ 1,975,295 $ 2,004,098 Time deposits 349,533 353,373 354,407 Interest checking accounts 121,901 122,394 124,677 Savings accounts 13,433 13,076 12,465 Noninterest-bearing accounts 375,708 381,826 420,566 Total Deposits $ 2,848,911 $ 2,845,964 $ 2,916,213 Deposit Portfolio Composition Total Deposits $2,772 $2,747 $2,735 $2,733 $2,836 $2,846 $2,916 3Q25 4Q25 1Q26 2Q26 3Q26 2Q26 3Q26 $1,000 $1,500 $2,000 $2,500 $3,000 Average Period End ($ in millions)($ in thousands, as of quarter end)
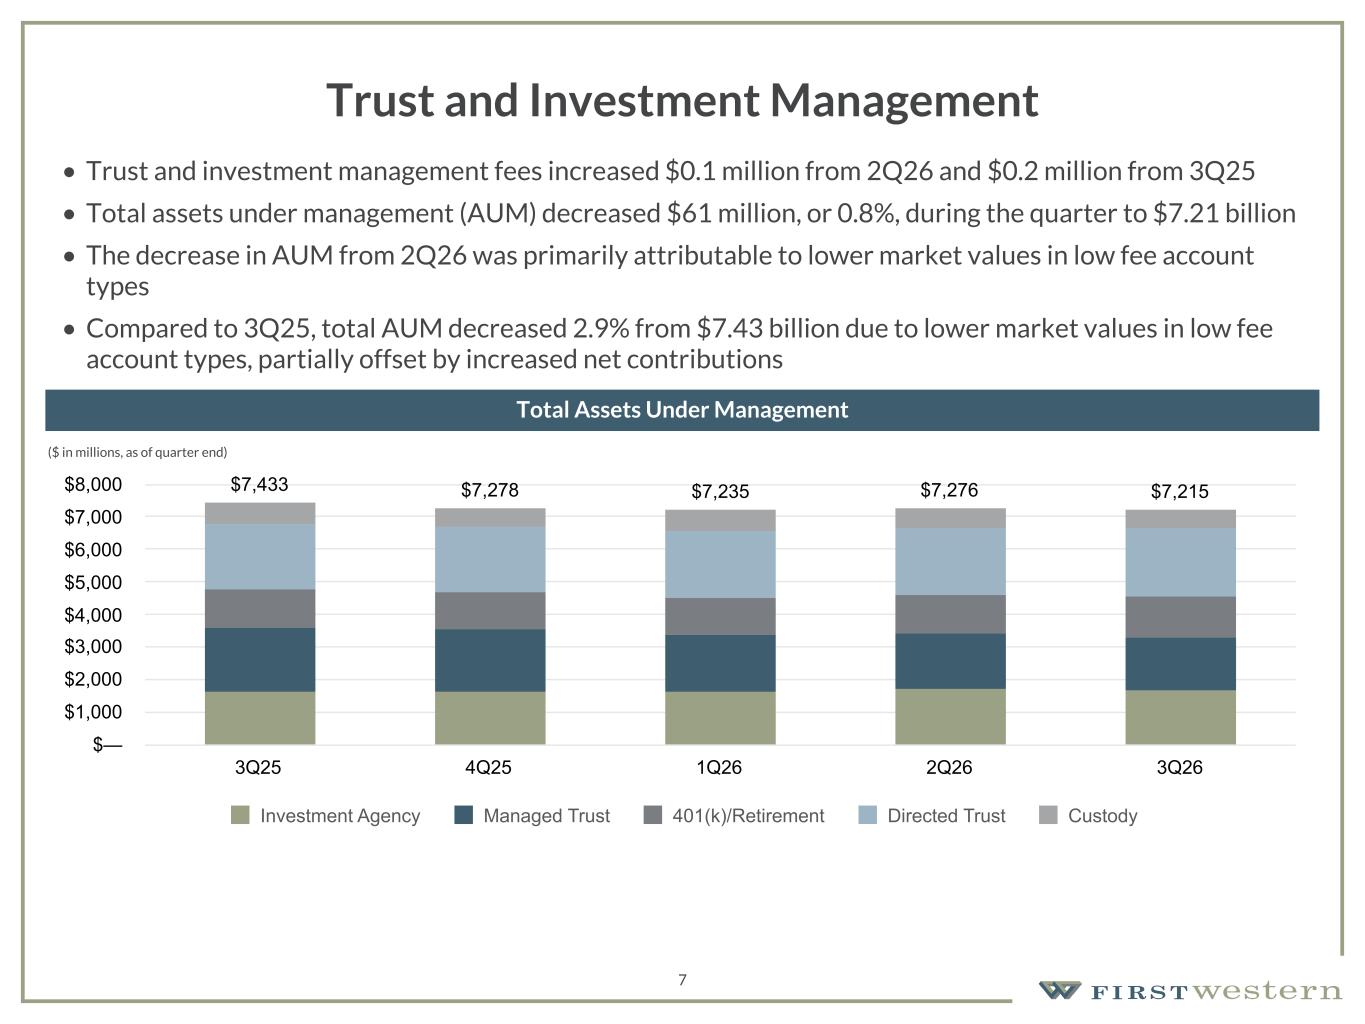
157 180 196 164 166 168 62 94 111 154 161 132 122 125 129 76 78 86 255 255 255 Chart color Table color Special Headlines Slide Headlines / Text on light background Primary Colors Secondary Colors Primary Background / Call Out Boxes / Text on dark background Chart color Table Color Tertiary Colors Chart color Table Color Chart Color Chart Color Approved Fonts AaBbCc 123 Lora (bold) Slide Headlines / Special Headlines AaBbCc 123 Lato (regular, bold, italics) Body Copy / Subheadings / Small Text Descriptions 7 Trust and Investment Management • Trust and investment management fees increased $0.1 million from 2Q26 and $0.2 million from 3Q25 • Total assets under management (AUM) decreased $61 million, or 0.8%, during the quarter to $7.21 billion • The decrease in AUM from 2Q26 was primarily attributable to lower market values in low fee account types • Compared to 3Q25, total AUM decreased 2.9% from $7.43 billion due to lower market values in low fee account types, partially offset by increased net contributions • ($ in millions, as of quarter end) Total Assets Under Management $7,433 $7,278 $7,235 $7,276 $7,215 Investment Agency Managed Trust 401(k)/Retirement Directed Trust Custody 3Q25 4Q25 1Q26 2Q26 3Q26 $— $1,000 $2,000 $3,000 $4,000 $5,000 $6,000 $7,000 $8,000
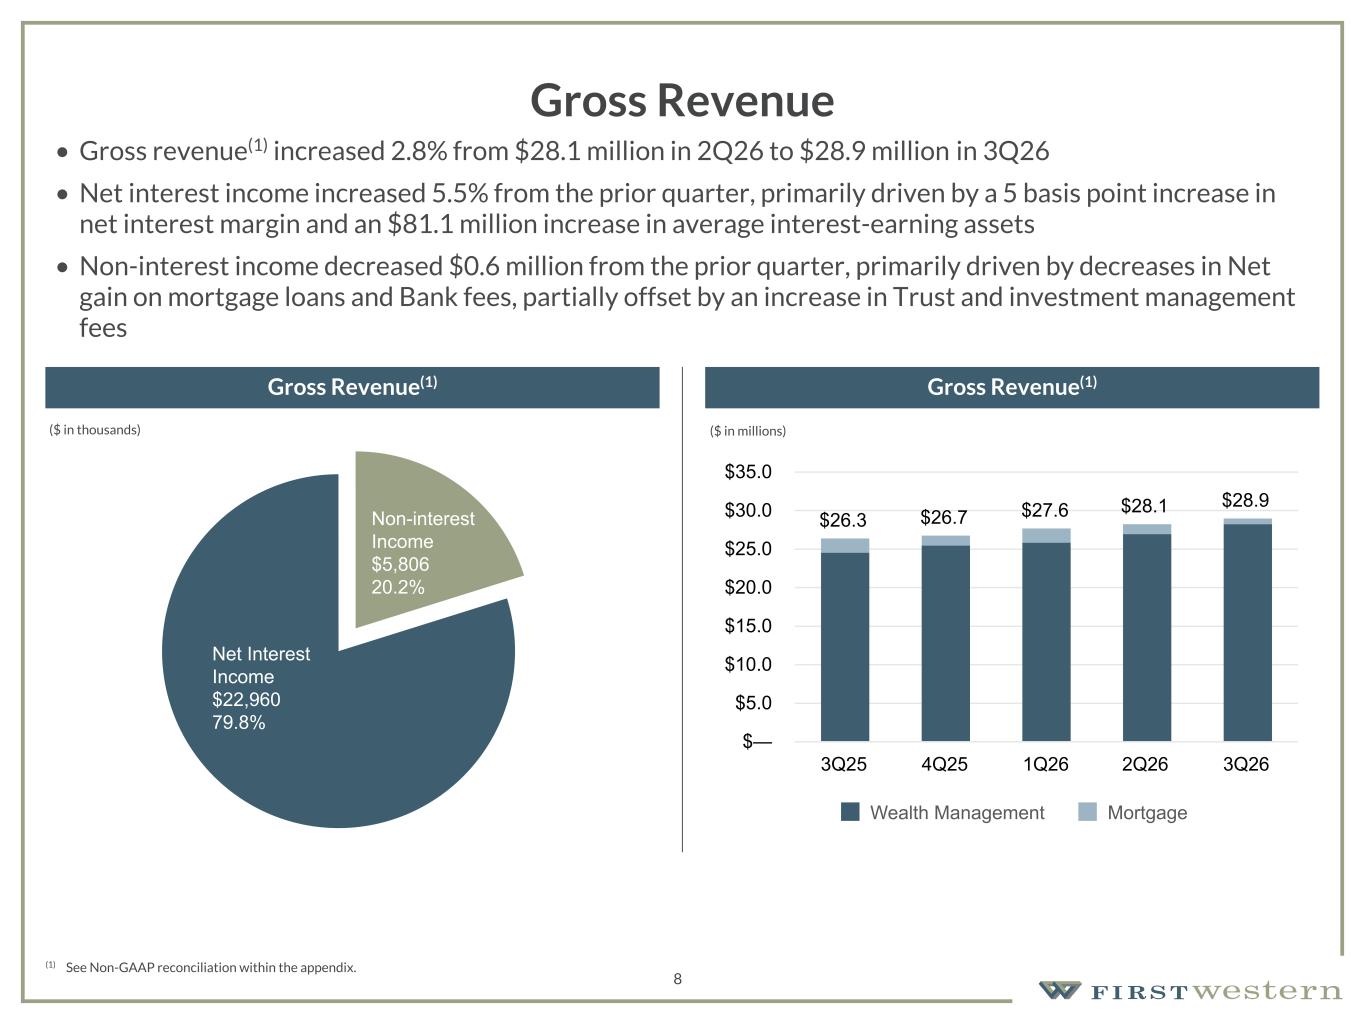
157 180 196 164 166 168 62 94 111 154 161 132 122 125 129 76 78 86 255 255 255 Chart color Table color Special Headlines Slide Headlines / Text on light background Primary Colors Secondary Colors Primary Background / Call Out Boxes / Text on dark background Chart color Table Color Tertiary Colors Chart color Table Color Chart Color Chart Color Approved Fonts AaBbCc 123 Lora (bold) Slide Headlines / Special Headlines AaBbCc 123 Lato (regular, bold, italics) Body Copy / Subheadings / Small Text Descriptions (1) See Non-GAAP reconciliation within the appendix. Gross Revenue Gross Revenue(1) Gross Revenue(1) 8 $26.3 $26.7 $27.6 $28.1 $28.9 Wealth Management Mortgage 3Q25 4Q25 1Q26 2Q26 3Q26 $— $5.0 $10.0 $15.0 $20.0 $25.0 $30.0 $35.0 • Gross revenue(1) increased 2.8% from $28.1 million in 2Q26 to $28.9 million in 3Q26 • Net interest income increased 5.5% from the prior quarter, primarily driven by a 5 basis point increase in net interest margin and an $81.1 million increase in average interest-earning assets • Non-interest income decreased $0.6 million from the prior quarter, primarily driven by decreases in Net gain on mortgage loans and Bank fees, partially offset by an increase in Trust and investment management fees Non-interest Income $5,806 20.2% Net Interest Income $22,960 79.8% ($ in thousands) ($ in millions)
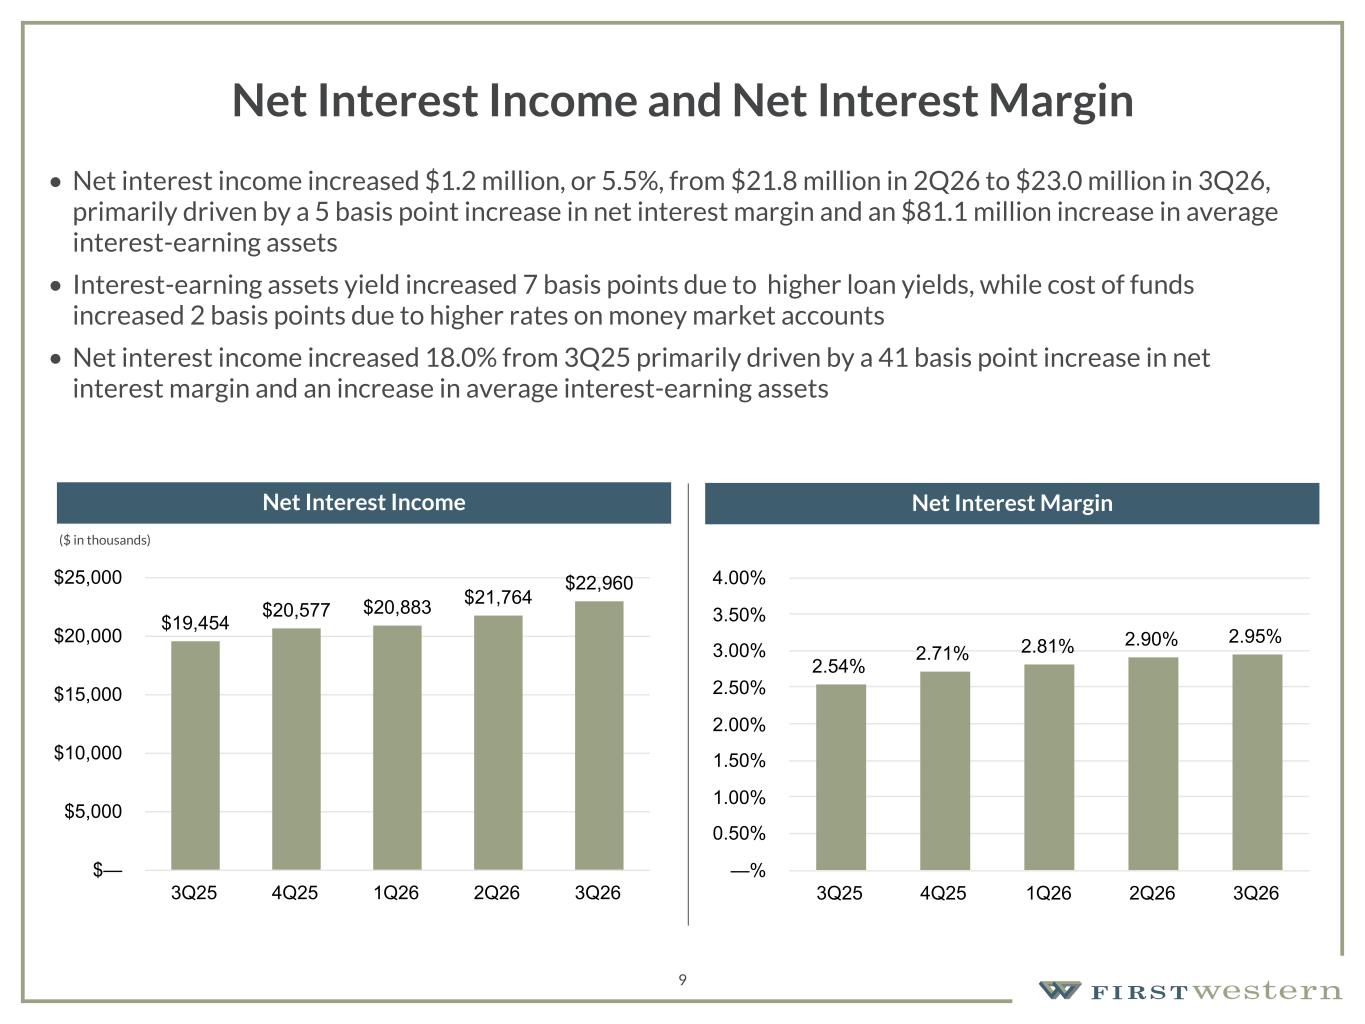
157 180 196 164 166 168 62 94 111 154 161 132 122 125 129 76 78 86 255 255 255 Chart color Table color Special Headlines Slide Headlines / Text on light background Primary Colors Secondary Colors Primary Background / Call Out Boxes / Text on dark background Chart color Table Color Tertiary Colors Chart color Table Color Chart Color Chart Color Approved Fonts AaBbCc 123 Lora (bold) Slide Headlines / Special Headlines AaBbCc 123 Lato (regular, bold, italics) Body Copy / Subheadings / Small Text Descriptions 9 Net Interest Income and Net Interest Margin • Net interest income increased $1.2 million, or 5.5%, from $21.8 million in 2Q26 to $23.0 million in 3Q26, primarily driven by a 5 basis point increase in net interest margin and an $81.1 million increase in average interest-earning assets • Interest-earning assets yield increased 7 basis points due to higher loan yields, while cost of funds increased 2 basis points due to higher rates on money market accounts • Net interest income increased 18.0% from 3Q25 primarily driven by a 41 basis point increase in net interest margin and an increase in average interest-earning assets Net Interest Income Net Interest Margin $19,454 $20,577 $20,883 $21,764 $22,960 3Q25 4Q25 1Q26 2Q26 3Q26 $— $5,000 $10,000 $15,000 $20,000 $25,000 2.54% 2.71% 2.81% 2.90% 2.95% 3Q25 4Q25 1Q26 2Q26 3Q26 —% 0.50% 1.00% 1.50% 2.00% 2.50% 3.00% 3.50% 4.00% ($ in thousands)
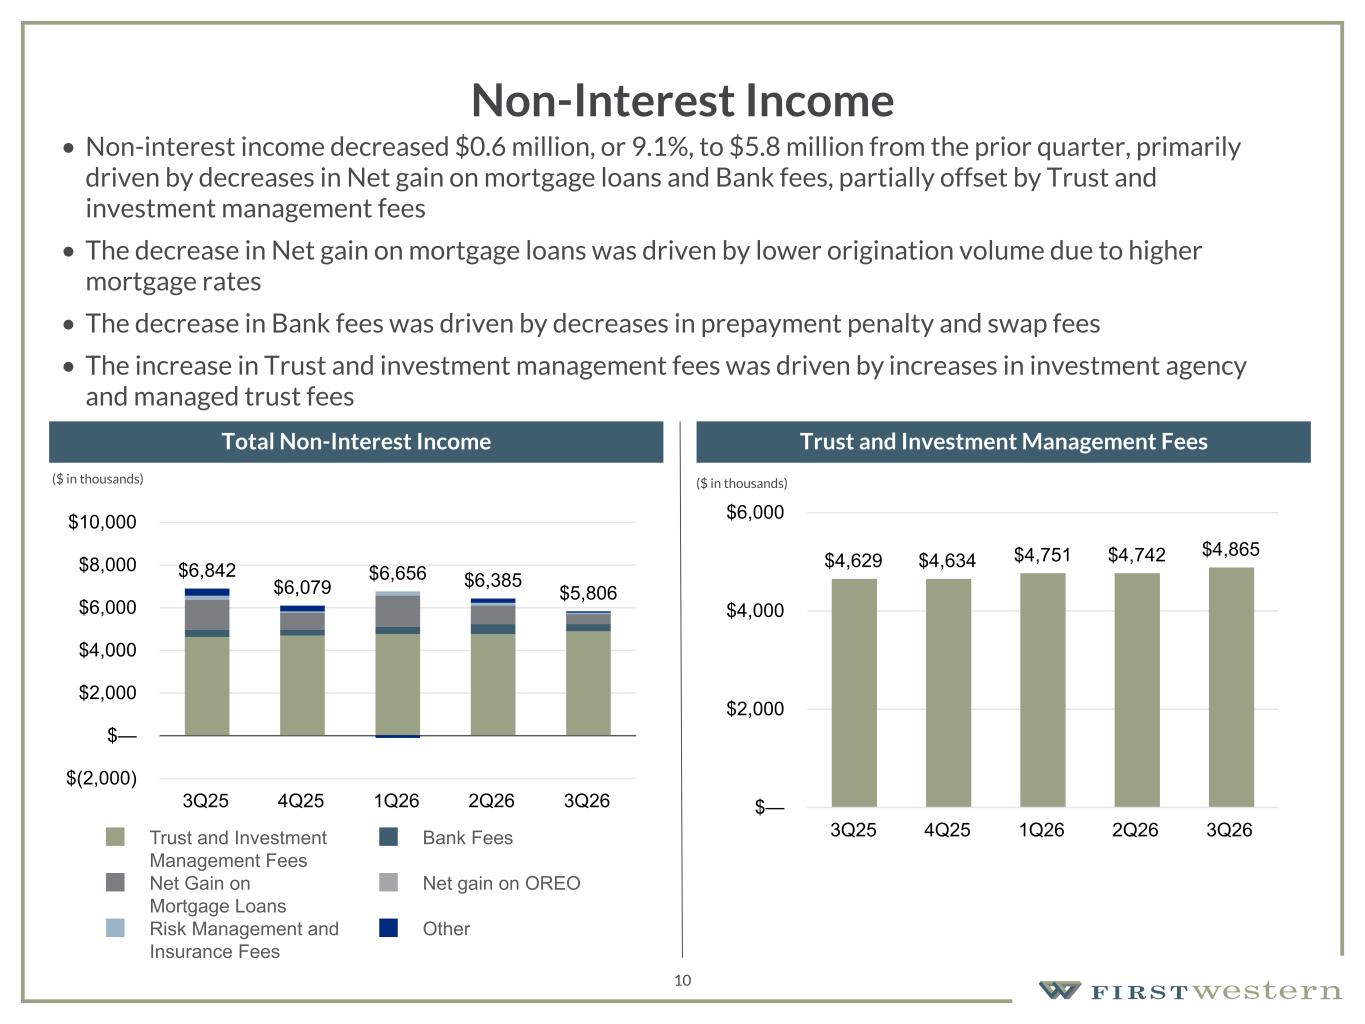
157 180 196 164 166 168 62 94 111 154 161 132 122 125 129 76 78 86 255 255 255 Chart color Table color Special Headlines Slide Headlines / Text on light background Primary Colors Secondary Colors Primary Background / Call Out Boxes / Text on dark background Chart color Table Color Tertiary Colors Chart color Table Color Chart Color Chart Color Approved Fonts AaBbCc 123 Lora (bold) Slide Headlines / Special Headlines AaBbCc 123 Lato (regular, bold, italics) Body Copy / Subheadings / Small Text Descriptions 10 Non-Interest Income • Non-interest income decreased $0.6 million, or 9.1%, to $5.8 million from the prior quarter, primarily driven by decreases in Net gain on mortgage loans and Bank fees, partially offset by Trust and investment management fees • The decrease in Net gain on mortgage loans was driven by lower origination volume due to higher mortgage rates • The decrease in Bank fees was driven by decreases in prepayment penalty and swap fees • The increase in Trust and investment management fees was driven by increases in investment agency and managed trust fees Total Non-Interest Income Trust and Investment Management Fees $6,842 $6,079 $6,656 $6,385 $5,806 Trust and Investment Management Fees Bank Fees Net Gain on Mortgage Loans Net gain on OREO Risk Management and Insurance Fees Other 3Q25 4Q25 1Q26 2Q26 3Q26 $(2,000) $— $2,000 $4,000 $6,000 $8,000 $10,000 $4,629 $4,634 $4,751 $4,742 $4,865 3Q25 4Q25 1Q26 2Q26 3Q26 $— $2,000 $4,000 $6,000 ($ in thousands) ($ in thousands)
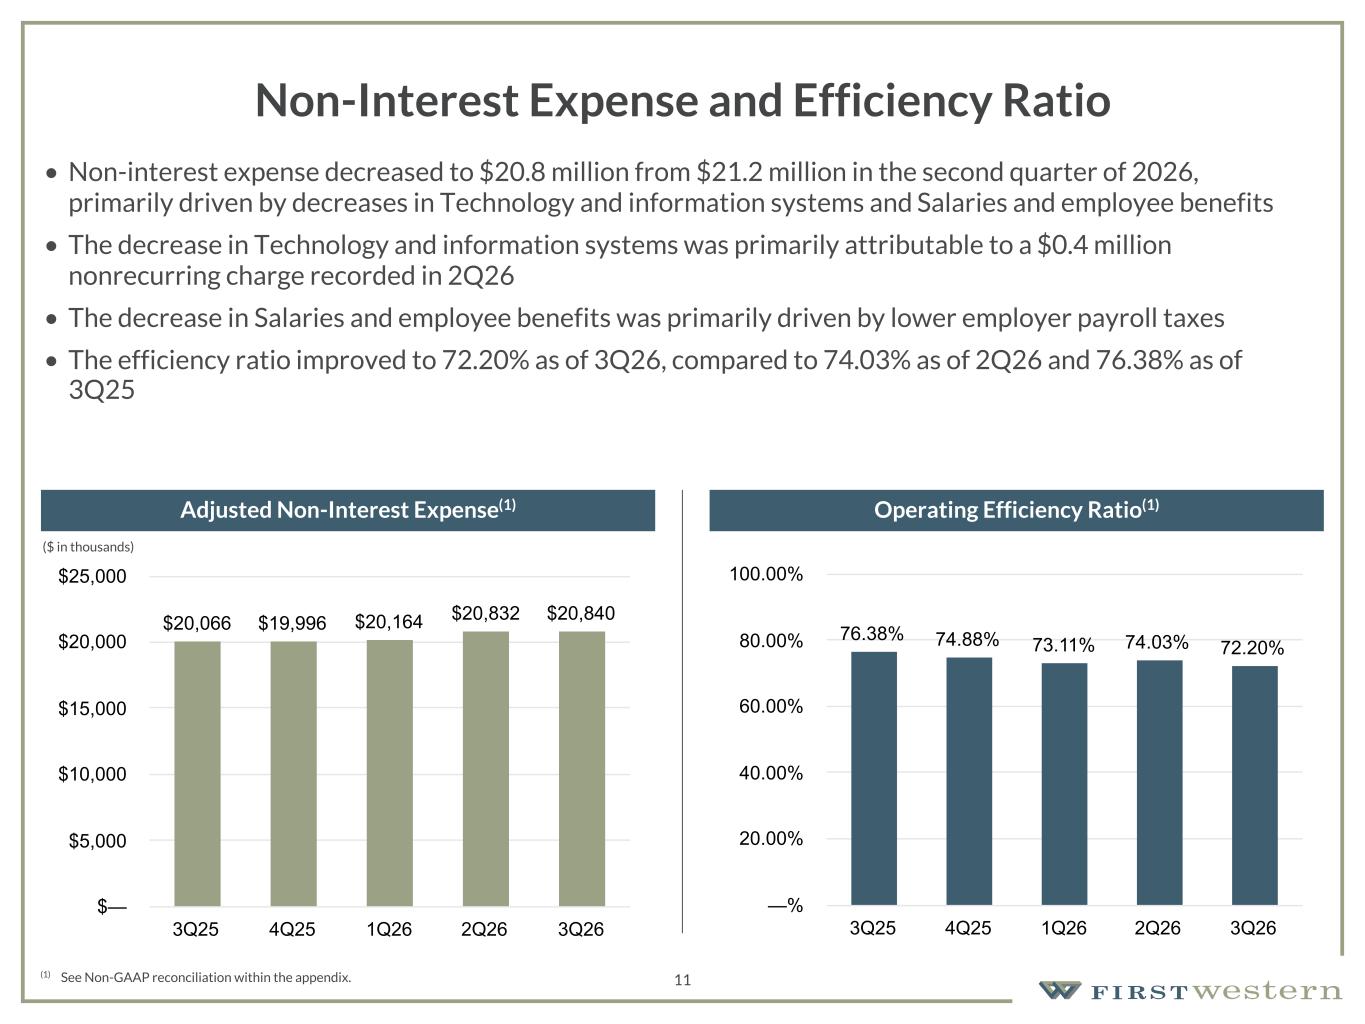
157 180 196 164 166 168 62 94 111 154 161 132 122 125 129 76 78 86 255 255 255 Chart color Table color Special Headlines Slide Headlines / Text on light background Primary Colors Secondary Colors Primary Background / Call Out Boxes / Text on dark background Chart color Table Color Tertiary Colors Chart color Table Color Chart Color Chart Color Approved Fonts AaBbCc 123 Lora (bold) Slide Headlines / Special Headlines AaBbCc 123 Lato (regular, bold, italics) Body Copy / Subheadings / Small Text Descriptions 11 Non-Interest Expense and Efficiency Ratio • Non-interest expense decreased to $20.8 million from $21.2 million in the second quarter of 2026, primarily driven by decreases in Technology and information systems and Salaries and employee benefits • The decrease in Technology and information systems was primarily attributable to a $0.4 million nonrecurring charge recorded in 2Q26 • The decrease in Salaries and employee benefits was primarily driven by lower employer payroll taxes • The efficiency ratio improved to 72.20% as of 3Q26, compared to 74.03% as of 2Q26 and 76.38% as of 3Q25 (1) See Non-GAAP reconciliation within the appendix. Adjusted Non-Interest Expense(1) Operating Efficiency Ratio(1) (1) (1) (1) $20,066 $19,996 $20,164 $20,832 $20,840 3Q25 4Q25 1Q26 2Q26 3Q26 $— $5,000 $10,000 $15,000 $20,000 $25,000 76.38% 74.88% 73.11% 74.03% 72.20% 3Q25 4Q25 1Q26 2Q26 3Q26 —% 20.00% 40.00% 60.00% 80.00% 100.00% ($ in thousands)
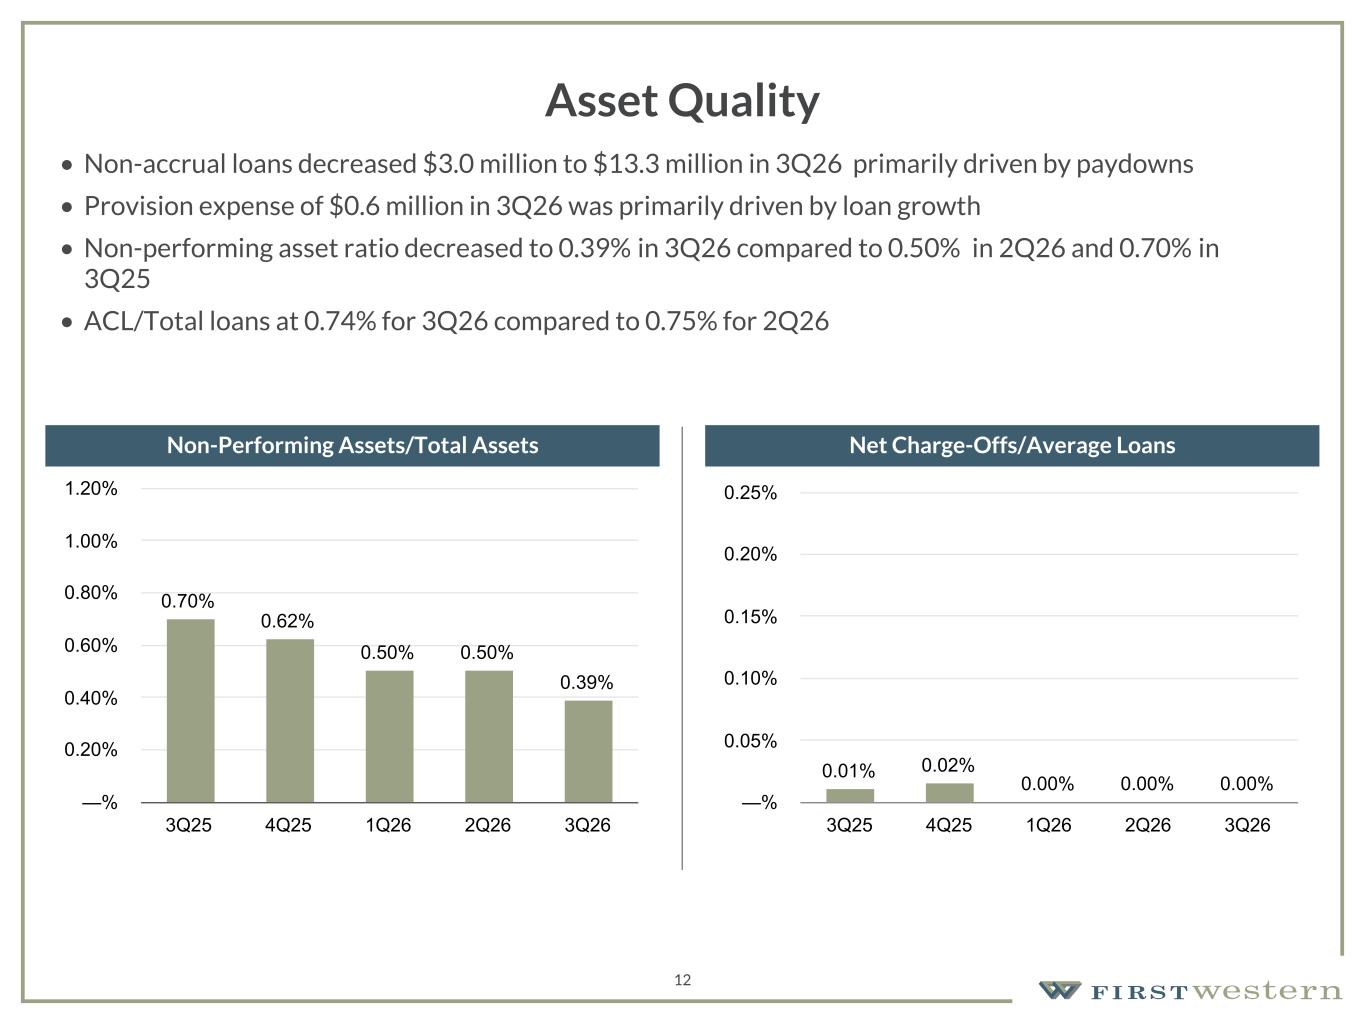
157 180 196 164 166 168 62 94 111 154 161 132 122 125 129 76 78 86 255 255 255 Chart color Table color Special Headlines Slide Headlines / Text on light background Primary Colors Secondary Colors Primary Background / Call Out Boxes / Text on dark background Chart color Table Color Tertiary Colors Chart color Table Color Chart Color Chart Color Approved Fonts AaBbCc 123 Lora (bold) Slide Headlines / Special Headlines AaBbCc 123 Lato (regular, bold, italics) Body Copy / Subheadings / Small Text Descriptions 12 Asset Quality • Non-accrual loans decreased $3.0 million to $13.3 million in 3Q26 primarily driven by paydowns • Provision expense of $0.6 million in 3Q26 was primarily driven by loan growth • Non-performing asset ratio decreased to 0.39% in 3Q26 compared to 0.50% in 2Q26 and 0.70% in 3Q25 • ACL/Total loans at 0.74% for 3Q26 compared to 0.75% for 2Q26 Non-Performing Assets/Total Assets Net Charge-Offs/Average Loans 0.70% 0.62% 0.50% 0.50% 0.39% 3Q25 4Q25 1Q26 2Q26 3Q26 —% 0.20% 0.40% 0.60% 0.80% 1.00% 1.20% 0.01% 0.02% 0.00% 0.00% 0.00% 3Q25 4Q25 1Q26 2Q26 3Q26 —% 0.05% 0.10% 0.15% 0.20% 0.25%
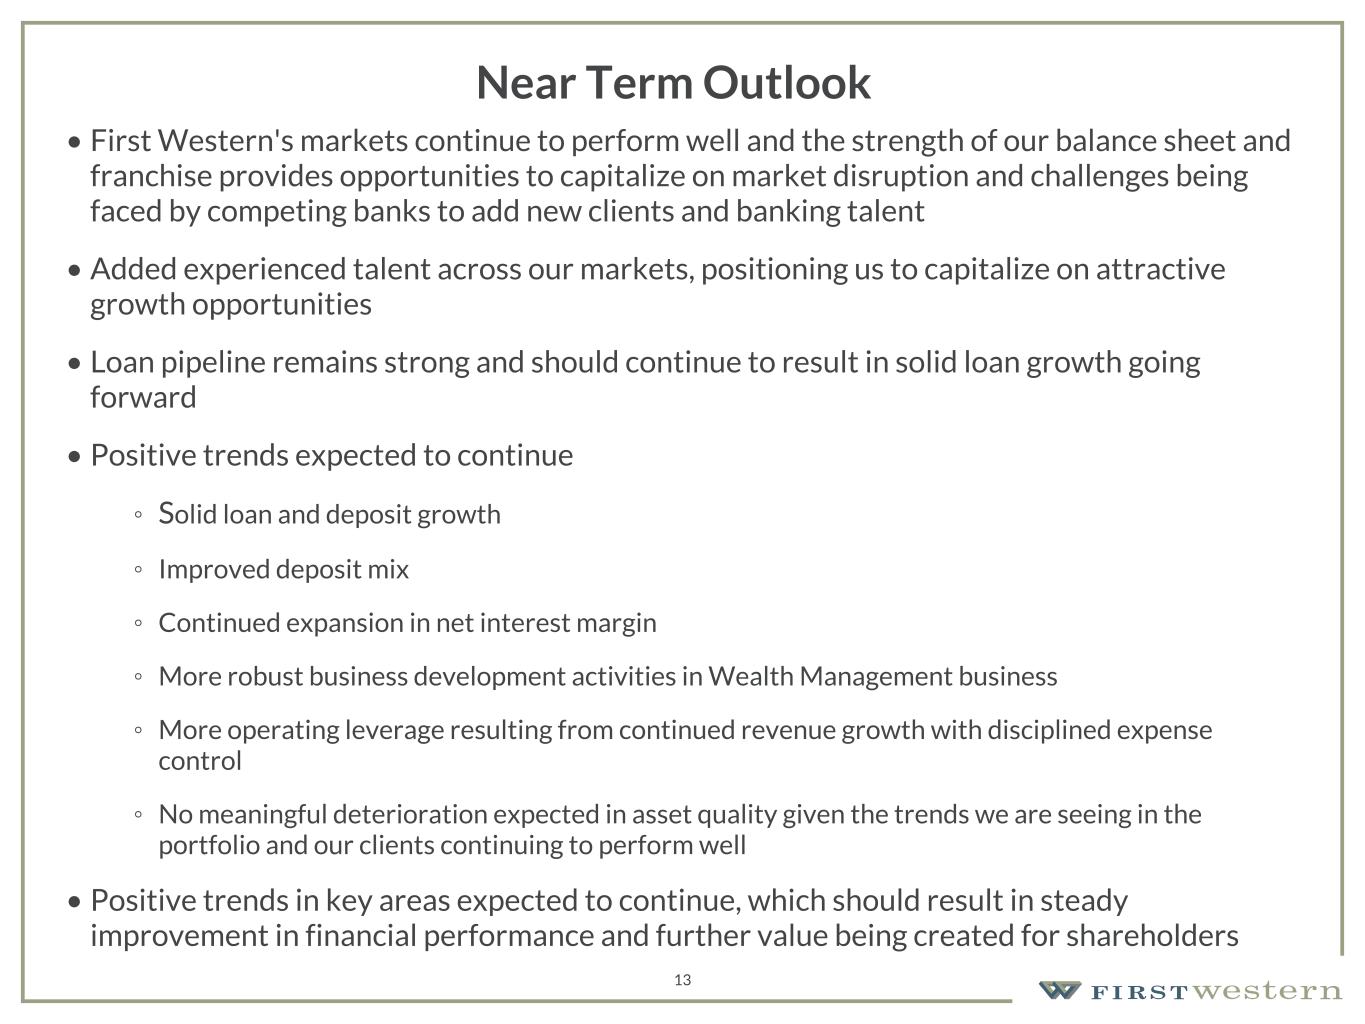
157 180 196 164 166 168 62 94 111 154 161 132 122 125 129 76 78 86 255 255 255 Chart color Table color Special Headlines Slide Headlines / Text on light background Primary Colors Secondary Colors Primary Background / Call Out Boxes / Text on dark background Chart color Table Color Tertiary Colors Chart color Table Color Chart Color Chart Color Approved Fonts AaBbCc 123 Lora (bold) Slide Headlines / Special Headlines AaBbCc 123 Lato (regular, bold, italics) Body Copy / Subheadings / Small Text Descriptions 13 Near Term Outlook • First Western's markets continue to perform well and the strength of our balance sheet and franchise provides opportunities to capitalize on market disruption and challenges being faced by competing banks to add new clients and banking talent • Added experienced talent across our markets, positioning us to capitalize on attractive growth opportunities • Loan pipeline remains strong and should continue to result in solid loan growth going forward • Positive trends expected to continue ◦ Solid loan and deposit growth ◦ Improved deposit mix ◦ Continued expansion in net interest margin ◦ More robust business development activities in Wealth Management business ◦ More operating leverage resulting from continued revenue growth with disciplined expense control ◦ No meaningful deterioration expected in asset quality given the trends we are seeing in the portfolio and our clients continuing to perform well • Positive trends in key areas expected to continue, which should result in steady improvement in financial performance and further value being created for shareholders
Appendix 14
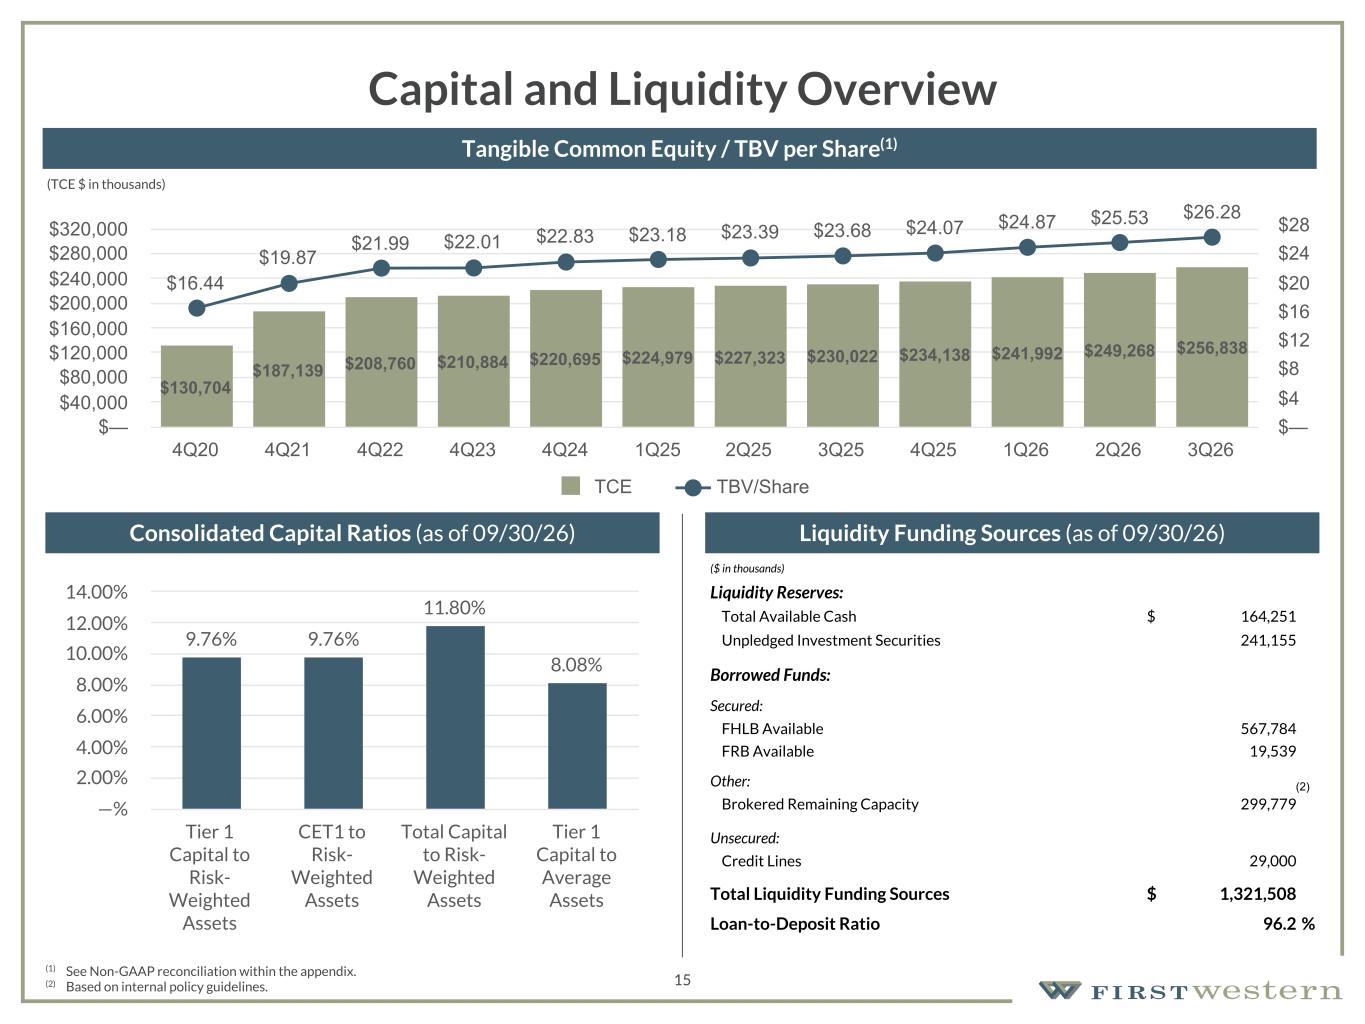
157 180 196 164 166 168 62 94 111 154 161 132 122 125 129 76 78 86 255 255 255 Chart color Table color Special Headlines Slide Headlines / Text on light background Primary Colors Secondary Colors Primary Background / Call Out Boxes / Text on dark background Chart color Table Color Tertiary Colors Chart color Table Color Chart Color Chart Color Approved Fonts AaBbCc 123 Lora (bold) Slide Headlines / Special Headlines AaBbCc 123 Lato (regular, bold, italics) Body Copy / Subheadings / Small Text Descriptions 15 Capital and Liquidity Overview Liquidity Funding Sources (as of 09/30/26) (1) See Non-GAAP reconciliation within the appendix. (2) Based on internal policy guidelines. Consolidated Capital Ratios (as of 09/30/26) Tangible Common Equity / TBV per Share(1) ($ in thousands) Liquidity Reserves: Total Available Cash $ 164,251 Unpledged Investment Securities 241,155 Borrowed Funds: Secured: FHLB Available 567,784 FRB Available 19,539 Other: Brokered Remaining Capacity 299,779 Unsecured: Credit Lines 29,000 Total Liquidity Funding Sources $ 1,321,508 Loan-to-Deposit Ratio 96.2 % 9.76% 9.76% 11.80% 8.08% Tier 1 Capital to Risk- Weighted Assets CET1 to Risk- Weighted Assets Total Capital to Risk- Weighted Assets Tier 1 Capital to Average Assets —% 2.00% 4.00% 6.00% 8.00% 10.00% 12.00% 14.00% (2) (TCE $ in thousands) $130,704 $187,139 $208,760 $210,884 $220,695 $224,979 $227,323 $230,022 $234,138 $241,992 $249,268 $256,838 $16.44 $19.87 $21.99 $22.01 $22.83 $23.18 $23.39 $23.68 $24.07 $24.87 $25.53 $26.28 TCE TBV/Share 4Q20 4Q21 4Q22 4Q23 4Q24 1Q25 2Q25 3Q25 4Q25 1Q26 2Q26 3Q26 $— $40,000 $80,000 $120,000 $160,000 $200,000 $240,000 $280,000 $320,000 $— $4 $8 $12 $16 $20 $24 $28
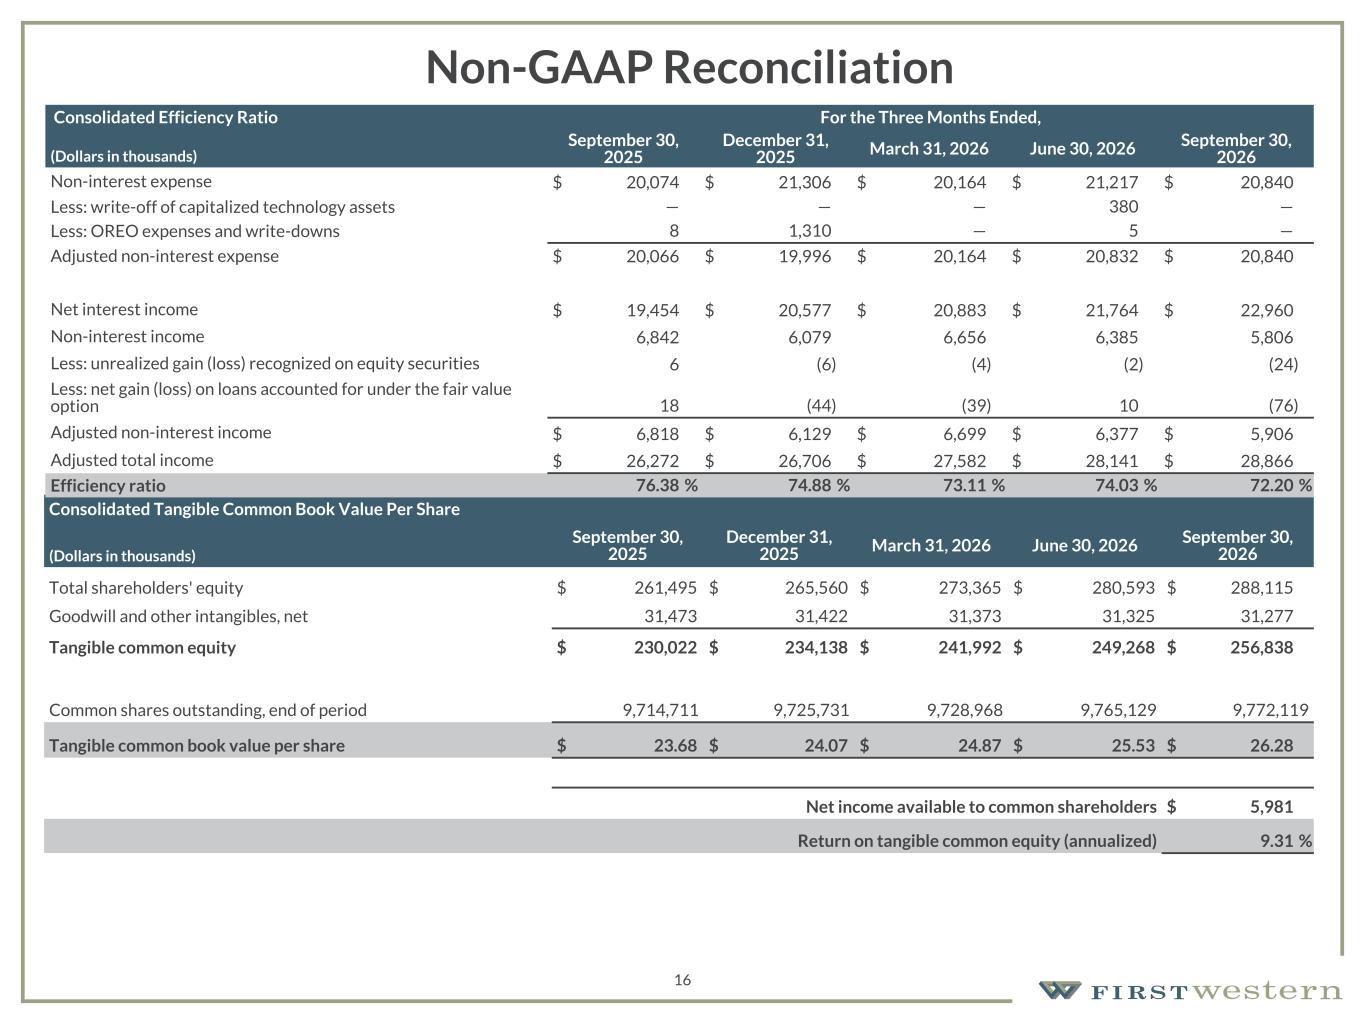
157 180 196 164 166 168 62 94 111 154 161 132 122 125 129 76 78 86 255 255 255 Chart color Table color Special Headlines Slide Headlines / Text on light background Primary Colors Secondary Colors Primary Background / Call Out Boxes / Text on dark background Chart color Table Color Tertiary Colors Chart color Table Color Chart Color Chart Color Approved Fonts AaBbCc 123 Lora (bold) Slide Headlines / Special Headlines AaBbCc 123 Lato (regular, bold, italics) Body Copy / Subheadings / Small Text Descriptions 16 Non-GAAP Reconciliation Consolidated Tangible Common Book Value Per Share (Dollars in thousands) September 30, 2025 December 31, 2025 March 31, 2026 June 30, 2026 September 30, 2026 Total shareholders' equity $ 261,495 $ 265,560 $ 273,365 $ 280,593 $ 288,115 Goodwill and other intangibles, net 31,473 31,422 31,373 31,325 31,277 Tangible common equity $ 230,022 $ 234,138 $ 241,992 $ 249,268 $ 256,838 Common shares outstanding, end of period 9,714,711 9,725,731 9,728,968 9,765,129 9,772,119 Tangible common book value per share $ 23.68 $ 24.07 $ 24.87 $ 25.53 $ 26.28 Net income available to common shareholders $ 5,981 Return on tangible common equity (annualized) 9.31 % Consolidated Efficiency Ratio For the Three Months Ended, (Dollars in thousands) September 30, 2025 December 31, 2025 March 31, 2026 June 30, 2026 September 30, 2026 Non-interest expense $ 20,074 $ 21,306 $ 20,164 $ 21,217 $ 20,840 Less: write-off of capitalized technology assets — — — 380 — Less: OREO expenses and write-downs 8 1,310 — 5 — Adjusted non-interest expense $ 20,066 $ 19,996 $ 20,164 $ 20,832 $ 20,840 Net interest income $ 19,454 $ 20,577 $ 20,883 $ 21,764 $ 22,960 Non-interest income 6,842 6,079 6,656 6,385 5,806 Less: unrealized gain (loss) recognized on equity securities 6 (6) (4) (2) (24) Less: net gain (loss) on loans accounted for under the fair value option 18 (44) (39) 10 (76) Adjusted non-interest income $ 6,818 $ 6,129 $ 6,699 $ 6,377 $ 5,906 Adjusted total income $ 26,272 $ 26,706 $ 27,582 $ 28,141 $ 28,866 Efficiency ratio 76.38 % 74.88 % 73.11 % 74.03 % 72.20 %
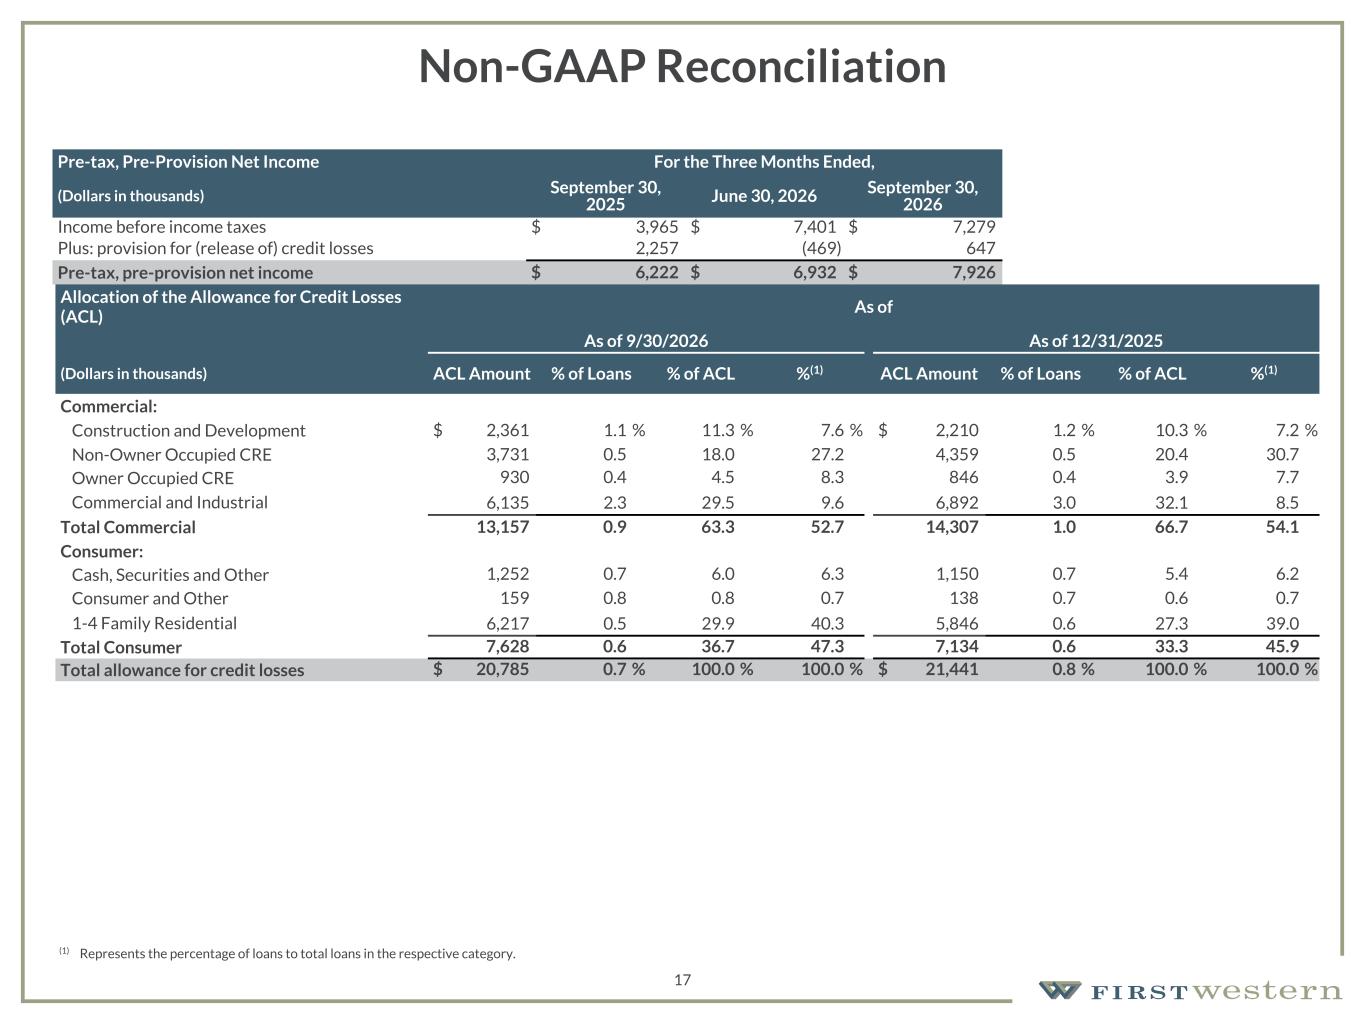
157 180 196 164 166 168 62 94 111 154 161 132 122 125 129 76 78 86 255 255 255 Chart color Table color Special Headlines Slide Headlines / Text on light background Primary Colors Secondary Colors Primary Background / Call Out Boxes / Text on dark background Chart color Table Color Tertiary Colors Chart color Table Color Chart Color Chart Color Approved Fonts AaBbCc 123 Lora (bold) Slide Headlines / Special Headlines AaBbCc 123 Lato (regular, bold, italics) Body Copy / Subheadings / Small Text Descriptions 17 Non-GAAP Reconciliation Pre-tax, Pre-Provision Net Income For the Three Months Ended, (Dollars in thousands) September 30, 2025 June 30, 2026 September 30, 2026 Income before income taxes $ 3,965 $ 7,401 $ 7,279 Plus: provision for (release of) credit losses 2,257 (469) 647 Pre-tax, pre-provision net income $ 6,222 $ 6,932 $ 7,926 Allocation of the Allowance for Credit Losses (ACL) As of As of 9/30/2026 As of 12/31/2025 (Dollars in thousands) ACL Amount % of Loans % of ACL %(1) ACL Amount % of Loans % of ACL %(1) Commercial: Construction and Development $ 2,361 1.1 % 11.3 % 7.6 % $ 2,210 1.2 % 10.3 % 7.2 % Non-Owner Occupied CRE 3,731 0.5 18.0 27.2 4,359 0.5 20.4 30.7 Owner Occupied CRE 930 0.4 4.5 8.3 846 0.4 3.9 7.7 Commercial and Industrial 6,135 2.3 29.5 9.6 6,892 3.0 32.1 8.5 Total Commercial 13,157 0.9 63.3 52.7 14,307 1.0 66.7 54.1 Consumer: Cash, Securities and Other 1,252 0.7 6.0 6.3 1,150 0.7 5.4 6.2 Consumer and Other 159 0.8 0.8 0.7 138 0.7 0.6 0.7 1-4 Family Residential 6,217 0.5 29.9 40.3 5,846 0.6 27.3 39.0 Total Consumer 7,628 0.6 36.7 47.3 7,134 0.6 33.3 45.9 Total allowance for credit losses $ 20,785 0.7 % 100.0 % 100.0 % $ 21,441 0.8 % 100.0 % 100.0 % (1) Represents the percentage of loans to total loans in the respective category.