Pay vs Performance Disclosure - USD ($)
|
12 Months Ended |
60 Months Ended |
Aug. 01, 2026 |
Aug. 02, 2025 |
Aug. 03, 2024 |
Jul. 29, 2023 |
Jul. 30, 2022 |
Aug. 08, 2021 |
Aug. 01, 2026 |
| Pay vs Performance Disclosure |
|
|
|
|
|
|
|
| Pay vs Performance Disclosure, Table |
| | | | | | | | | | | | | | | | | | | | | | | | | | | | | | | | | | Year | Summary Compensation Table Total for PEO(1) | Compensation Actually Paid to PEO(4) | Average Summary Compensation Table Total for non-PEO NEOs $(1) | Average Compensation Actually Paid to non-PEO NEOs $(4)(5) | Value of Initial Fixed $100 Investment Based on: (6) | (in millions) | 1st PEO $ (2) | 2nd PEO $(3) | 1st PEO $ (2) | 2nd PEO $(3) | Total Shareholder Return
$ | Peer Group Total Shareholder Return
$ | Net Income $(7) | Adjusted EBITDA $(8) | 2026 | 11,295,207 | | n/a | 36,478,213 | | n/a | 3,479,979 | | 8,598,991 | | 153 | | 257 | | 84 | | 701 | | | 2025 | 9,655,175 | | n/a | 21,581,689 | | n/a | 2,795,512 | | 4,651,087 | | 82 | | 139 | | (118) | | 552 | | | 2024 | 7,619,334 | | n/a | 5,237,814 | | n/a | 2,724,029 | | 843,517 | | 44 | | 104 | | (112) | | 518 | | | 2023 | 6,201,442 | | n/a | (1,706,501) | | n/a | 1,958,589 | | (4,707,368) | | 63 | | 110 | | 24 | | 640 | | | 2022 | 8,722,292 | 6,312,014 | | 8,947,422 | 709,289 | | 3,053,051 | | 2,223,744 | | 128 | | 135 | | 248 | | 829 | |
|
|
|
|
|
|
|
| Company Selected Measure Name |
Adjusted EBITDA
|
|
|
|
|
|
|
| Named Executive Officers, Footnote |
Mr. Spinner served as PEO for one week in fiscal 2022, retiring on August 9, 2021, at which time Mr. Douglas became the new PEO.
|
|
|
|
|
|
|
| Peer Group Issuers, Footnote |
Represents hypothetical $100 investment at the beginning of the measurement period. Peer group represents the S&P SmallCap 600 Food Distributors Index also used in the Company’s Annual Report under Part II Item 5 for the Comparative Stock Performance graph.
|
|
|
|
|
|
|
| Adjustment To PEO Compensation, Footnote |
“Compensation actually paid” begins with the Summary Compensation Table totals reported for the PEOs and the average of the Other NEOs for each year and were subject to the following adjustments per Item 402(v)(2)(iii) of Regulation S-K. NEOs do not participate in a defined benefit plan so no adjustment for pension benefits is included in the table below. Similarly, no adjustment is made for dividends as dividends do not apply. | | | | | | | | | | | | | | | | | | | | | | | | | | | | | | | | | | | | | Fiscal 2026 | Fiscal 2025 | Fiscal 2024 | Fiscal 2023 | Fiscal 2022 | | NEO | Douglas PEO #1 | Average NEO | Douglas PEO #1 | Average NEO | Douglas PEO #1 | Average NEO | Douglas PEO #1 | Average NEO | Douglas PEO #1 | Spinner PEO #2 | Average NEO | | Summary Compensation Table Total Pay $ | 11,295,207 | | 3,479,979 | | 9,655,175 | | 2,795,512 | | 7,619,334 | | 2,724,029 | | 6,201,442 | | 1,958,589 | | 8,722,292 | | 6,312,014 | | 3,053,051 | | | Subtract Grant Date Fair Value of Stock Awards Granted in Fiscal Year | (8,016,521) | | (1,868,356) | | (6,668,311) | | (1,286,578) | | (5,029,570) | | (1,444,325) | | (5,135,192) | | (1,324,846) | | (5,899,913) | | — | | (1,419,963) | | | Add Fair Value at FYE of Outstanding Awards Granted in Current Fiscal Year | 19,117,061 | | 4,246,377 | | 10,511,293 | | 1,816,277 | | 4,471,036 | | 939,207 | | 2,001,105 | | 494,269 | | 6,125,044 | | — | | 1,281,636 | | | Add Change in Fair Value of Outstanding Awards Granted in Prior Years | 12,777,786 | | 2,334,479 | | 7,419,911 | | 1,293,283 | | (1,590,840) | | (526,667) | | (4,670,685) | | (5,146,889) | | — | | (10,699,745) | | (913,495) | | | Add Change in Fair Value as of Vesting Date of Stock Awards Granted in Prior Years | 1,304,680 | | 406,512 | | 663,621 | | 194,851 | | (232,145) | | (132,362) | | (103,172) | | (640,179) | | — | | 5,097,020 | | 592,254 | | | Add Fair Value as of Prior Fiscal of Awards that failed to meet Vesting Conditions | — | | — | | — | | (162,259) | | — | | (716,365) | | — | | (48,313) | | — | | — | | (369,738) | | | Compensation Actually Paid $ | 36,478,213 | | 8,598,991 | | 21,581,689 | | 4,651,087 | | 5,237,814 | | 843,517 | | (1,706,501) | | (4,707,368) | | 8,947,422 | | 709,289 | | 2,223,744 | |
|
|
|
|
|
|
|
| Non-PEO NEO Average Total Compensation Amount |
$ 3,479,979
|
$ 2,795,512
|
$ 2,724,029
|
$ 1,958,589
|
$ 3,053,051
|
|
|
| Non-PEO NEO Average Compensation Actually Paid Amount |
$ 8,598,991
|
4,651,087
|
843,517
|
(4,707,368)
|
2,223,744
|
|
|
| Adjustment to Non-PEO NEO Compensation Footnote |
“Compensation actually paid” begins with the Summary Compensation Table totals reported for the PEOs and the average of the Other NEOs for each year and were subject to the following adjustments per Item 402(v)(2)(iii) of Regulation S-K. NEOs do not participate in a defined benefit plan so no adjustment for pension benefits is included in the table below. Similarly, no adjustment is made for dividends as dividends do not apply. | | | | | | | | | | | | | | | | | | | | | | | | | | | | | | | | | | | | | Fiscal 2026 | Fiscal 2025 | Fiscal 2024 | Fiscal 2023 | Fiscal 2022 | | NEO | Douglas PEO #1 | Average NEO | Douglas PEO #1 | Average NEO | Douglas PEO #1 | Average NEO | Douglas PEO #1 | Average NEO | Douglas PEO #1 | Spinner PEO #2 | Average NEO | | Summary Compensation Table Total Pay $ | 11,295,207 | | 3,479,979 | | 9,655,175 | | 2,795,512 | | 7,619,334 | | 2,724,029 | | 6,201,442 | | 1,958,589 | | 8,722,292 | | 6,312,014 | | 3,053,051 | | | Subtract Grant Date Fair Value of Stock Awards Granted in Fiscal Year | (8,016,521) | | (1,868,356) | | (6,668,311) | | (1,286,578) | | (5,029,570) | | (1,444,325) | | (5,135,192) | | (1,324,846) | | (5,899,913) | | — | | (1,419,963) | | | Add Fair Value at FYE of Outstanding Awards Granted in Current Fiscal Year | 19,117,061 | | 4,246,377 | | 10,511,293 | | 1,816,277 | | 4,471,036 | | 939,207 | | 2,001,105 | | 494,269 | | 6,125,044 | | — | | 1,281,636 | | | Add Change in Fair Value of Outstanding Awards Granted in Prior Years | 12,777,786 | | 2,334,479 | | 7,419,911 | | 1,293,283 | | (1,590,840) | | (526,667) | | (4,670,685) | | (5,146,889) | | — | | (10,699,745) | | (913,495) | | | Add Change in Fair Value as of Vesting Date of Stock Awards Granted in Prior Years | 1,304,680 | | 406,512 | | 663,621 | | 194,851 | | (232,145) | | (132,362) | | (103,172) | | (640,179) | | — | | 5,097,020 | | 592,254 | | | Add Fair Value as of Prior Fiscal of Awards that failed to meet Vesting Conditions | — | | — | | — | | (162,259) | | — | | (716,365) | | — | | (48,313) | | — | | — | | (369,738) | | | Compensation Actually Paid $ | 36,478,213 | | 8,598,991 | | 21,581,689 | | 4,651,087 | | 5,237,814 | | 843,517 | | (1,706,501) | | (4,707,368) | | 8,947,422 | | 709,289 | | 2,223,744 | |
|
|
|
|
|
|
|
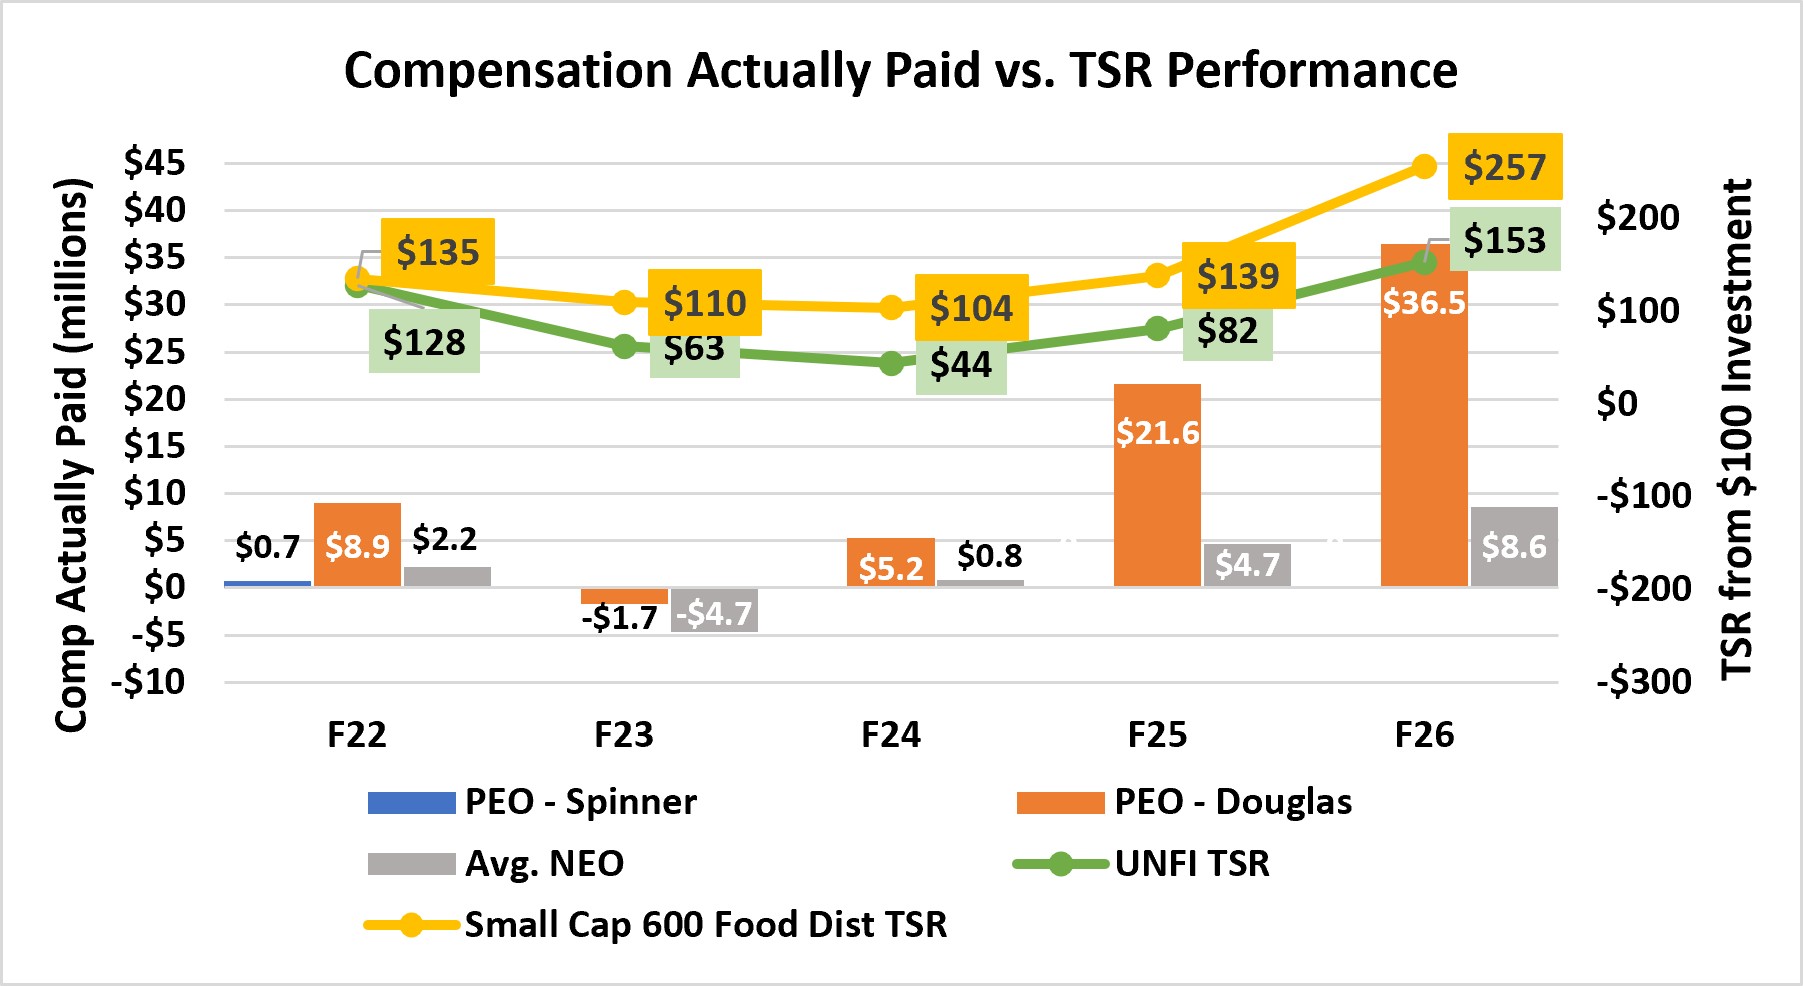
| Compensation Actually Paid vs. Total Shareholder Return |
|
|
|
|
|
|
|
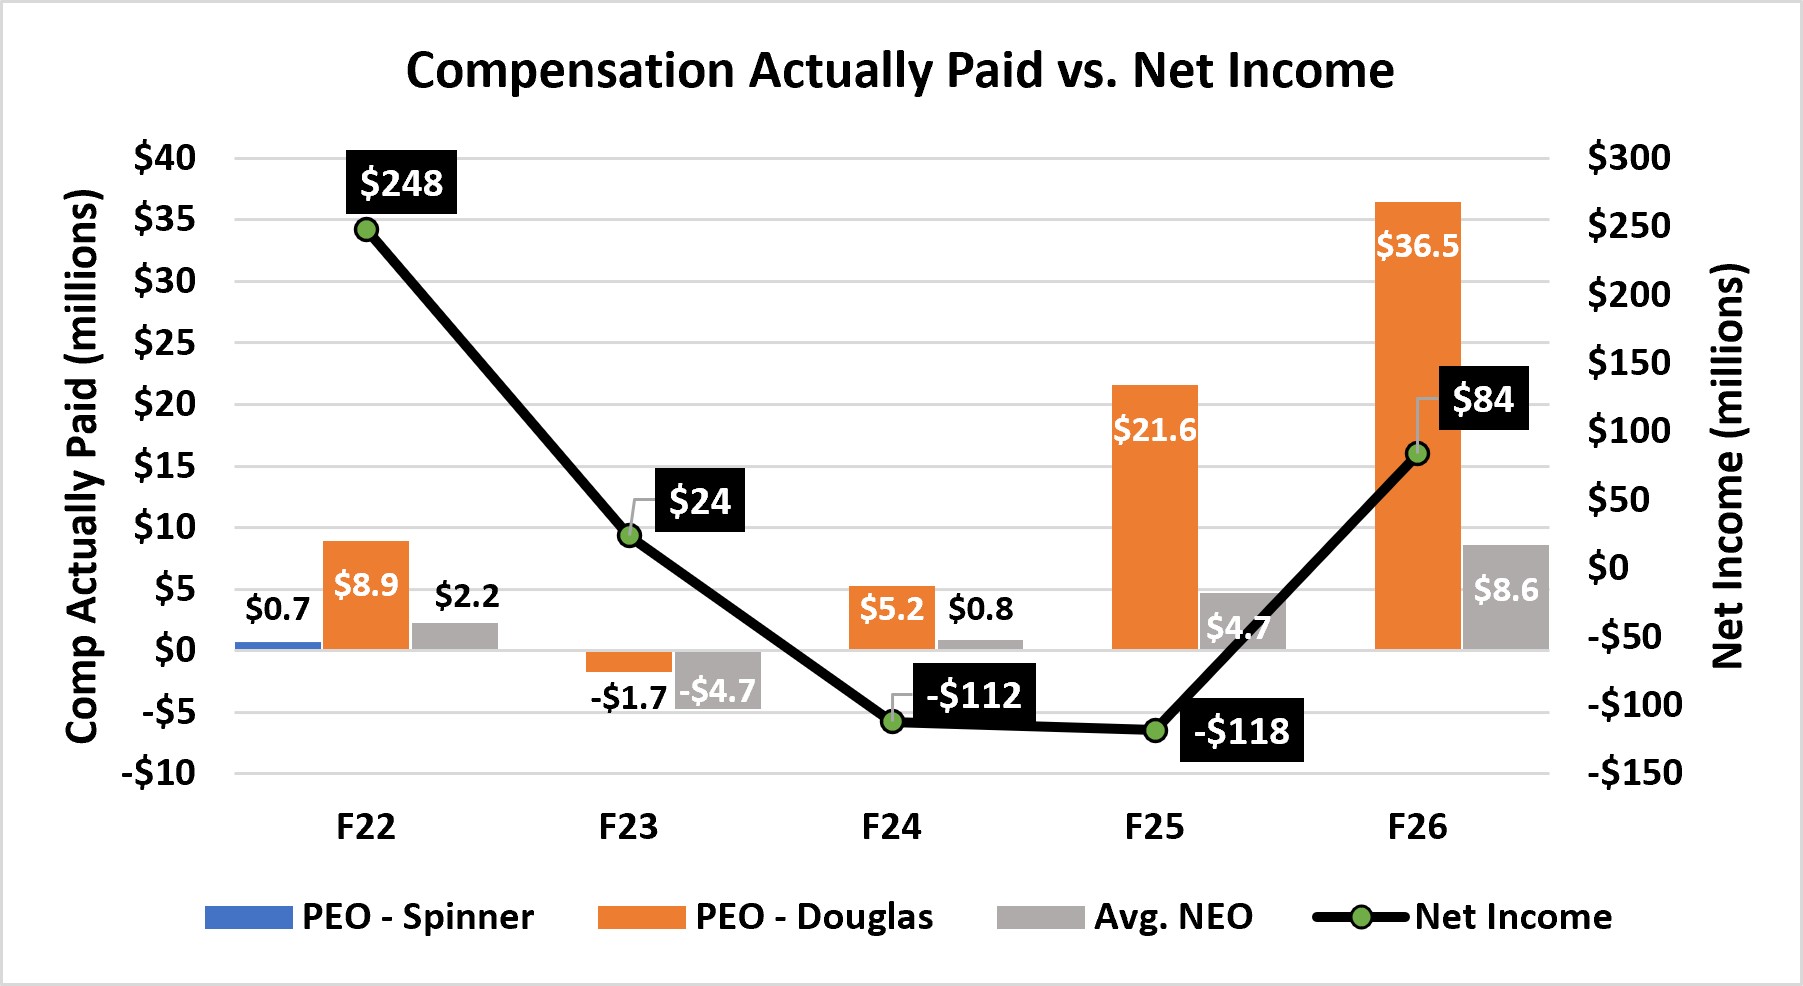
| Compensation Actually Paid vs. Net Income |
|
|
|
|
|
|
|
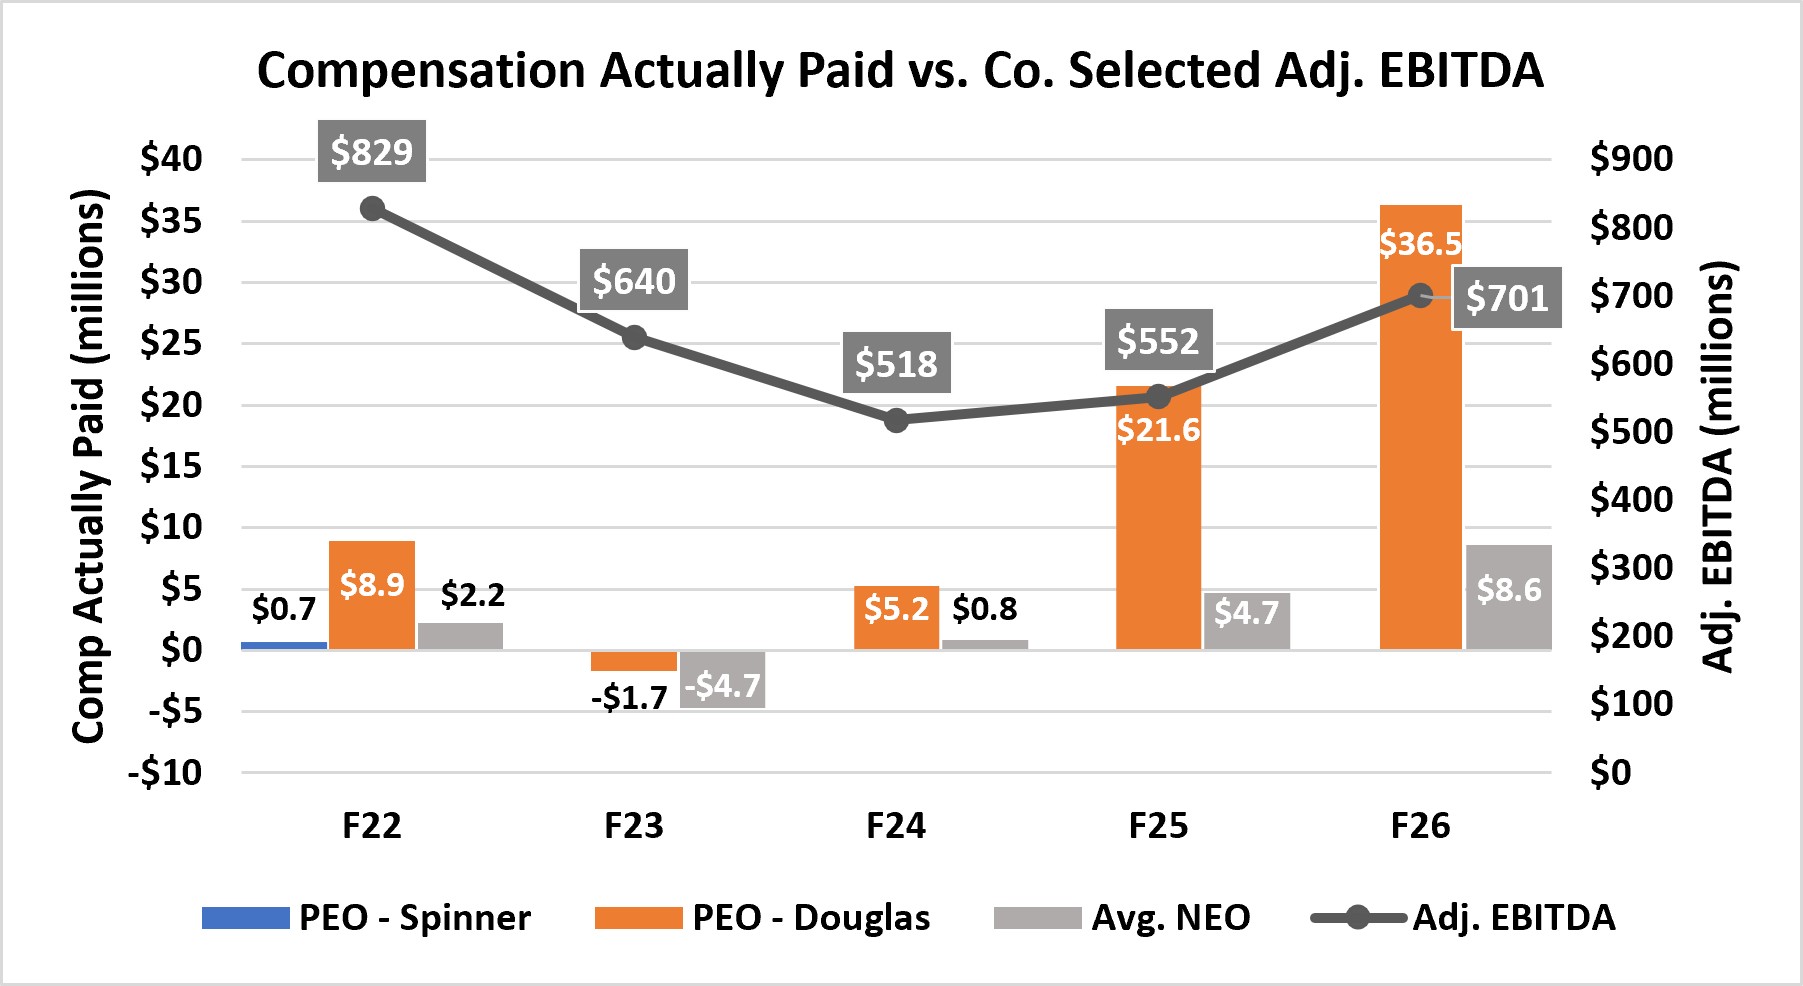
| Compensation Actually Paid vs. Company Selected Measure |
|
|
|
|
|
|
|
| Total Shareholder Return Vs Peer Group |
|
|
|
|
|
|
|
| Tabular List, Table |
| | | | Financial Performance Measures | | Adjusted EBITDA | | Core Adjusted EPS | | Free Cash Flow |
|
|
|
|
|
|
|
| Total Shareholder Return Amount |
$ 153
|
82
|
44
|
63
|
128
|
|
|
| Peer Group Total Shareholder Return Amount |
257
|
139
|
104
|
110
|
135
|
|
|
| Net Income (Loss) |
$ 84,000,000
|
$ (118,000,000)
|
$ (112,000,000)
|
$ 24,000,000
|
$ 248,000,000
|
|
|
| Company Selected Measure Amount |
701,000,000
|
552,000,000
|
518,000,000
|
640,000,000
|
829,000,000
|
|
|
| PEO Name |
|
|
|
|
Mr. Spinner
|
Mr. Spinner
|
Mr. Douglas
|
| Additional 402(v) Disclosure |
The values reflected in this column represent the “Total” compensation set forth in the Summary Compensation Table on page 51.“Compensation actually paid” begins with the Summary Compensation Table totals reported for the PEOs and the average of the Other NEOs for each year and were subject to the following adjustments per Item 402(v)(2)(iii) of Regulation S-K. NEOs do not participate in a defined benefit plan so no adjustment for pension benefits is included in the table below. Similarly, no adjustment is made for dividends as dividends do not apply.Other NEOs for fiscal 2022 are Mr. Howard (former CFO), Mr. Dorne (former COO), Mr. Stigers (former CEO, Cub), Ms. Sutton, (former Chief Legal Officer, General Counsel and Corporate Secretary) and Mr. Testa (former President); Other NEOs for fiscal 2023 are Mr. Howard (former CFO), Ms. Benedict (CHRO), Mr. Martin (then President, Wholesale), Mr. Testa (former President) and Mr. Stigers (former CEO, Cub); Other NEOs for fiscal 2024 are Mr. Tarditi (then President and CFO), Ms. Benedict (CHRO), Mr. Martin (then President, Wholesale), Mr. Persaud (former President and CEO, Retail), Ms. Horvath (former COO) and Mr. Howard (former CFO); Other NEOs for fiscal 2025 are Mr. Tarditi (then President and CFO), Louis Martin (then President of Conventional Grocery Products and CCO), Mr. Bushway (then President of Natural, Organic, Specialty & Fresh Products and CSCO), Ms. Benedict (CHRO) and Mr. Persaud (former President and CEO, Retail); and Other NEOs for fiscal 2026 are Mr. Tarditi (then President and CFO), Mr. Best (President and CEO, Retail), Mr. Bushway (Chief Supply Chain Officer) and Mr. Martin (Chief Commercial Officer). As reported on Registrant’s Consolidated Statements of Income for the applicable fiscal reporting year, as provided under Part II Item 8 of the Company’s Annual Report.For performance-based awards, the fair values reflect the probable outcome of the performance vesting conditions as of each measurement date.
|
|
|
|
|
|
|
| Measure:: 1 |
|
|
|
|
|
|
|
| Pay vs Performance Disclosure |
|
|
|
|
|
|
|
| Name |
Adjusted EBITDA
|
|
|
|
|
|
|
| Non-GAAP Measure Description |
The Company has identified Adjusted EBITDA as the Company-selected measure, as it represents the most important financial performance measure used to link compensation actually paid to the PEO and the Other NEOs in 2026 to the Company’s performance. See Annex C for the definition of Adjusted EBITDA, a non-GAAP measure, and reconciliation to the most directly comparable GAAP measure.
|
|
|
|
|
|
|
| Measure:: 2 |
|
|
|
|
|
|
|
| Pay vs Performance Disclosure |
|
|
|
|
|
|
|
| Name |
Core Adjusted EPS
|
|
|
|
|
|
|
| Measure:: 3 |
|
|
|
|
|
|
|
| Pay vs Performance Disclosure |
|
|
|
|
|
|
|
| Name |
Free Cash Flow
|
|
|
|
|
|
|
| Douglas [Member] |
|
|
|
|
|
|
|
| Pay vs Performance Disclosure |
|
|
|
|
|
|
|
| PEO Total Compensation Amount |
$ 11,295,207
|
$ 9,655,175
|
$ 7,619,334
|
$ 6,201,442
|
$ 8,722,292
|
|
|
| PEO Actually Paid Compensation Amount |
36,478,213
|
21,581,689
|
5,237,814
|
(1,706,501)
|
8,947,422
|
|
|
| Spinner [Member] |
|
|
|
|
|
|
|
| Pay vs Performance Disclosure |
|
|
|
|
|
|
|
| PEO Total Compensation Amount |
|
|
|
|
6,312,014
|
|
|
| PEO Actually Paid Compensation Amount |
|
|
|
|
709,289
|
|
|
| PEO | Douglas [Member] | Aggregate Grant Date Fair Value of Equity Award Amounts Reported in Summary Compensation Table |
|
|
|
|
|
|
|
| Pay vs Performance Disclosure |
|
|
|
|
|
|
|
| Adjustment to Compensation, Amount |
(8,016,521)
|
(6,668,311)
|
(5,029,570)
|
(5,135,192)
|
(5,899,913)
|
|
|
| PEO | Douglas [Member] | Year-end Fair Value of Equity Awards Granted in Covered Year that are Outstanding and Unvested |
|
|
|
|
|
|
|
| Pay vs Performance Disclosure |
|
|
|
|
|
|
|
| Adjustment to Compensation, Amount |
19,117,061
|
10,511,293
|
4,471,036
|
2,001,105
|
6,125,044
|
|
|
| PEO | Douglas [Member] | Year-over-Year Change in Fair Value of Equity Awards Granted in Prior Years That are Outstanding and Unvested |
|
|
|
|
|
|
|
| Pay vs Performance Disclosure |
|
|
|
|
|
|
|
| Adjustment to Compensation, Amount |
12,777,786
|
7,419,911
|
(1,590,840)
|
(4,670,685)
|
0
|
|
|
| PEO | Douglas [Member] | Change in Fair Value as of Vesting Date of Prior Year Equity Awards Vested in Covered Year |
|
|
|
|
|
|
|
| Pay vs Performance Disclosure |
|
|
|
|
|
|
|
| Adjustment to Compensation, Amount |
1,304,680
|
663,621
|
(232,145)
|
(103,172)
|
0
|
|
|
| PEO | Douglas [Member] | Prior Year End Fair Value of Equity Awards Granted in Any Prior Year that Fail to Meet Applicable Vesting Conditions During Covered Year |
|
|
|
|
|
|
|
| Pay vs Performance Disclosure |
|
|
|
|
|
|
|
| Adjustment to Compensation, Amount |
0
|
0
|
0
|
0
|
0
|
|
|
| PEO | Spinner [Member] | Aggregate Grant Date Fair Value of Equity Award Amounts Reported in Summary Compensation Table |
|
|
|
|
|
|
|
| Pay vs Performance Disclosure |
|
|
|
|
|
|
|
| Adjustment to Compensation, Amount |
|
|
|
|
0
|
|
|
| PEO | Spinner [Member] | Year-end Fair Value of Equity Awards Granted in Covered Year that are Outstanding and Unvested |
|
|
|
|
|
|
|
| Pay vs Performance Disclosure |
|
|
|
|
|
|
|
| Adjustment to Compensation, Amount |
|
|
|
|
0
|
|
|
| PEO | Spinner [Member] | Year-over-Year Change in Fair Value of Equity Awards Granted in Prior Years That are Outstanding and Unvested |
|
|
|
|
|
|
|
| Pay vs Performance Disclosure |
|
|
|
|
|
|
|
| Adjustment to Compensation, Amount |
|
|
|
|
(10,699,745)
|
|
|
| PEO | Spinner [Member] | Change in Fair Value as of Vesting Date of Prior Year Equity Awards Vested in Covered Year |
|
|
|
|
|
|
|
| Pay vs Performance Disclosure |
|
|
|
|
|
|
|
| Adjustment to Compensation, Amount |
|
|
|
|
5,097,020
|
|
|
| PEO | Spinner [Member] | Prior Year End Fair Value of Equity Awards Granted in Any Prior Year that Fail to Meet Applicable Vesting Conditions During Covered Year |
|
|
|
|
|
|
|
| Pay vs Performance Disclosure |
|
|
|
|
|
|
|
| Adjustment to Compensation, Amount |
|
|
|
|
0
|
|
|
| Non-PEO NEO | Aggregate Grant Date Fair Value of Equity Award Amounts Reported in Summary Compensation Table |
|
|
|
|
|
|
|
| Pay vs Performance Disclosure |
|
|
|
|
|
|
|
| Adjustment to Compensation, Amount |
(1,868,356)
|
(1,286,578)
|
(1,444,325)
|
(1,324,846)
|
(1,419,963)
|
|
|
| Non-PEO NEO | Year-end Fair Value of Equity Awards Granted in Covered Year that are Outstanding and Unvested |
|
|
|
|
|
|
|
| Pay vs Performance Disclosure |
|
|
|
|
|
|
|
| Adjustment to Compensation, Amount |
4,246,377
|
1,816,277
|
939,207
|
494,269
|
1,281,636
|
|
|
| Non-PEO NEO | Year-over-Year Change in Fair Value of Equity Awards Granted in Prior Years That are Outstanding and Unvested |
|
|
|
|
|
|
|
| Pay vs Performance Disclosure |
|
|
|
|
|
|
|
| Adjustment to Compensation, Amount |
2,334,479
|
1,293,283
|
(526,667)
|
(5,146,889)
|
(913,495)
|
|
|
| Non-PEO NEO | Change in Fair Value as of Vesting Date of Prior Year Equity Awards Vested in Covered Year |
|
|
|
|
|
|
|
| Pay vs Performance Disclosure |
|
|
|
|
|
|
|
| Adjustment to Compensation, Amount |
406,512
|
194,851
|
(132,362)
|
(640,179)
|
592,254
|
|
|
| Non-PEO NEO | Prior Year End Fair Value of Equity Awards Granted in Any Prior Year that Fail to Meet Applicable Vesting Conditions During Covered Year |
|
|
|
|
|
|
|
| Pay vs Performance Disclosure |
|
|
|
|
|
|
|
| Adjustment to Compensation, Amount |
$ 0
|
$ (162,259)
|
$ (716,365)
|
$ (48,313)
|
$ (369,738)
|
|
|