Pay versus Performance
As required by Section 953(a) of the Dodd-Frank Act and Item 402(v) of Regulation S-K, we are providing the following information about the relationship between the SEC-defined Compensation Actually Paid (“CAP”) to our NEOs and certain of our financial performance metrics during the fiscal years listed below.
The table below presents information on the CAP to our principal executive officer (“PEO”), and to our other NEOs in comparison to certain performance metrics for the fiscal years ended June 30, 2026, 2025, and 2024. The SEC-defined CAP data set forth in the table below does not reflect amounts actually paid, earned or received by our NEOs, and the metrics are not those that the Compensation Committee uses when setting executive compensation. Per SEC rules, CAP is calculated by adjusting the Summary Compensation Table (“SCT”) Total values for the applicable year as described in the footnotes to the table.
|
Year |
Summary Compensation Table Total for PEO (1) |
Compensation Actually Paid to PEO (1)(3) |
Average Summary Compensation Table Total for Non-PEO NEOs (2) |
Average Compensation Actually Paid to Non-PEO NEOs (2)(3) |
Value of Initial Fixed $100 Investment Based on Total Shareholder Return (“TSR”) |
Net Loss (in millions) | ||||||||||||||||||
|
2026 |
$ | 844,854 | $ | 854,767 | $ | 553,170 | $ | 557,638 | $ | 134.38 | $ | (14.3 | ) | |||||||||||
|
2025 |
$ | 883,928 | $ | 867,093 | $ | 462,089 | $ | 443,461 | $ | 136.25 | $ | (13.6 | ) | |||||||||||
|
2024 |
$ | 928,217 | $ | 919,184 | $ | 547,689 | $ | 564,935 | $ | 182.50 | $ | (15.8 | ) | |||||||||||
|
(1) |
The PEO for fiscal 2026, fiscal 2025 and fiscal 2024 was our Director and Chief Executive Officer, Joshua R. Disbrow. |
|
(2) |
Non-PEO NEOs reflect the average Summary Compensation Table total compensation and average Compensation Actually Paid for Ryan J. Selhorn, Jarrett T. Disbrow and Greg Pyszczymuka for fiscal 2026, Ryan J. Selhorn, Mark K. Oki, Jarrett T. Disbrow and Greg Pyszczymuka for fiscal 2025, and Mark K. Oki, Jarrett T. Disbrow and Greg Pyszczymuka for fiscal 2024. Ryan J. Selhorn was appointed Chief Financial Officer, Corporate Secretary and Treasurer in November 2024 and is therefore excluded from the pay versus performance calculations for fiscal 2024. |
|
(3) |
Deductions from, and additions to, total compensation in the Summary Compensation Table by fiscal year to calculate CAP include the following: |
|
Year Ended June 30, 2026 |
Year Ended June 30, 2025 |
Year Ended June 30, 2024 |
||||||||||||||||||||||
|
PEO |
Average Non-PEO NEOs |
PEO |
Average Non-PEO NEOs |
PEO |
Average Non-PEO NEOs |
|||||||||||||||||||
|
Total compensation from Summary Compensation Table |
$ | 844,854 | $ | 553,170 | $ | 883,928 | $ | 462,089 | $ | 928,217 | $ | 547,689 | ||||||||||||
| Adjustments for equity awards: | ||||||||||||||||||||||||
|
Adjustment for grant date values in the Summary Compensation Table |
(42,750 | ) | (26,917 | ) | (46,128 | ) | (23,493 | ) | (55,017 | ) | (14,147 | ) | ||||||||||||
|
Year-end fair value of unvested awards granted in the current year |
48,375 | 30,458 | 57,820 | 14,858 | 30,000 | 20,488 | ||||||||||||||||||
|
Fair values at vest date for awards granted and vested in the current year |
— | — | — | — | — | — | ||||||||||||||||||
|
Year-over-year difference of year-end fair values for unvested awards granted in prior years |
(668 | ) | (188 | ) | (11,799 | ) | (2,123 | ) | 2,991 | 5,238 | ||||||||||||||
|
Difference in fair values between prior year-end fair values and vest-date fair values for awards granted in prior years |
4,956 | 1,115 | (16,728 | ) | (7,870 | ) | 12,993 | 5,667 | ||||||||||||||||
|
Total adjustments for equity awards |
9,913 | 4,468 | (16,835 | ) | (18,628 | ) | (9,033 | ) | 17,246 | |||||||||||||||
|
Compensation Actually Paid |
$ | 854,767 | $ | 557,638 | $ | 867,093 | $ | 443,461 | $ | 919,184 | $ | 564,935 | ||||||||||||
|
(3) |
Deductions from, and additions to, total compensation in the Summary Compensation Table by fiscal year to calculate CAP include the following: |
|
Year Ended June 30, 2026 |
Year Ended June 30, 2025 |
Year Ended June 30, 2024 |
||||||||||||||||||||||
|
PEO |
Average Non-PEO NEOs |
PEO |
Average Non-PEO NEOs |
PEO |
Average Non-PEO NEOs |
|||||||||||||||||||
|
Total compensation from Summary Compensation Table |
$ | 844,854 | $ | 553,170 | $ | 883,928 | $ | 462,089 | $ | 928,217 | $ | 547,689 | ||||||||||||
| Adjustments for equity awards: | ||||||||||||||||||||||||
|
Adjustment for grant date values in the Summary Compensation Table |
(42,750 | ) | (26,917 | ) | (46,128 | ) | (23,493 | ) | (55,017 | ) | (14,147 | ) | ||||||||||||
|
Year-end fair value of unvested awards granted in the current year |
48,375 | 30,458 | 57,820 | 14,858 | 30,000 | 20,488 | ||||||||||||||||||
|
Fair values at vest date for awards granted and vested in the current year |
— | — | — | — | — | — | ||||||||||||||||||
|
Year-over-year difference of year-end fair values for unvested awards granted in prior years |
(668 | ) | (188 | ) | (11,799 | ) | (2,123 | ) | 2,991 | 5,238 | ||||||||||||||
|
Difference in fair values between prior year-end fair values and vest-date fair values for awards granted in prior years |
4,956 | 1,115 | (16,728 | ) | (7,870 | ) | 12,993 | 5,667 | ||||||||||||||||
|
Total adjustments for equity awards |
9,913 | 4,468 | (16,835 | ) | (18,628 | ) | (9,033 | ) | 17,246 | |||||||||||||||
|
Compensation Actually Paid |
$ | 854,767 | $ | 557,638 | $ | 867,093 | $ | 443,461 | $ | 919,184 | $ | 564,935 | ||||||||||||
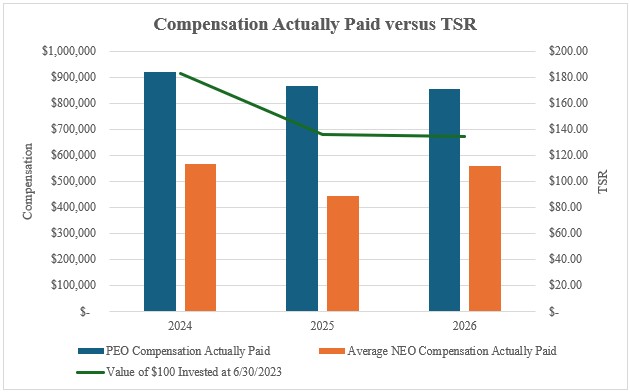
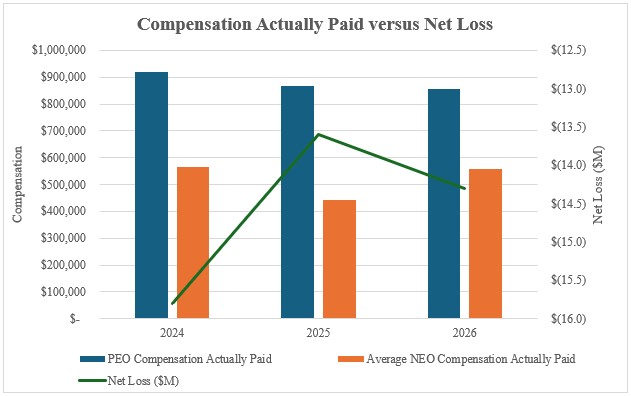
The graphs below illustrate the relationship for fiscal 2024, fiscal 2025 and fiscal 2026 of the CAP for our PEO and the average CAP for our other NEOs as calculated pursuant to SEC rules to (i) our total shareholder return (“TSR”) and (ii) our net loss (each as set forth in the table above). We do not utilize TSR or net loss in our executive compensation program; however, we do utilize other performance measures to align executive compensation with the Company’s performance. See the “Executive Compensation - Executive Compensation Program Objectives” section of this proxy statement for a description of the elements of compensation for our NEOs, including a description of the performance-based cash bonus component of our executives’ compensation, which is designed to provide appropriate incentives to our executives to achieve defined annual corporate goals and to reward our executives for individual achievement towards these goals. In addition, a significant portion of our executives’ compensation is delivered through equity awards in the form of stock options and restricted stock. These equity awards are intended to align the interests of our executives with stockholders and to incentivize and reward executives for stock price appreciation.