3rd Quarter 2026 Results Investor Presentation
Cautionary Statements 1 This presentation contains forward-looking statements, as defined by federal securities laws, including, among other forward- looking statements, certain plans, expectations and goals. Words such as “may,” “believe,” “expect,” “anticipate,” “intend,” “will,” “should,” “plan,” “estimate,” “predict,” “continue” and “potential” or the negative of these terms or other comparable terminology, as well as similar expressions, are meant to identify forward-looking statements. The forward-looking statements in this presentation are based on management’s opinions only as of the date hereof and are provided to assist in the understanding of potential future performance. Such forward-looking statements involve numerous assumptions, risks and uncertainties that may cause actual results to differ materially from those expressed or implied in any such statements, including, without limitation, the following: general competitive, economic, unemployment, political and market conditions and fluctuations, including real estate market conditions, and the effects of such conditions and fluctuations on the creditworthiness and payment behaviors of borrowers, collateral values, asset recovery values and the value of investment securities; movements in interest rates and their impacts on net interest margin, investment security valuations and other performance measures; expectations and assumptions regarding credit quality and performance; legislative and regulatory changes; changes in U.S. government trade, monetary and fiscal policies, including tariffs; competitive pressures on product pricing and services; fraud, theft or other misconduct impacting our customers or operations; cybersecurity risks, including data breaches, malware, ransomware and account takeovers; the success and timing of our business strategies and plans; our outlook and long-term goals for future growth; and natural disasters, geopolitical events, acts of war or terrorism or other hostilities, public health crises and other catastrophic events beyond our control. For a discussion of some of the other risks and other factors that may cause such forward-looking statements to differ materially from actual results, please refer to the Company’s filings with the Securities and Exchange Commission, including the Company’s Annual Report on Form 10-K for the year ended December 31, 2025, and the Company’s subsequently filed periodic reports and other filings. Forward-looking statements speak only as of the date they are made, and, except as required by law, the Company undertakes no obligation to update or revise forward-looking statements.
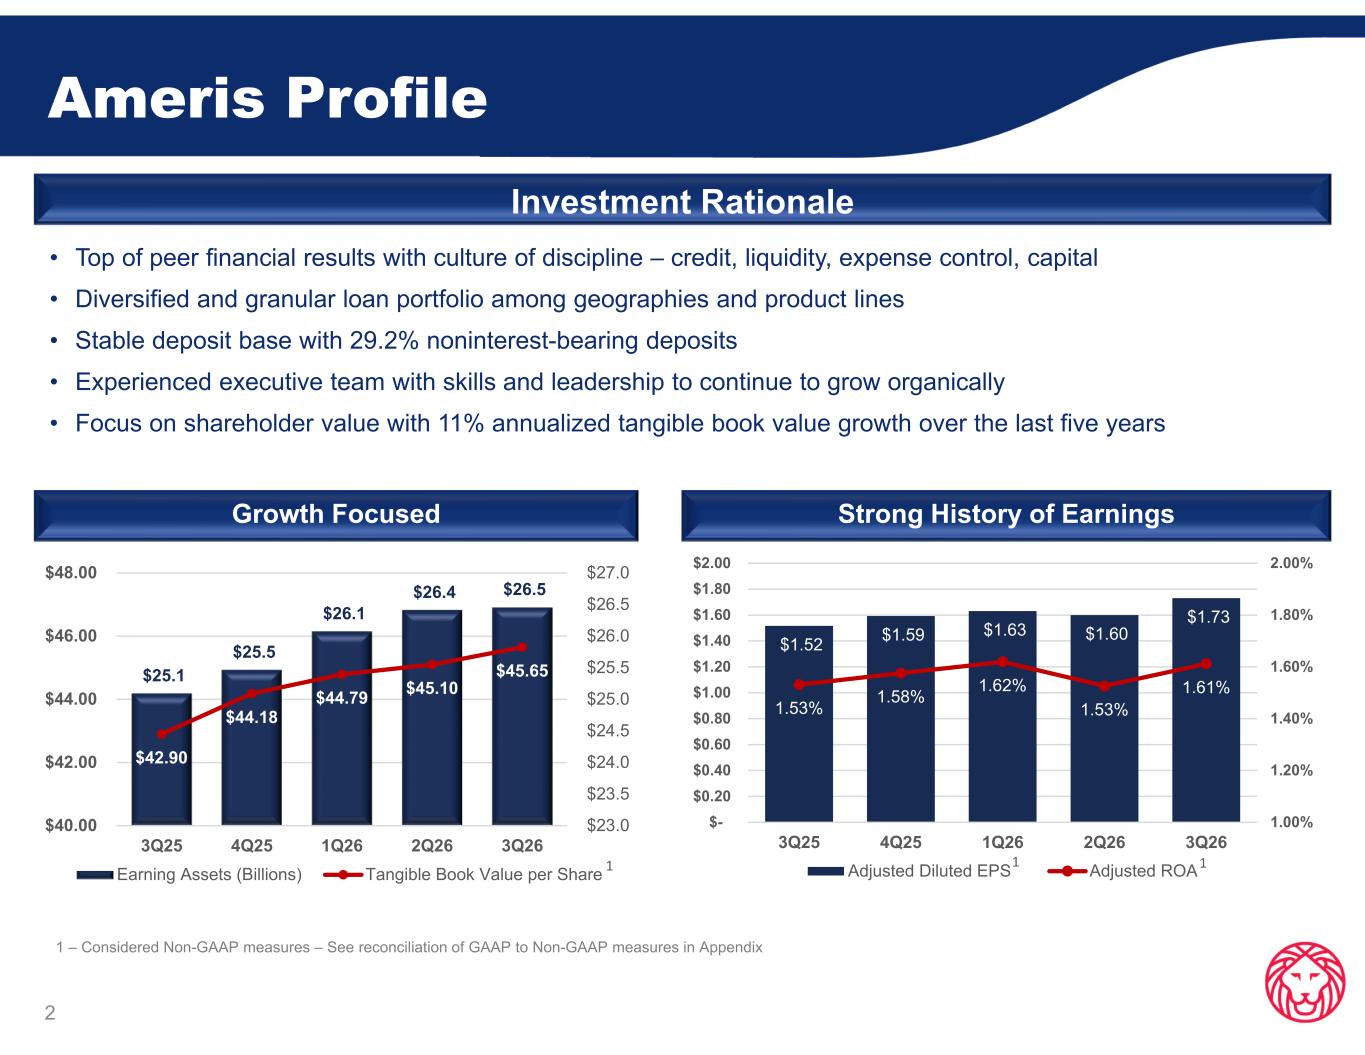
Ameris Profile Investment Rationale • Top of peer financial results with culture of discipline – credit, liquidity, expense control, capital • Diversified and granular loan portfolio among geographies and product lines • Stable deposit base with 29.2% noninterest-bearing deposits • Experienced executive team with skills and leadership to continue to grow organically • Focus on shareholder value with 11% annualized tangible book value growth over the last five years Strong History of Earnings 2 Growth Focused 1 – Considered Non-GAAP measures – See reconciliation of GAAP to Non-GAAP measures in Appendix 1 $25.1 $25.5 $26.1 $26.4 $26.5 $42.90 $44.18 $44.79 $45.10 $45.65 $23.0 $23.5 $24.0 $24.5 $25.0 $25.5 $26.0 $26.5 $27.0 $40.00 $42.00 $44.00 $46.00 $48.00 3Q25 4Q25 1Q26 2Q26 3Q26 Earning Assets (Billions) Tangible Book Value per Share 1 $1.52 $1.59 $1.63 $1.60 $1.73 1.53% 1.58% 1.62% 1.53% 1.61% 1.00% 1.20% 1.40% 1.60% 1.80% 2.00% $- $0.20 $0.40 $0.60 $0.80 $1.00 $1.20 $1.40 $1.60 $1.80 $2.00 3Q25 4Q25 1Q26 2Q26 3Q26 Adjusted Diluted EPS Adjusted ROA11
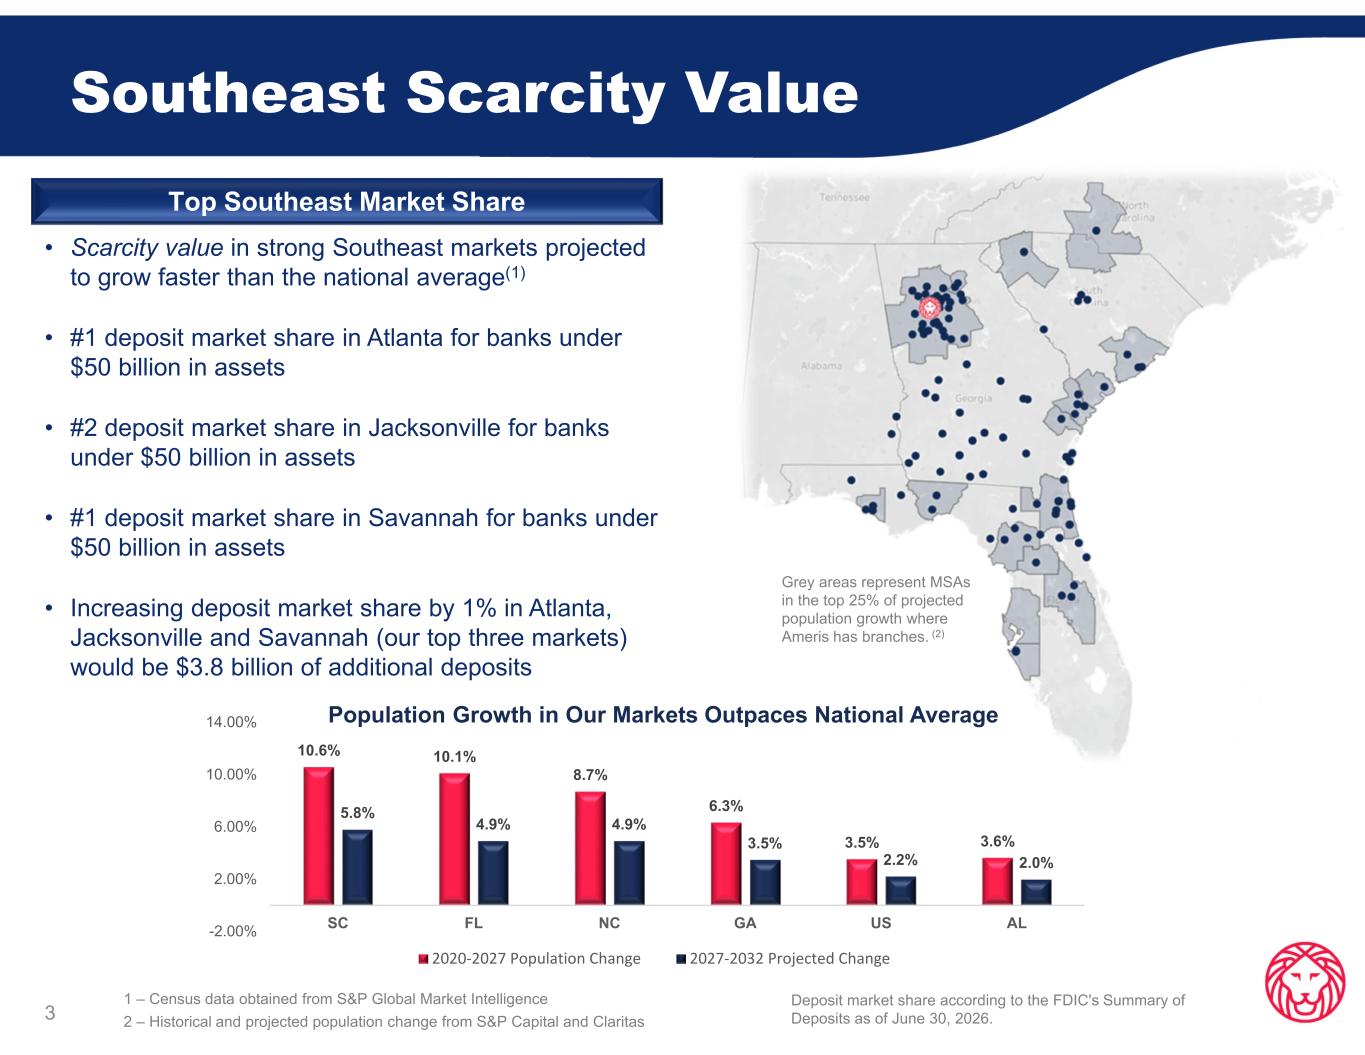
Southeast Scarcity Value 3 1 – Census data obtained from S&P Global Market Intelligence 2 – Historical and projected population change from S&P Capital and Claritas Grey areas represent MSAs in the top 25% of projected population growth where Ameris has branches. (2) Top Southeast Market Share • Scarcity value in strong Southeast markets projected to grow faster than the national average(1) • #1 deposit market share in Atlanta for banks under $50 billion in assets • #2 deposit market share in Jacksonville for banks under $50 billion in assets • #1 deposit market share in Savannah for banks under $50 billion in assets • Increasing deposit market share by 1% in Atlanta, Jacksonville and Savannah (our top three markets) would be $3.8 billion of additional deposits Population Growth in Our Markets Outpaces National Average Deposit market share according to the FDIC's Summary of Deposits as of June 30, 2026. 10.6% 10.1% 8.7% 6.3% 3.5% 3.6% 5.8% 4.9% 4.9% 3.5% 2.2% 2.0% -2.00% 2.00% 6.00% 10.00% 14.00% SC FL NC GA US AL 2020-2027 Population Change 2027-2032 Projected Change
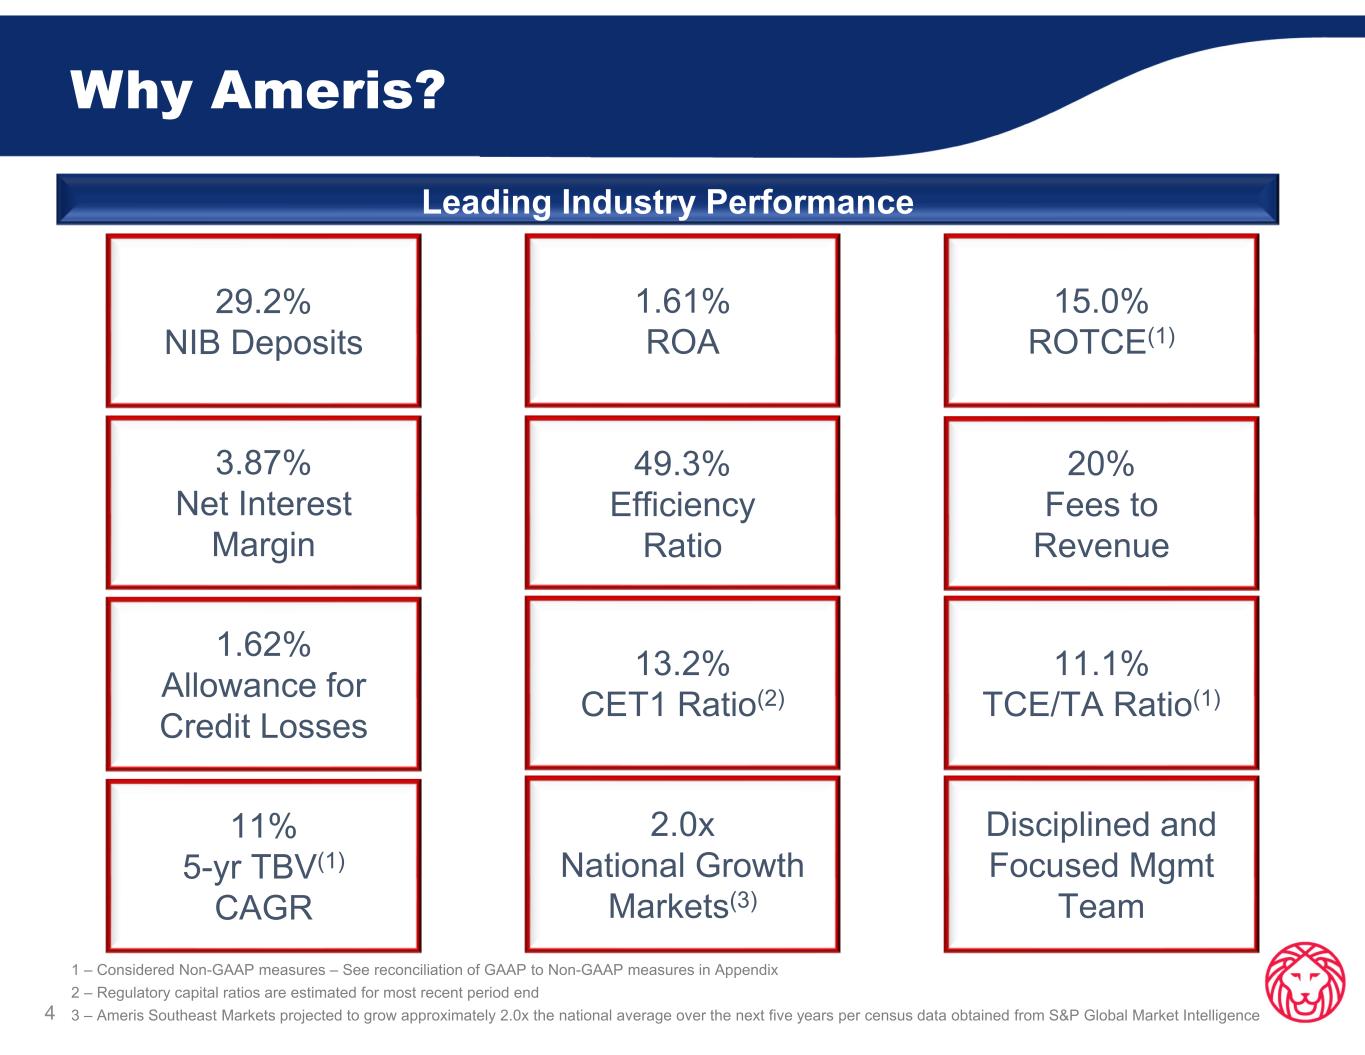
49.3% Efficiency Ratio 2.0x National Growth Markets(3) 1.62% Allowance for Credit Losses 13.2% CET1 Ratio(2) 11% 5-yr TBV(1) CAGR 15.0% ROTCE(1) 20% Fees to Revenue Disciplined and Focused Mgmt Team 11.1% TCE/TA Ratio(1) 29.2% NIB Deposits 3.87% Net Interest Margin 1.61% ROA 1 – Considered Non-GAAP measures – See reconciliation of GAAP to Non-GAAP measures in Appendix 2 – Regulatory capital ratios are estimated for most recent period end 3 – Ameris Southeast Markets projected to grow approximately 2.0x the national average over the next five years per census data obtained from S&P Global Market Intelligence4 Why Ameris? Leading Industry Performance
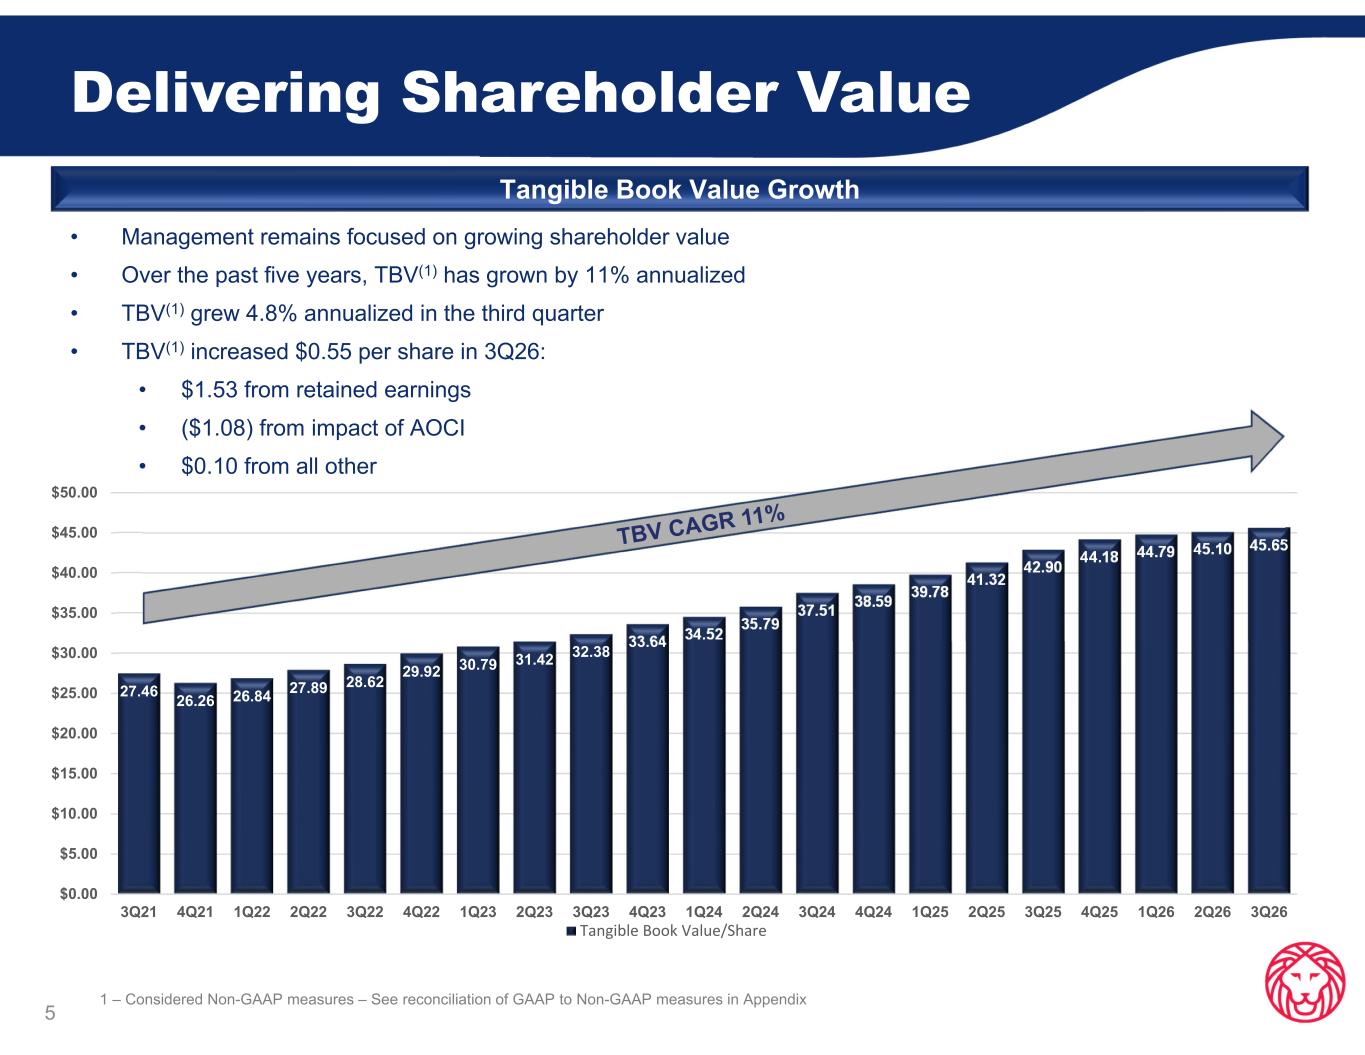
27.46 26.26 26.84 27.89 28.62 29.92 30.79 31.42 32.38 33.64 34.52 35.79 37.51 38.59 39.78 41.32 42.90 44.18 44.79 45.10 45.65 $0.00 $5.00 $10.00 $15.00 $20.00 $25.00 $30.00 $35.00 $40.00 $45.00 $50.00 3Q21 4Q21 1Q22 2Q22 3Q22 4Q22 1Q23 2Q23 3Q23 4Q23 1Q24 2Q24 3Q24 4Q24 1Q25 2Q25 3Q25 4Q25 1Q26 2Q26 3Q26 Tangible Book Value/Share Delivering Shareholder Value Tangible Book Value Growth 5 • Management remains focused on growing shareholder value • Over the past five years, TBV(1) has grown by 11% annualized • TBV(1) grew 4.8% annualized in the third quarter • TBV(1) increased $0.55 per share in 3Q26: • $1.53 from retained earnings • ($1.08) from impact of AOCI • $0.10 from all other 1 – Considered Non-GAAP measures – See reconciliation of GAAP to Non-GAAP measures in Appendix
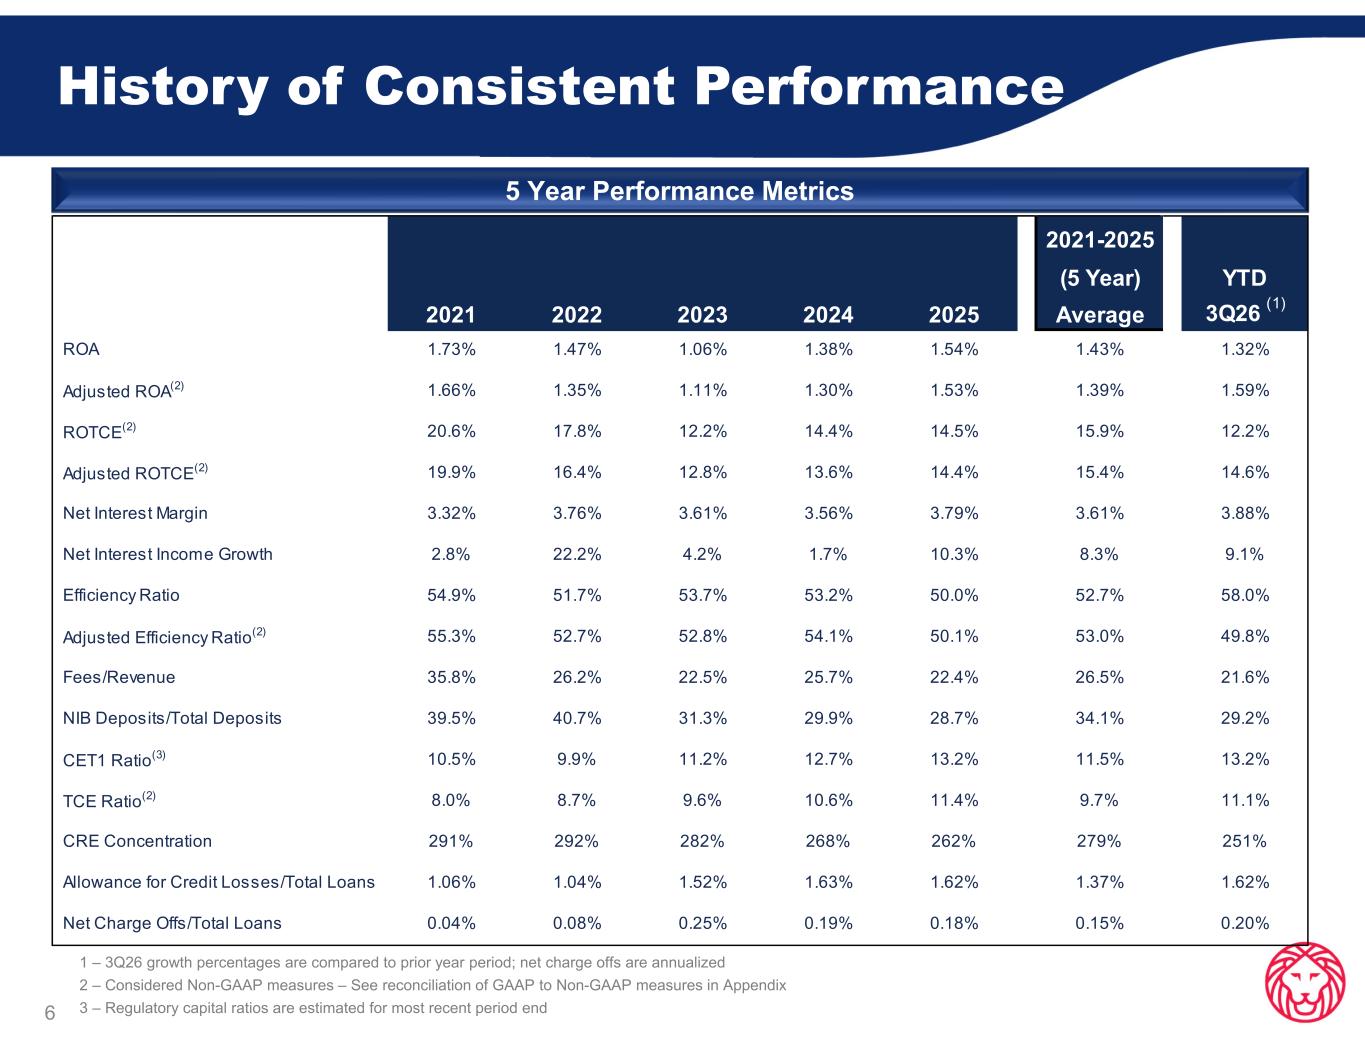
1 – 3Q26 growth percentages are compared to prior year period; net charge offs are annualized 2 – Considered Non-GAAP measures – See reconciliation of GAAP to Non-GAAP measures in Appendix 3 – Regulatory capital ratios are estimated for most recent period end6 History of Consistent Performance 5 Year Performance Metrics 2021-2025 (5 Year) YTD 2021 2022 2023 2024 2025 Average 3Q26 (1) ROA 1.73% 1.47% 1.06% 1.38% 1.54% 1.43% 1.32% Adjusted ROA(2) 1.66% 1.35% 1.11% 1.30% 1.53% 1.39% 1.59% ROTCE(2) 20.6% 17.8% 12.2% 14.4% 14.5% 15.9% 12.2% Adjusted ROTCE(2) 19.9% 16.4% 12.8% 13.6% 14.4% 15.4% 14.6% Net Interest Margin 3.32% 3.76% 3.61% 3.56% 3.79% 3.61% 3.88% Net Interest Income Growth 2.8% 22.2% 4.2% 1.7% 10.3% 8.3% 9.1% Efficiency Ratio 54.9% 51.7% 53.7% 53.2% 50.0% 52.7% 58.0% Adjusted Efficiency Ratio(2) 55.3% 52.7% 52.8% 54.1% 50.1% 53.0% 49.8% Fees/Revenue 35.8% 26.2% 22.5% 25.7% 22.4% 26.5% 21.6% NIB Deposits/Total Deposits 39.5% 40.7% 31.3% 29.9% 28.7% 34.1% 29.2% CET1 Ratio(3) 10.5% 9.9% 11.2% 12.7% 13.2% 11.5% 13.2% TCE Ratio(2) 8.0% 8.7% 9.6% 10.6% 11.4% 9.7% 11.1% CRE Concentration 291% 292% 282% 268% 262% 279% 251% Allowance for Credit Losses/Total Loans 1.06% 1.04% 1.52% 1.63% 1.62% 1.37% 1.62% Net Charge Offs/Total Loans 0.04% 0.08% 0.25% 0.19% 0.18% 0.15% 0.20%
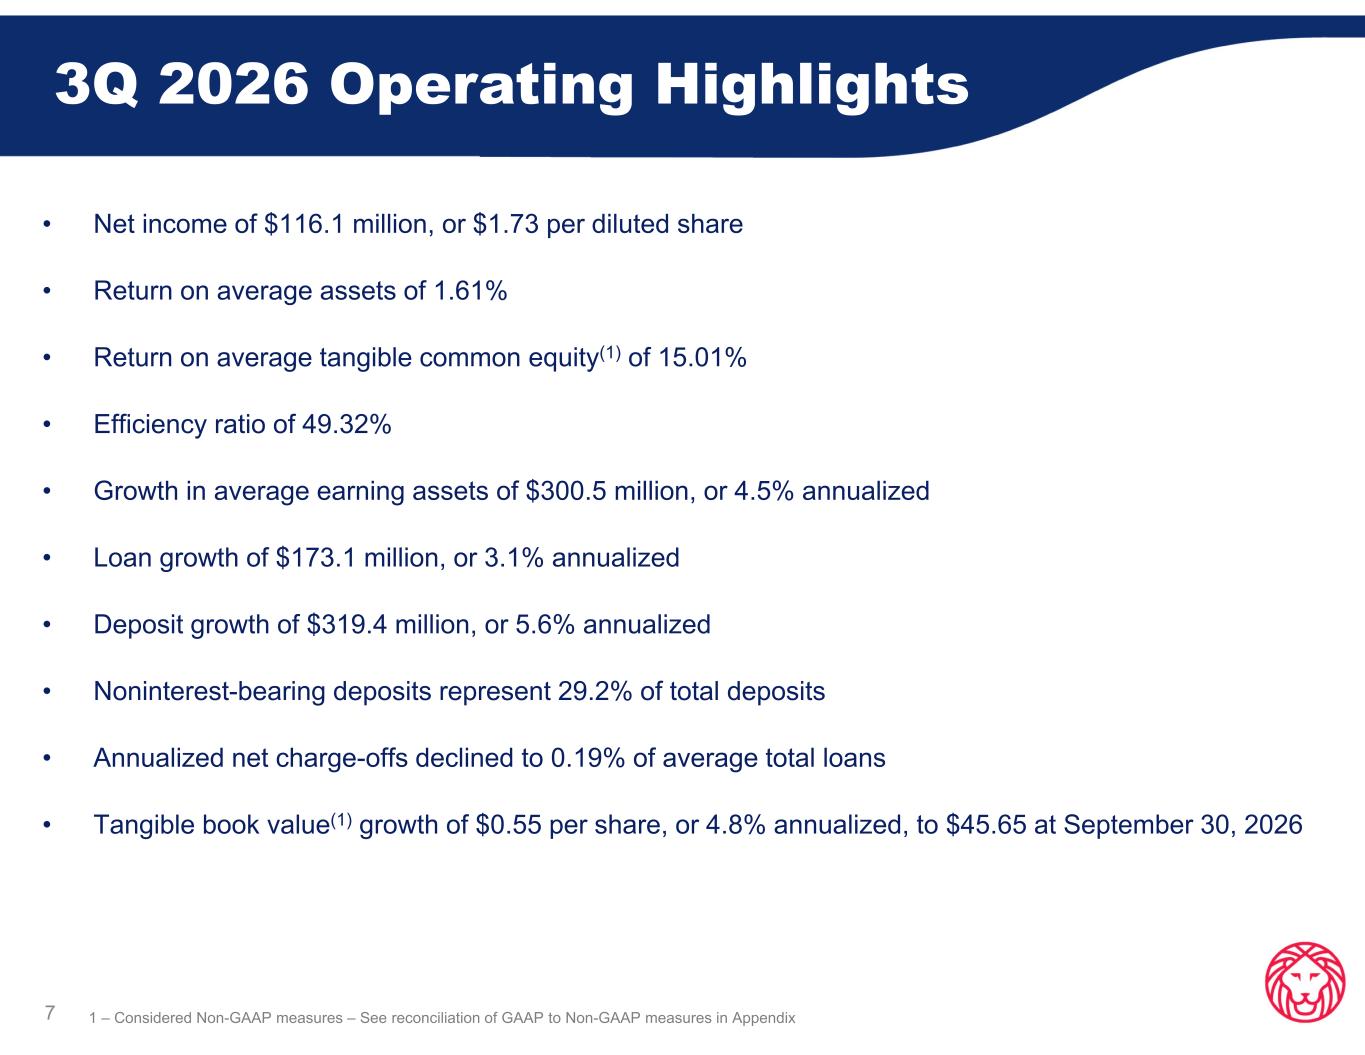
3Q 2026 Operating Highlights 7 • Net income of $116.1 million, or $1.73 per diluted share • Return on average assets of 1.61% • Return on average tangible common equity(1) of 15.01% • Efficiency ratio of 49.32% • Growth in average earning assets of $300.5 million, or 4.5% annualized • Loan growth of $173.1 million, or 3.1% annualized • Deposit growth of $319.4 million, or 5.6% annualized • Noninterest-bearing deposits represent 29.2% of total deposits • Annualized net charge-offs declined to 0.19% of average total loans • Tangible book value(1) growth of $0.55 per share, or 4.8% annualized, to $45.65 at September 30, 2026 1 – Considered Non-GAAP measures – See reconciliation of GAAP to Non-GAAP measures in Appendix
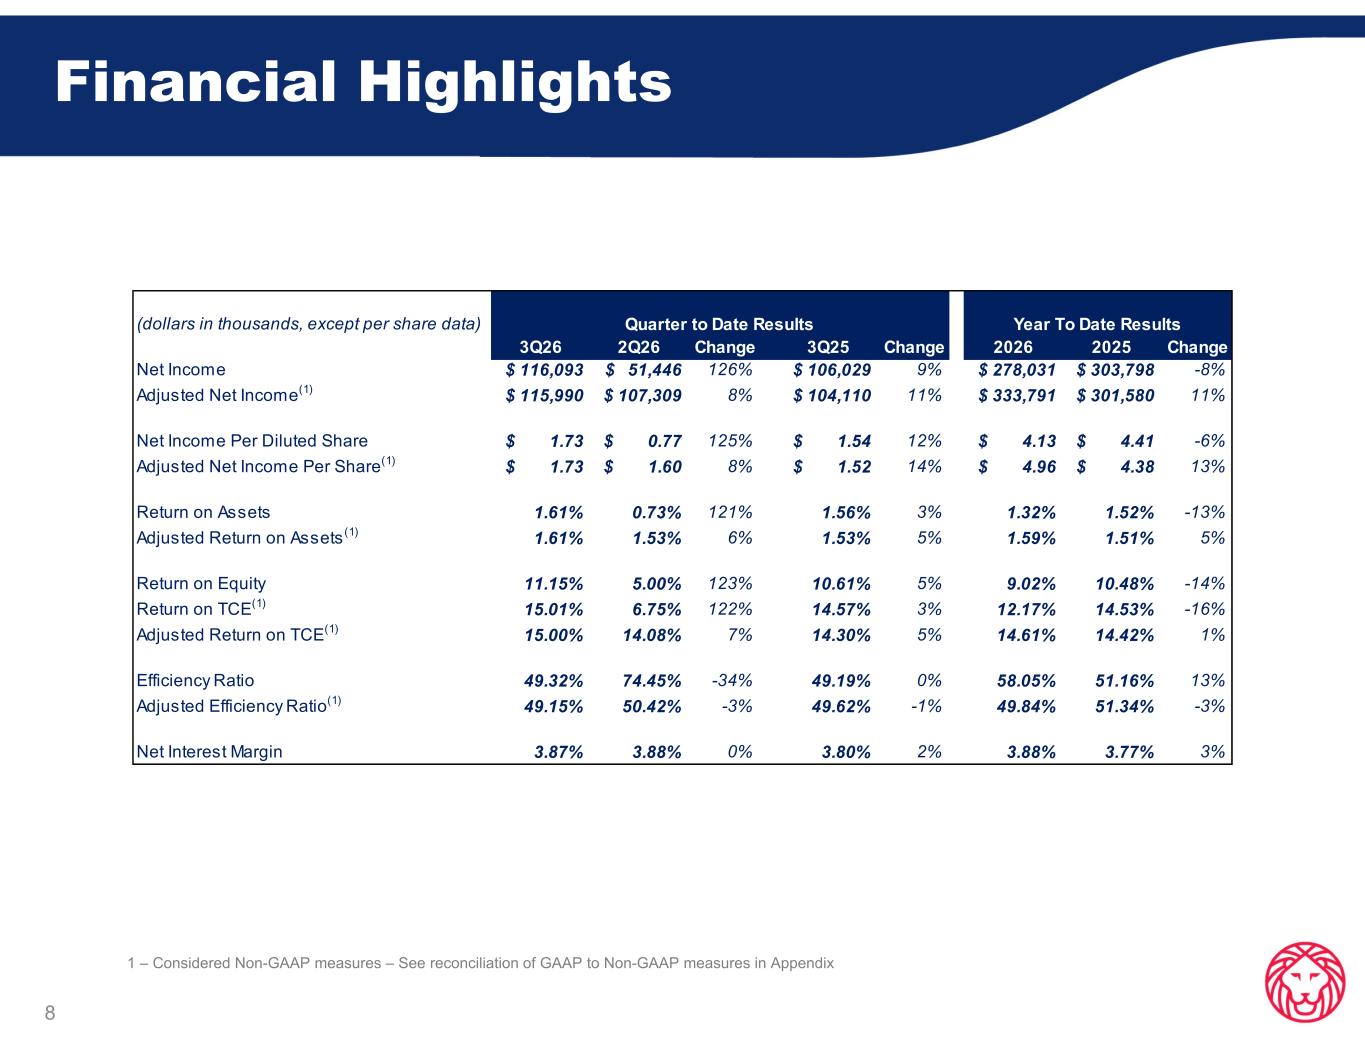
Financial Highlights 8 1 – Considered Non-GAAP measures – See reconciliation of GAAP to Non-GAAP measures in Appendix (dollars in thousands, except per share data) 3Q26 2Q26 Change 3Q25 Change 2026 2025 Change Net Income $ 116,093 $ 51,446 126% $ 106,029 9% $ 278,031 $ 303,798 -8% Adjusted Net Income(1) $ 115,990 $ 107,309 8% $ 104,110 11% $ 333,791 $ 301,580 11% Net Income Per Diluted Share $ 1.73 $ 0.77 125% $ 1.54 12% $ 4.13 $ 4.41 -6% Adjusted Net Income Per Share(1) $ 1.73 $ 1.60 8% $ 1.52 14% $ 4.96 $ 4.38 13% Return on Assets 1.61% 0.73% 121% 1.56% 3% 1.32% 1.52% -13% Adjusted Return on Assets(1) 1.61% 1.53% 6% 1.53% 5% 1.59% 1.51% 5% Return on Equity 11.15% 5.00% 123% 10.61% 5% 9.02% 10.48% -14% Return on TCE(1) 15.01% 6.75% 122% 14.57% 3% 12.17% 14.53% -16% Adjusted Return on TCE(1) 15.00% 14.08% 7% 14.30% 5% 14.61% 14.42% 1% Efficiency Ratio 49.32% 74.45% -34% 49.19% 0% 58.05% 51.16% 13% Adjusted Efficiency Ratio(1) 49.15% 50.42% -3% 49.62% -1% 49.84% 51.34% -3% Net Interest Margin 3.87% 3.88% 0% 3.80% 2% 3.88% 3.77% 3% Quarter to Date Results Year To Date Results
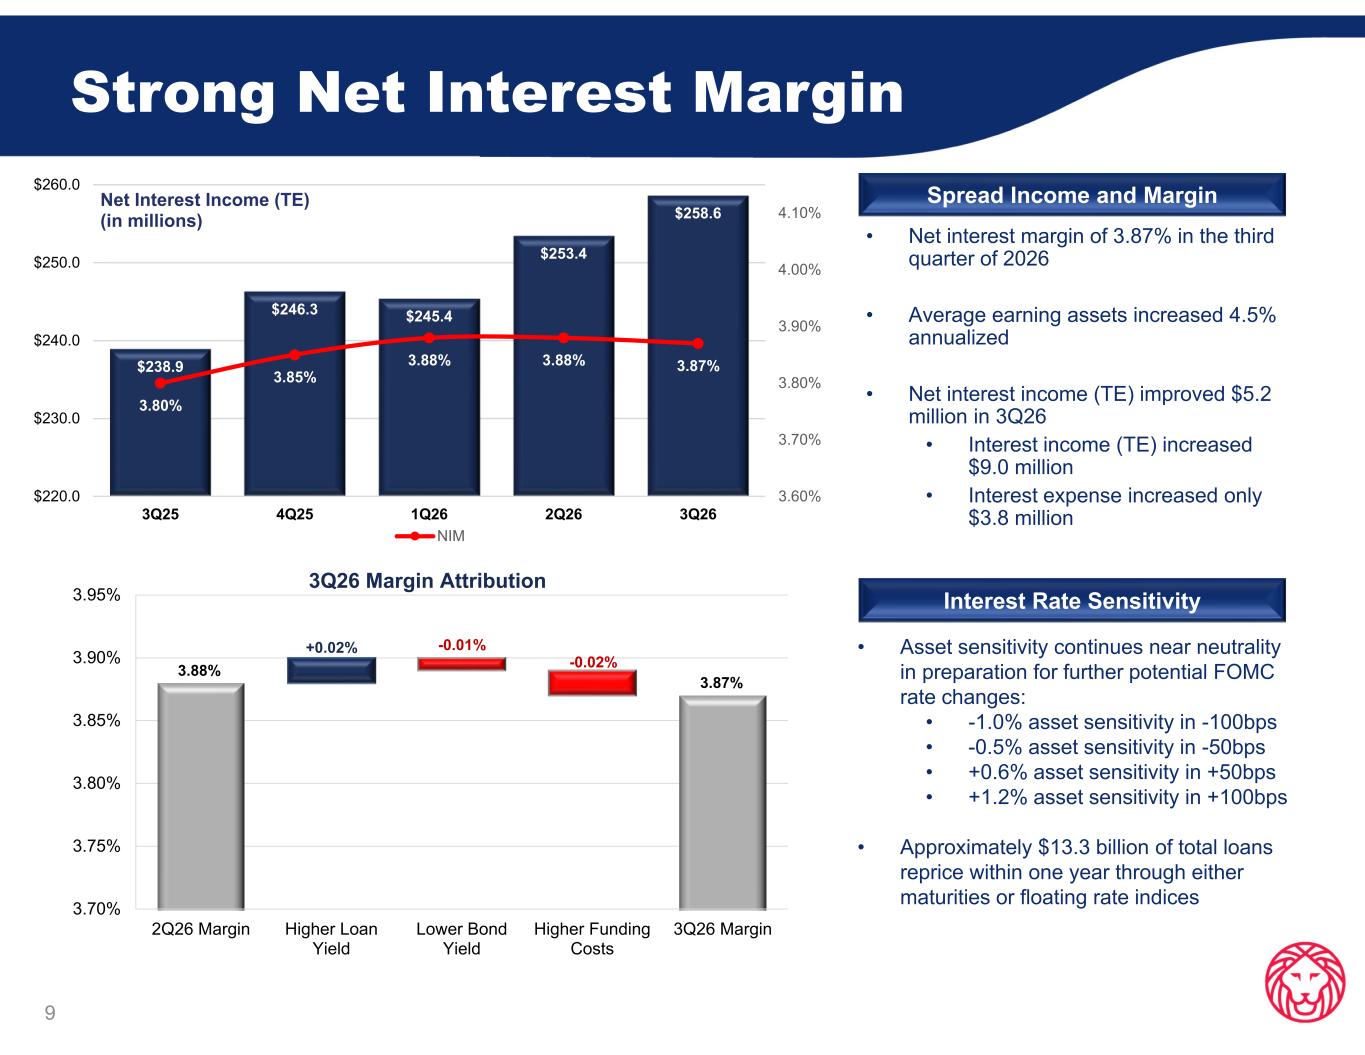
Strong Net Interest Margin 9 • Net interest margin of 3.87% in the third quarter of 2026 • Average earning assets increased 4.5% annualized • Net interest income (TE) improved $5.2 million in 3Q26 • Interest income (TE) increased $9.0 million • Interest expense increased only $3.8 million Spread Income and Margin Interest Rate Sensitivity • Asset sensitivity continues near neutrality in preparation for further potential FOMC rate changes: • -1.0% asset sensitivity in -100bps • -0.5% asset sensitivity in -50bps • +0.6% asset sensitivity in +50bps • +1.2% asset sensitivity in +100bps • Approximately $13.3 billion of total loans reprice within one year through either maturities or floating rate indices $238.9 $246.3 $245.4 $253.4 $258.6 3.80% 3.85% 3.88% 3.88% 3.87% 3.60% 3.70% 3.80% 3.90% 4.00% 4.10% $220.0 $230.0 $240.0 $250.0 $260.0 3Q25 4Q25 1Q26 2Q26 3Q26 Net Interest Income (TE) (in millions) NIM +0.02% -0.01% -0.02% 3.87% 3.88% 3.70% 3.75% 3.80% 3.85% 3.90% 3.95% 2Q26 Margin Higher Loan Yield Lower Bond Yield Higher Funding Costs 3Q26 Margin 3Q26 Margin Attribution
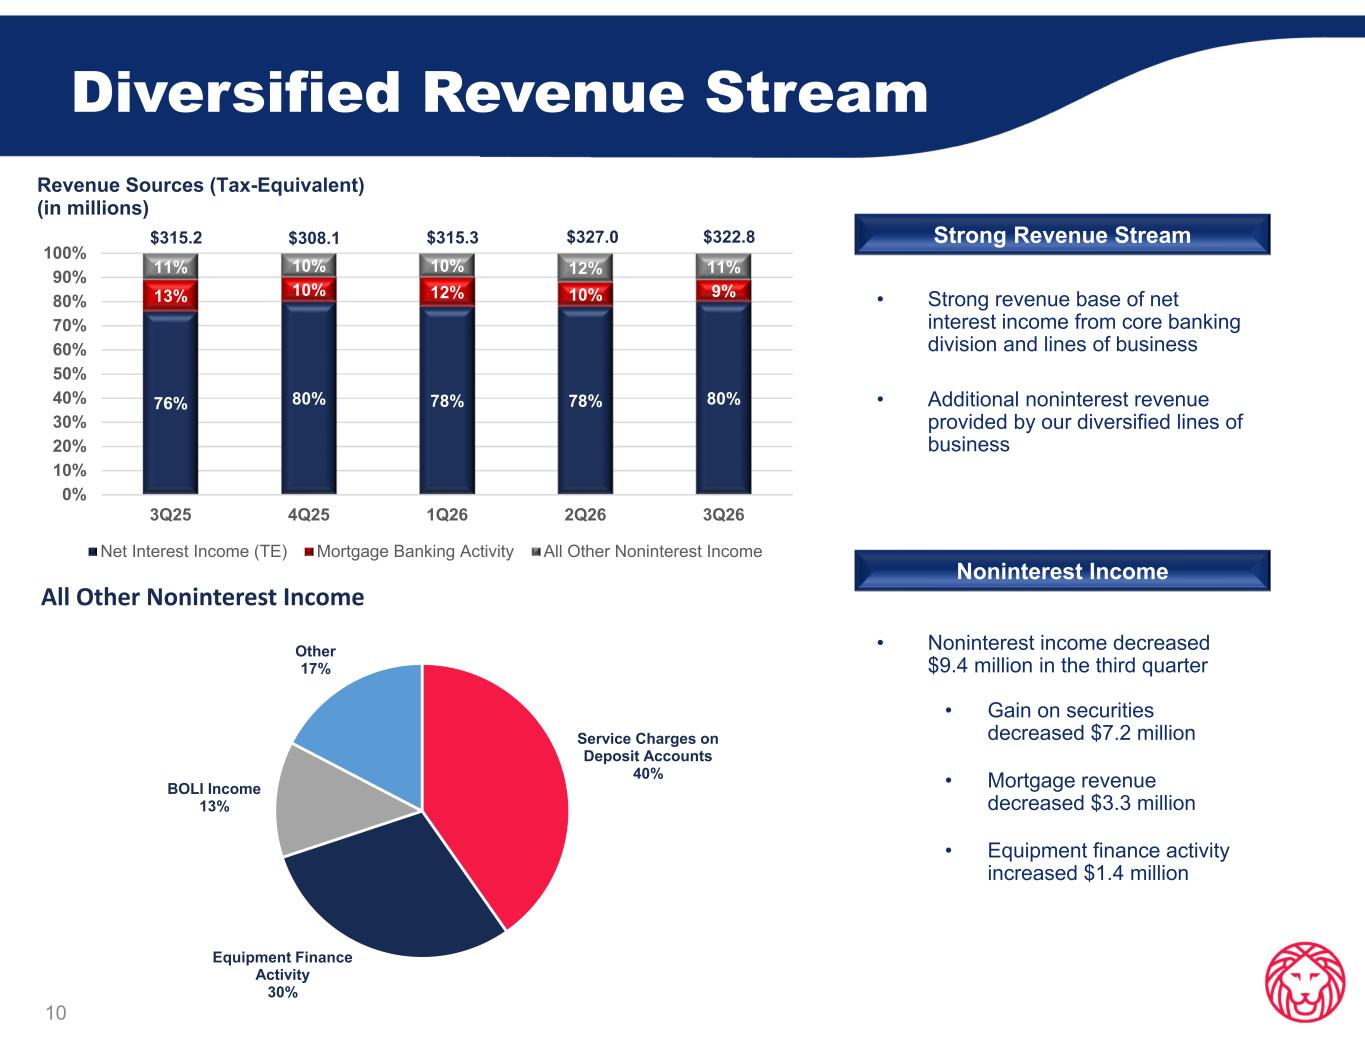
Diversified Revenue Stream 10 • Strong revenue base of net interest income from core banking division and lines of business • Additional noninterest revenue provided by our diversified lines of business Noninterest Income • Noninterest income decreased $9.4 million in the third quarter • Gain on securities decreased $7.2 million • Mortgage revenue decreased $3.3 million • Equipment finance activity increased $1.4 million Strong Revenue Stream Service Charges on Deposit Accounts 40% Equipment Finance Activity 30% BOLI Income 13% Other 17% All Other Noninterest Income 76% 80% 78% 78% 80% 13% 10% 12% 10% 9% 11% 10% 10% 12% 11% $315.2 $308.1 $315.3 $327.0 $322.8 0% 10% 20% 30% 40% 50% 60% 70% 80% 90% 100% 3Q25 4Q25 1Q26 2Q26 3Q26 Revenue Sources (Tax-Equivalent) (in millions) Net Interest Income (TE) Mortgage Banking Activity All Other Noninterest Income
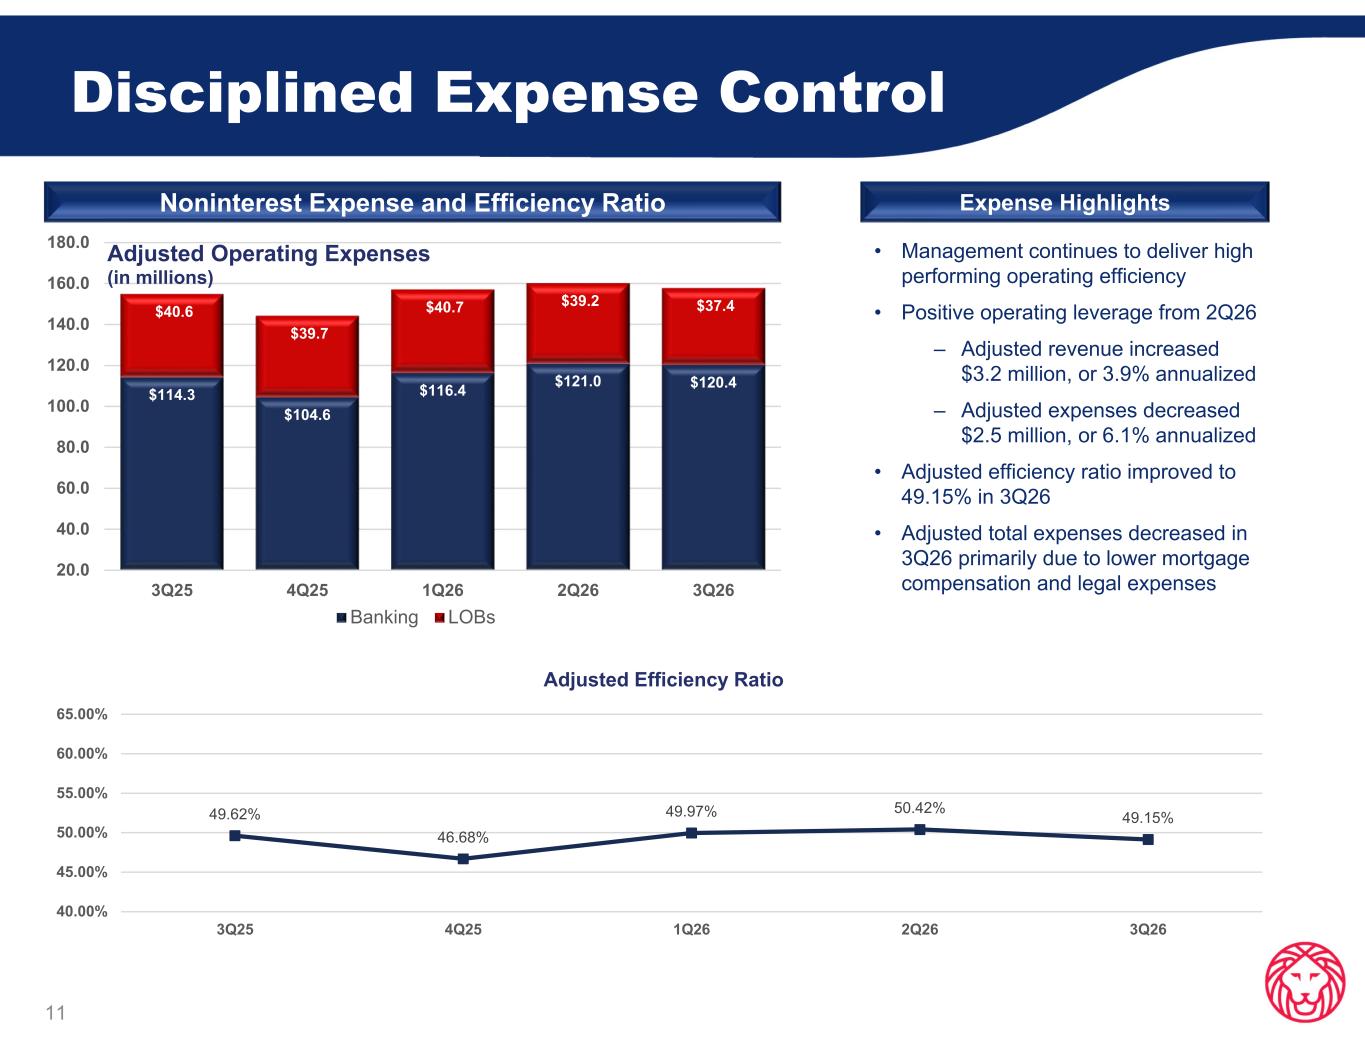
Disciplined Expense Control Noninterest Expense and Efficiency Ratio Expense Highlights 11 • Management continues to deliver high performing operating efficiency • Positive operating leverage from 2Q26 – Adjusted revenue increased $3.2 million, or 3.9% annualized – Adjusted expenses decreased $2.5 million, or 6.1% annualized • Adjusted efficiency ratio improved to 49.15% in 3Q26 • Adjusted total expenses decreased in 3Q26 primarily due to lower mortgage compensation and legal expenses 49.62% 46.68% 49.97% 50.42% 49.15% 40.00% 45.00% 50.00% 55.00% 60.00% 65.00% 3Q25 4Q25 1Q26 2Q26 3Q26 Adjusted Efficiency Ratio $114.3 $104.6 $116.4 $121.0 $120.4 $40.6 $39.7 $40.7 $39.2 $37.4 20.0 40.0 60.0 80.0 100.0 120.0 140.0 160.0 180.0 3Q25 4Q25 1Q26 2Q26 3Q26 Adjusted Operating Expenses (in millions) Banking LOBs
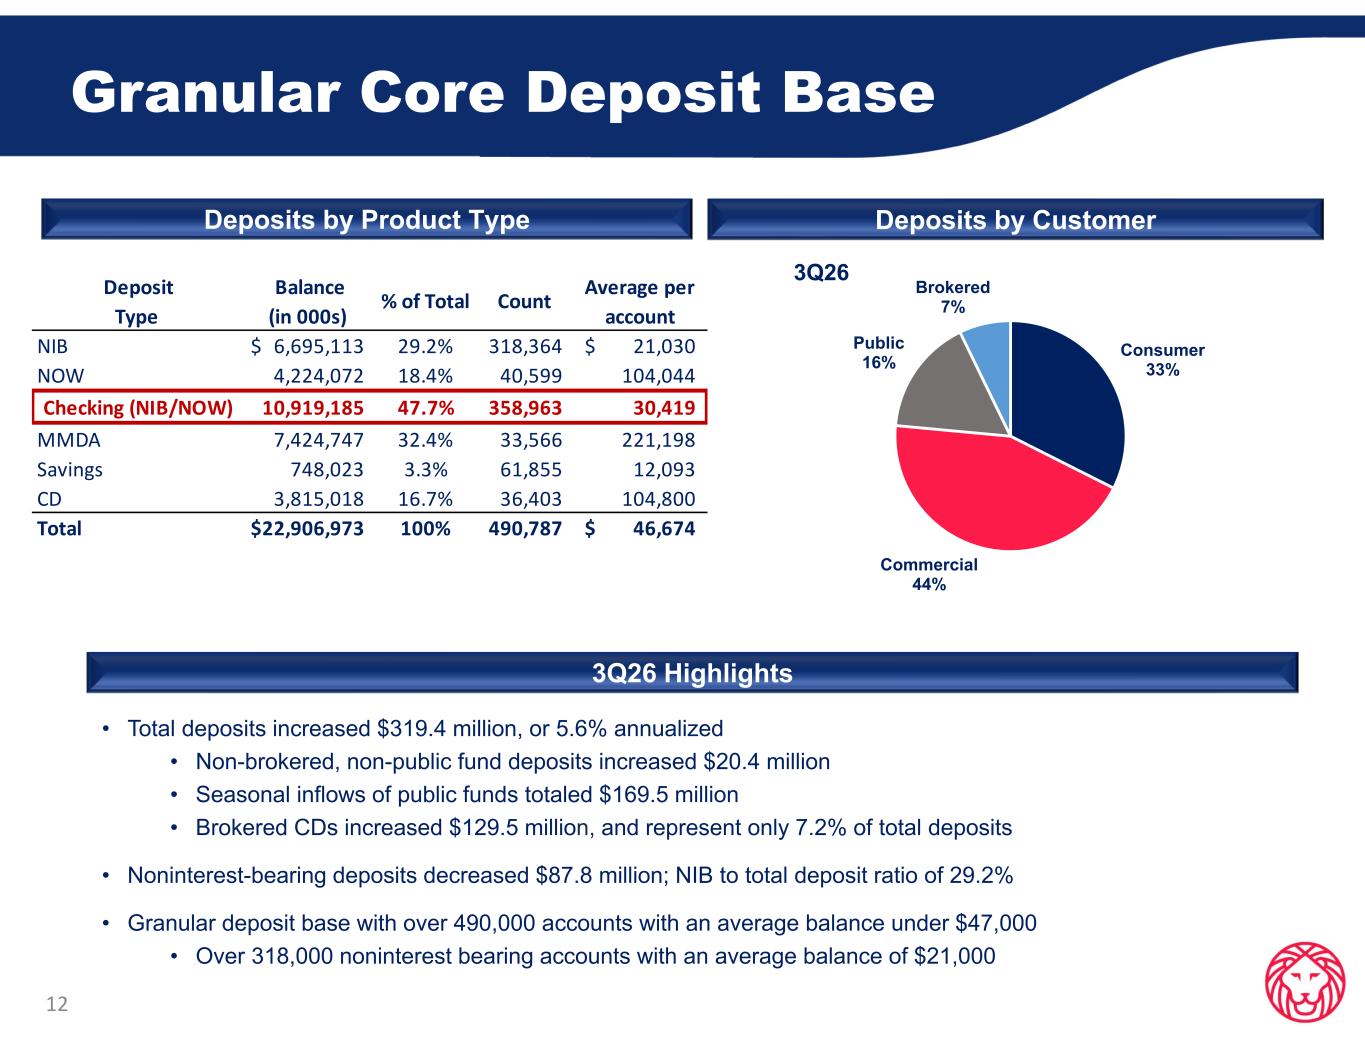
Granular Core Deposit Base 12 Deposits by Product Type • Total deposits increased $319.4 million, or 5.6% annualized • Non-brokered, non-public fund deposits increased $20.4 million • Seasonal inflows of public funds totaled $169.5 million • Brokered CDs increased $129.5 million, and represent only 7.2% of total deposits • Noninterest-bearing deposits decreased $87.8 million; NIB to total deposit ratio of 29.2% • Granular deposit base with over 490,000 accounts with an average balance under $47,000 • Over 318,000 noninterest bearing accounts with an average balance of $21,000 3Q26 Highlights Deposits by Customer Consumer 33% Commercial 44% Public 16% Brokered 7% 3Q26 Deposit Type Balance (in 000s) % of Total Count Average per account NIB 6,695,113$ 29.2% 318,364 21,030$ NOW 4,224,072 18.4% 40,599 104,044 Checking (NIB/NOW) 10,919,185 47.7% 358,963 30,419 MMDA 7,424,747 32.4% 33,566 221,198 Savings 748,023 3.3% 61,855 12,093 CD 3,815,018 16.7% 36,403 104,800 Total 22,906,973$ 100% 490,787 46,674$
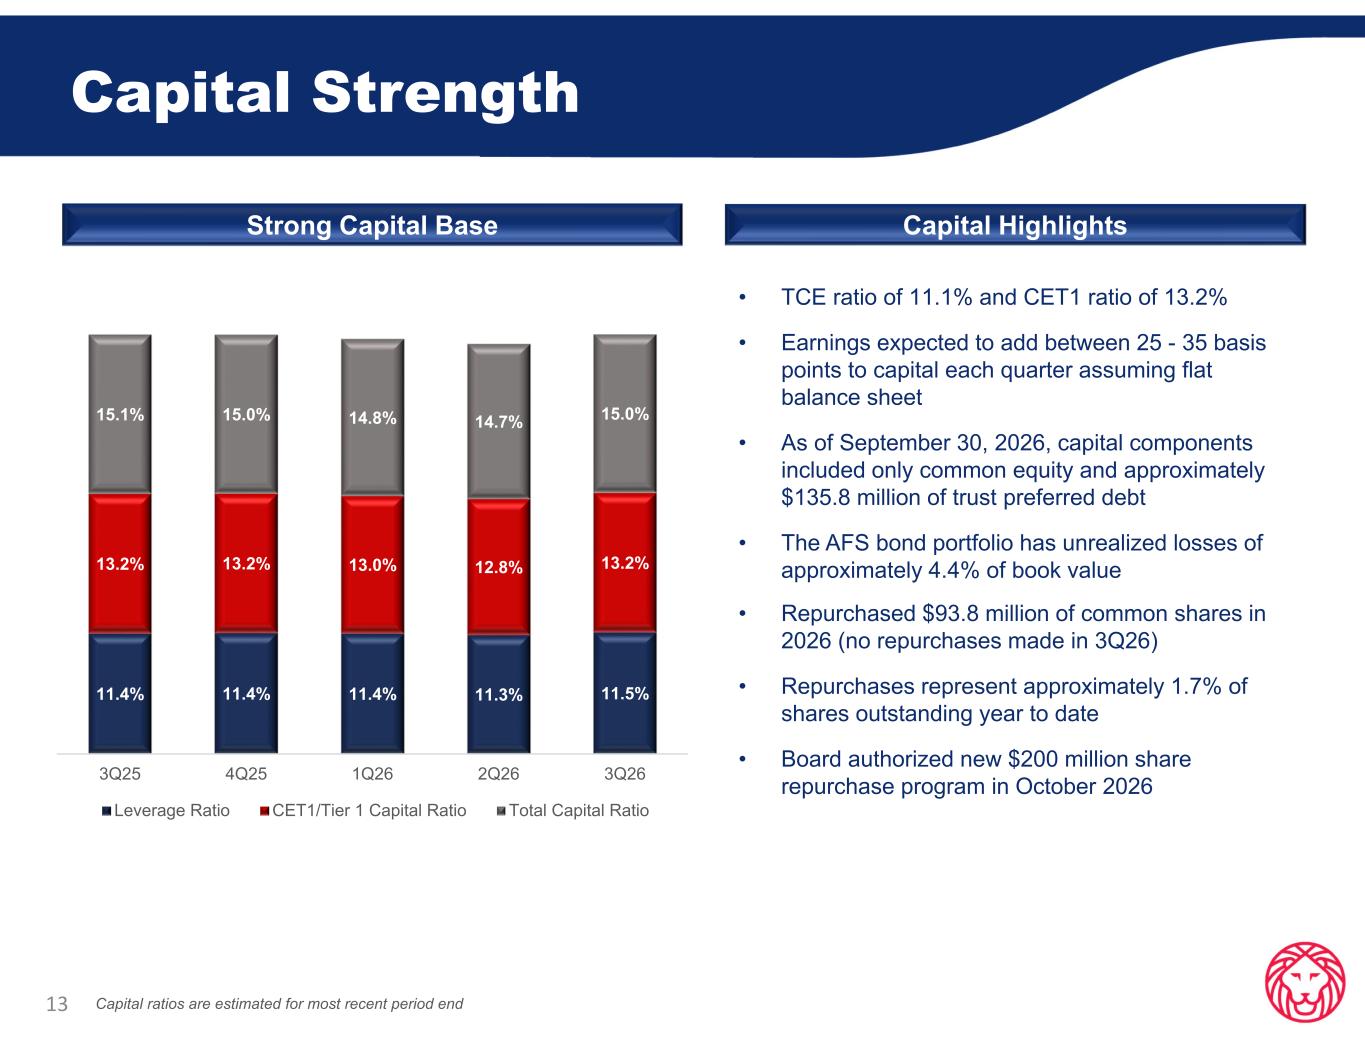
Capital Strength 13 • TCE ratio of 11.1% and CET1 ratio of 13.2% • Earnings expected to add between 25 - 35 basis points to capital each quarter assuming flat balance sheet • As of September 30, 2026, capital components included only common equity and approximately $135.8 million of trust preferred debt • The AFS bond portfolio has unrealized losses of approximately 4.4% of book value • Repurchased $93.8 million of common shares in 2026 (no repurchases made in 3Q26) • Repurchases represent approximately 1.7% of shares outstanding year to date • Board authorized new $200 million share repurchase program in October 2026 Capital ratios are estimated for most recent period end Strong Capital Base Capital Highlights 11.4% 11.4% 11.4% 11.3% 11.5% 13.2% 13.2% 13.0% 12.8% 13.2% 15.1% 15.0% 14.8% 14.7% 15.0% 3Q25 4Q25 1Q26 2Q26 3Q26 Leverage Ratio CET1/Tier 1 Capital Ratio Total Capital Ratio
Loan Diversification and Credit Quality
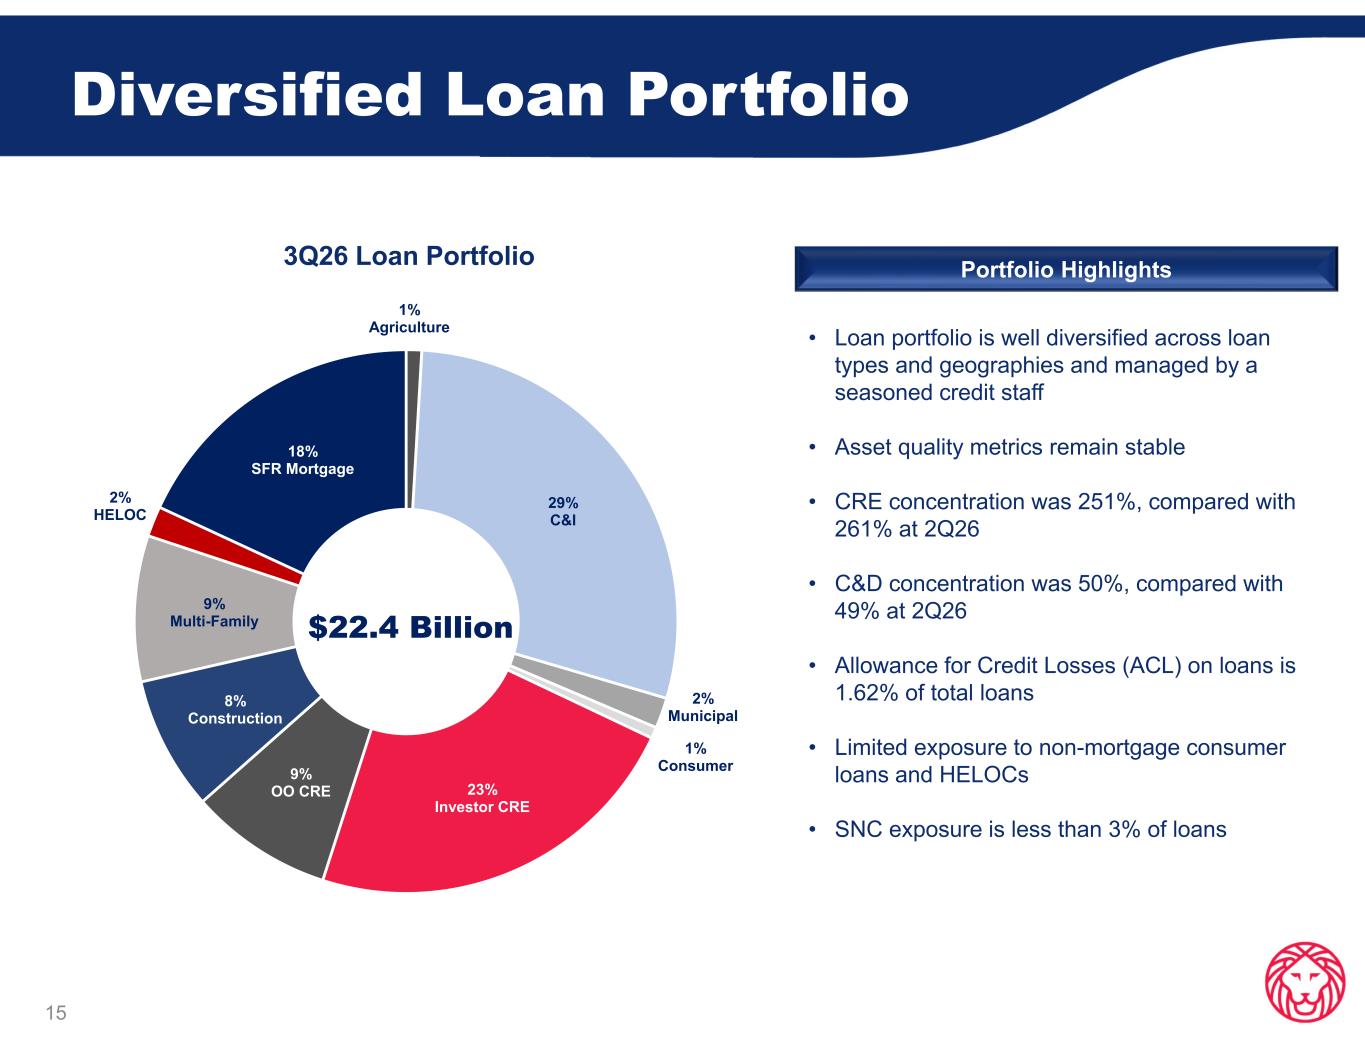
Diversified Loan Portfolio 3Q26 Loan Portfolio 15 • Loan portfolio is well diversified across loan types and geographies and managed by a seasoned credit staff • Asset quality metrics remain stable • CRE concentration was 251%, compared with 261% at 2Q26 • C&D concentration was 50%, compared with 49% at 2Q26 • Allowance for Credit Losses (ACL) on loans is 1.62% of total loans • Limited exposure to non-mortgage consumer loans and HELOCs • SNC exposure is less than 3% of loans Portfolio Highlights 1% Agriculture 29% C&I 2% Municipal 1% Consumer 23% Investor CRE 9% OO CRE 8% Construction 9% Multi-Family 2% HELOC 18% SFR Mortgage $22.4 Billion
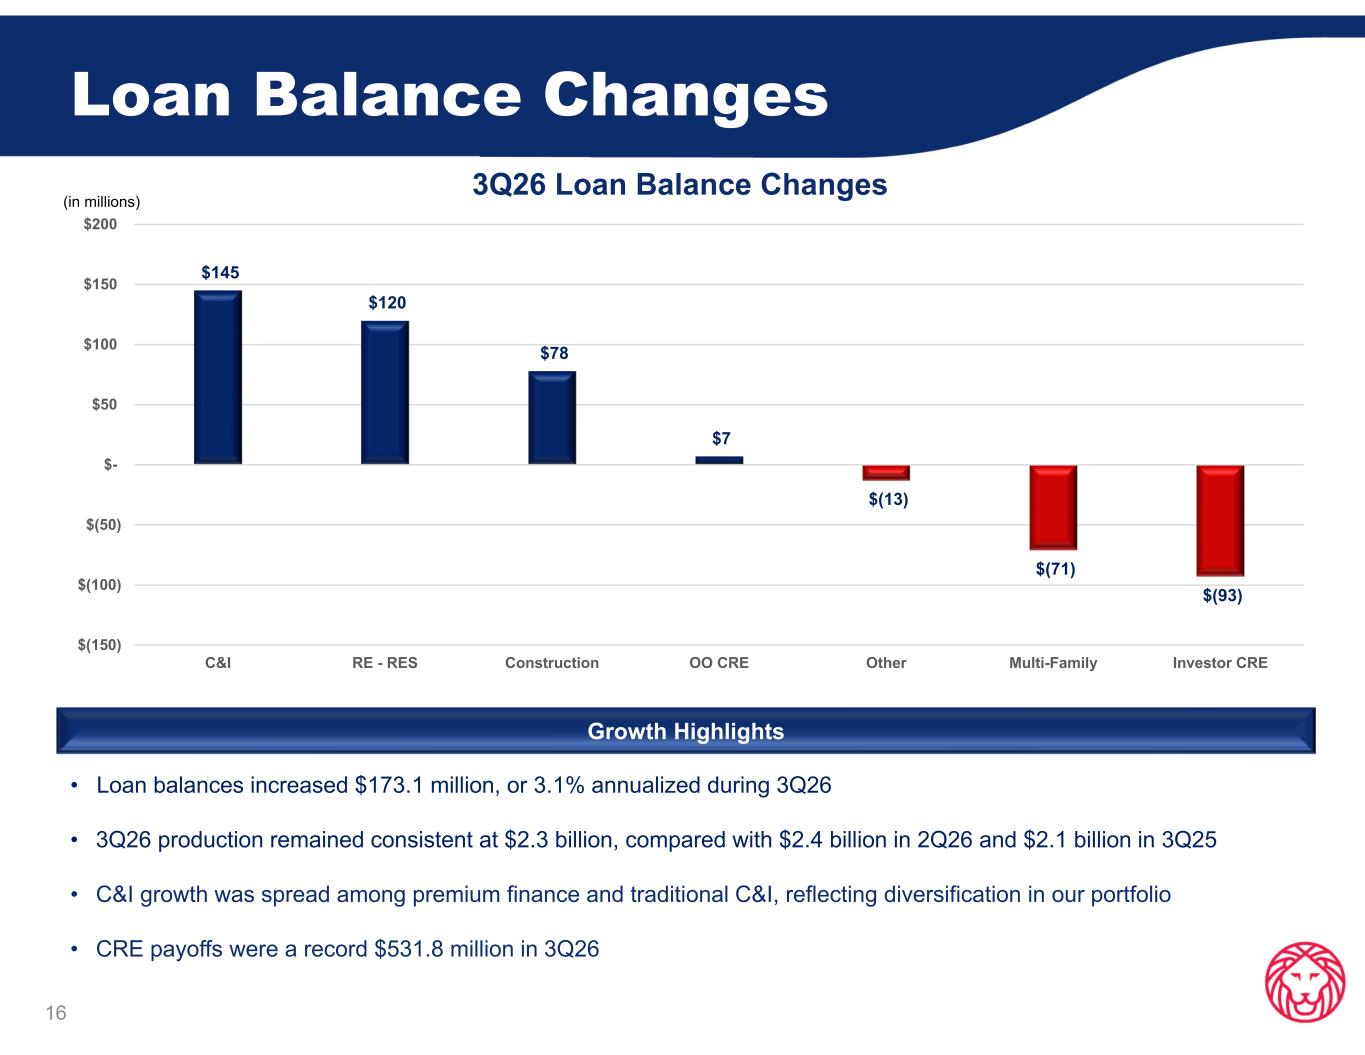
Loan Balance Changes 3Q26 Loan Balance Changes 16 • Loan balances increased $173.1 million, or 3.1% annualized during 3Q26 • 3Q26 production remained consistent at $2.3 billion, compared with $2.4 billion in 2Q26 and $2.1 billion in 3Q25 • C&I growth was spread among premium finance and traditional C&I, reflecting diversification in our portfolio • CRE payoffs were a record $531.8 million in 3Q26 (in millions) Growth Highlights $145 $120 $78 $7 $(13) $(71) $(93) $(150) $(100) $(50) $- $50 $100 $150 $200 C&I RE - RES Construction OO CRE Other Multi-Family Investor CRE
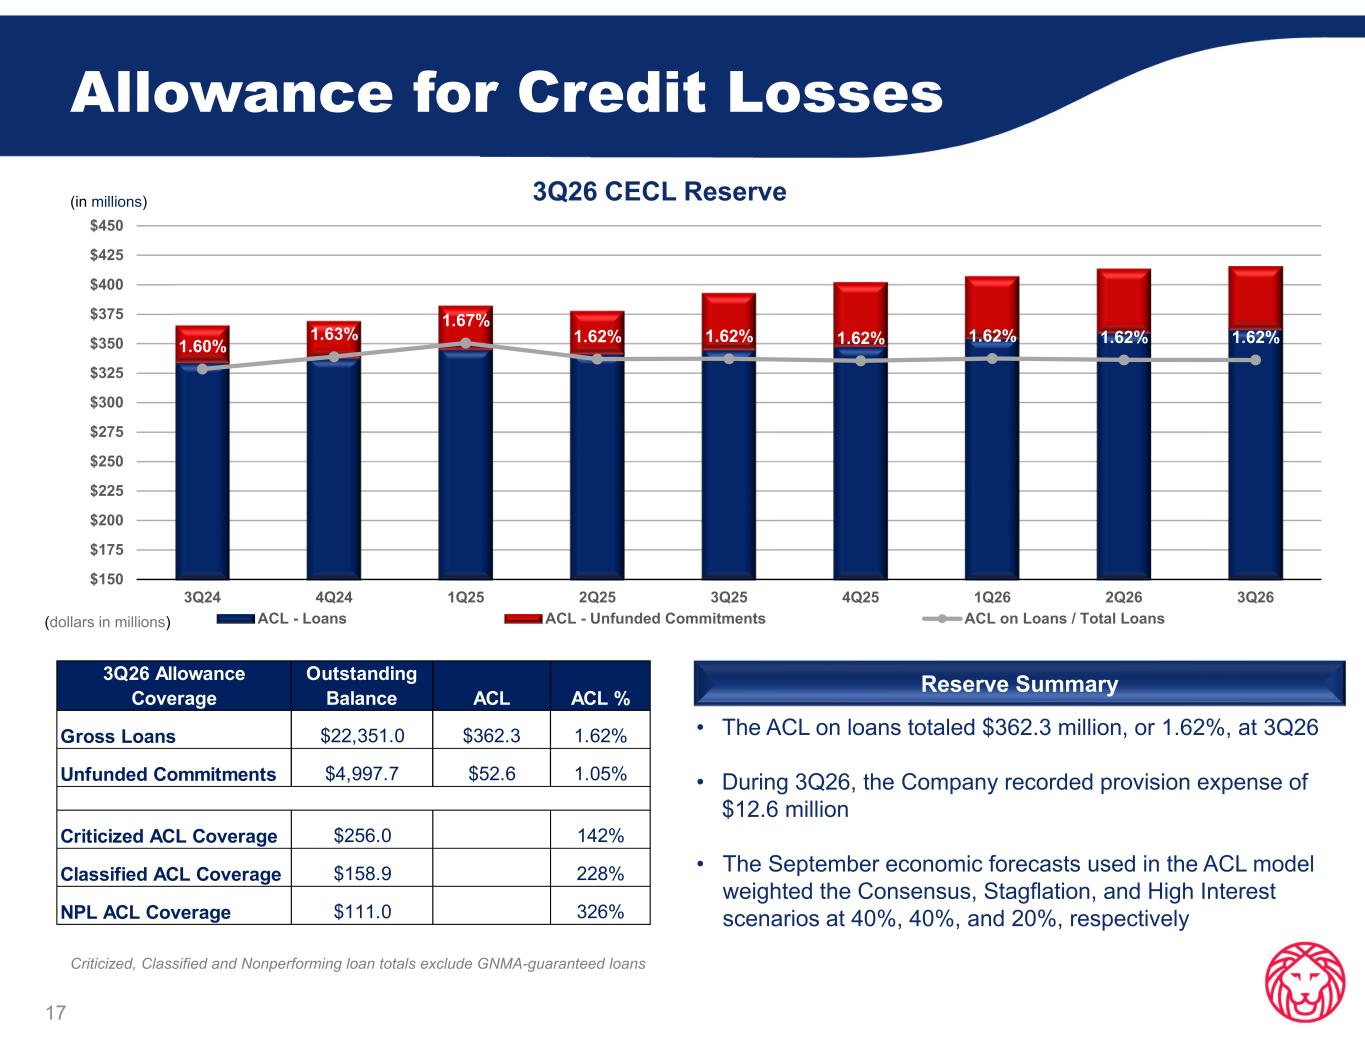
Allowance for Credit Losses 17 • The ACL on loans totaled $362.3 million, or 1.62%, at 3Q26 • During 3Q26, the Company recorded provision expense of $12.6 million • The September economic forecasts used in the ACL model weighted the Consensus, Stagflation, and High Interest scenarios at 40%, 40%, and 20%, respectively 3Q26 CECL Reserve Reserve Summary (in millions) (dollars in millions) Criticized, Classified and Nonperforming loan totals exclude GNMA-guaranteed loans 1.60% 1.63% 1.67% 1.62% 1.62% 1.62% 1.62% 1.62% 1.62% 1.00% 1.20% 1.40% 1.60% 1.80% 2.00% $150 $175 $200 $225 $250 $275 $300 $325 $350 $375 $400 $425 $450 3Q24 4Q24 1Q25 2Q25 3Q25 4Q25 1Q26 2Q26 3Q26 ACL - Loans ACL - Unfunded Commitments ACL on Loans / Total Loans 3Q26 Allowance Coverage Outstanding Balance ACL ACL % Gross Loans $22,351.0 $362.3 1.62% Unfunded Commitments $4,997.7 $52.6 1.05% Criticized ACL Coverage $256.0 142% Classified ACL Coverage $158.9 228% NPL ACL Coverage $111.0 326%
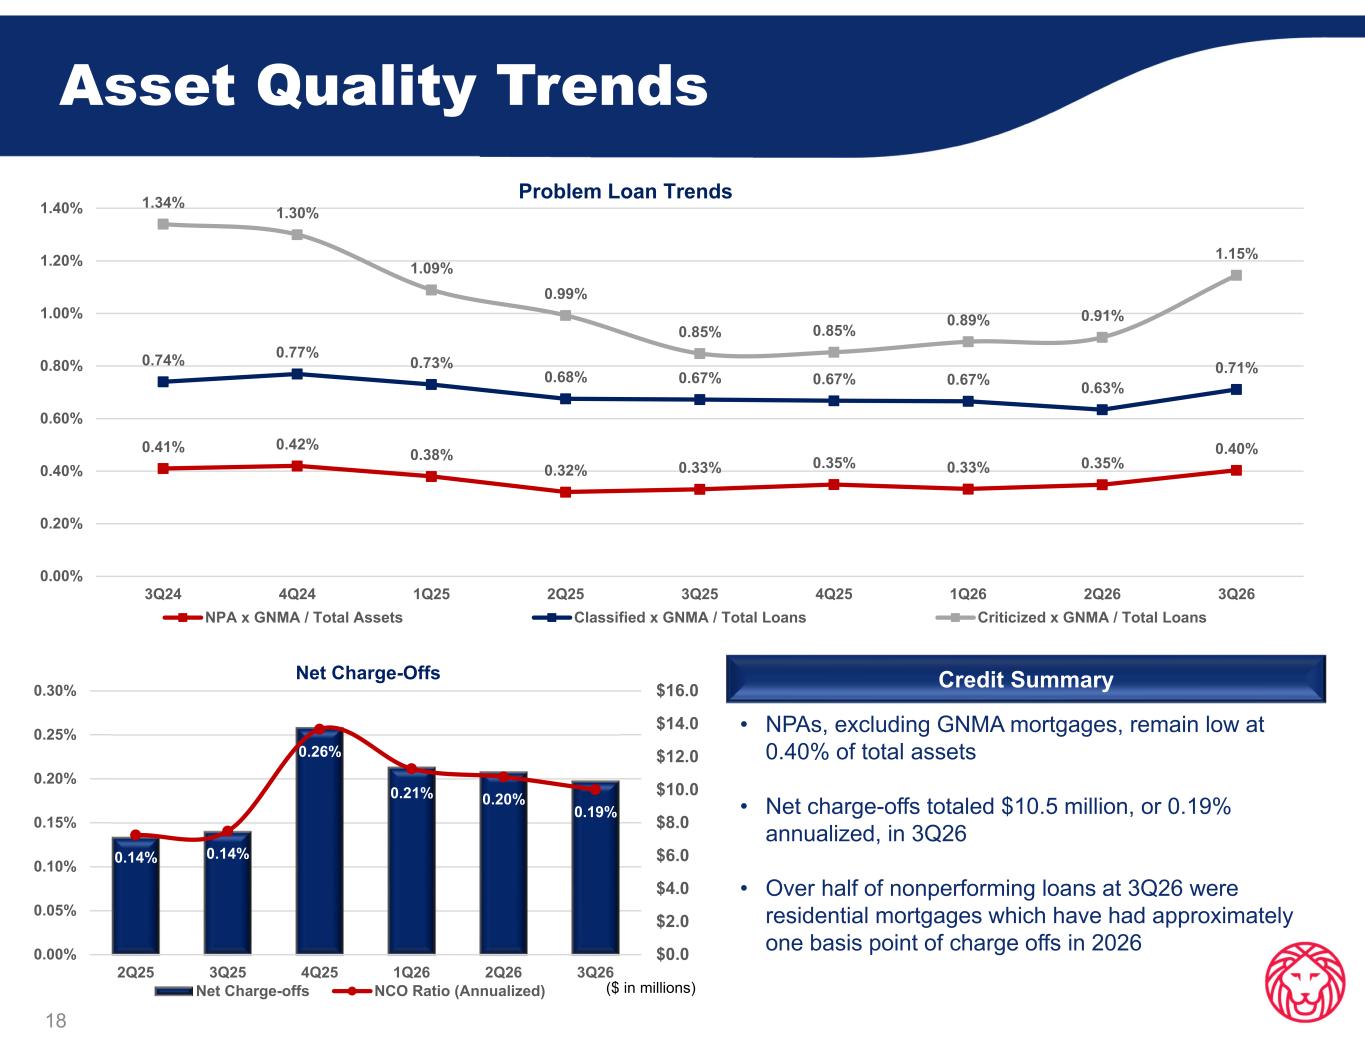
Asset Quality Trends 18 • NPAs, excluding GNMA mortgages, remain low at 0.40% of total assets • Net charge-offs totaled $10.5 million, or 0.19% annualized, in 3Q26 • Over half of nonperforming loans at 3Q26 were residential mortgages which have had approximately one basis point of charge offs in 2026 Credit Summary ($ in millions) 0.14% 0.14% 0.26% 0.21% 0.20% 0.19% $0.0 $2.0 $4.0 $6.0 $8.0 $10.0 $12.0 $14.0 $16.0 0.00% 0.05% 0.10% 0.15% 0.20% 0.25% 0.30% 2Q25 3Q25 4Q25 1Q26 2Q26 3Q26 Net Charge-Offs Net Charge-offs NCO Ratio (Annualized) 0.41% 0.42% 0.38% 0.32% 0.33% 0.35% 0.33% 0.35% 0.40% 0.74% 0.77% 0.73% 0.68% 0.67% 0.67% 0.67% 0.63% 0.71% 1.34% 1.30% 1.09% 0.99% 0.85% 0.85% 0.89% 0.91% 1.15% 0.00% 0.20% 0.40% 0.60% 0.80% 1.00% 1.20% 1.40% 3Q24 4Q24 1Q25 2Q25 3Q25 4Q25 1Q26 2Q26 3Q26 Problem Loan Trends NPA x GNMA / Total Assets Classified x GNMA / Total Loans Criticized x GNMA / Total Loans
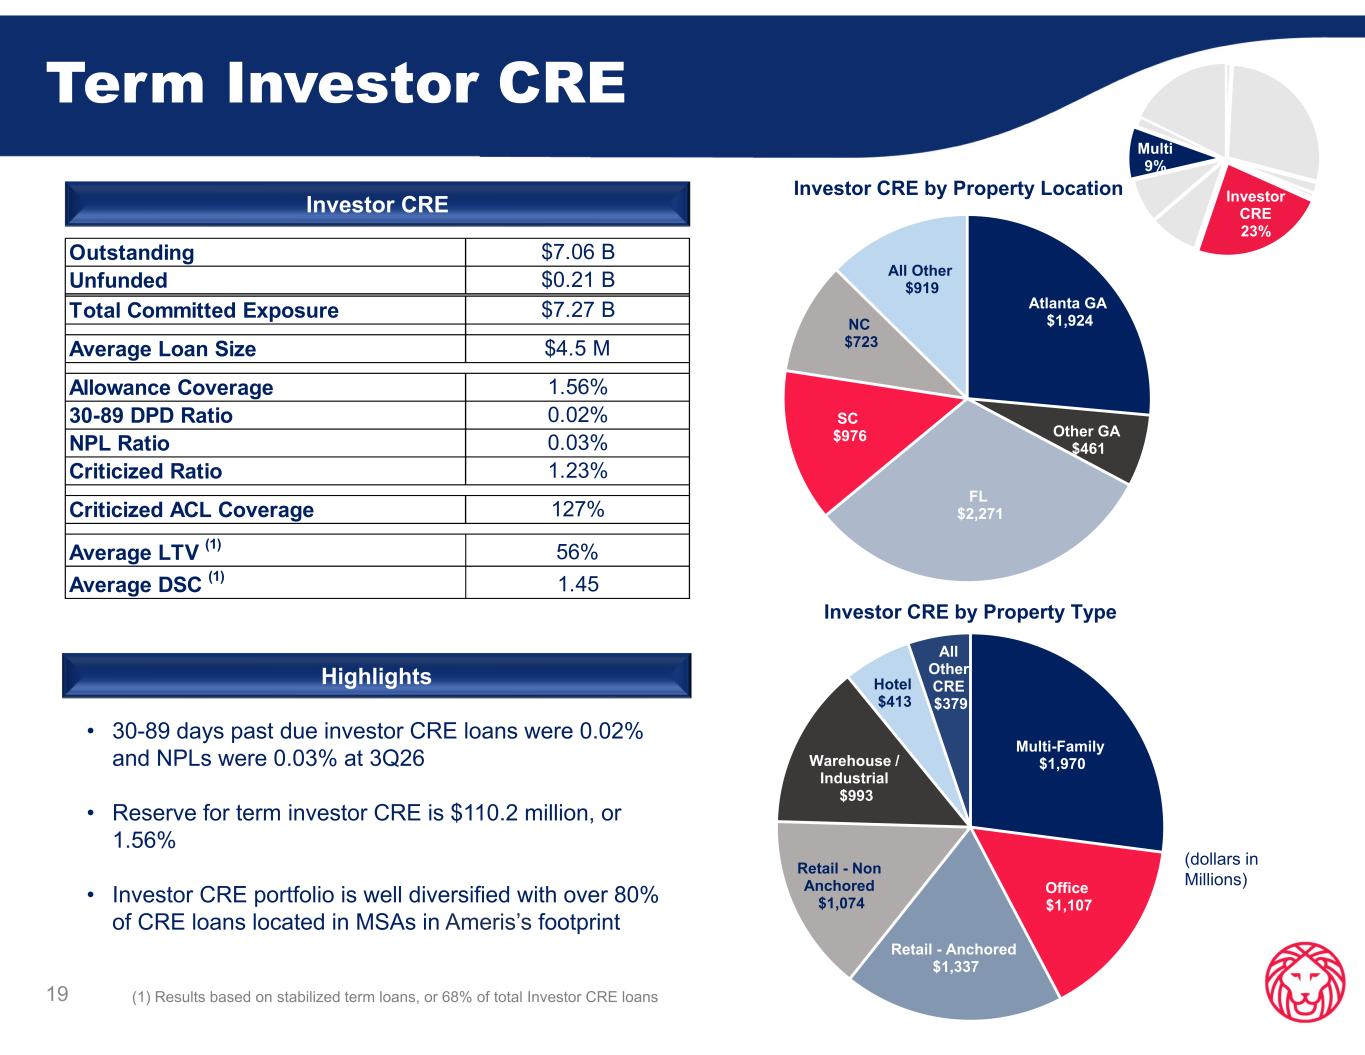
Term Investor CRE • 30-89 days past due investor CRE loans were 0.02% and NPLs were 0.03% at 3Q26 • Reserve for term investor CRE is $110.2 million, or 1.56% • Investor CRE portfolio is well diversified with over 80% of CRE loans located in MSAs in Ameris’s footprint 19 Highlights (1) Results based on stabilized term loans, or 68% of total Investor CRE loans Investor CRE (dollars in Millions) Investor CRE 23% Multi 9% Outstanding $7.06 B Unfunded $0.21 B Total Committed Exposure $7.27 B Average Loan Size $4.5 M Allowance Coverage 1.56% 30-89 DPD Ratio 0.02% NPL Ratio 0.03% Criticized Ratio 1.23% Criticized ACL Coverage 127% Average LTV (1) 56% Average DSC (1) 1.45 Multi-Family $1,970 Office $1,107 Retail - Anchored $1,337 Retail - Non Anchored $1,074 Warehouse / Industrial $993 Hotel $413 All Other CRE $379 Investor CRE by Property Type Atlanta GA $1,924 Other GA $461 FL $2,271 SC $976 NC $723 All Other $919 Investor CRE by Property Location
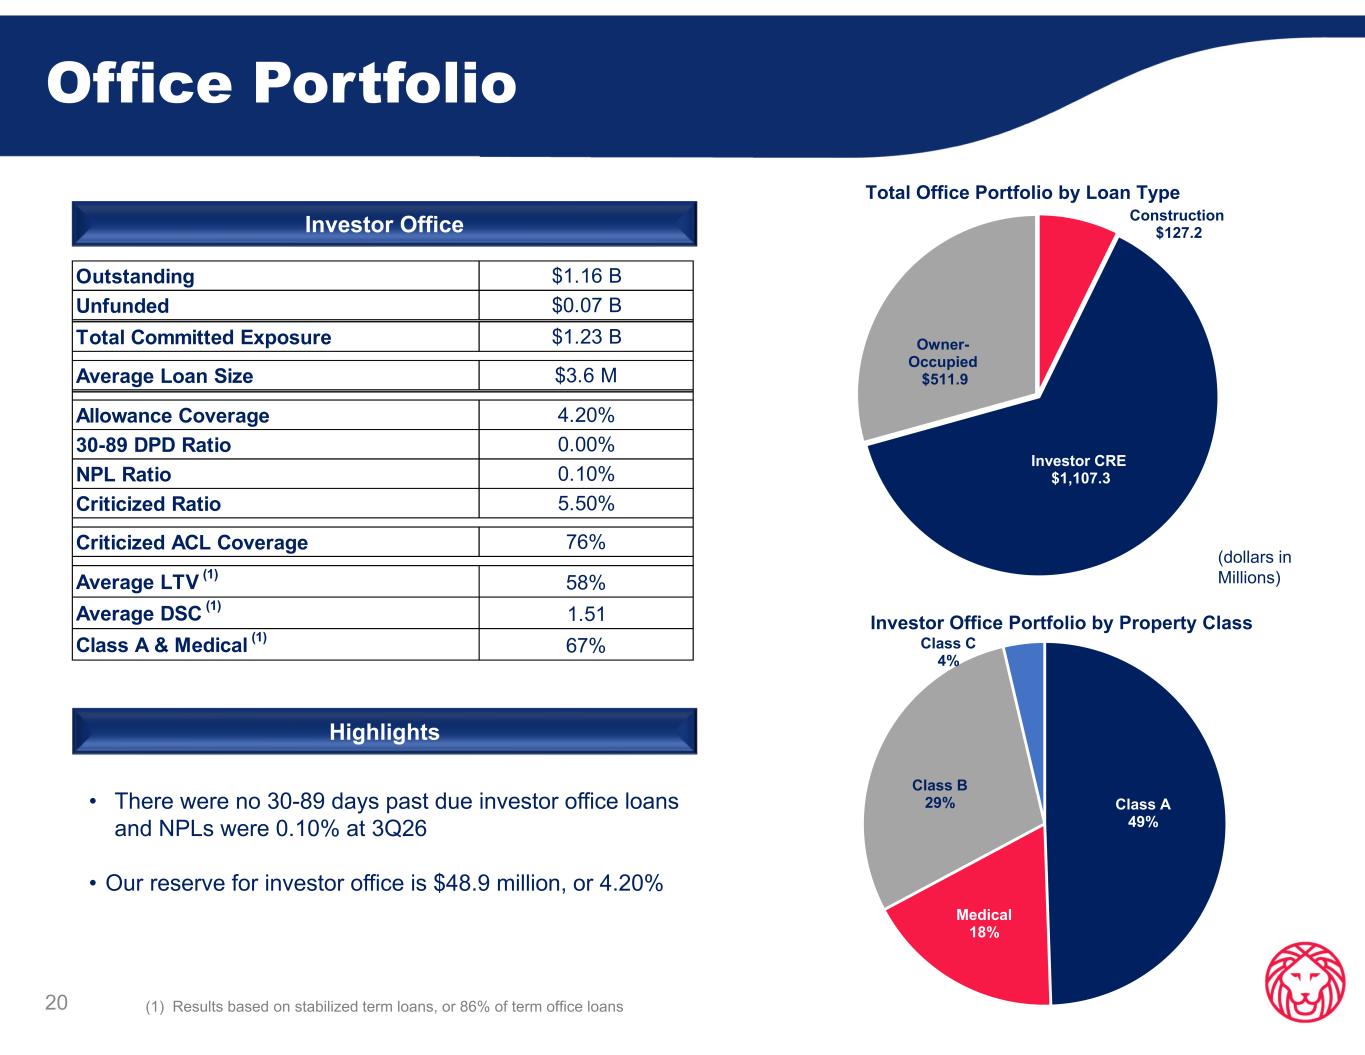
Office Portfolio • There were no 30-89 days past due investor office loans and NPLs were 0.10% at 3Q26 • Our reserve for investor office is $48.9 million, or 4.20% 20 Highlights (1) Results based on stabilized term loans, or 86% of term office loans Investor Office (dollars in Millions) Outstanding $1.16 B Unfunded $0.07 B Total Committed Exposure $1.23 B Average Loan Size $3.6 M Allowance Coverage 4.20% 30-89 DPD Ratio 0.00% NPL Ratio 0.10% Criticized Ratio 5.50% Criticized ACL Coverage 76% Average LTV (1) 58% Average DSC (1) 1.51 Class A & Medical (1) 67% Construction $127.2 Investor CRE $1,107.3 Owner- Occupied $511.9 Total Office Portfolio by Loan Type Class A 49% Medical 18% Class B 29% Class C 4% Investor Office Portfolio by Property Class
Appendix
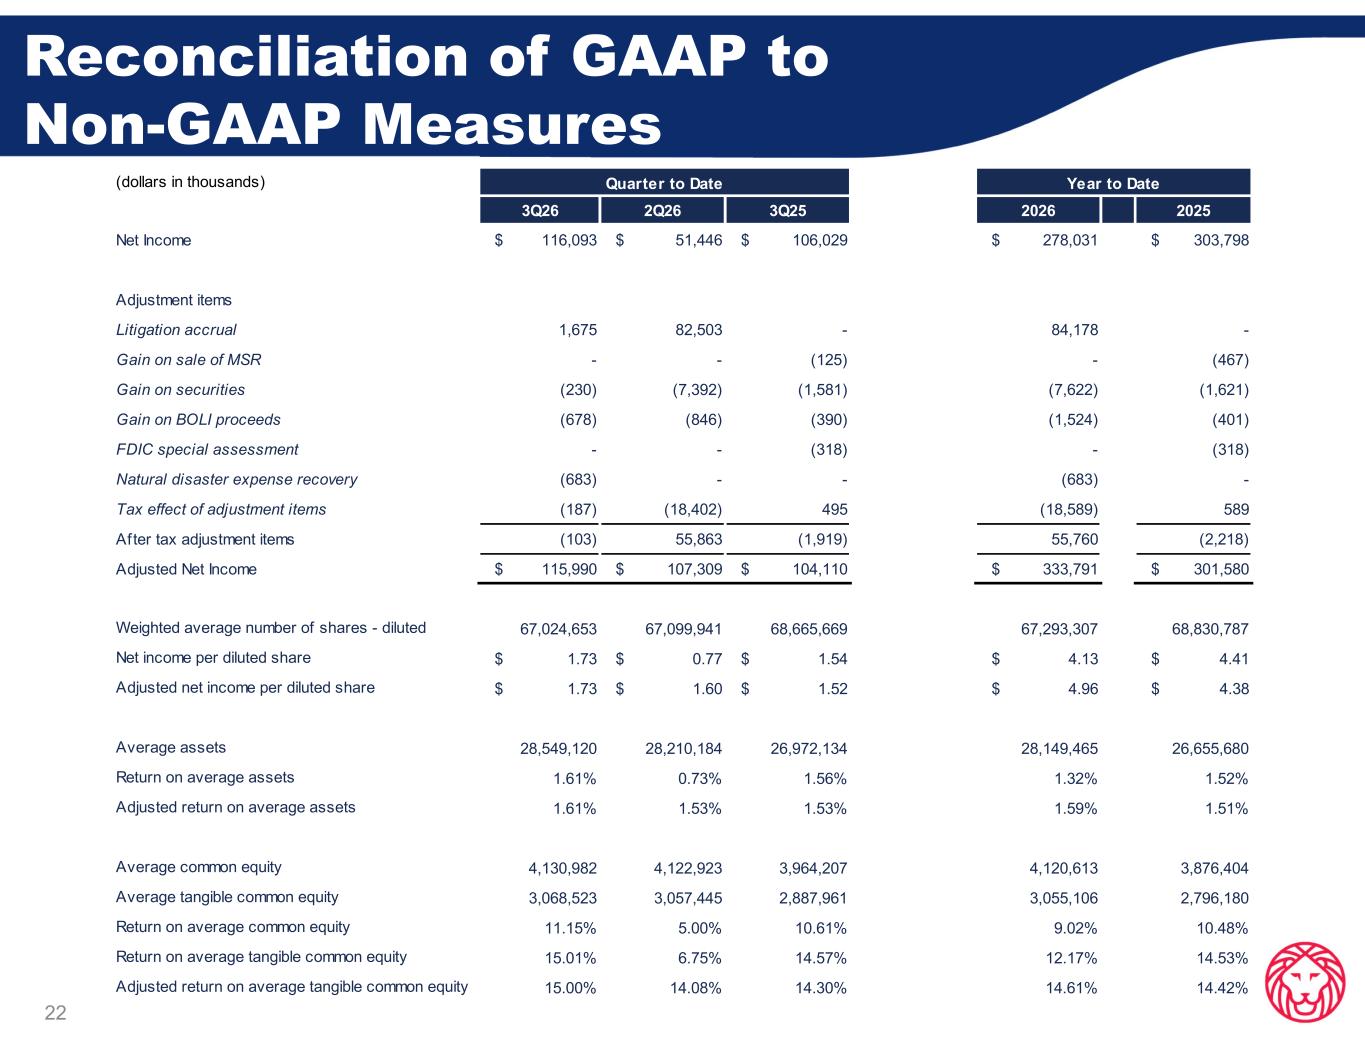
22 Reconciliation of GAAP to Non-GAAP Measures (dollars in thousands) 3Q26 2Q26 3Q25 2026 2025 Net Income $ 116,093 $ 51,446 $ 106,029 $ 278,031 $ 303,798 Adjustment items Litigation accrual 1,675 82,503 - 84,178 - Gain on sale of MSR - - (125) - (467) Gain on securities (230) (7,392) (1,581) (7,622) (1,621) Gain on BOLI proceeds (678) (846) (390) (1,524) (401) FDIC special assessment - - (318) - (318) Natural disaster expense recovery (683) - - (683) - Tax effect of adjustment items (187) (18,402) 495 (18,589) 589 After tax adjustment items (103) 55,863 (1,919) 55,760 (2,218) Adjusted Net Income $ 115,990 $ 107,309 $ 104,110 $ 333,791 $ 301,580 Weighted average number of shares - diluted 67,024,653 67,099,941 68,665,669 67,293,307 68,830,787 Net income per diluted share $ 1.73 $ 0.77 $ 1.54 $ 4.13 $ 4.41 Adjusted net income per diluted share $ 1.73 $ 1.60 $ 1.52 $ 4.96 $ 4.38 Average assets 28,549,120 28,210,184 26,972,134 28,149,465 26,655,680 Return on average assets 1.61% 0.73% 1.56% 1.32% 1.52% Adjusted return on average assets 1.61% 1.53% 1.53% 1.59% 1.51% Average common equity 4,130,982 4,122,923 3,964,207 4,120,613 3,876,404 Average tangible common equity 3,068,523 3,057,445 2,887,961 3,055,106 2,796,180 Return on average common equity 11.15% 5.00% 10.61% 9.02% 10.48% Return on average tangible common equity 15.01% 6.75% 14.57% 12.17% 14.53% Adjusted return on average tangible common equity 15.00% 14.08% 14.30% 14.61% 14.42% Quarter to Date Year to Date
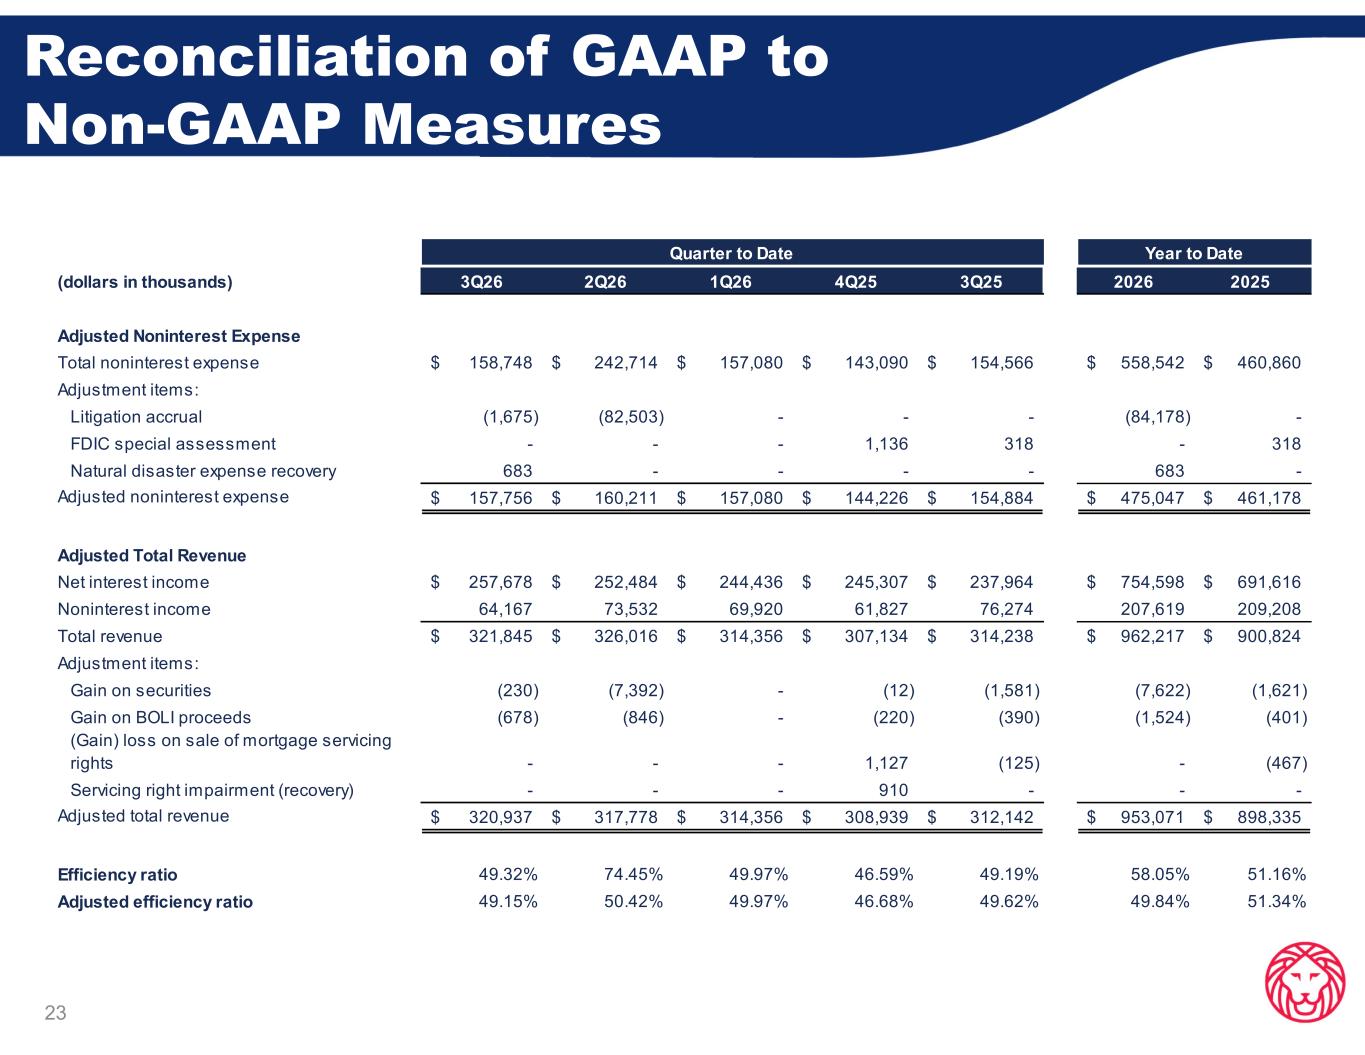
23 Reconciliation of GAAP to Non-GAAP Measures (dollars in thousands) 3Q26 2Q26 1Q26 4Q25 3Q25 2026 2025 Adjusted Noninterest Expense Total noninterest expense 158,748$ 242,714$ 157,080$ 143,090$ 154,566$ 558,542$ 460,860$ Adjustment items: Litigation accrual (1,675) (82,503) - - - (84,178) - FDIC special assessment - - - 1,136 318 - 318 Natural disaster expense recovery 683 - - - - 683 - Adjusted noninterest expense 157,756$ 160,211$ 157,080$ 144,226$ 154,884$ 475,047$ 461,178$ Adjusted Total Revenue Net interest income 257,678$ 252,484$ 244,436$ 245,307$ 237,964$ 754,598$ 691,616$ Noninterest income 64,167 73,532 69,920 61,827 76,274 207,619 209,208 Total revenue 321,845$ 326,016$ 314,356$ 307,134$ 314,238$ 962,217$ 900,824$ Adjustment items: Gain on securities (230) (7,392) - (12) (1,581) (7,622) (1,621) Gain on BOLI proceeds (678) (846) - (220) (390) (1,524) (401) (Gain) loss on sale of mortgage servicing rights - - - 1,127 (125) - (467) Servicing right impairment (recovery) - - - 910 - - - Adjusted total revenue 320,937$ 317,778$ 314,356$ 308,939$ 312,142$ 953,071$ 898,335$ Efficiency ratio 49.32% 74.45% 49.97% 46.59% 49.19% 58.05% 51.16% Adjusted efficiency ratio 49.15% 50.42% 49.97% 46.68% 49.62% 49.84% 51.34% Year to DateQuarter to Date
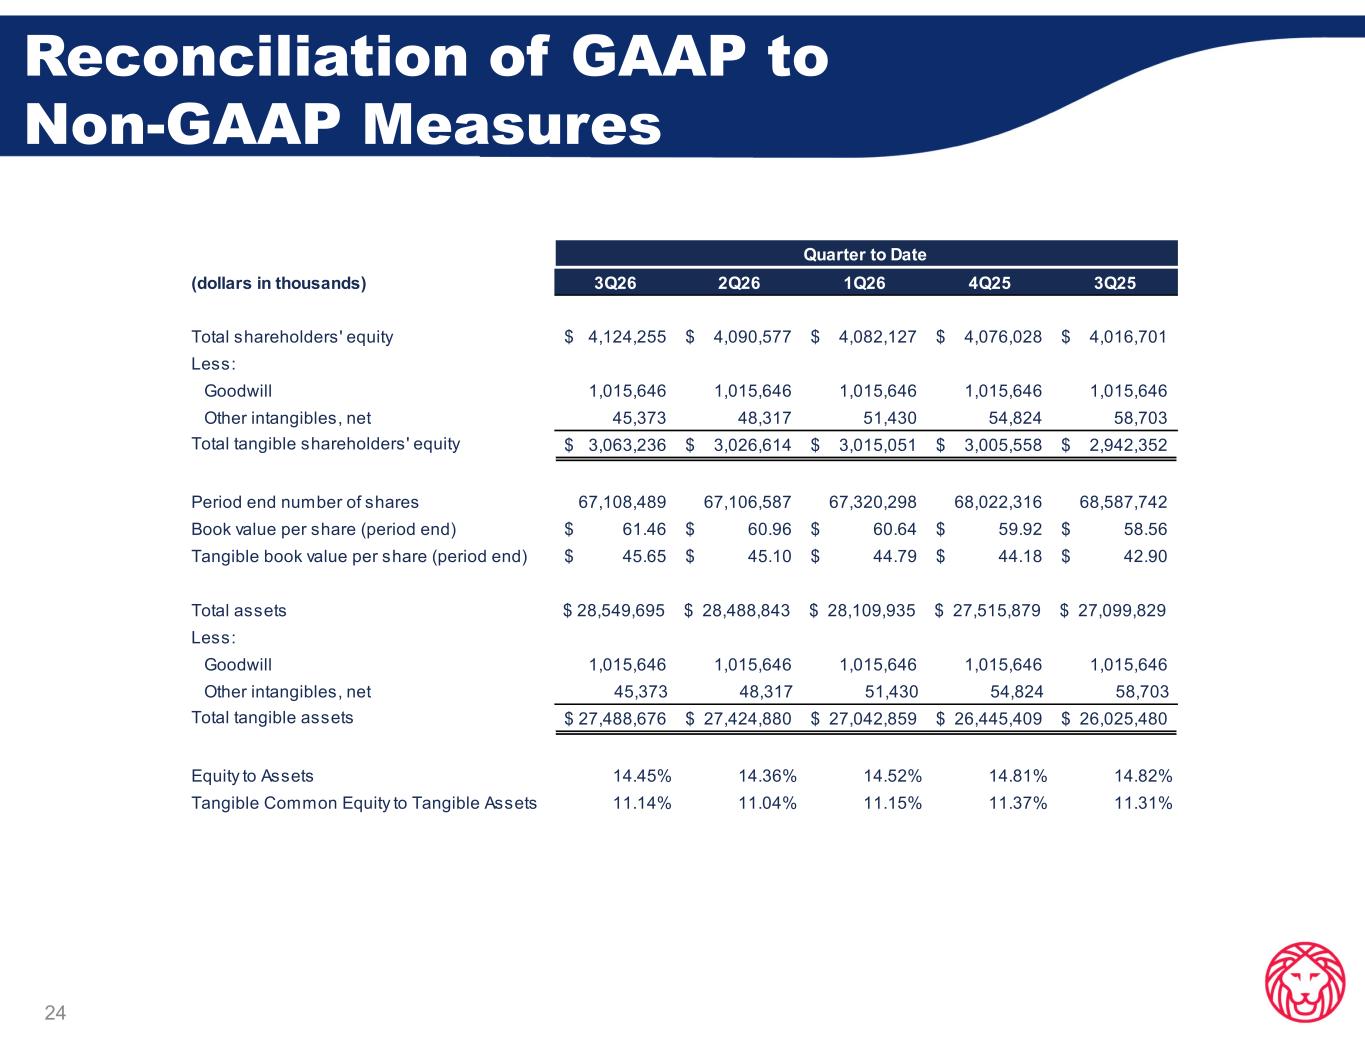
24 Reconciliation of GAAP to Non-GAAP Measures (dollars in thousands) 3Q26 2Q26 1Q26 4Q25 3Q25 Total shareholders' equity 4,124,255$ 4,090,577$ 4,082,127$ 4,076,028$ 4,016,701$ Less: Goodwill 1,015,646 1,015,646 1,015,646 1,015,646 1,015,646 Other intangibles, net 45,373 48,317 51,430 54,824 58,703 Total tangible shareholders' equity 3,063,236$ 3,026,614$ 3,015,051$ 3,005,558$ 2,942,352$ Period end number of shares 67,108,489 67,106,587 67,320,298 68,022,316 68,587,742 Book value per share (period end) 61.46$ 60.96$ 60.64$ 59.92$ 58.56$ Tangible book value per share (period end) 45.65$ 45.10$ 44.79$ 44.18$ 42.90$ Total assets $ 28,549,695 $ 28,488,843 $ 28,109,935 $ 27,515,879 $ 27,099,829 Less: Goodwill 1,015,646 1,015,646 1,015,646 1,015,646 1,015,646 Other intangibles, net 45,373 48,317 51,430 54,824 58,703 Total tangible assets 27,488,676$ 27,424,880$ 27,042,859$ 26,445,409$ 26,025,480$ Equity to Assets 14.45% 14.36% 14.52% 14.81% 14.82% Tangible Common Equity to Tangible Assets 11.14% 11.04% 11.15% 11.37% 11.31% Quarter to Date
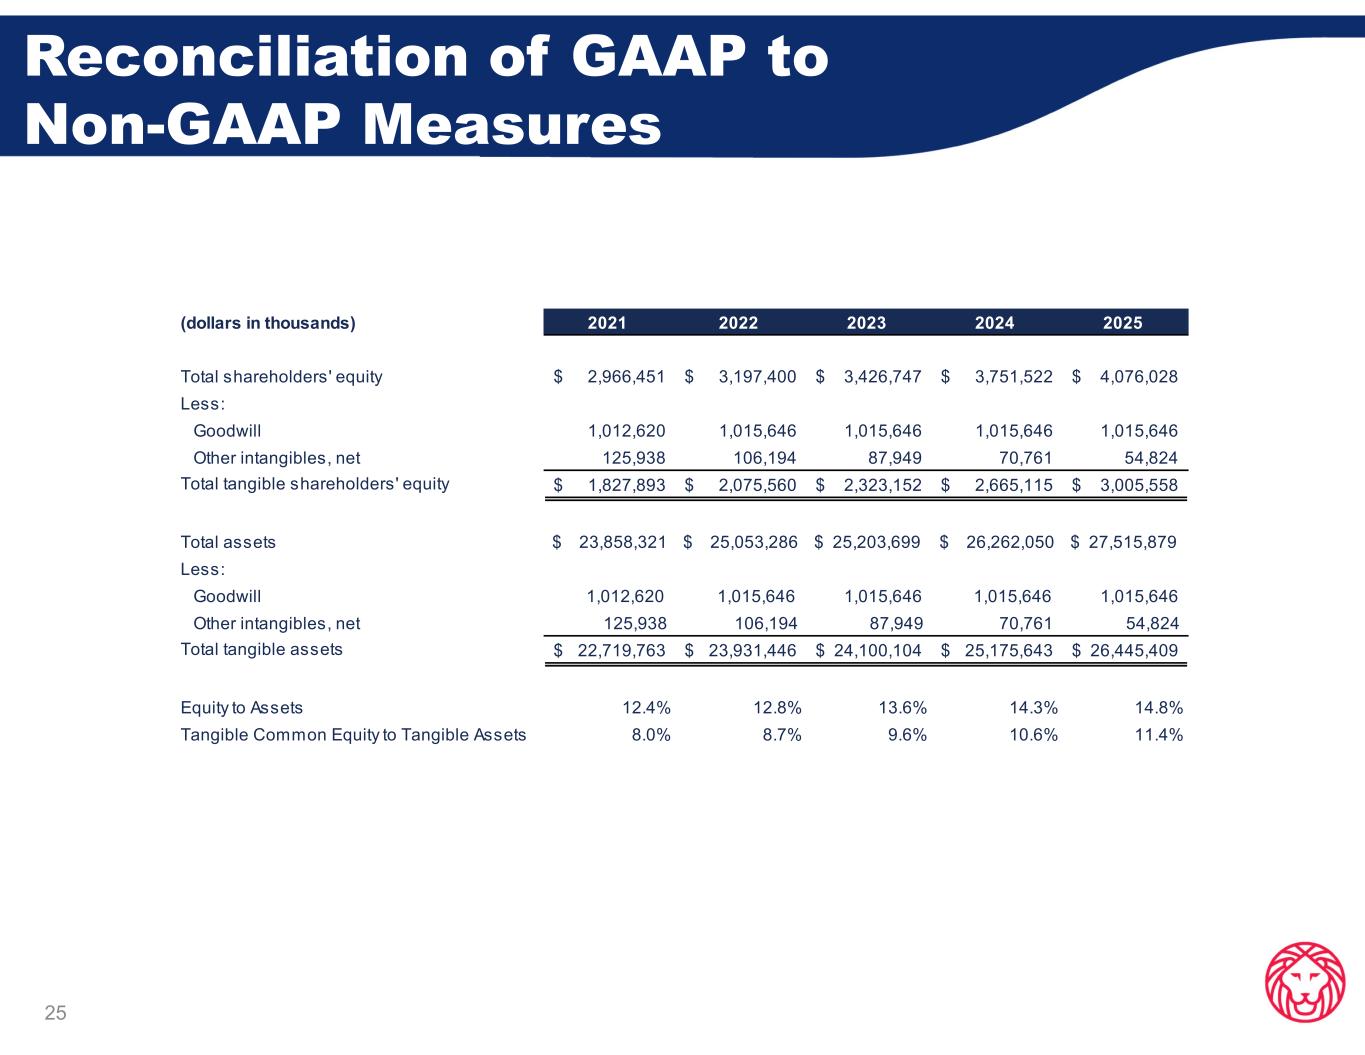
25 Reconciliation of GAAP to Non-GAAP Measures (dollars in thousands) 2021 2022 2023 2024 2025 Total shareholders' equity 2,966,451$ 3,197,400$ 3,426,747$ 3,751,522$ 4,076,028$ Less: Goodwill 1,012,620 1,015,646 1,015,646 1,015,646 1,015,646 Other intangibles, net 125,938 106,194 87,949 70,761 54,824 Total tangible shareholders' equity 1,827,893$ 2,075,560$ 2,323,152$ 2,665,115$ 3,005,558$ Total assets $ 23,858,321 $ 25,053,286 $ 25,203,699 $ 26,262,050 $ 27,515,879 Less: Goodwill 1,012,620 1,015,646 1,015,646 1,015,646 1,015,646 Other intangibles, net 125,938 106,194 87,949 70,761 54,824 Total tangible assets 22,719,763$ 23,931,446$ 24,100,104$ 25,175,643$ 26,445,409$ Equity to Assets 12.4% 12.8% 13.6% 14.3% 14.8% Tangible Common Equity to Tangible Assets 8.0% 8.7% 9.6% 10.6% 11.4%
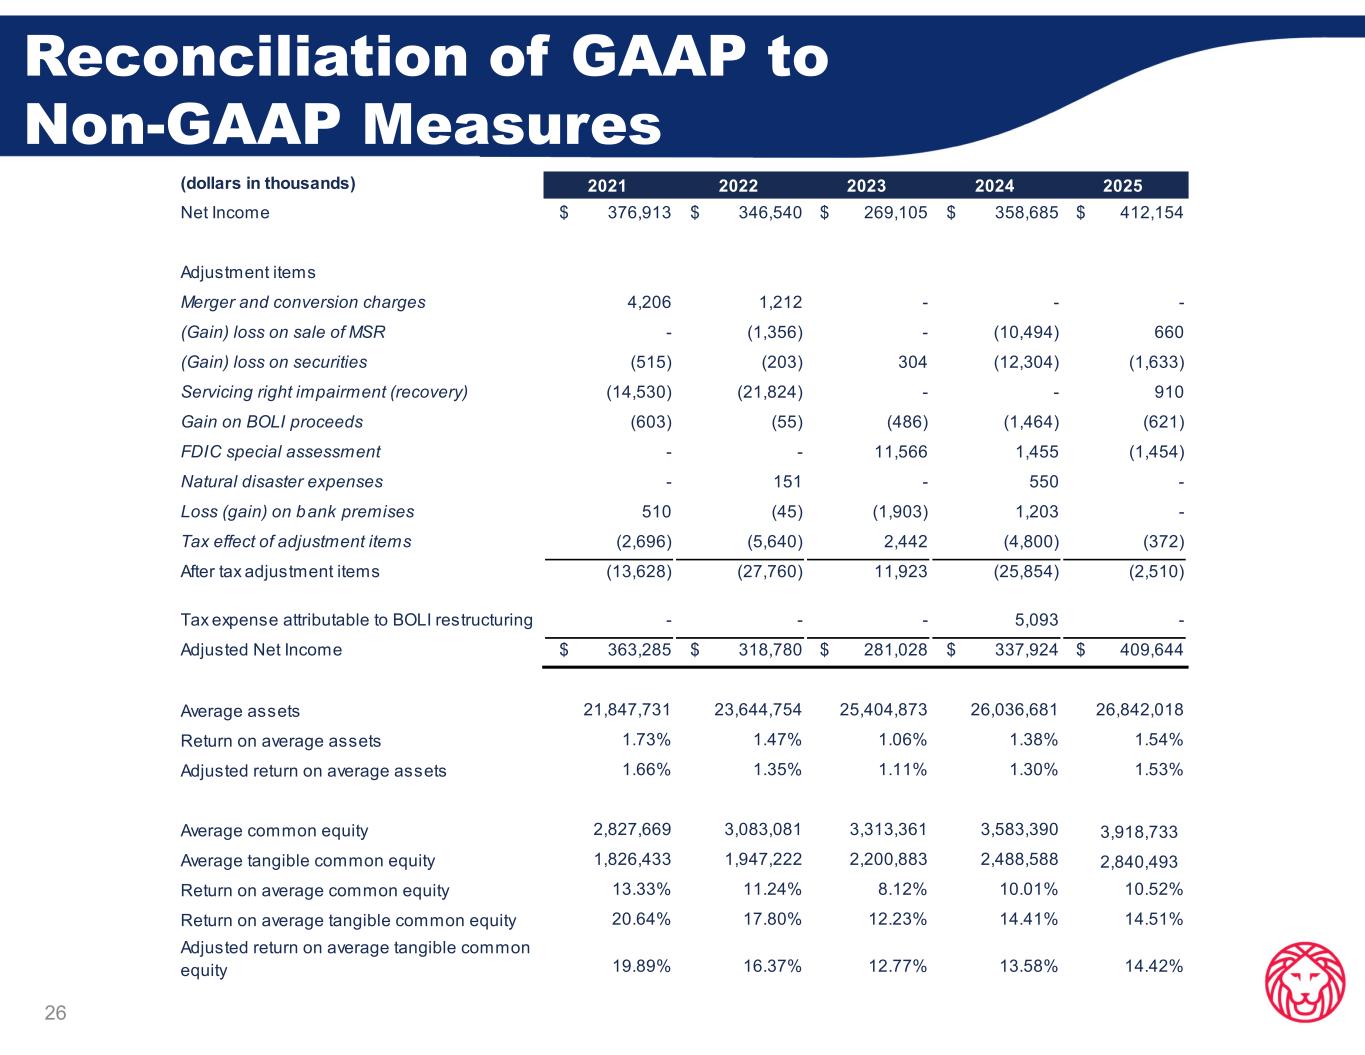
26 Reconciliation of GAAP to Non-GAAP Measures (dollars in thousands) 2021 2022 2023 2024 2025 Net Income $ 376,913 $ 346,540 $ 269,105 $ 358,685 $ 412,154 Adjustment items Merger and conversion charges 4,206 1,212 - - - (Gain) loss on sale of MSR - (1,356) - (10,494) 660 (Gain) loss on securities (515) (203) 304 (12,304) (1,633) Servicing right impairment (recovery) (14,530) (21,824) - - 910 Gain on BOLI proceeds (603) (55) (486) (1,464) (621) FDIC special assessment - - 11,566 1,455 (1,454) Natural disaster expenses - 151 - 550 - Loss (gain) on bank premises 510 (45) (1,903) 1,203 - Tax effect of adjustment items (2,696) (5,640) 2,442 (4,800) (372) After tax adjustment items (13,628) (27,760) 11,923 (25,854) (2,510) Tax expense attributable to BOLI restructuring - - - 5,093 - Adjusted Net Income $ 363,285 $ 318,780 $ 281,028 $ 337,924 $ 409,644 Average assets 21,847,731 23,644,754 25,404,873 26,036,681 26,842,018 Return on average assets 1.73% 1.47% 1.06% 1.38% 1.54% Adjusted return on average assets 1.66% 1.35% 1.11% 1.30% 1.53% Average common equity 2,827,669 3,083,081 3,313,361 3,583,390 3,918,733 Average tangible common equity 1,826,433 1,947,222 2,200,883 2,488,588 2,840,493 Return on average common equity 13.33% 11.24% 8.12% 10.01% 10.52% Return on average tangible common equity 20.64% 17.80% 12.23% 14.41% 14.51% Adjusted return on average tangible common equity 19.89% 16.37% 12.77% 13.58% 14.42%
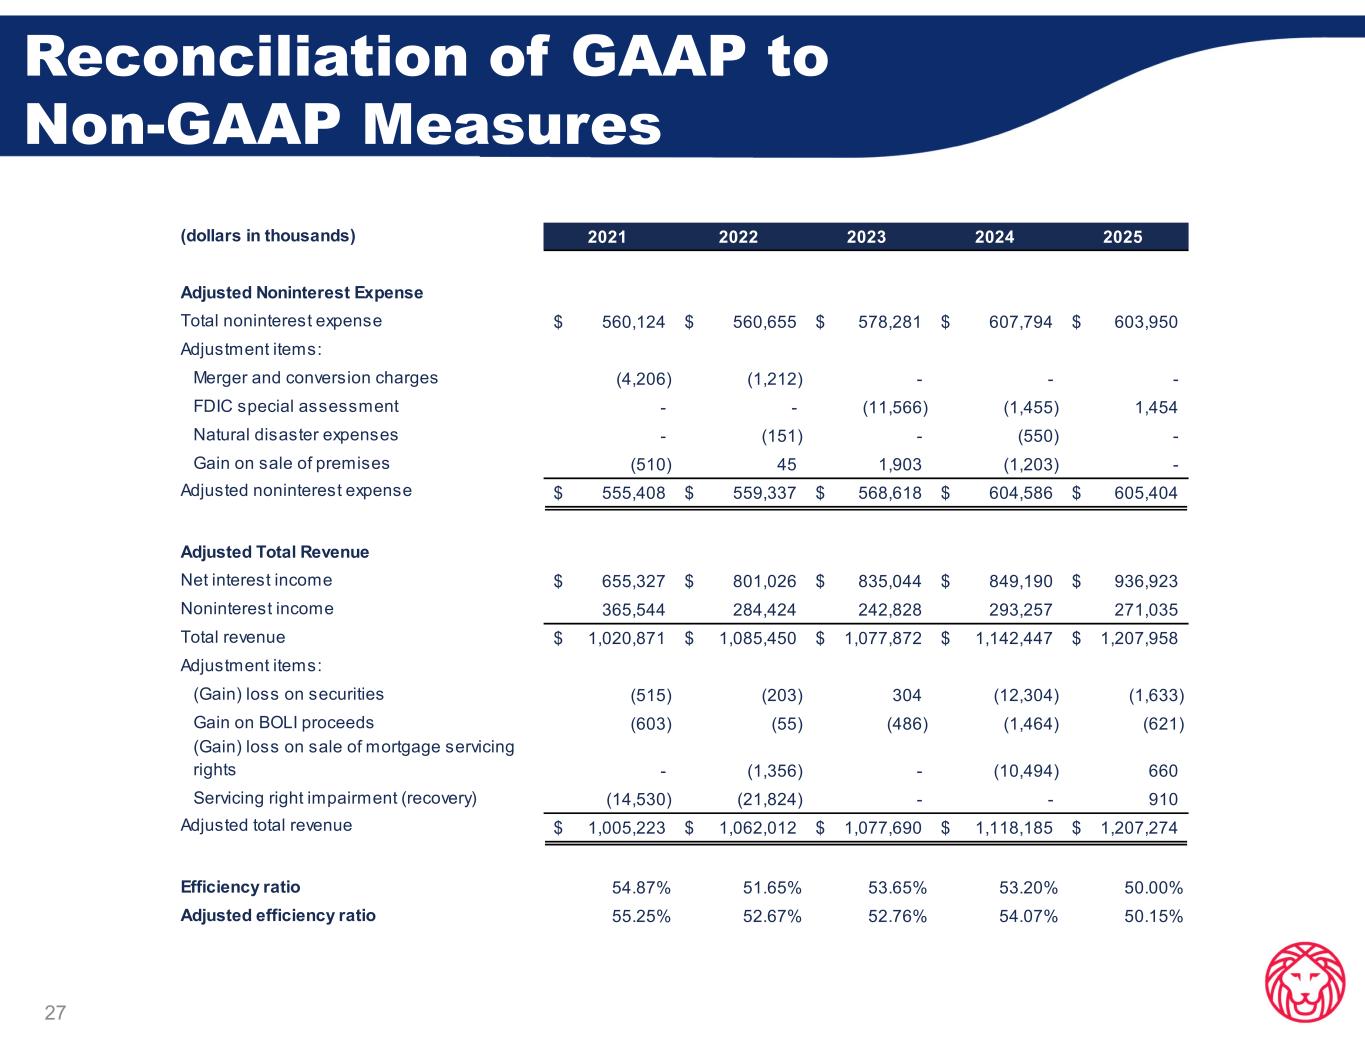
27 Reconciliation of GAAP to Non-GAAP Measures (dollars in thousands) 2021 2022 2023 2024 2025 Adjusted Noninterest Expense Total noninterest expense 560,124$ 560,655$ 578,281$ 607,794$ 603,950$ Adjustment items: Merger and conversion charges (4,206) (1,212) - - - FDIC special assessment - - (11,566) (1,455) 1,454 Natural disaster expenses - (151) - (550) - Gain on sale of premises (510) 45 1,903 (1,203) - Adjusted noninterest expense 555,408$ 559,337$ 568,618$ 604,586$ 605,404$ Adjusted Total Revenue Net interest income 655,327$ 801,026$ 835,044$ 849,190$ 936,923$ Noninterest income 365,544 284,424 242,828 293,257 271,035 Total revenue 1,020,871$ 1,085,450$ 1,077,872$ 1,142,447$ 1,207,958$ Adjustment items: (Gain) loss on securities (515) (203) 304 (12,304) (1,633) Gain on BOLI proceeds (603) (55) (486) (1,464) (621) (Gain) loss on sale of mortgage servicing rights - (1,356) - (10,494) 660 Servicing right impairment (recovery) (14,530) (21,824) - - 910 Adjusted total revenue 1,005,223$ 1,062,012$ 1,077,690$ 1,118,185$ 1,207,274$ Efficiency ratio 54.87% 51.65% 53.65% 53.20% 50.00% Adjusted efficiency ratio 55.25% 52.67% 52.76% 54.07% 50.15%
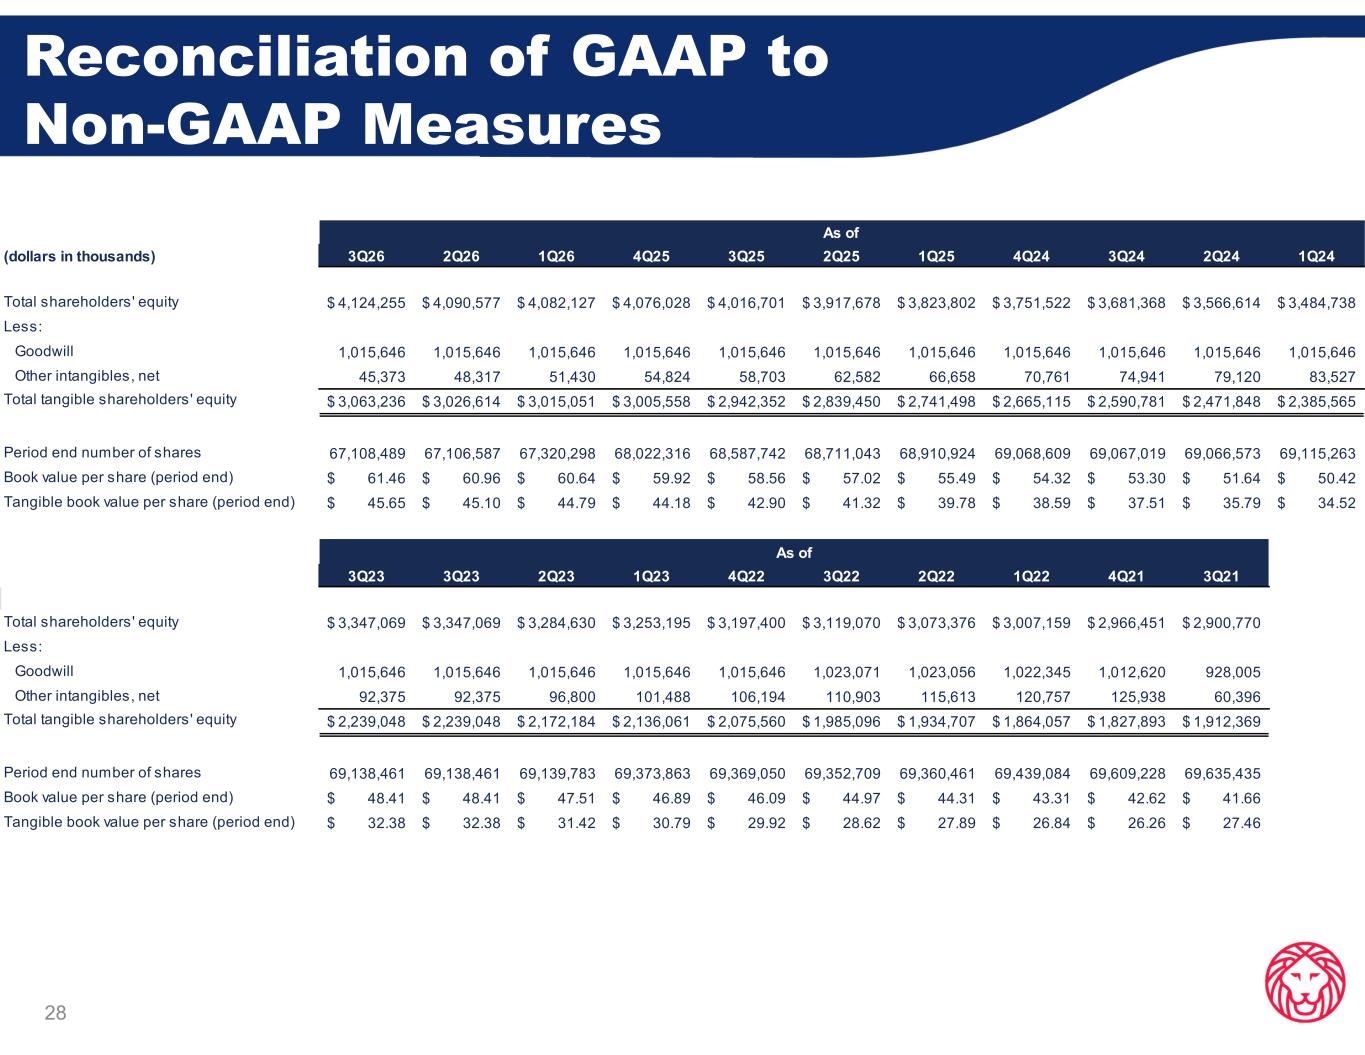
28 Reconciliation of GAAP to Non-GAAP Measures (dollars in thousands) 3Q26 2Q26 1Q26 4Q25 3Q25 2Q25 1Q25 4Q24 3Q24 2Q24 1Q24 Total shareholders' equity 4,124,255$ 4,090,577$ 4,082,127$ 4,076,028$ 4,016,701$ 3,917,678$ 3,823,802$ 3,751,522$ 3,681,368$ 3,566,614$ 3,484,738$ Less: Goodwill 1,015,646 1,015,646 1,015,646 1,015,646 1,015,646 1,015,646 1,015,646 1,015,646 1,015,646 1,015,646 1,015,646 Other intangibles, net 45,373 48,317 51,430 54,824 58,703 62,582 66,658 70,761 74,941 79,120 83,527 Total tangible shareholders' equity 3,063,236$ 3,026,614$ 3,015,051$ 3,005,558$ 2,942,352$ 2,839,450$ 2,741,498$ 2,665,115$ 2,590,781$ 2,471,848$ 2,385,565$ Period end number of shares 67,108,489 67,106,587 67,320,298 68,022,316 68,587,742 68,711,043 68,910,924 69,068,609 69,067,019 69,066,573 69,115,263 Book value per share (period end) 61.46$ 60.96$ 60.64$ 59.92$ 58.56$ 57.02$ 55.49$ 54.32$ 53.30$ 51.64$ 50.42$ Tangible book value per share (period end) 45.65$ 45.10$ 44.79$ 44.18$ 42.90$ 41.32$ 39.78$ 38.59$ 37.51$ 35.79$ 34.52$ 3Q23 3Q23 2Q23 1Q23 4Q22 3Q22 2Q22 1Q22 4Q21 3Q21 Total shareholders' equity 3,347,069$ 3,347,069$ 3,284,630$ 3,253,195$ 3,197,400$ 3,119,070$ 3,073,376$ 3,007,159$ 2,966,451$ 2,900,770$ Less: Goodwill 1,015,646 1,015,646 1,015,646 1,015,646 1,015,646 1,023,071 1,023,056 1,022,345 1,012,620 928,005 Other intangibles, net 92,375 92,375 96,800 101,488 106,194 110,903 115,613 120,757 125,938 60,396 Total tangible shareholders' equity 2,239,048$ 2,239,048$ 2,172,184$ 2,136,061$ 2,075,560$ 1,985,096$ 1,934,707$ 1,864,057$ 1,827,893$ 1,912,369$ Period end number of shares 69,138,461 69,138,461 69,139,783 69,373,863 69,369,050 69,352,709 69,360,461 69,439,084 69,609,228 69,635,435 Book value per share (period end) 48.41$ 48.41$ 47.51$ 46.89$ 46.09$ 44.97$ 44.31$ 43.31$ 42.62$ 41.66$ Tangible book value per share (period end) 32.38$ 32.38$ 31.42$ 30.79$ 29.92$ 28.62$ 27.89$ 26.84$ 26.26$ 27.46$ As of As of